Tipping Points in Opinion Dynamics: A Universal Formula in Five Dimensions
 Serge Galam
 Taksu Cheon
- 1CEVIPOF - Centre for Political Research, Sciences Po and CNRS, Paris, France
- 2Laboratory of Physics, Kochi University of Technology, Kochi, Japan
A universal formula is shown to predict the dynamics of public opinion including eventual sudden and unexpected outbreaks of minority opinions within a generic parameter space of five dimensions. The formula is obtained by combining and extending several components of the Galam model of opinion dynamics, otherwise treated separately, into one single update equation, which then deploys in a social space of five dimensions. Four dimensions account for a rich diversity of individual traits within a heterogeneous population, including differentiated stubbornness, contrarianism, and embedded prejudices. The fifth dimension is the size of the update groups being discussed. Having one single formula allows one to explore the complete geometry of the underlying landscape of opinion dynamics. Attractors and tipping points, which shape the topology of the different possible dynamics flows, are unveiled. Driven by repeated discussion among small groups of people during a social or political public campaign, the phenomenon of minority spreading and parallel majority collapse are thus revealed ahead of their occurrence. Accordingly, within the opinion landscape, unexpected and sudden events such as Brexit and Trump victories become visible within a forecast time horizon, making them predictable. Despite the accidental nature of the landscape, evaluating the parameter values for a specific case allows one to single out which basin of attraction is going to drive the associate dynamics, and thus, a prediction of the outcome becomes feasible. The model may apply to a large spectrum of social situations including voting outcomes, market shares, and societal trends, allowing us to envision novel winning strategies in competing environments.
Introduction
Majoritarian social decisions have been traditionally justified by Condorcet’s jury theorem which states that, in majoritarian group decisions, the errors in individual judgment are canceled out to arbitrary accuracy as the number of voters increases. This implies the stable dominance of rational majority in democratic decision-making. In reality, however, democratic majoritarianism can produce seemingly unexpected sudden shifts, as exemplified by political events such as the 2016 Brexit victory and Trump election. There is also a glaring contradiction in democracy in which there exist powerful interest groups that exert disproportionate power despite their minority status.
Such unexpected and paradoxical outcomes of opinion dynamics are challenging puzzles, which are yet to be elucidated. In particular, with public opinion being nowadays a major key to trigger eventual changes in modern societies as well as collapses of political regimes, the understanding of the mechanisms behind the making of public opinion becomes a major issue of vital interest.
It happened that from the beginning of sociophysics [1], the study of opinion dynamics has been a main topic of research, which has shed new and disruptive light about these paradoxical features resulting from majority group decision [2–6]. A great deal of models have been, and are yet to be, proposed to describe opinion dynamics in social systems [7–12]. Most of them consider homogeneous populations with a local update rule and discrete variables. A series of these models were shown to be included within a single unifying frame [13]. Continuous variables have also been used [14, 15]. Yet, despite ongoing active research [16–21] up-to-date, the opinion dynamics issue is still lacking a comprehensive and robust framework, especially a reliable predictive tool.
Among those models stands the seminal Galam model [22–26], which combines local majority rule updates with local symmetry breaking driven by unconscious prejudices and cognitive biases in case of an even-size group at a tie. The model has revealed some heuristic capacity with the successful predictions of a few political events such as 2016 Brexit victory [24, 27], Trump election [28], and 2005 French rejection of the European constitution project [29]. It has been subsequently extended to incorporate heterogeneous populations with three different psychological traits, which are heterogeneous prejudices, inflexibility or stubbornness [30–37], and contrarianism [38–41]. However, only specific combinations of these traits have been investigated [42–44]. An additional limitation has been the restriction of update groups to sizes 2, 3, and 4.
In this work, by investigating further the Galam model in a generic parameter space of five dimensions, we obtain a single universal update equation to follow the temporal evolution of opinion distribution among a heterogeneous population with any combination of rational, stubborn, and contrarian agents for any average of hidden prejudices and for an arbitrary size of groups being discussed.
The update equation allows one to explore the complete geometry of the underlying landscape. In particular, attractors and tipping points which shape the faith of possible dynamics flows are unveiled. The underlying dynamics path of public opinion driven by repeated discussion among small groups of people during a social or political public campaign becomes predictable. Future occurrence of sudden minority spreading and parallel majority collapse ahead of their actual occurrence is revealed as shown with 2016 Brexit and Trump victories. They became visible within a forecast time horizon and in turn predictable.
In addition, having the full five-dimensional landscape makes predictions more feasible and robust because, then, the precise evaluation of the parameter values is not required. Instead, what matters is identifying the relevant basin of attraction where the dynamics will take place. However, along the basin boundaries, more-precise estimates of the parameters are necessary.
Having a universal formula which accounts for generic psychological features makes the model applicable to a large spectrum of social situations including voting outcomes, market shares, and societal trends. The results also allow us to envision novel winning strategies in competing environments to win a public debate or a market share.
The rest of the article is organized as follows. In Section 2, we outline the derivation of the universal formula aggregating the various components of the Galam model. A few illustrations of sudden and unexpected minority outbreaks yielded by the equation are exhibited in Section 3. Section 4 contains some explicit expressions for the evolution equation for (some) few specific values of the group size r. We analyze the mathematical structure of the universal update equation through the identification of its fixed points in Section 5. Section 6 explores some aspects of the five-dimensional parameter space of the model pointing out the existence of critical points. The results are illustrated with several numerical examples. Concluding remarks are presented in the last section.
The Universal Formula in Five-Dimensional Parameter Space
We consider a population with N agents, each capable of taking two states 1 and 0, respectively, representing two exclusive opinions A and B. At a given time t, the corresponding proportions of agents holding A and B are denoted as
To account for this complicated and unknown process, we use the Galam dynamical model, which monitors the opinion dynamics by a sequential iterated scheme. To implement one scheme, agents are first randomly distributed within small groups of size r. Then, within each group, a majority rule is applied to update local agent opinions. Each agent has one vote to determine the actual local majority. However, to account for the heterogeneity of psychological traits among agents, not all of them obey the majority rule by shifting the opinion if holding the local minority choice. Three types of agents, floaters, inflexibles, and contrarians, are considered. After local updates are performed, all groups are dismantled and agents are reshuffled, thus erasing the local correlations which were created by applying the local majority rules.
• The floaters vote to determine the local majority and, afterward, the ones holding the minority opinion shift to adopt the majority opinion. However, in case of a tie in a local even-size group, floaters adopt the choice in tune with the leading prejudice among the group members [3]. This prejudice-driven tie breaking is activated unconsciously by the agents. Accordingly, at a tie, opinion A is chosen with probability k and opinion B is chosen with probability
• The inflexibles also vote to determine the local majority, but contrary to the floaters, in case they hold the minority choice, they stick to it. They are stubborn and keep on with their own pre-decided choice whatever the local majority is. Accordingly, an A-inflexible stays in state 1 and a B-inflexible stays in 0. The same holds true at a tie. Their respective proportions denoted as a and b are external fixed parameters with the constraint
• The contrarians are floaters, who, once groups are dismantled, decide individually to shift the opinion to oppose the group majority they contributed to. The attitude is independent of the majority choice, either A or B. The proportion of contrarians among floaters is denoted as c satisfying
At time t, once a scheme is completed with
Let us now evaluate the function
However, since the contrarian phenomenon is mathematically identical to a random flipping of floaters with probability c among reshuffled agents, we can decouple the c effect from the local update writing as
which simplifies as
To evaluate
with
which allows factorization of the k dependence.
The quantity
Since
Similarly, the quantity
Since
With the use of the formulas
and
With the use of identities
and
we arrive at the compact expression of the evolution function
where
Note that the relation
This guarantees the covariance of
At this stage, to obtain the complete update equation, we use Eq. 3 as
which allows calculation of the opinion dynamics for any set of parameters
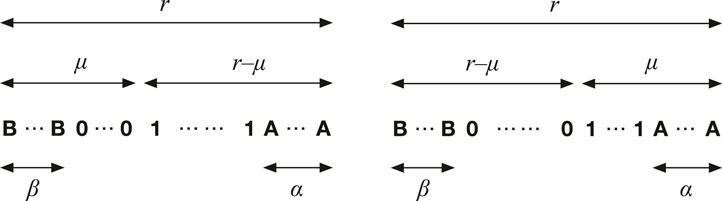
FIGURE 1. Diagrams representing a group of r agents made up of α A-inflexibles (shown as
We now go one step further to make our equation further realistic by considering a distribution of size with
In principle, Eq. 21 allows one to contribute to the issue of connecting the topology of a given network and the dynamics occurring through the network [45]. Indeed, the set of values of weights
A Few Illustrations of Sudden and Unexpected Minority Outbreaks
To make our universal update equation more concrete, we list explicit expressions for the series of values
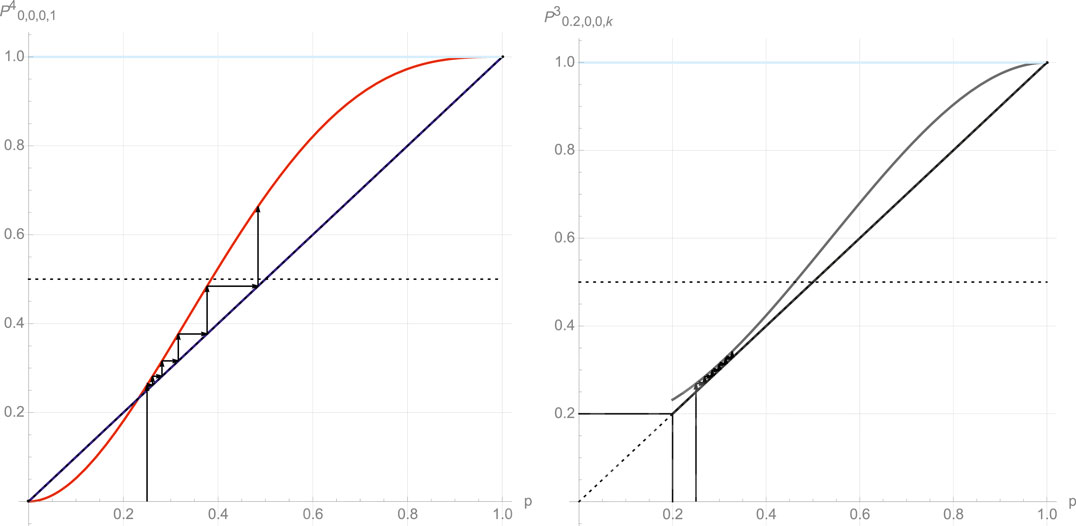
FIGURE 2. Left: evolution of the proportion of A support
While each effect was accounting for, alone, now the universal formula allows us to investigate the combination of both effects, either going along the same support for A (
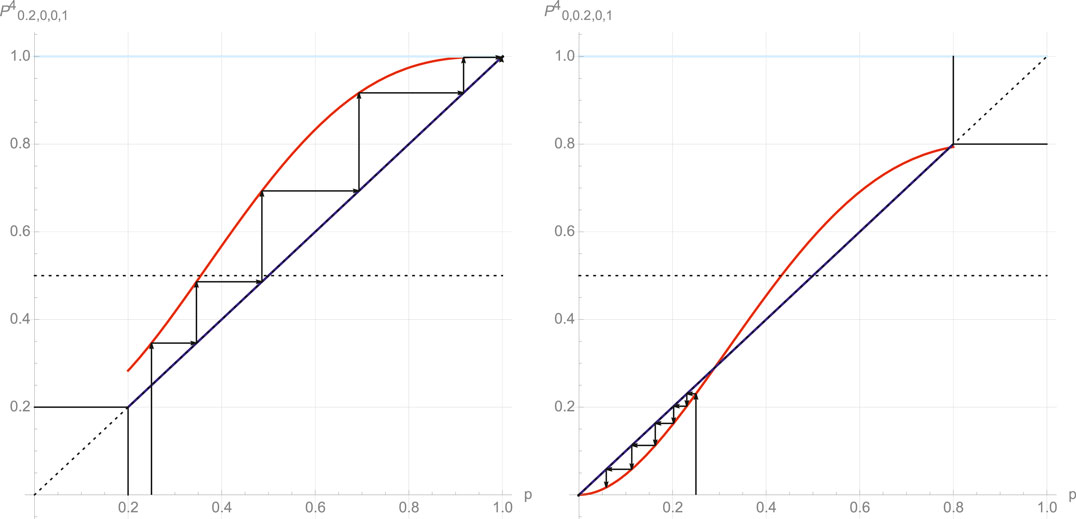
FIGURE 3. Left: evolution of the proportion of A support
We proceed to illustrating the capacity of the current update equation to yield sudden and unexpected minority outbreaks exhibiting a couple of striking cases with groups of sizes
In Figure 4, each graph shows two curves for the evolution of p, the proportion of the support for A, as a function of the number of updates with the same value of r. The two sets of parameter values are shown in each figure. Only very little differences differentiate the two sets of parameters, while the two associated curves exhibit drastic difference in their respective outcomes. The graph in the left is an example of the case
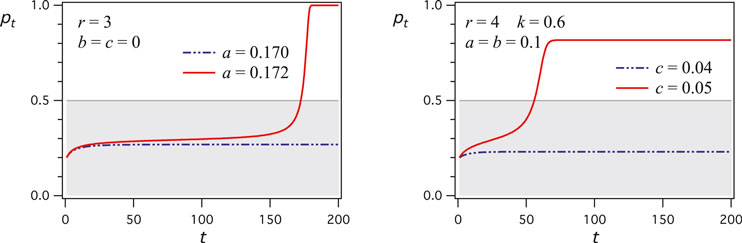
FIGURE 4. Evolution of p, the proportion of the support for A, as a function of the number of updates t. Left: A
Fixed Points of the Dynamics
The dynamics implemented by repeated applications of Eq. 2 exhibits a rather large spectrum of different scenarios within the five-dimensional space spanned by
It is of interest to mention that Eq. 22 is a polynomial of degree r in p and thus exhibits r solutions of which no more than three are real and contained within the
In case of three fixed points
Since making a visual representation is impossible in five dimensions, being interested in the evolution of an initial value
An alternative practical use of the phase diagram is to extract the two-dimensional slices, which shows the function
Indeed, all “slices” share the common property of having at least one single attractor for the dynamics. In addition, a series of slices exhibit one additional attractor and a tipping point located between the two attractors. For those cases, varying some of the parameters
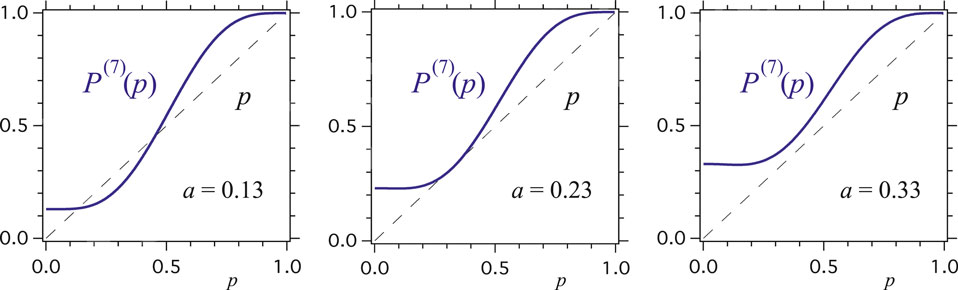
FIGURE 5. Examples of the evolution function
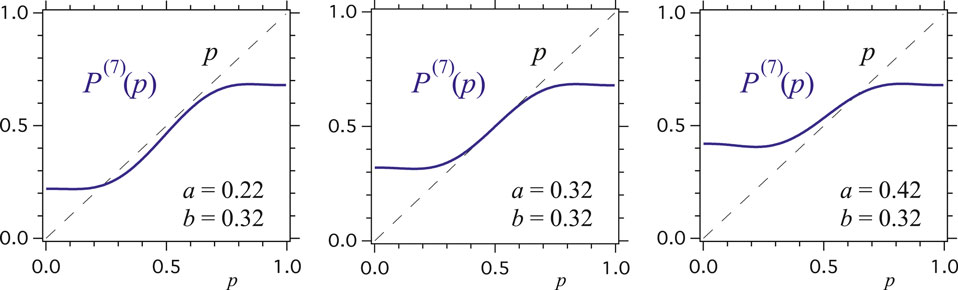
FIGURE 6. Examples of the evolution function
Exploring the Phase Diagram
From Eq. 22, when
In particular, for
With small but non-zero b, the system goes through transition between two stable fixed-point phase and single fixed-point phase, when a is varied, at a critical value higher than
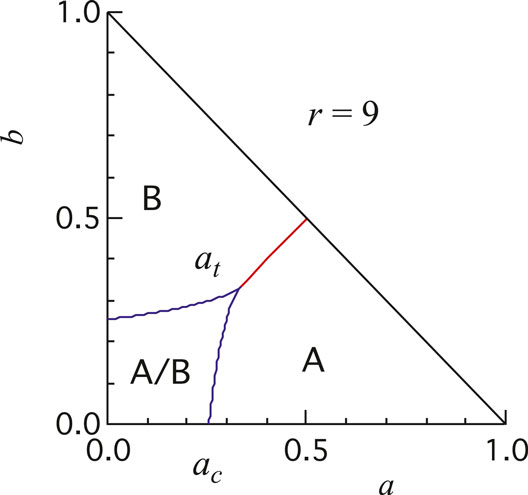
FIGURE 7. An example of the phase diagram of the parameter space
Above a certain value of b, the system goes from B-majoritarian single fixed-point phase to A-majoritarian single fixed-point phase without passing through three fixed-point phase (see Figure 7). The transition is characterized by triple critical point
Limiting ourselves to
It is instructive to draw the phase diagram on an
The r-dependence of
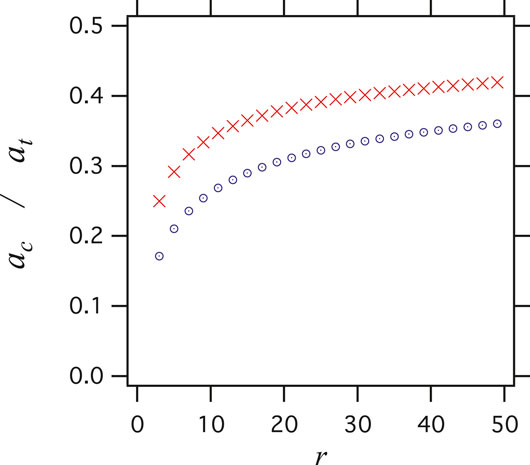
FIGURE 8. Critical parameters
Overall, approaching
It is again instructive to look at the phase diagram on the
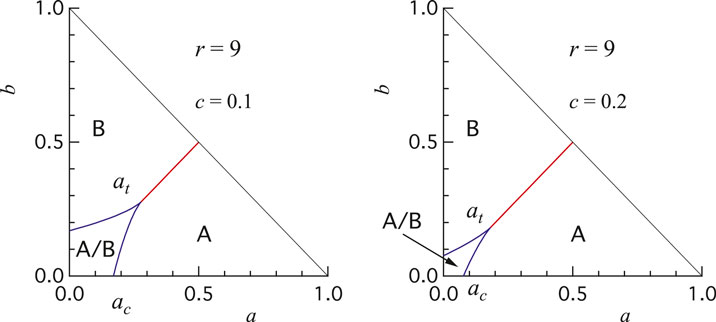
FIGURE 9. Phase diagram on
Summary
In this study, we have obtained a universal formula for the temporal evolution of agents following the Galam opinion dynamics in a parameter space of five dimensions, which are the respective proportions of inflexibles of each side (stubbornness), the proportion of contrarians, the mean value of shared prejudices, and the update group size.
The associated opinion landscape is found to be shaped by several attractors and tipping points, which yield a rich variety of non linearities and singularities in the opinion flows. Sudden upheavals such as minority spreading and majority collapse are thus given a rationale unveiling the hidden mechanisms behind the occurrence of unexpected and sudden shifts in the distribution of opinions such as with the Brexit victory and Trump election. The time dependence of the corresponding phenomena is also exhibited.
For large group sizes, although the effects of inflexible agents waved out with simple majority rule holding, the results vary very slowly, showing that earlier insights obtained from group sizes three and four remain intact. In contrast, for even sizes, although the prejudice effect weakens with increasing size, it stays effective. Moreover, having the update equation for any group size r makes it possible to consider combinations of group sizes, which in turn opens the path to account for underlying networks.
The study of one specific case has showed the existence of critical points
Obtaining the complete phase diagram of the dynamics of opinions yields a robust forecasting frame for which predictions become more reliable since what matters is the identification of the basin of attraction in which the dynamics is taking place, thus providing some flexibility in the accuracy of parameter evaluation. However, along the basin boundaries, higher precision is required for estimation of the value of the parameters. Given a specific issue, locating the corresponding relevant attractor allows anticipation of a possible unexpected shift of opinion trend ahead of its occurrence.
It is of importance to emphasize one instrumental feature of the model that it does not rely on data beside the use of few polls. Indeed, the model is not data-driven, allowing one to build the general landscape of the dynamics, whose topology is shaped by the various tipping points and attractors, which have been identified from the universal formula.
However, at this stage, making the framework operational for robust predictions is still to be implemented since specific tools must be designed to evaluate the value of parameters, i.e., the proportions of inflexibles of each side and contrarians, as well as the effective average of active prejudices connected to a given issue. This challenge cannot be addressed by physics solely. An interdisciplinary frame with social scientists is at stake to create effective new tolls to evaluate quantitatively those parameters.
Yet, it has been shown that rough qualitative estimates are sufficient to identify which basin is going to drive the dynamics for some cases as illustrated for the Brexit and French referendum about the project of the European constitution for which most activated prejudices were acting in favor of the choice no.
Accordingly, at this stage, predictions are qualitative about winning or losing a vote and not about a precise value of the voting outcome. The forecast is about toward an increase in support to obtain above fifty percent or a decrease to end up below fifty percent. Therefore, interdisciplinary efforts have to be made to reach solid quantitative predictions. Nevertheless, having the universal formula allows one to elaborate winning strategies in competing environments, widening previous discussed paths [46–50].
To conclude, we have obtained a potentially ready-to-use universal formula which, although operative tools for precise tuning of parameters are still lacking, provides already a new ground to make a large spectrum of predictions of winning strategies about outcomes of opinion dynamics, including voting, market shares, and societal trends.
Explicit Evolution Equations for
To make our universal update equation more concrete, we list explicit expressions for the series of values
Data Availability Statement
The original contributions presented in the study are included in the article/supplementary material, and further inquiries can be directed to the corresponding author.
Author Contributions
All authors have contributed equally to the manuscript.
Conflict of Interest
The authors declare that the research was conducted in the absence of any commercial or financial relationships that could be construed as a potential conflict of interest.
Acknowledgments
The authors express their gratitude to Ms. Miwa Ohtsuki and Professor Shinichiro Inaba for their encouragements during the completion of this work. This manuscript has been released as a pre-print at arXiv [51].
References
1. Galam, S, Gefen, Y, and Shapir, Y. Sociophysics: a new approach of sociological collective behaviour. I. mean‐behaviour description of a strike. J Math Sociol (1982). 9:1–13. doi: 10.1080/0022250x.1982.9989929. CrossRef Full Text
3. Galam, S. Sociophysics: A physicist’s Modeling of Psycho-political Phenomena. New York, NY: Springer (2012).
4. Castellano, C, Fortunato, S, and Loreto, V. Statistical physics of social dynamics. Rev Mod Phys (2009). 81:591–646. doi: 10.1103/revmodphys.81.591. CrossRef Full Text
5. Schweitzer, F. Sociophysics. Phys Today (2018). 71:40–6. doi: 10.1063/pt.3.3845. CrossRef Full Text
6. Noorazar, H. Recent advances in opinion propagation dynamics: a 2020 survey. Eur Phys J Plus (2020). 135:521. doi: 10.1140/epjp/s13360-020-00541-2.
7. Sznajd-Weron, K, and Sznajd, J. Opinion evolution in closed community Int J Mod Phys C (2000). 11:1157–65. doi: 10.1142/s0129183100000936. CrossRef Full Text
8. Ochrombel, R. Simulation of Sznajd sociophysics model with convincing single opinions Int J Mod Phys C (2001). 12:1091. doi: 10.1142/s0129183101002346. CrossRef Full Text
9. Corcos, A, Eckmann, J-P, Malaspinas, A, Malevergne, Y, and Sornette, D. Imitation and contrarian behaviour: hyperbolic bubbles, crashes and chaos. Quant Finance (2002). 2:264–81. doi: 10.1088/1469-7688/2/4/303. CrossRef Full Text
10. Behera, L, and Schweitzer, F. On spatial consensus formation: Is the Sznajd model different from a voter model? Int J Mod Phys C (2003). 14:1331–54. doi: 10.1142/s0129183103005467. CrossRef Full Text
11. Tessone, CJ, Toral, R, Amengual, P, Wio, HS, and San Miguel, M. Neighborhood models of minority opinion spreading. Eur Phys J B (2004). 39:535–44. doi: 10.1140/epjb/e2004-00227-5. CrossRef Full Text
13. Galam, S. Local dynamics vs. social mechanisms: A unifying frame. Europhys Lett (2005). 70:705–11. doi: 10.1209/epl/i2004-10526-5.
14. Deffuant, G, Neau, D, Amblard, F, and Weisbuch, G. Mixing beliefs among interacting agents. Adv Complex Syst (2000). 03:87–98. doi: 10.1142/s0219525900000078. CrossRef Full Text
15. Hegselmann, R, and Krause, U. Opinion dynamics and bounded confidence models, analysis, and simulation. J Artif Soc Soc Simulat (2002). 5:(3).
16. Rodriguez, N, Bollen, J, and Ahn, Y-Y. Collective Dynamics of Belief Evolution under Cognitive Coherence and Social Conformity. PloS One (2016). 11:e0165910. doi: 10.1371/journal.pone.0165910. CrossRef Full Text
17. Battiston, F, Cairoli, A, Nicosia, V, Baule, A, and Latora, V. Interplay between consensus and coherence in a model of interacting opinions. Phys Nonlinear Phenom (2016). 323-324:12–9. doi: 10.1016/j.physd.2015.10.013. CrossRef Full Text
18. Marsan, GA, Bellomo, N, and Gibelli, L. Stochastic evolutionary differential games toward a systems theory of behavioral social dynamics. Math Model Methods Appl Sci (2016). 26:1051–93. doi: 10.1142/s0218202516500251. CrossRef Full Text
19. Cheon, T, and Morimoto, J. Balancer effects in opinion dynamics. Phys Lett (2016). 380:429–34. doi: 10.1016/j.physleta.2015.11.012. CrossRef Full Text
20. Cheon, T, and Galam, S. Dynamical Galam model. Phys Lett (2018). 382:1509–15. doi: 10.1016/j.physleta.2018.04.019. CrossRef Full Text
21. Lynn, CW, Papadopoulos, L, Lee, DD, and Bassett, DS. Surges of collective human activity emerge from simple pairwise correlations. Phys Rev (2019). 9. doi: 10.1103%2FPhysRevX.9.011022.
22. Galam, S. Majority rule, hierarchical structures, and democratic totalitarianism: A statistical approach. J Math Psychol (1986). 30:426–34. doi: 10.1016/0022-2496(86)90019-2. CrossRef Full Text
23. Galam, S, Chopard, B, Masselot, A, and Droz, M. Competing species dynamics: Qualitative advantage versus geography. Eur Phys J B (1998). 4:529–31. doi: 10.1007/s100510050410. CrossRef Full Text
24. Galam, S. The dynamics of minority opinions in democratic debate. Phys Stat Mech Appl (2004). 336:56–62. doi: 10.1016/j.physa.2004.01.010. CrossRef Full Text
25. Galam, S. Heterogeneous beliefs, segregation, and extremism in the making of public opinions. Phys Rev E (2005). 71:046123. doi: 10.1103/physreve.71.046123. CrossRef Full Text
26. Fasano, G, Sorato, A, and Ellero, A. A modified Galam’s model for word-of-mouth information exchange, Physica A (2009). 388:3901–10. doi: 10.1016%2Fj.physa.2009.06.002
27. Galam, S. Are referendum a machinery to turn our prejudices into rational choices? An unfortunate answer from sociophysics, in The Routlrdge Handbook to Referendums and Direct Democracy, Eds. Morel, L, and Qvortrup, M, Routledge 19, 334–47 (2018).
28. Galam, S. The Trump phenomenon, an explanation from sociophysics. Int J Mod Phys B (2017). 31:1742015. doi: 10.1142/s0217979217420152. CrossRef Full Text
29. Lehir, P. Les mathématiques s’invitent dans le débat européen, (interview of S. Galam). Monde (2005). 26/02:23.
30. Galam, S, and Moscovici, S. Towards a theory of collective phenomena: consensus and attitude changes in groups. Eur J Soc Psychol (1991). 21:49–74. doi: 10.1002/ejsp.2420210105. CrossRef Full Text
31. Galam, S, and Jacobs, F. The role of inflexible minorities in the breaking of democratic opinion dynamics. Phys Stat Mech Appl (2007). 381:366–76. doi: 10.1016/j.physa.2007.03.034. CrossRef Full Text
32. Martins, A, and Galam, S. Building up of individual inflexibility in opinion dynamics, Phys Rev E (2013). 87, 042807. doi: 10.1103/physreve.87.042807. CrossRef Full Text
33. Crokidakis, N, and de Oliveira, PMC. Inflexibility and ind+ependence: phase transitions in the majority-rule model. Phys Rev E (2015). 92:062122. doi: 10.1103/physreve.92.062122. CrossRef Full Text
34. Mobilia, M. Nonlinear q-voter model with inflexible zealots. Phys Rev E (2015). 92:012803. doi: 10.1103/physreve.92.012803. CrossRef Full Text
35. Pickering, W, Szymanski, BK, and Lim, C. Analysis of the high dimensional naming game with committed minorities. Phys Rev E (2016). 93:052311. doi: 10.1103/physreve.93.052311. CrossRef Full Text
36. Burghardt, K, Rand, W, and Girvan, M. Competing opinions and stubbornness: connecting models to data. Phys Rev E (2016). 93:032305. doi: 10.1103/physreve.93.032305. CrossRef Full Text
37. Juul, JS, and Porter, MA. Hipsters on networks: How a minority group of Individuals can lead to an anti-establishment majority. arXiv:1707.07187v2 (2018).
38. Galam, S. Contrarian deterministic effects on opinion dynamics: "the hung elections scenario". Phys Stat Mech Appl (2004). 333:453–60. doi: 10.1016/j.physa.2003.10.041. CrossRef Full Text
39. Tanabe, S, and Masuda, N. Complex dynamics of a nonlinear voter model with contrarian agents. Chaos (2013). 23:043136. doi: 10.1063/1.4851175. CrossRef Full Text | Pubmed
40. Lee, E, Holme, P, and Lee, SH. Modeling the dynamics of dissent. Phys Stat Mech Appl (2017). 486:262–72. doi: 10.1016/j.physa.2017.05.047. CrossRef Full Text
41. Gambaro, JP, and Crokidakis, N. The influence of contrarians in the dynamics of opinion formation. Phys Stat Mech Appl (2017). 486:465–72. doi: 10.1016/j.physa.2017.05.040. CrossRef Full Text
42. Jacobs, F, and Galam, S. Two-opinions-dynamics generated by inflexibles and non-contrarian and contrarian floaters. arXiv:0803.3150v1 (2008).
43. Crokidakis, N, Blanco, VH, and Anteneodo, C. Impact of contrarians and intransigents in a kinetic model of opinion dynamics. Phys Rev E (2014). 89:013310. doi: 10.1103/physreve.89.013310. CrossRef Full Text
44. Kalil, N, Miguel, MS, and Toral, R. Zealots in the mean-field noisy voter model. Phys. Rev. E (2018). 97:012310.
45. Battiston, F, Cencetti, G, Iacopini, I, Latora, V, Lucas, M, Patania, A, et al. Networks beyond pairwise interactions: Structure and dynamics. Phys Rep (2020). 874:1–92. doi: 10.1016/j.physrep.2020.05.004. CrossRef Full Text
46. Wang, Z, Xia, C, Chen, Z, and Chen, G. Epidemic Propagation With Positive and Negative Preventive Information in Multiplex Networks. IEEE Trans Cybern (2020). [Epub ahead of print]. doi: 10.1109/TCYB.2019.2960605
47. Wang, Z, Guo, Q, Sun, S, and Xia, C. The impact of awareness diffusion on SIR-like epidemics in multiplex networks. Appl Math Comput (2019). 349:134–47. doi: 10.1016/j.amc.2018.12.045. CrossRef Full Text
48. Li, J, Wang, J, Sun, S, and Xia, C. Cascading crashes induced by the individual heterogeneity in complex networks. Appl Math Comput (2018). 323:182–92. doi: 10.1016/j.amc.2017.11.059. CrossRef Full Text
49. Javarone, MA. Network Strategies in the Election Campaigns. J Stat Mech - Theory Exp (2014). 8:P08013. doi: 10.1088%2F1742-5468%2F2014%2F8%2FP08013
50. Javarone, MA, and Squartini, T. Conformism-driven phases of opinion formation on heterogeneous networks: The q-voter model case. J Stat Mech - Theory Exp (2015). P10002. doi: 10.1088%2F1742-5468%2F2015%2F10%2FP10002
Keywords: opinion dynamic, minority spreading, stubborn agents, contrarian agents, prejudice, sociophysics
Citation: Galam S and Cheon T (2020) Tipping Points in Opinion Dynamics: A Universal Formula in Five Dimensions. Front. Phys. 8:566580. doi: 10.3389/fphy.2020.566580
Received: 28 May 2020; Accepted: 08 September 2020;
Published: 10 November 2020.
Edited by:
Marco Alberto Javarone, University College London, United KingdomReviewed by:
Chengyi Xia, Tianjin University of Technology, ChinaIacopo Iacopini, Queen Mary University of London, United Kingdom
Copyright © 2020 Galam and Cheon. This is an open-access article distributed under the terms of the Creative Commons Attribution License (CC BY). The use, distribution or reproduction in other forums is permitted, provided the original author(s) and the copyright owner(s) are credited and that the original publication in this journal is cited, in accordance with accepted academic practice. No use, distribution or reproduction is permitted which does not comply with these terms.
*Correspondence: Serge Galam, serge.galam@sciencespo.fr