Feeding Habits of Bigeye Tuna (Thunnus obesus) in the Western Indian Ocean Reveal a Size-Related Shift in Its Fine-Scale Piscivorous Diet
 Chien-Hsiang Lin1
  Jing-Siang Lin2
  Kuo-Shu Chen3
  Meng-Hsien Chen3,4
  Chiee-Young Chen5
  Chih-Wei Chang3,6,7*
- 1Biodiversity Research Center, Academia Sinica, Taipei, Taiwan
- 2Department of Marine Biotechnology and Resources, National Sun Yat-sen University, Kaohsiung, Taiwan
- 3Department of Oceanography, and Asia-Pacific Ocean Research Center, National Sun Yat-sen University, Kaohsiung, Taiwan
- 4Institute of Marine Ecology and Conservation, National Sun Yat-sen University, Kaohsiung, Taiwan
- 5Department of Marine Environmental Engineering, National Kaohsiung University of Science and Technology, Kaohsiung, Taiwan
- 6Marine Ecology and Conservation Research Center, National Academy of Marine Research, Kaohsiung, Taiwan
- 7National Museum of Marine Biology and Aquarium, Pingtung, Taiwan
This study analyzed the piscivorous diet of bigeye tuna (Thunnus obesus) through species identification of both fish and otolith remains in stomachs of 183 bigeye tuna collected in the western Indian Ocean. A total of 642 fish remains and 1,021 fish otoliths were examined. Prey items identified in the fish and otolith remains were not completely consistent. Although 12 items out of the 53 identified taxa were found in both remains, 20 items of fish remains were not found in otolith remains, and 21 items were added only from the otoliths. The main fish remains were Alepisauridae, which accounted for 13.9%. Most of the otoliths belonged to Myctophidae (49.5%) and Scopelarchidae (21.4%). Three prey items, namely Valenciennellus tripunctulatus, Evermannella sp., and Zenion sp., were recorded for the first time in the diet of bigeye tuna from the region. The otolith remains substantially enhanced the taxonomic resolution of the diet. Bigeye tuna stomach contents were independent of location, depth, and time of catch but varied with tuna size. The proportion of dominant Myctophidae prey items decreased markedly as the tuna size increased, whereas the proportion of Macrouridae increased with size. In addition, larger bigeye tuna were found feeding on larger prey (Electrona risso and Scopelarchus analis), demonstrating that diet changes in both prey composition and size are related to the ontogeny of the fish.
Introduction
The bigeye tuna [Thunnus obesus (Lowe, 1839)] is an economically important fish that typically inhabits tropical and subtropical waters, between approximately 40°N and 40°S in the Pacific, Atlantic, and Indian Oceans (Hanamoto, 1987). The maximum fork length (FL) of the fish in the Indian Ocean was estimated to be approximately 170 cm in fish older than 6 years (Stéquert and Conand, 2004). The vertical distribution of the epi- and mesopelagic bigeye tuna ranges from the surface to 400 m, occasionally reaching depths over 1,000 m. This depth varies substantially with day–night shifts, seasonal changes, and changes in water temperature (Shannon, 1987; Dagorn et al., 2000; Musyl et al., 2003; Matsumoto et al., 2013; Lam et al., 2014). As an economically valuable species, bigeye tuna has been caught using industrial purse seine and longline fisheries in the past and using gillnet fisheries in the Indian Ocean in recent years. Landings peaked in the late 1990s before diminishing across all oceans (Nootmorn, 2004; IOTC, 2005; Pillai and Satheeshkumar, 2012). The International Union for Conservation of Nature Red List of Threatened Species classifies bigeye tuna as a vulnerable species, indicating that ensuring a theoretically optimal catch is essential.
Bigeye tuna are top predators with an opportunistic feeding strategy (Ménard et al., 2006; Olson et al., 2016). Therefore, its prey composition can be an indicator of the food web and marine ecosystem conditions of the ocean in which they live (Polovina et al., 2009). Furthermore, changes in the fish components of the bigeye tuna diet may be attributable to the effect of intensive commercial fishing on either the top predator or its prey (IOTC, 2003). Determining the components of the diet of bigeye tuna is necessary for delineating the potential trophic level change in the marine food web as well as for developing effective fishery management strategies.
Diet analysis using the stomach content of bigeye tuna has been an efficient approach and widely investigated for samples from the western Indian Ocean (Kornilova, 1980; Bashmakov et al., 1991; Potier et al., 2004), southern Africa (Shannon, 1987), the tropical Atlantic (Ménard et al., 2000; Vaske-Jr et al., 2012; da Silva et al., 2019), the central Pacific (Grubbs et al., 2001; Ménard et al., 2006), the west Pacific (Ohe and Moriguchi, 2009), and eastern Australia (Young et al., 2010). These studies have indicated that teleosts, cephalopods, and crustaceans are the three main diet groups consumed, and teleosts have been consistently reported to account for the highest proportion of the diet. However, these studies have identified teleosts with different taxonomic resolutions, and to our best knowledge, relevant studies from the Indian Ocean have been scant.
Focusing on teleost prey items by using both fish body remains and otoliths, we analyzed the piscivorous diet of bigeye tuna in the western Indian Ocean. Spatiotemporal and biological dynamics of the feeding habits were further explored.
Materials and Methods
Sampling Design
Samples of bigeye tuna stomachs were collected by scientific observers aboard three Taiwanese longline vessels. The observers were trained by the government-commissioned Overseas Fisheries Development Council of the Republic of China (Huang, 2011). The samples were collected between April and December 2006 in the main fishing ground of bigeye tuna in the western Indian Ocean (between 6°45′S–4°05′N and 40°16′E–70°55′E; Figure 1). The specific catch sites and fish FL (in cm) were recorded on board. The stomach of each sample was preserved in a sealed and labeled plastic bag and frozen at −20°C for subsequent analysis in the lab. Depth of capture was estimated using an 8-bit minitag device (Minilog TDR; Vemco Ltd., Nova Scotia, Canada) placed on a randomly selected short line attaching the hook (snood) (Wang, 2010).
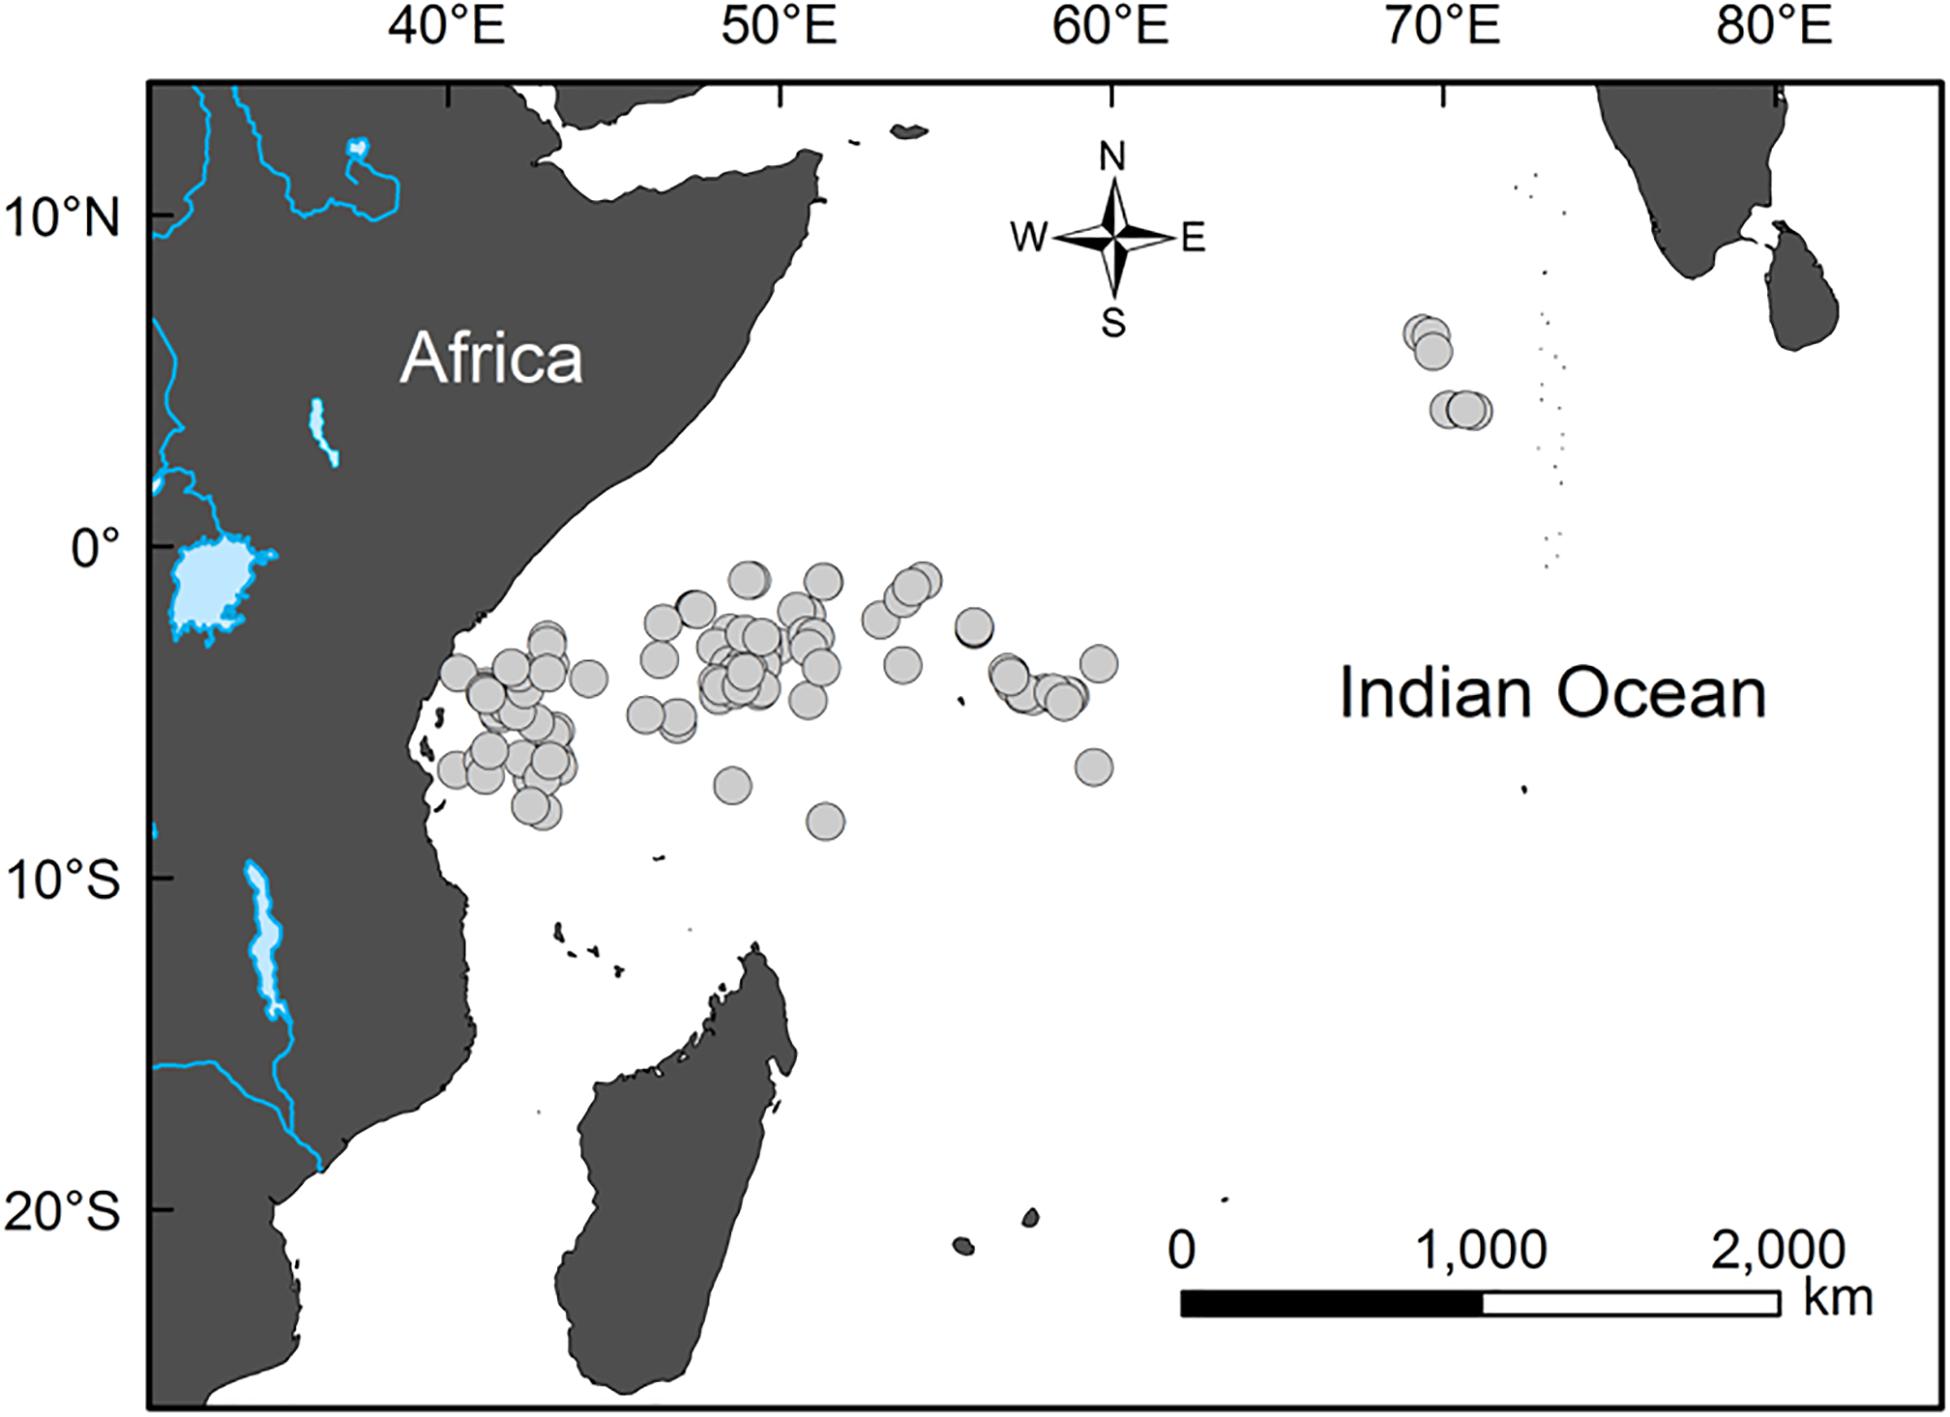
Figure 1. Sampling sites (circles) of the bigeye tuna (Thunnus obesus) in the western Indian Ocean from April to December 2006.
Each stomach sample was weighed and photographed after being thawed. Stomachs that contained only fluid or mucus were considered empty. The stomach contents were sorted into three major groups: teleosts, molluscs, and crustaceans. Scombrids, carangids, and Chanos chanos (Chanidae), which are used as baitfish by longline fisheries, were excluded from the analysis. Among the 183 bigeye tuna stomach samples, 44 were empty, and 139 contained prey items. Preliminary sorting led to the identification of 642 teleosts, 854 crustaceans, and 201 molluscs. The crustaceans and molluscs were briefly identified and listed but are not further analyzed here (Table 1).
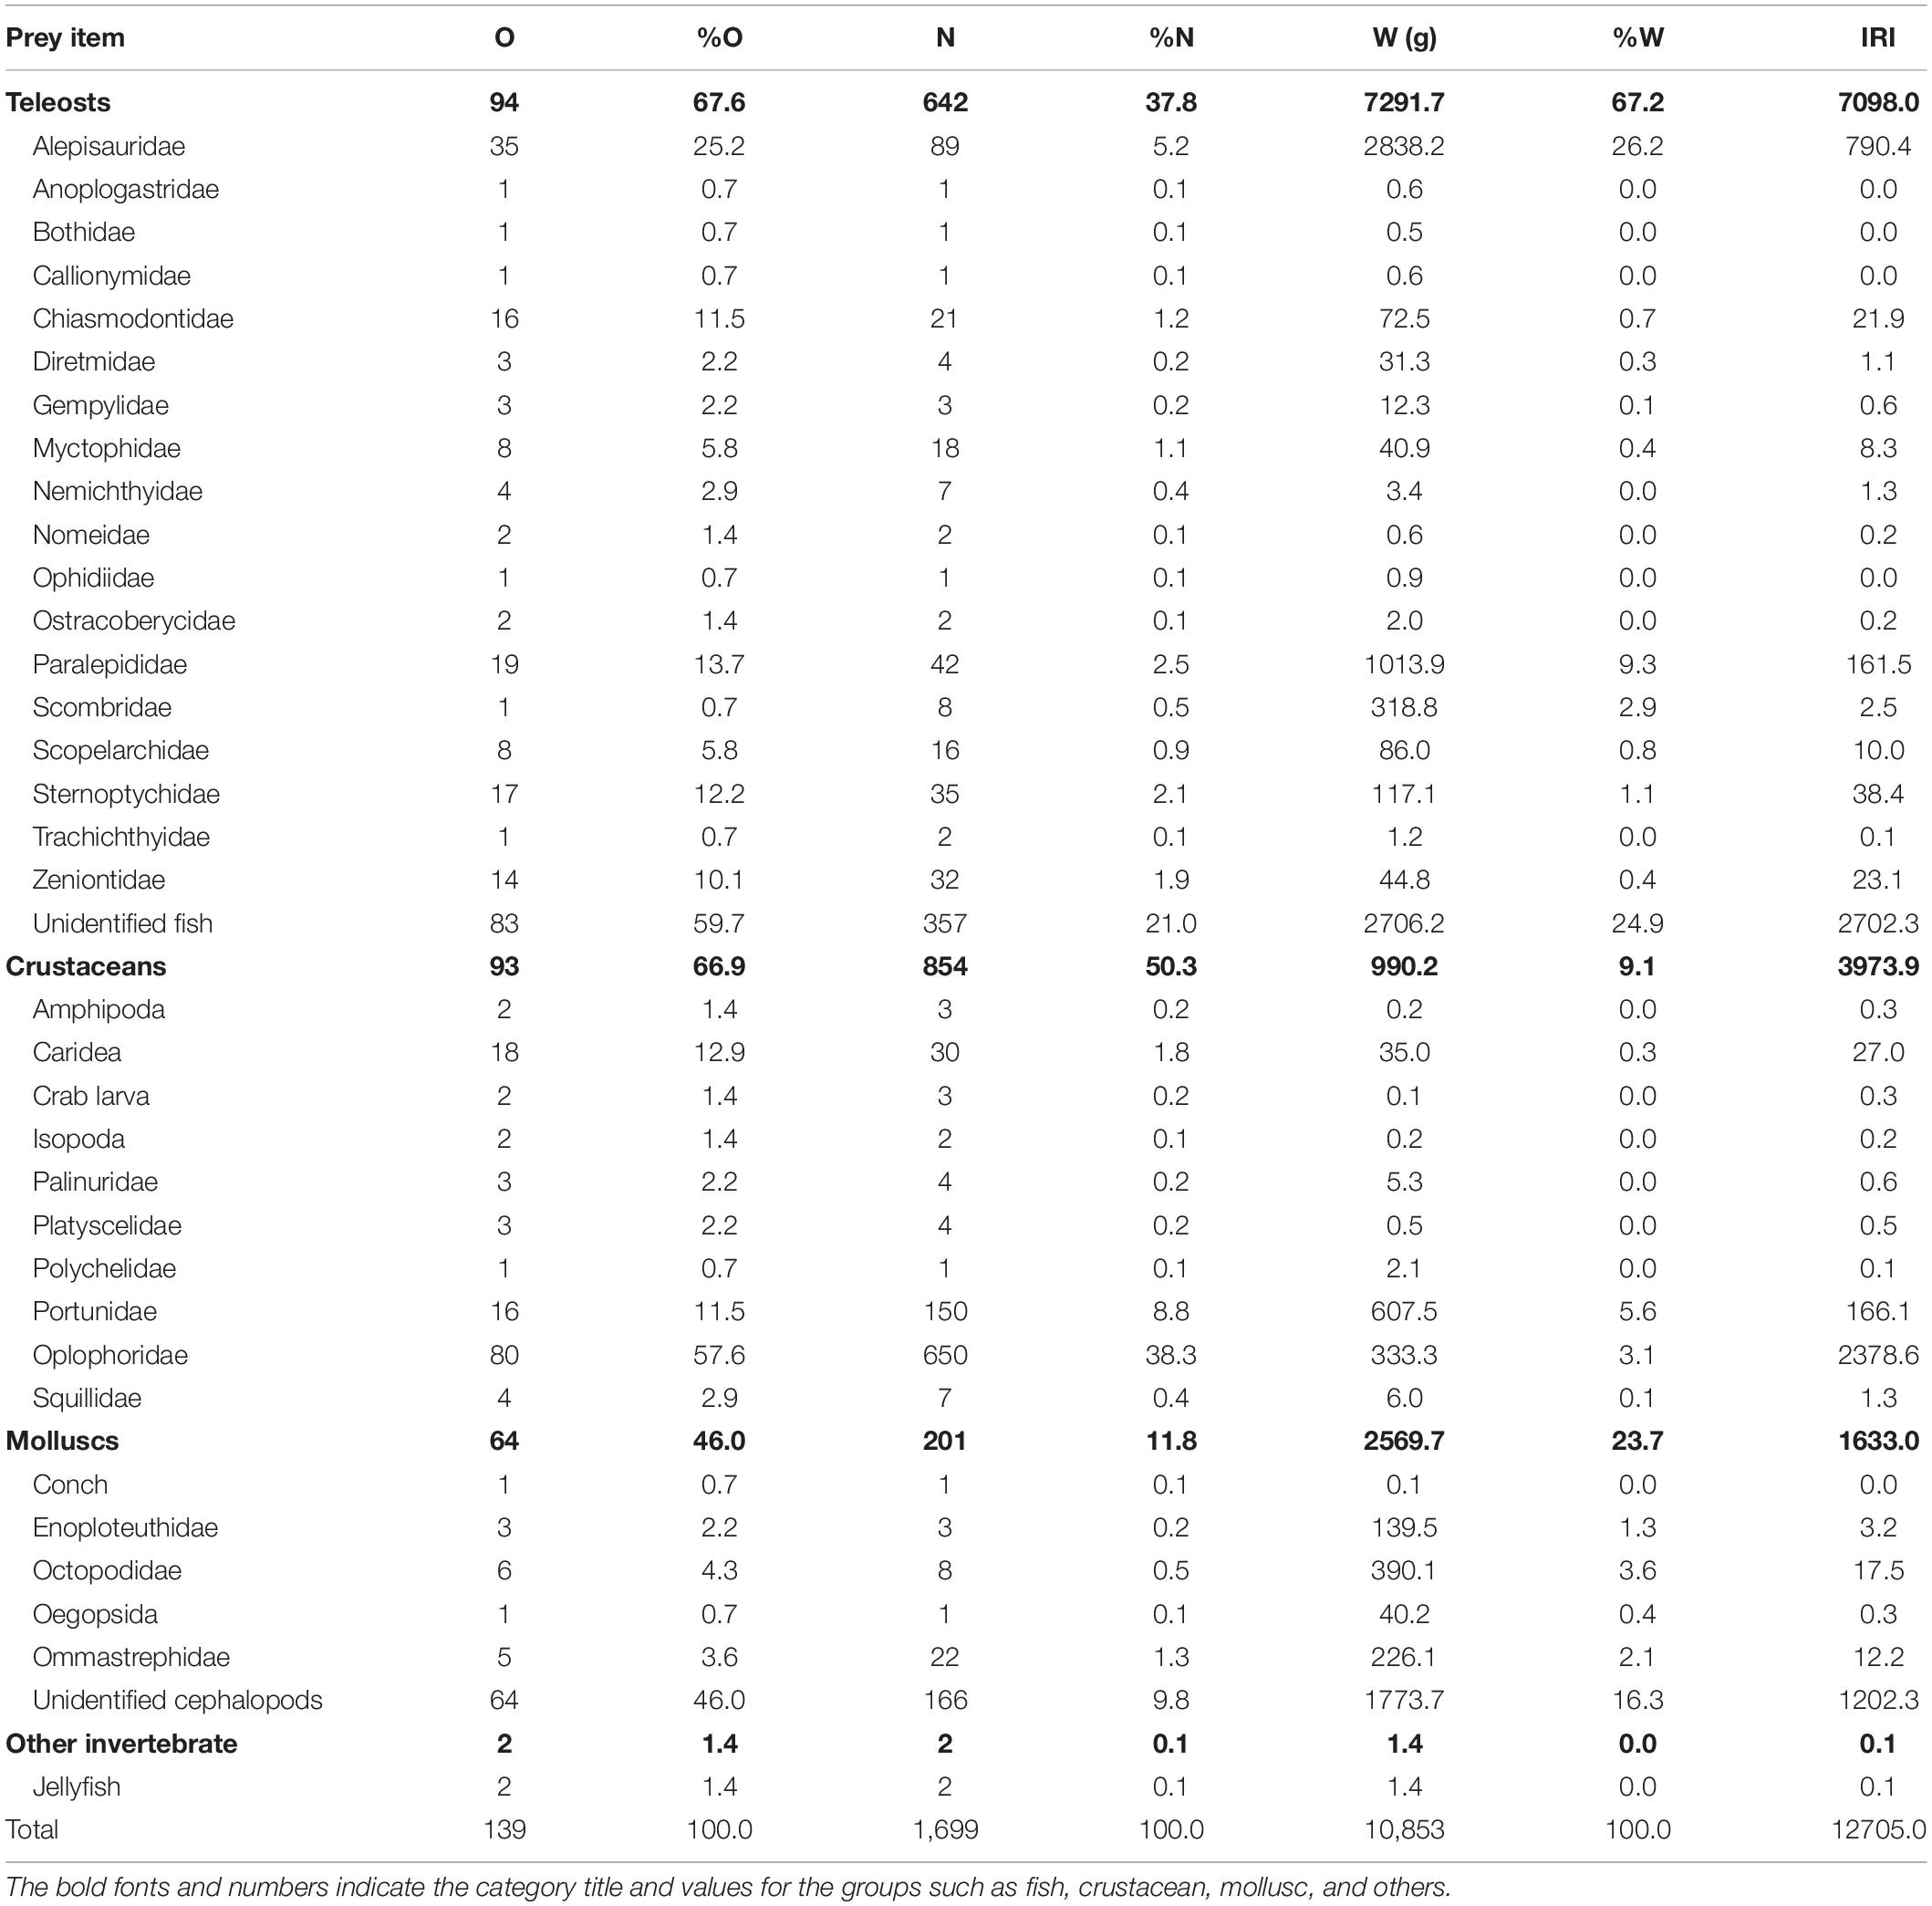
Table 1. Number of stomachs containing the prey item (O), percentage of occurrence (%O), number of prey items (N), numerical percentage (%N), weight of prey items (W), weight percentage (%W), and index of relative importance (IRI) of bigeye tuna Thunnus obesus.
In addition to the 642 fish remains, 78 out of the 139 stomach samples yielded 1,021 otoliths. These were further analyzed for a fine-scale examination of the piscivorous diet of bigeye tuna. The FL of bigeye tuna with fish-containing stomachs ranged from 88 to 190 cm, and they were captured at depths ranging from 51 m to approximately 283 m between April and September 2006. For bigeye tuna with otolith-containing stomachs, their FLs were 91–177 cm, capture depths were 60–280 m, and capture months were between April and September 2006.
To evaluate sample size coverage, we conducted sample-based rarefaction and extrapolation for both fish remains and otoliths. Unidentified remains were excluded, leaving 94 and 77 stomach samples in the analysis for fish remains and otoliths, respectively. The analysis was calculated using EstimateS ver. 9.1.0 (Colwell, 2013).
Otolith Examination
Only sagittal otoliths were analyzed; asterisci and lapilli were excluded. The otoliths were pretreated with a solution of 3% potassium hydroxide, washed with distilled water, and air-dried. Otoliths collected from a single stomach were stored together in a 20-mL vial. Images were obtained for each identified taxon by using a stereomicroscope (Discovery V20, Zeiss), and the maximal otolith length (OL; in micrometers) was measured using the imaging software package AxioVs40 V4.7.2.0 (Zeiss).
Otoliths were identified based on the descriptions, identification keys, and images provided by Nolf (1985, 2013), Smale et al. (1995), and Rivaton and Bourret (1999) as well as the authors’ reference materials (Lin and Chang, 2012). Otoliths were identified at least at the family level and to lower taxa whenever possible. Subsequent analyses were based on the family level.
Prey Composition Analysis
The index of relative importance (IRI) is a standardized measure for prey occurrence (%O), number (%N), and weight (%W) when analyzing stomach contents (Pinkas et al., 1971; Hyslop, 1980; Cortés, 1997, 1998, 1999; Liao et al., 2001). Hence, the following metrics were calculated for fish remains: percentage of occurrence %O = (number of stomachs containing the prey item/total number of otolith-containing stomachs) × 100, numerical percentage %N = (number of prey items/total number of prey items) × 100, and weight percentage %W = (wet weight of the prey item/total wet weight of prey items) × 100. The IRI = (%N + %W) × %O. As for otolith remains, the IRI cannot be used without estimating the prey weight by determining the relationship between the OL and fish weight. To date, the OL–fish weight relationships among Indian Ocean fishes are yet to be fully elaborated, and additional studies are necessary to determine said relationships. Therefore, in this study, %O and %N were used to reveal the prey preferences by otolith remains (irrespective of the left or right side) among the bigeye tuna. A chance existed that some individuals might be counted only once due to the loss (broken or digested) of left or right otoliths; however, we assumed that all the otoliths were included because the digestion of the fish in the stomach was fixed and the number of broken and unidentified otoliths was low. Furthermore, because our subsequent analyses were based on proportions, no differences would exist between the use of both sides (left and right) or only a single side of otoliths (Fitch and Brownell, 1968; Potier et al., 2004).
The relationships between bigeye tuna diets from both the fish- and otolith-containing stomachs (MN%, mean proportion by individual) and the following four variables were structured: capture site (spatial), depth (spatial), month (temporal), and fish FL (biological). Capture sites were grouped by longitude as <45°E, 45–52°E, 53–60°E, and >60°E. Capture depths were grouped as <100 m, 100–200 m, and >200 m. Capture dates were grouped into 2-month intervals, beginning from the first sample caught in April and ending with the final sample caught in September. These grouping criteria were determined on the basis of the acquired data and an arbitrary stratum. Fish FLs were grouped by size at sexual maturity (Zhu et al., 2011) and age (Stéquert and Conand, 2004): <111 cm FL (immature, <3 year), 111–127 cm FL (mature, 3+ year), 128–138 cm FL (mature, 4+ year), 139–147 cm FL (mature, 5+ year), and >147 cm FL (mature, >6 year). The Kruskal–Wallis one-way analysis-of-variance-by-ranks test was applied to measure the statistical significance of differences in percent number for each prey family (Potier et al., 2007, 2008).
The allometric relationships between otolith size and fish length have been widely supported (Smale et al., 1995; Granadeiro and Silva, 2000; Harvey et al., 2000; Battaglia et al., 2010). The size distribution of prey otoliths has been considered a suitable and independent indicator for prey fish size distribution (Granadeiro and Silva, 2000). OLs of dominant prey species were compared against each variable as mentioned above by using one-way analysis of variance and a post-hoc Tukey multiple range test (Siegel, 1956). In addition, the relationships between prey otolith size and fish length were studied using both least-squares and quantile regressions, of which the latter is well-adapted for estimating the lower (5th quantile) and upper (95th quantile) boundaries of prey size changes by predator size (Scharf et al., 2000; Ménard et al., 2006).
Results
Prey Composition Based on Fish and Otolith Remains
Among the 1,021 fish otoliths, 33 taxa belonging to 17 families that range from 690 μm (Alepisauridae) to 5,730 μm (Microstomatidae) in OL were identified (Figure 2). Table 2 summarizes the frequency of occurrence and number by prey items recovered from the 78 otolith remain-containing stomach samples compared with those from the 94 fish remain-containing samples. Identifiability for fish remains was 96 items (15.0%) at the species level, 105 (16.4%) at the genus level, and 84 (13.1%) at the family level. However, much of the otolith remains were assigned to lower taxa, among which 625 items (61.2%), 295 (28.9%), and 81 (7.9%) were at species, genus, and family levels, respectively. The majority of 357 (55.6%) fish remains were unidentified because of the advanced state of digestion, whereas only 20 (2.0%) otoliths, including six unknown and 14 otoliths, could not be identified.
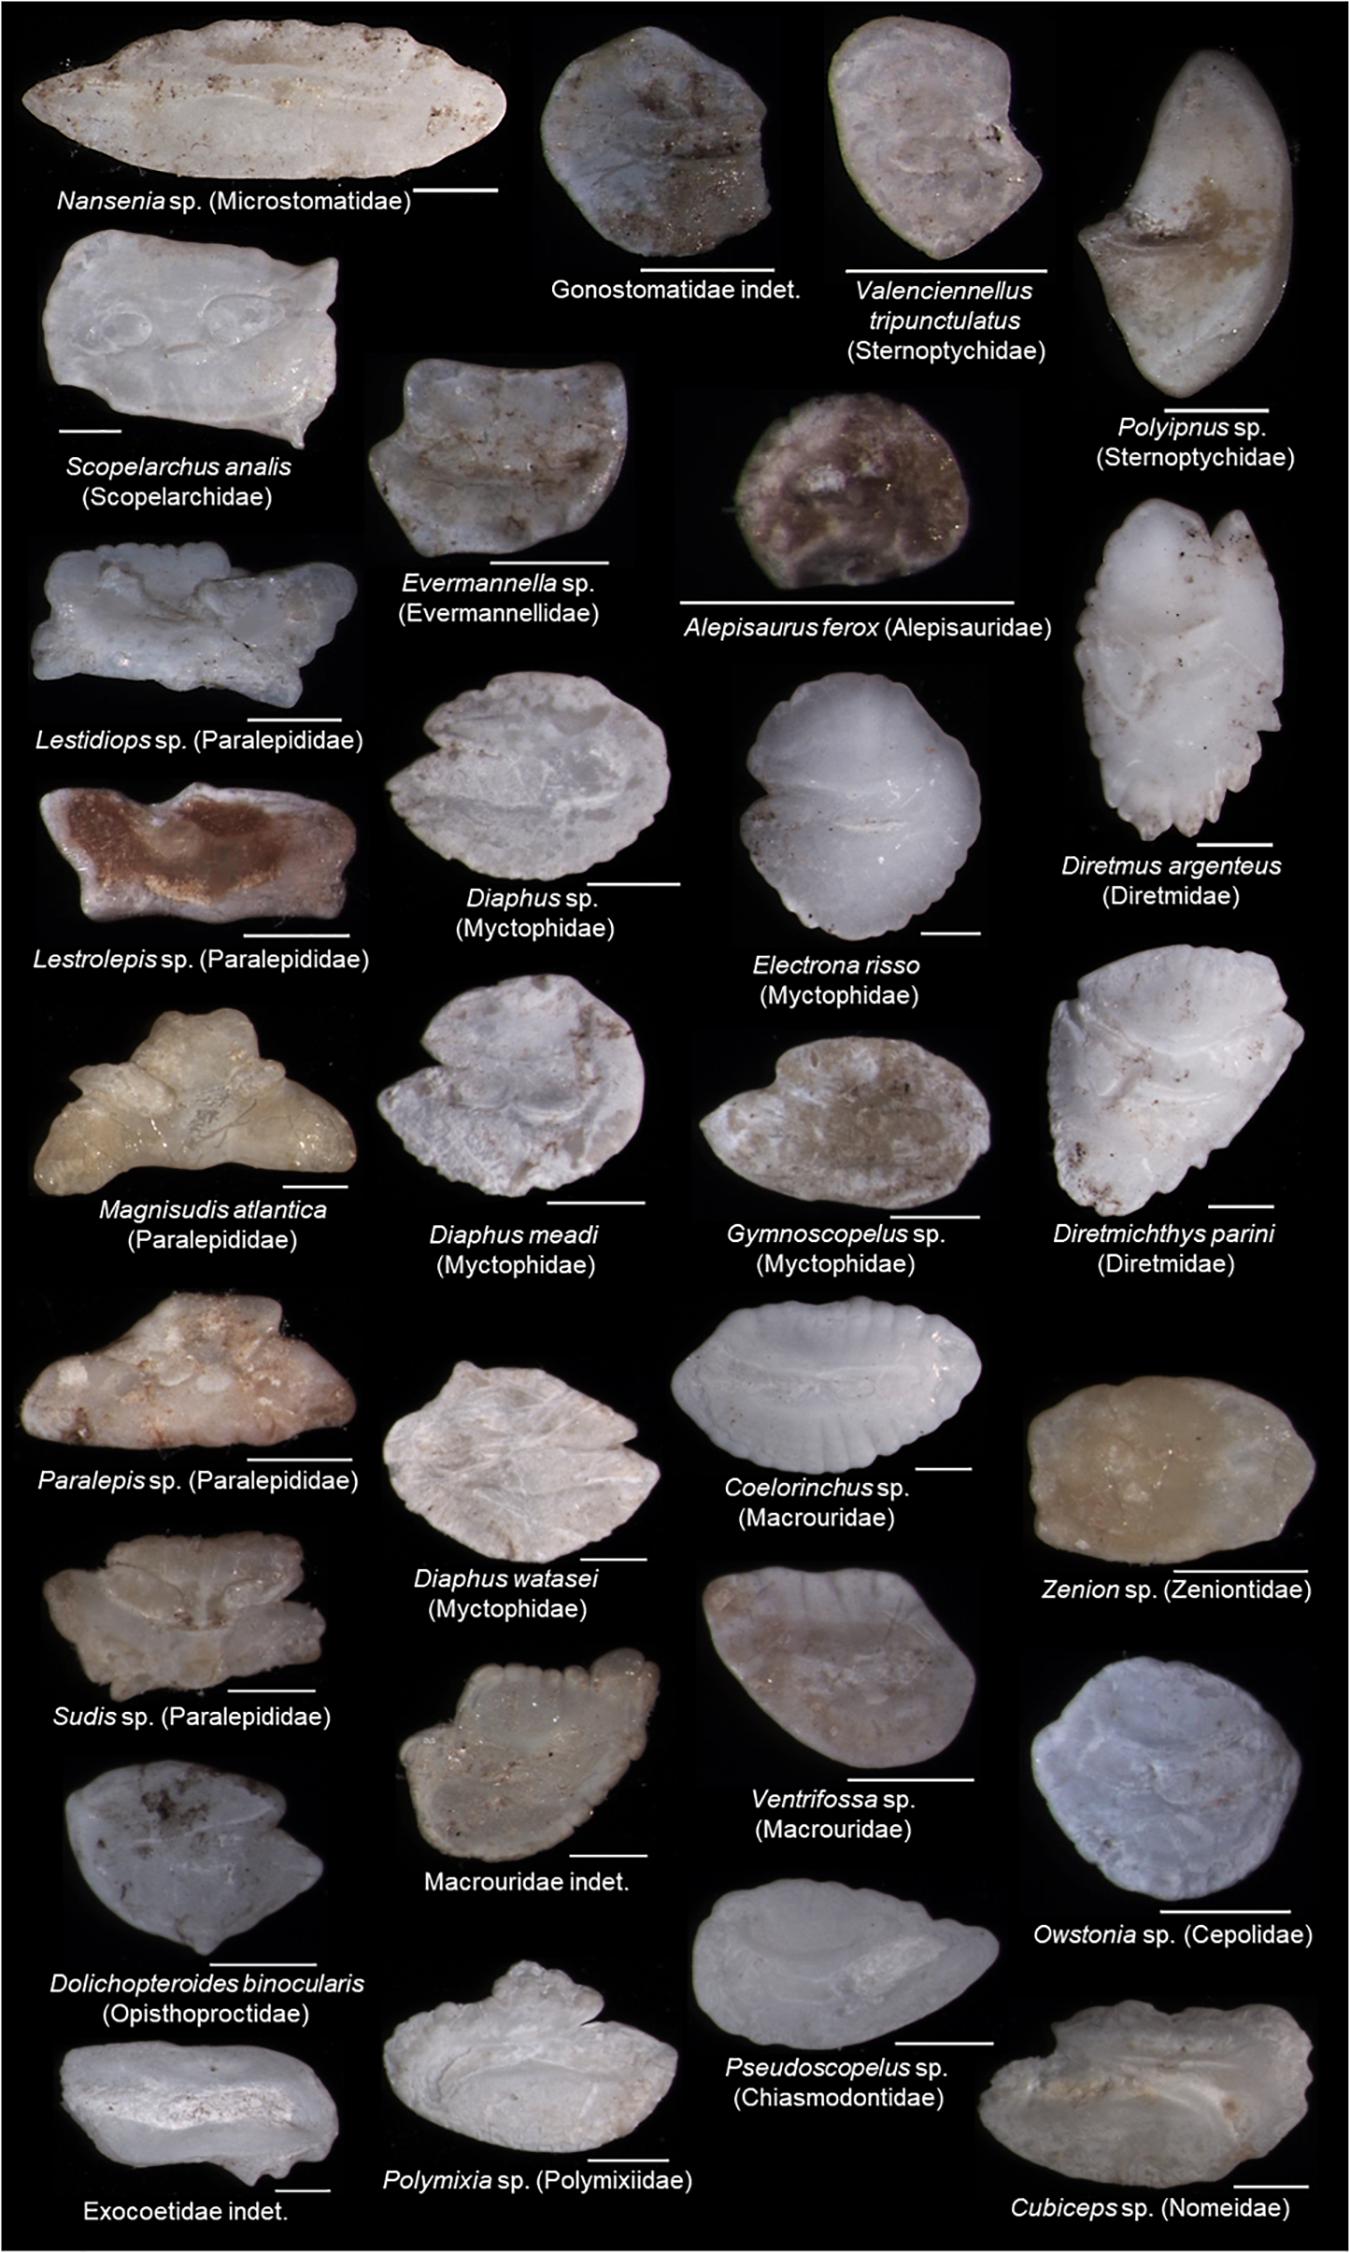
Figure 2. Otoliths recovered from stomach contents of the bigeye tuna (Thunnus obesus). Scale bar = 1 mm.
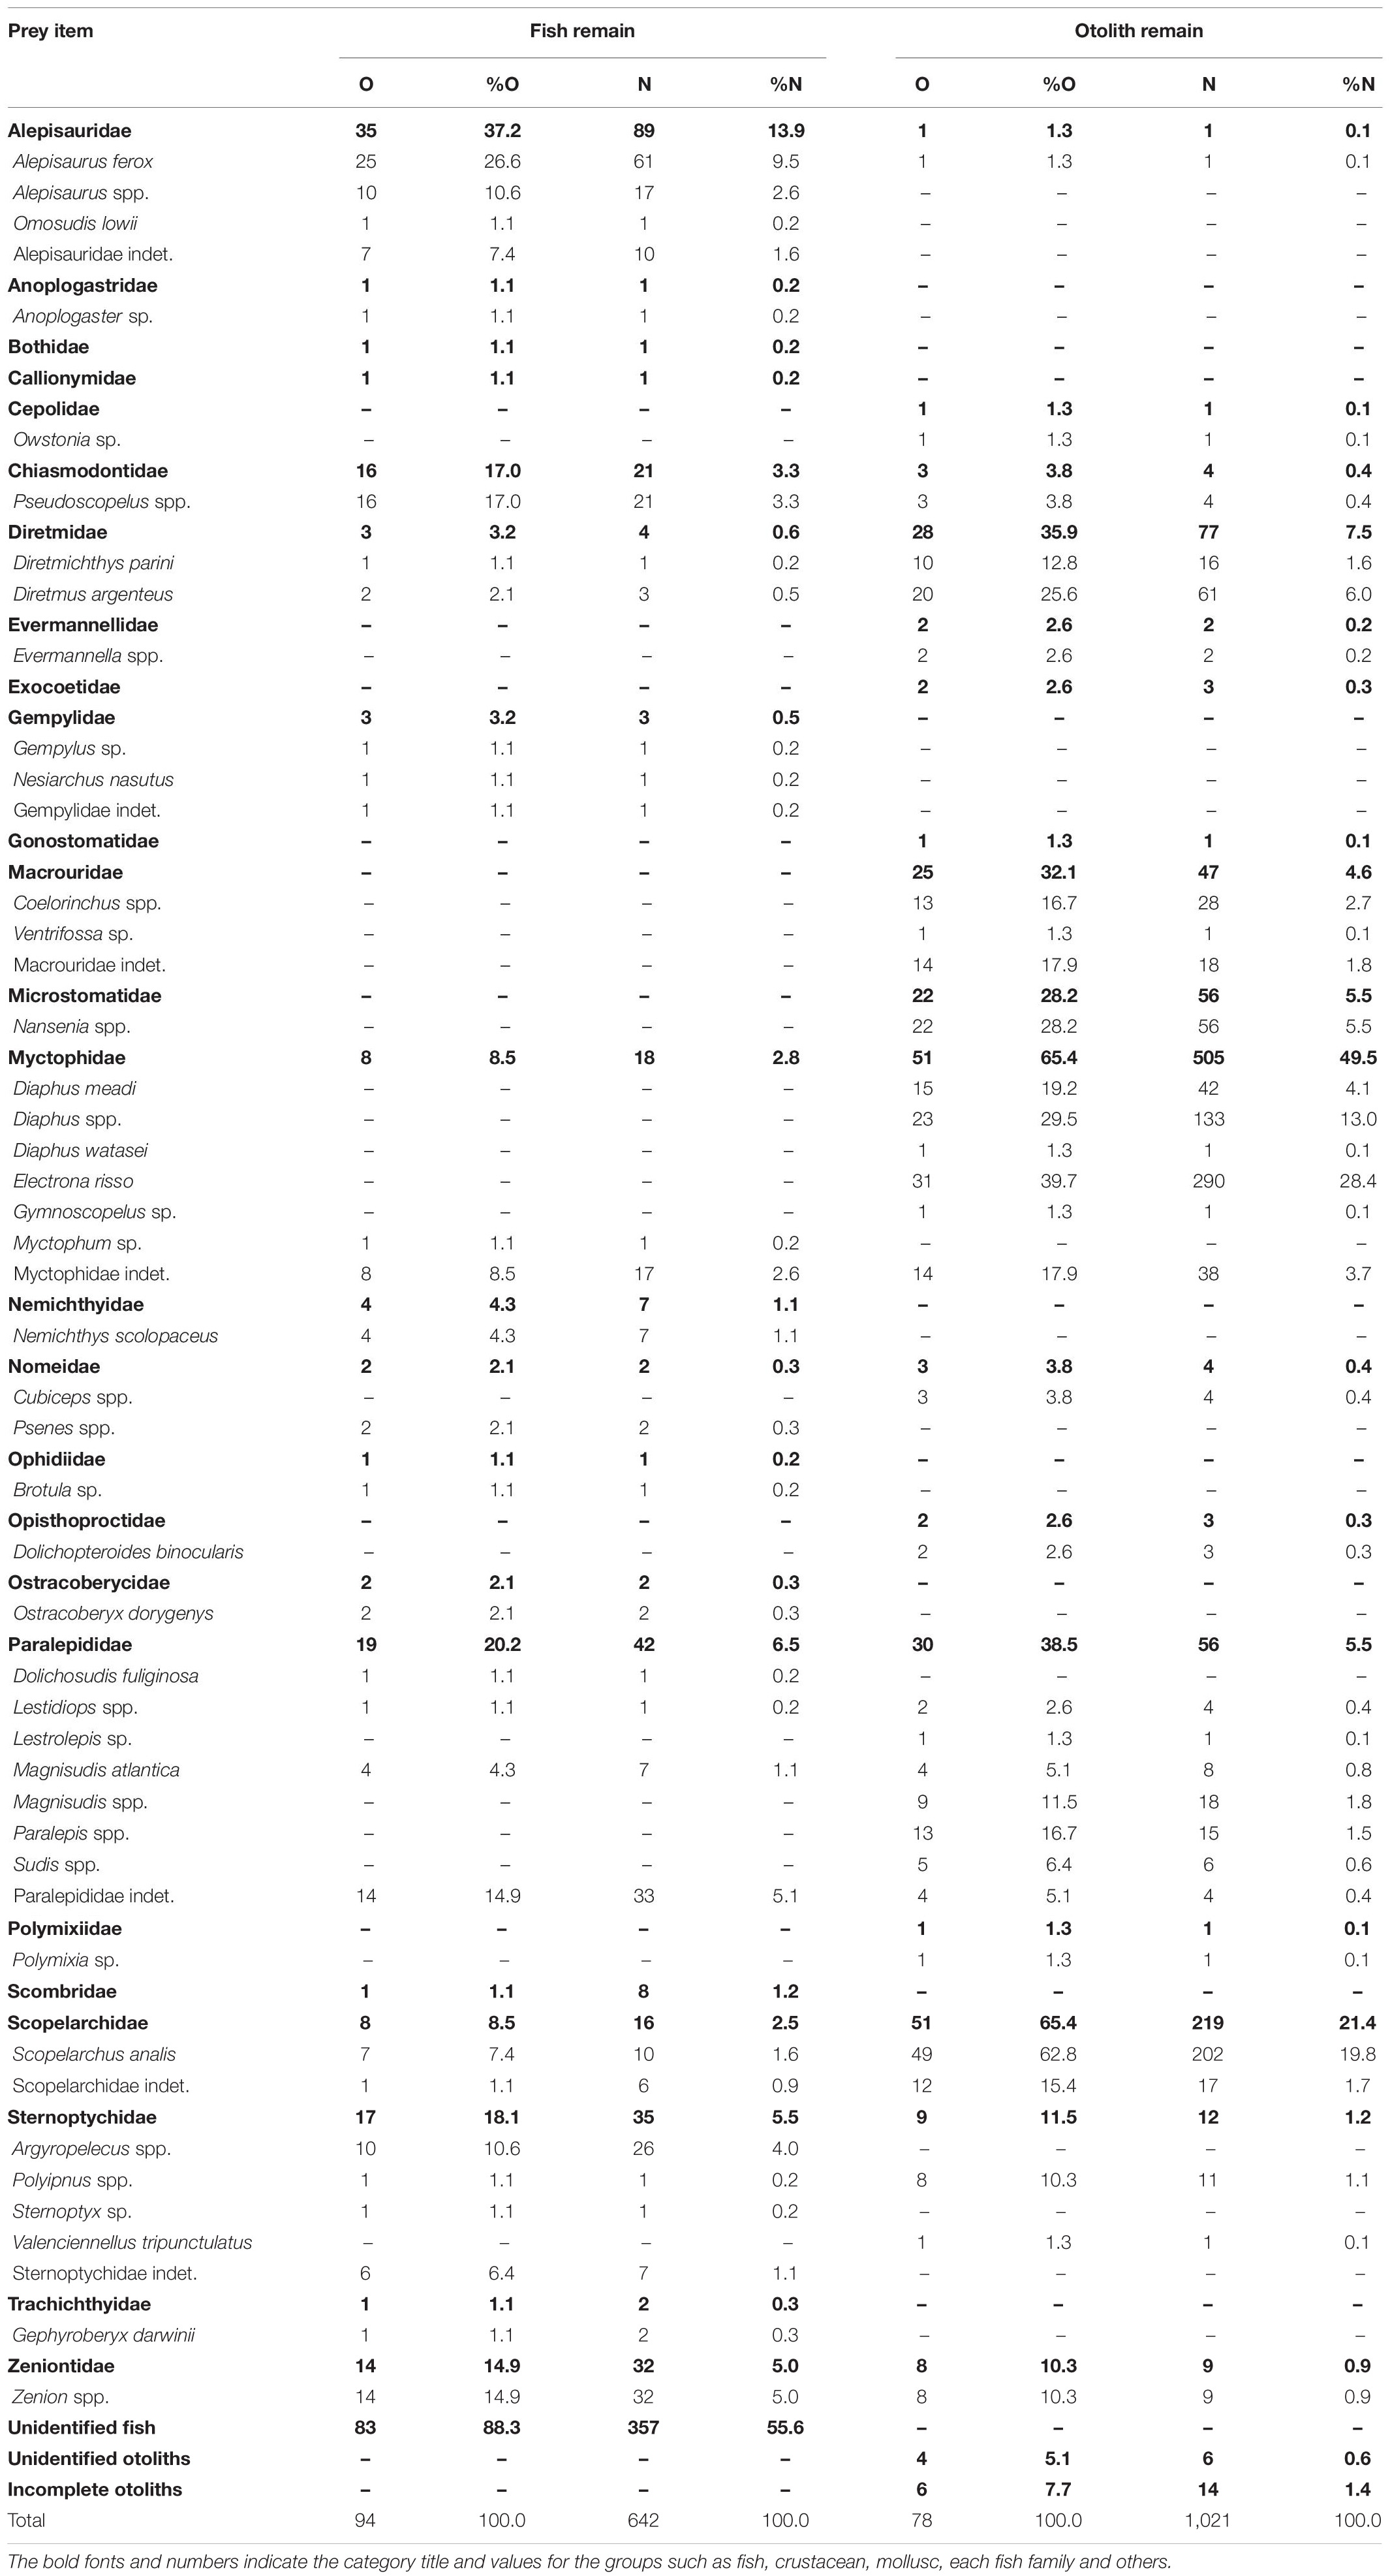
Table 2. Number of stomachs containing the prey item (O), percentage of occurrence (%O), number of prey items (N), and numerical percentage (%N) for fish and otolith remains of bigeye tuna Thunnus obesus.
Prey items identified in the fish and otolith remains were not completely consistent. Among the 53 assigned taxa, 12 items were found in both fish and otolith remains: Alepisaurus ferox (Alepisauridae); Pseudoscopelus (Chiasmodontidae); Diretmichthys parini and D. argenteus (Diretmidae); Myctophidae indet.; Lestidiops, Magnisudis atlantica, and Paralepididae indet.; Scopelarchus analis and Scopelarchidae indet.; Polyipnus (Sternoptychidae); and Zenion (Zeniontidae). Twenty fish remain items were not found in otolith remains. By contrast, 21 items were added only from the otolith remains, including Owstonia (Cepolidae); Evermannella (Evermannellidae); Exocoetidae indet.; Gonostomatidae indet.; Coelorinchus and Ventrifossa (Macrouridae); Nansenia (Microstomatidae); Diaphus meadi, D. watasei, Electrona risso, and Gymnoscopelus (Myctophidae); Cubiceps (Nomeidae); Dolichopteroides binocularis (Opisthoproctidae); Lestrolepis, Paralepis, and Sudis (Paralepididae); Polymixia (Polymixiidae); and Valenciennellus tripunctulatus (Sternoptychidae) (Table 2). This indicated that the otoliths support a finer-scale prey composition. Rarefaction curves calculated from both fish remains and otolith samples reached close to asymptotes. Through extrapolation, we estimated that the number of taxa at the family level would not increase substantially with greater sampling, indicating our collection provided solid sampling coverage (Figure 3).
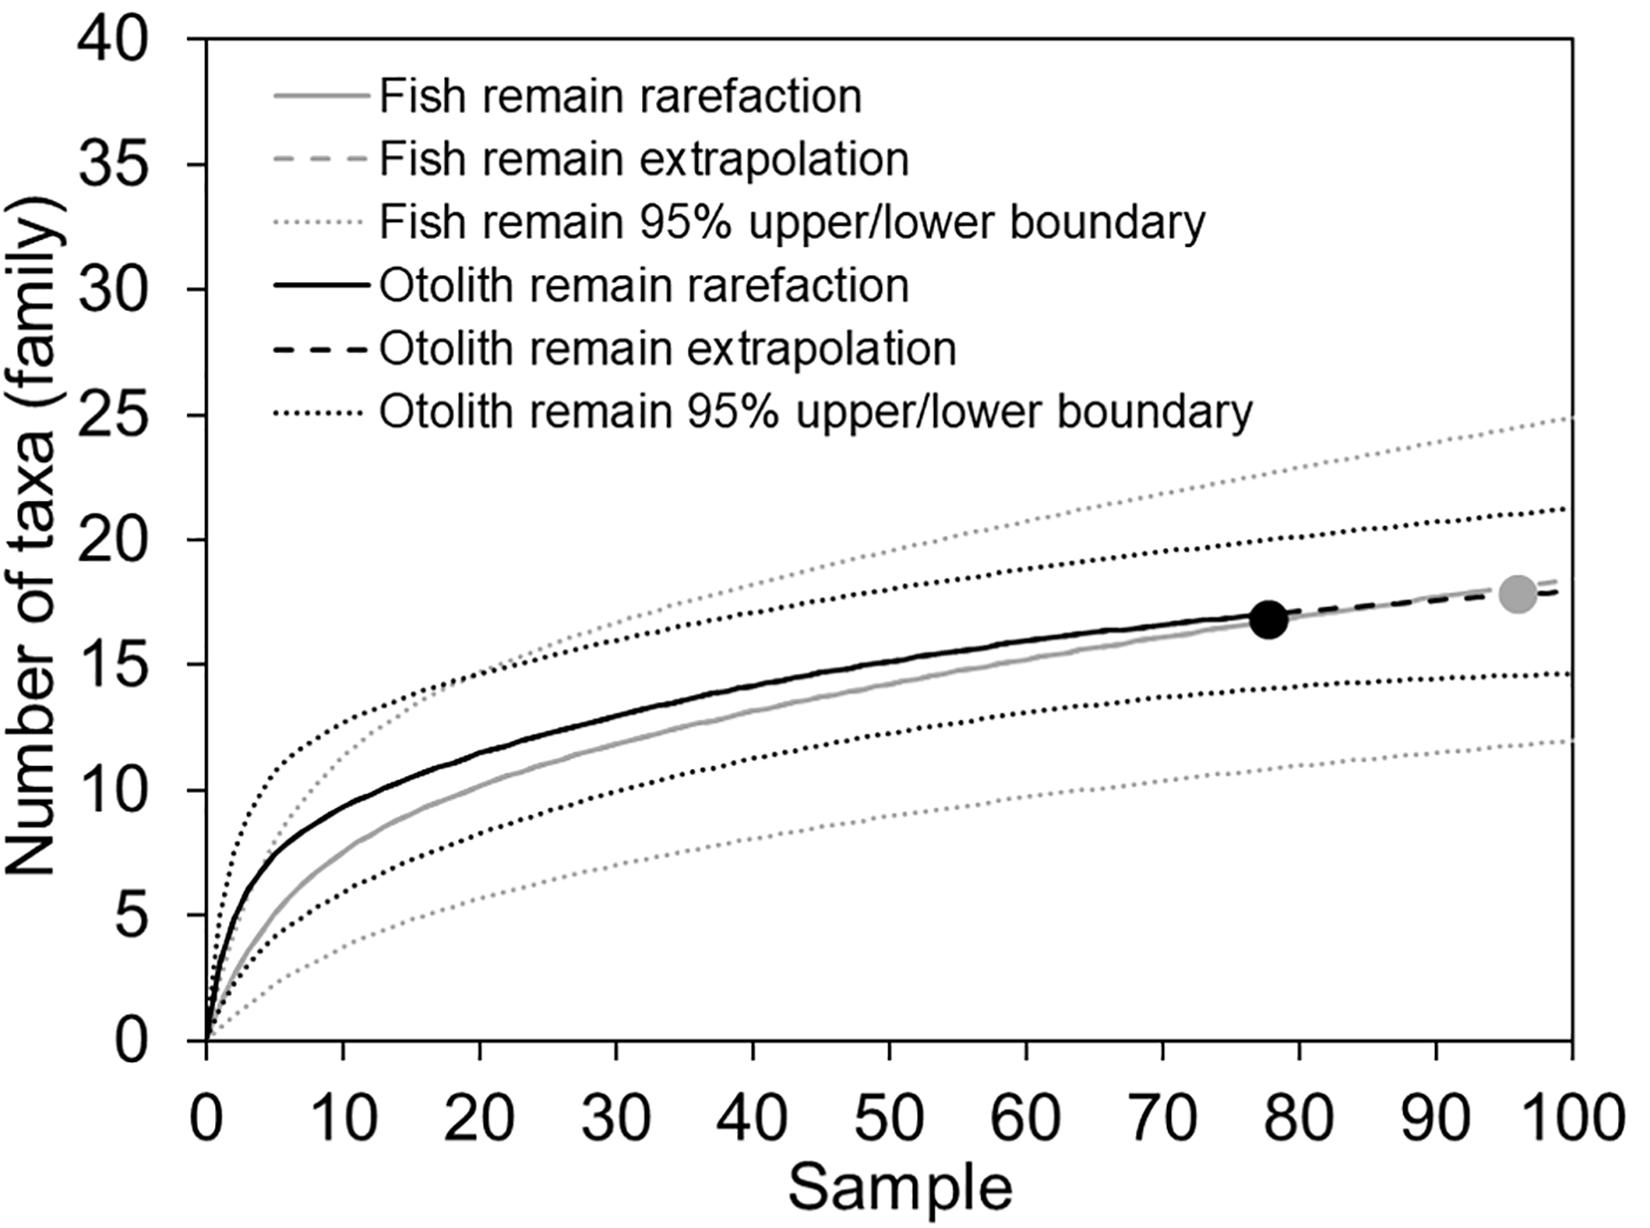
Figure 3. Sample-based rarefaction and extrapolation curves with 95% confidence intervals. Prey taxa are counted at family level. There were 94 and 77 reference samples for fish and otolith remains, respectively.
Contribution of Important Prey Items to Diet Composition
The contribution of prey items to stomach content composition was also inconsistent between fish and otolith remains. Excluding unidentified fish remains, Alepisauridae was the most important prey item, accounting for 13.9% (%N) of fish remains, followed by Paralepididae (6.5%), Sternoptychidae (5.5%), Zeniontidae (5.0%), Chiasmodontidae (3.3%), Myctophidae (2.8%), Scopelarchidae (2.5%), and others (all < 1.1%). The top seven dominant fish remain items contributed only approximately 40% of the accumulated %N. Different in either species composition or rank of dominant items, the top six otolith taxa contributed approximately 94% of %N. These were Myctophidae (49.5%), Scopelarchidae (21.4%), Diretmidae (7.5%), Microstomatidae (5.5%), Paralepididae (5.5%), and Macrouridae (4.6%). All other minor families were less than 1.2% (Figure 4A and Table 2).
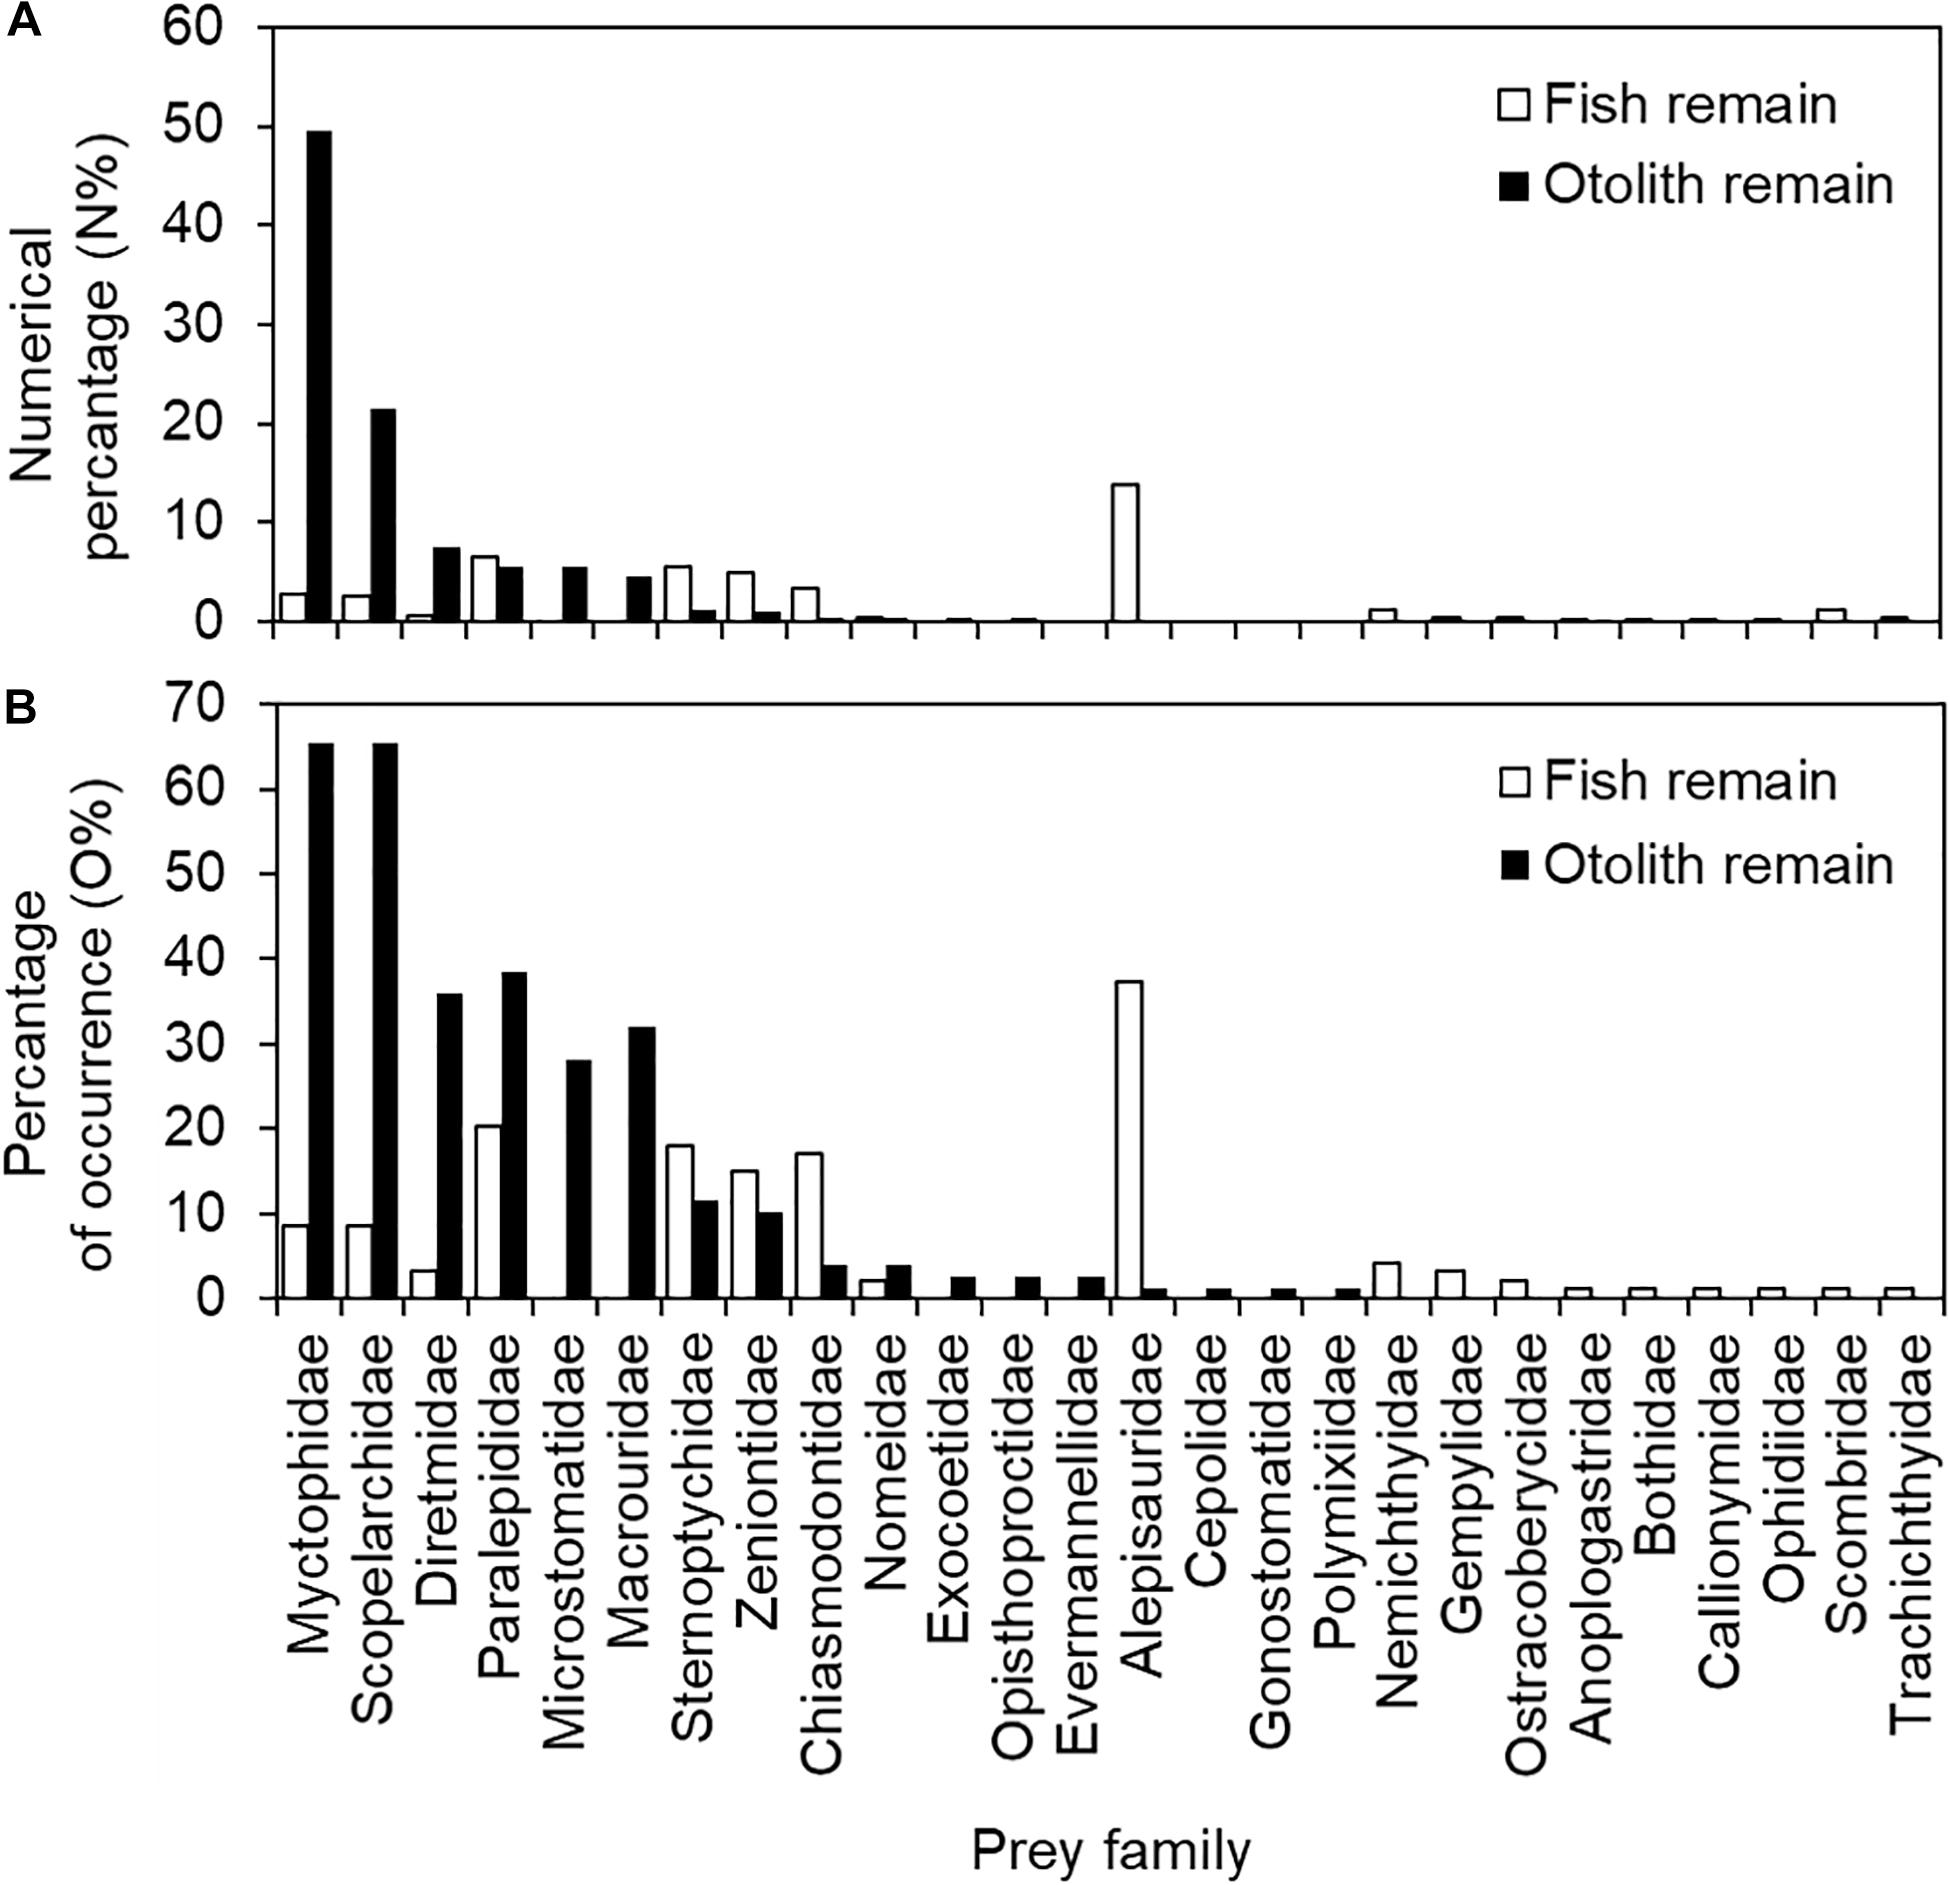
Figure 4. Numerical percentage (%N) and percentage of occurrence (%O) in (A) 94 fish remain-containing and (B) 78 otolith remain-containing stomachs of bigeye tuna (Thunnus obesus).
Regarding the prey item percentage of occurrence (%O) for the 94 fish remain-containing stomachs, it was 37.2% for Alepisauridae, followed by Paralepididae (20.2%), Sternoptychidae (18.1%), Chiasmodontidae (17.0%), Zeniontidae (14.9%), Myctophidae and Scopelarchidae (both 8.5%), and others (all < 4.3%). The %O for the 78 otolith remain-containing stomachs was also different from those of fish remains: Myctophidae (65.4%), Scopelarchidae (65.4%), Paralepididae (38.5%), Diretmidae (35.9%), Macrouridae (32.1%), Microstomatidae (28.2%), Sternoptychidae (11.5%), Zeniontidae (10.3%), and others (all <3.8%) (Figure 4B and Table 2). The values of %N and %O in the present study presented a similar pattern (Figure 4), thus preventing potential conflicts between the two indices.
Spatiotemporal and Biological Factors in Relation to Prey Composition
Figures 5, 6 present a comprehensive structure of prey composition (MN% by individual stomach) for both fish and otolith remains in relation to the four spatiotemporal and biological factors. Regarding the 10 important prey items in both remains, the MN% of the families Alepisauridae, Paralepididae, Sternoptychidae, Zeniontidae, Diretmidae, and Microstomatidae did not differ significantly between prey composition and either capture site and depth, month of catch, or tuna size (Kruskal–Wallis test, all P > 0.05). However, the prey compositions of Myctophidae, Scopelarchidae, and Macrouridae significantly differed by tuna size, where Myctophidae prey decreased significantly as the tuna FL increased (P = 0.004). By contrast, the composition of Scopelarchidae was higher in tuna with an FL of 128–138 cm compared with others (P = 0.004), and that of Macrouridae prey increased as the tuna FL increased (P = 0.005) (Figure 6). The composition of Chiasmodontidae exhibited a significant site effect (P = 0.004), but this is likely caused by the relatively small sample size (Figure 5).
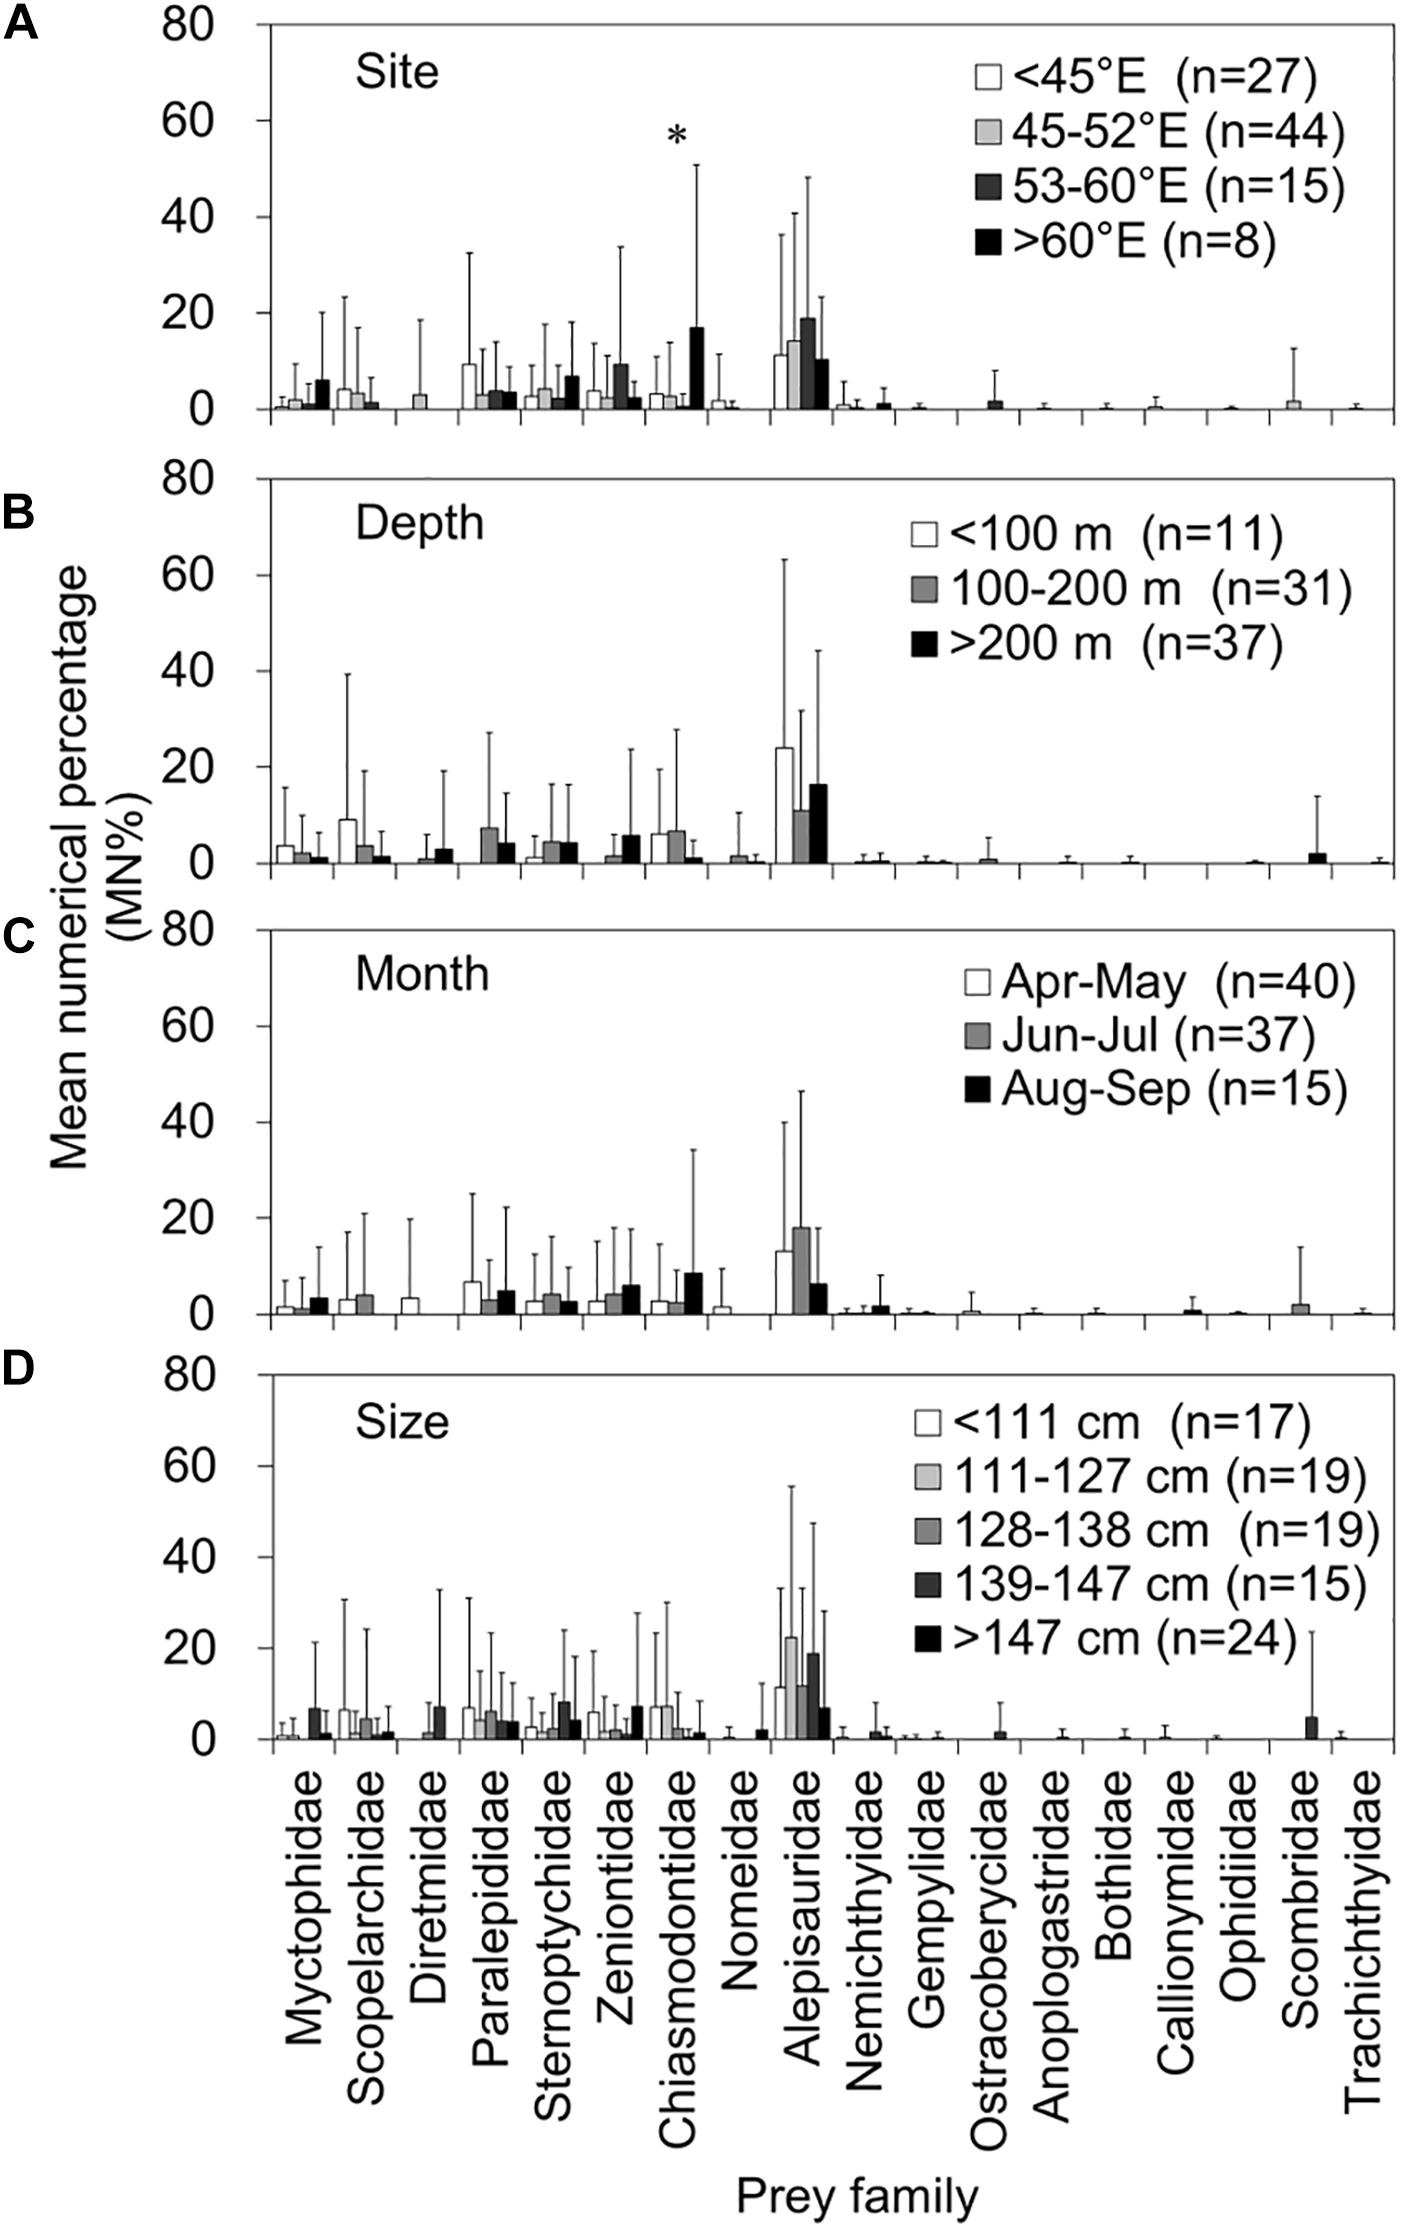
Figure 5. Mean numerical percentage (MN%) and standard deviations (vertical lines) of the prey item by prey family in 94 fish remain-containing stomachs of bigeye tuna (Thunnus obesus) by (A) capture site, (B) depth, (C) month, and (D) fish size. The asterisks indicate levels of significance: *0.05.
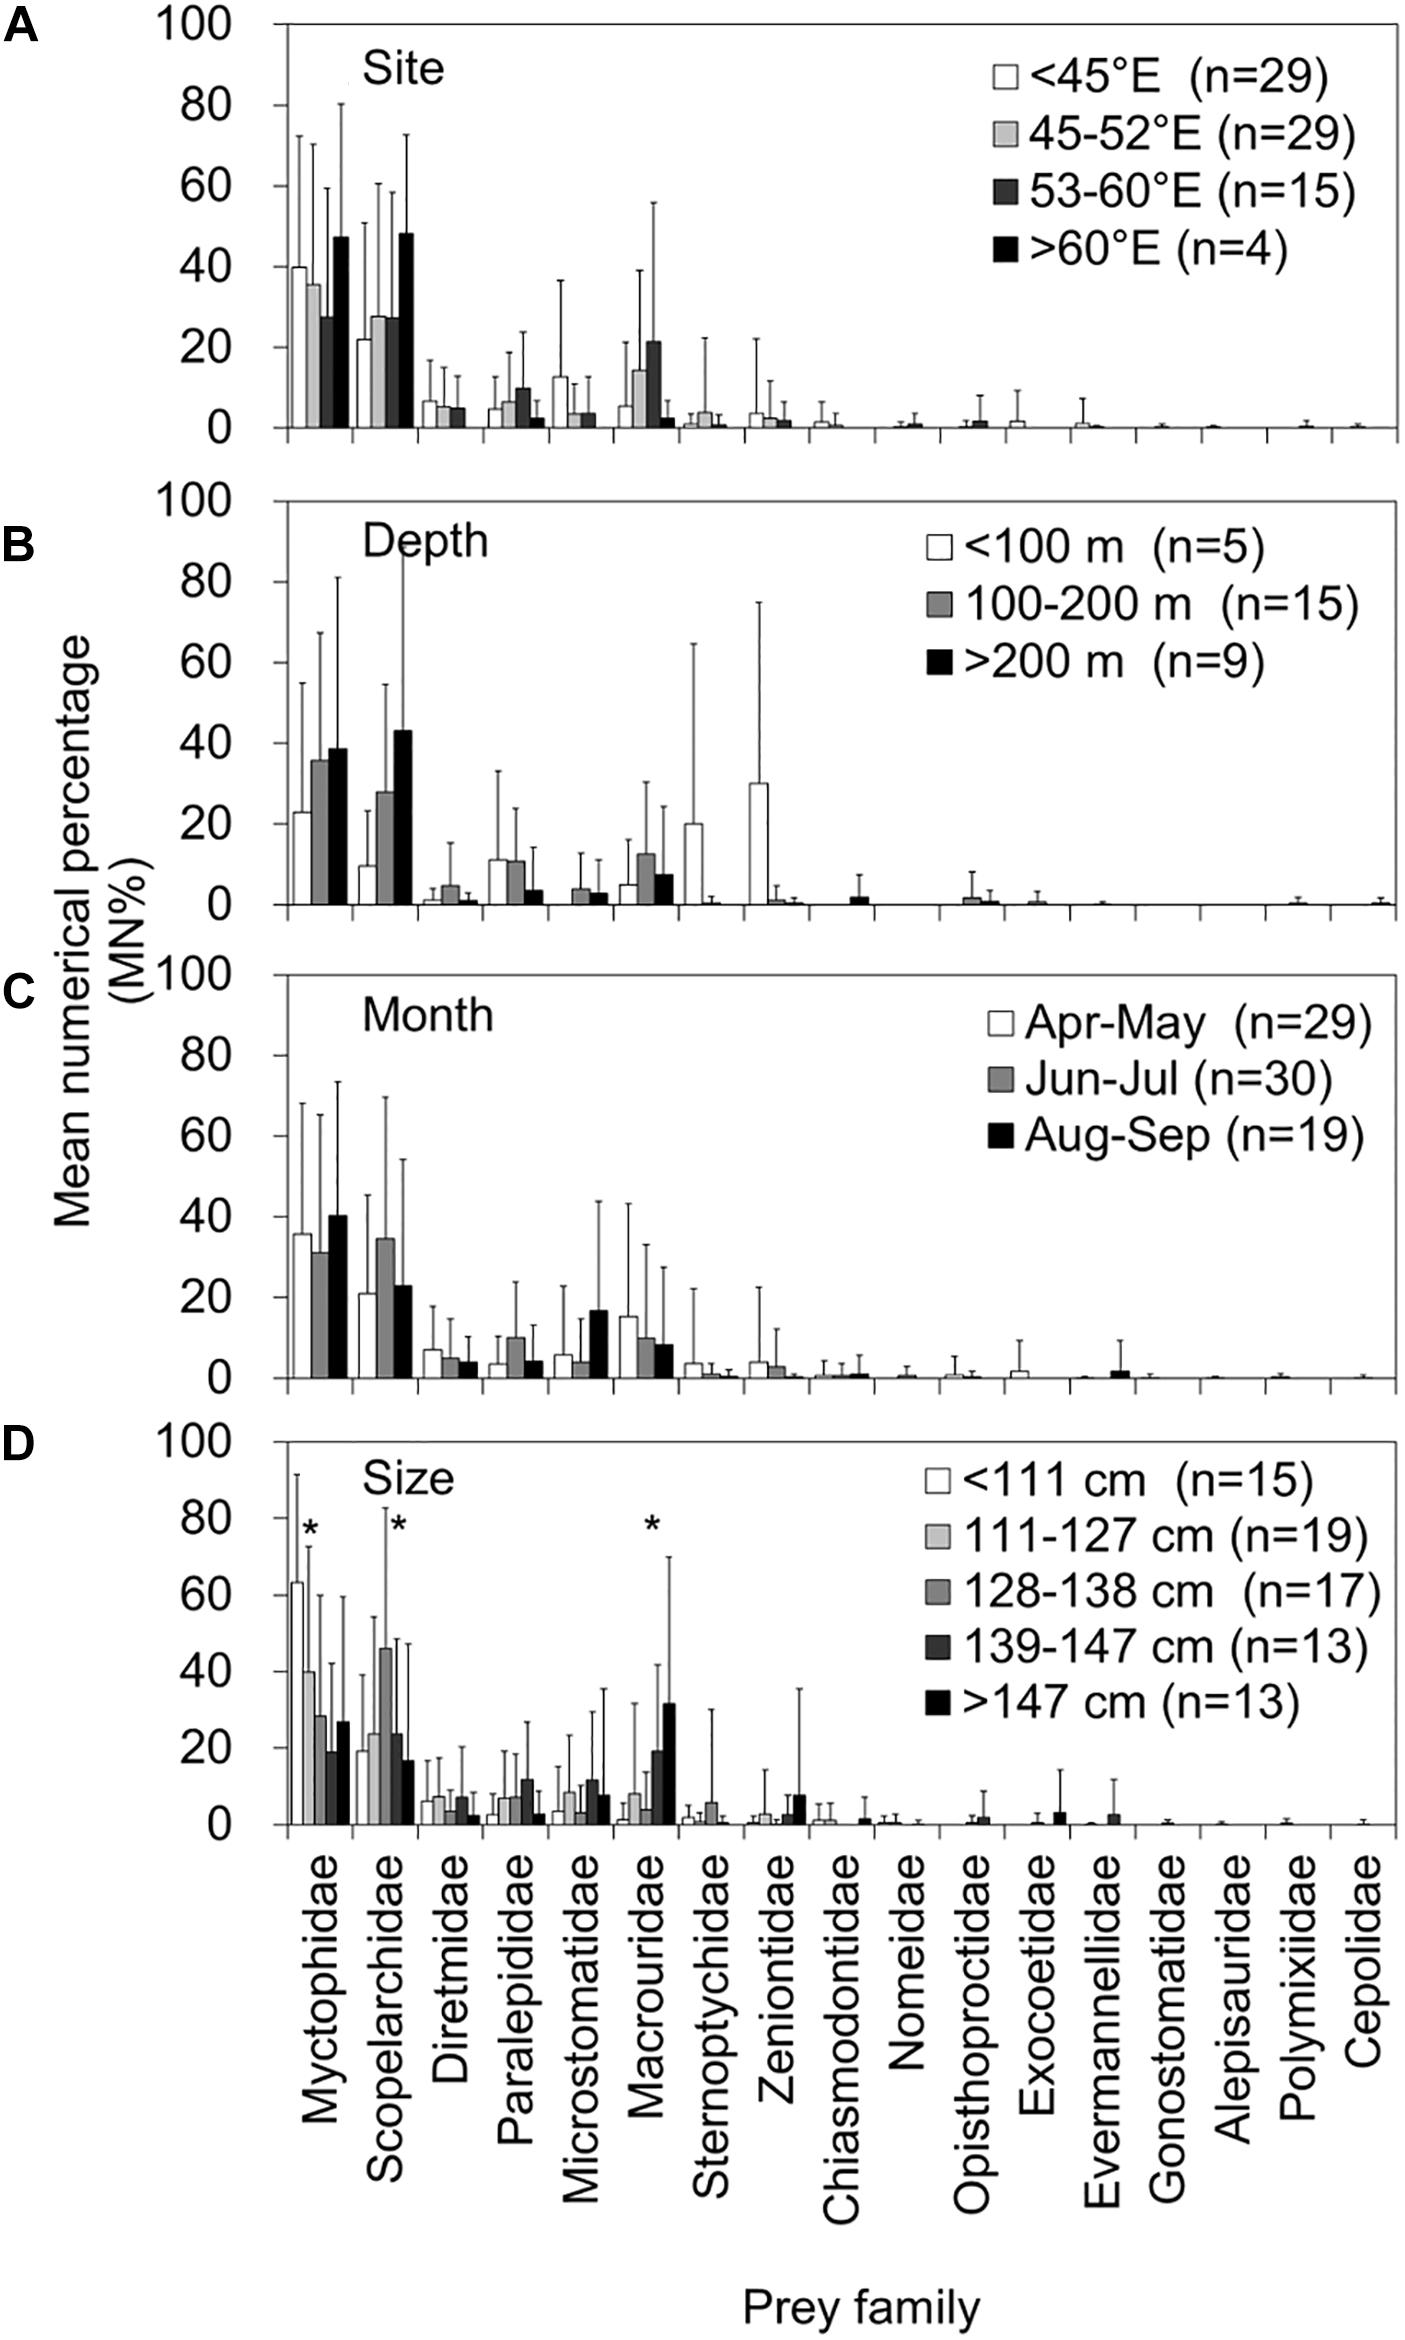
Figure 6. Mean numerical percentage (MN%) and standard deviations (vertical lines) of the prey item by prey family in 78 otolith remain-containing stomachs of bigeye tuna (Thunnus obesus) by (A) capture site, (B) depth, (C) month, and (D) fish size. The asterisks indicate levels of significance: *0.05.
Size-Related Shift in Dominant Prey Items
The two most abundant prey species of otolith remains were Electrona risso (n = 290, Myctophidae) and Scopelarchus analis (n = 202, Scopelarchidae) (Table 2). The OL for E. risso ranged from 2386.2 to 4392.7 μm (n = 277), and it was in the range of 2306.0–5217.7 μm (n = 195) for S. analis. Changes in OLs by tuna capture months were not consistent for either prey species. Moreover, the OLs did not differ with respect to tuna capture depths (ANOVA, P = 0.056 and 0.138) but significantly differed by tuna capture sites (P < 0.001 and 0.05, respectively) and tuna size (both P < 0.001) for both prey species. The mean OLs of both E. risso (3,598–3,780 μm) and S. analis (3,686–4,077 μm) were significantly larger for larger tuna (>111 cm FL) than it was for the smallest tuna (3,480 μm for E. risso and 3,131 μm for S. analis). This size-related selective prey target indicated that larger bigeye tunas feed on larger individuals of the same prey species (Figure 7).
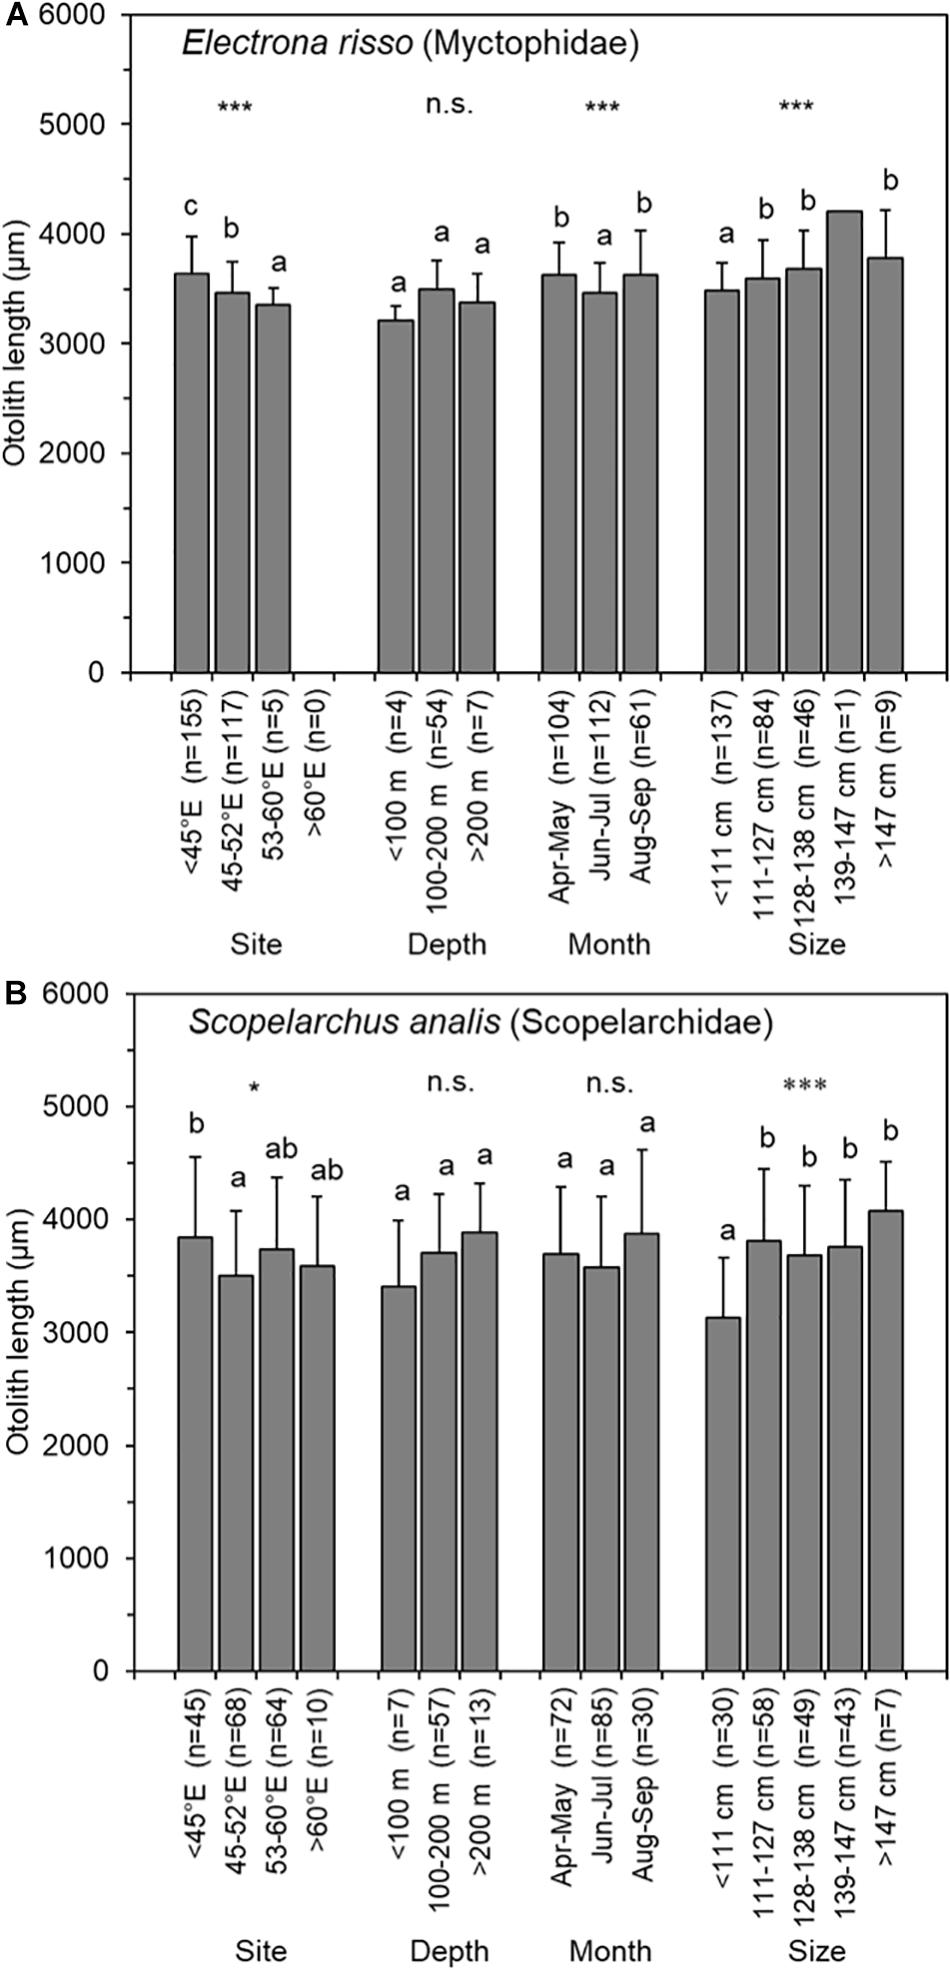
Figure 7. Means and standard deviations (vertical lines) of prey otolith length of (A) Electrona risso (Myctophidae) and (B) Scopelarchus analis (Scopelarchidae) in 78 otolith-containing stomachs of bigeye tuna (Thunnus obesus) by capture site, depth, month, and fish size. The asterisks indicate levels of significance: *0.05, ***0.001; n.s., not significant. The same letter indicates that otolith lengths were homogeneous among the groups.
The least-squares regression between tuna size and prey OL revealed a significantly positive relationship for both E. risso and S. analis (both P < 0.001). However, because of great variations in prey otolith size consumed by tuna of specific sizes, the upper (95th quantile) and lower (5th quantile) boundaries of prey–predator sizes were only positively regressed for E. risso (P = 0.040) and S. analis (P < 0.001) (Figure 8). Nevertheless, these results again supported larger bigeye tuna feeding on larger prey.
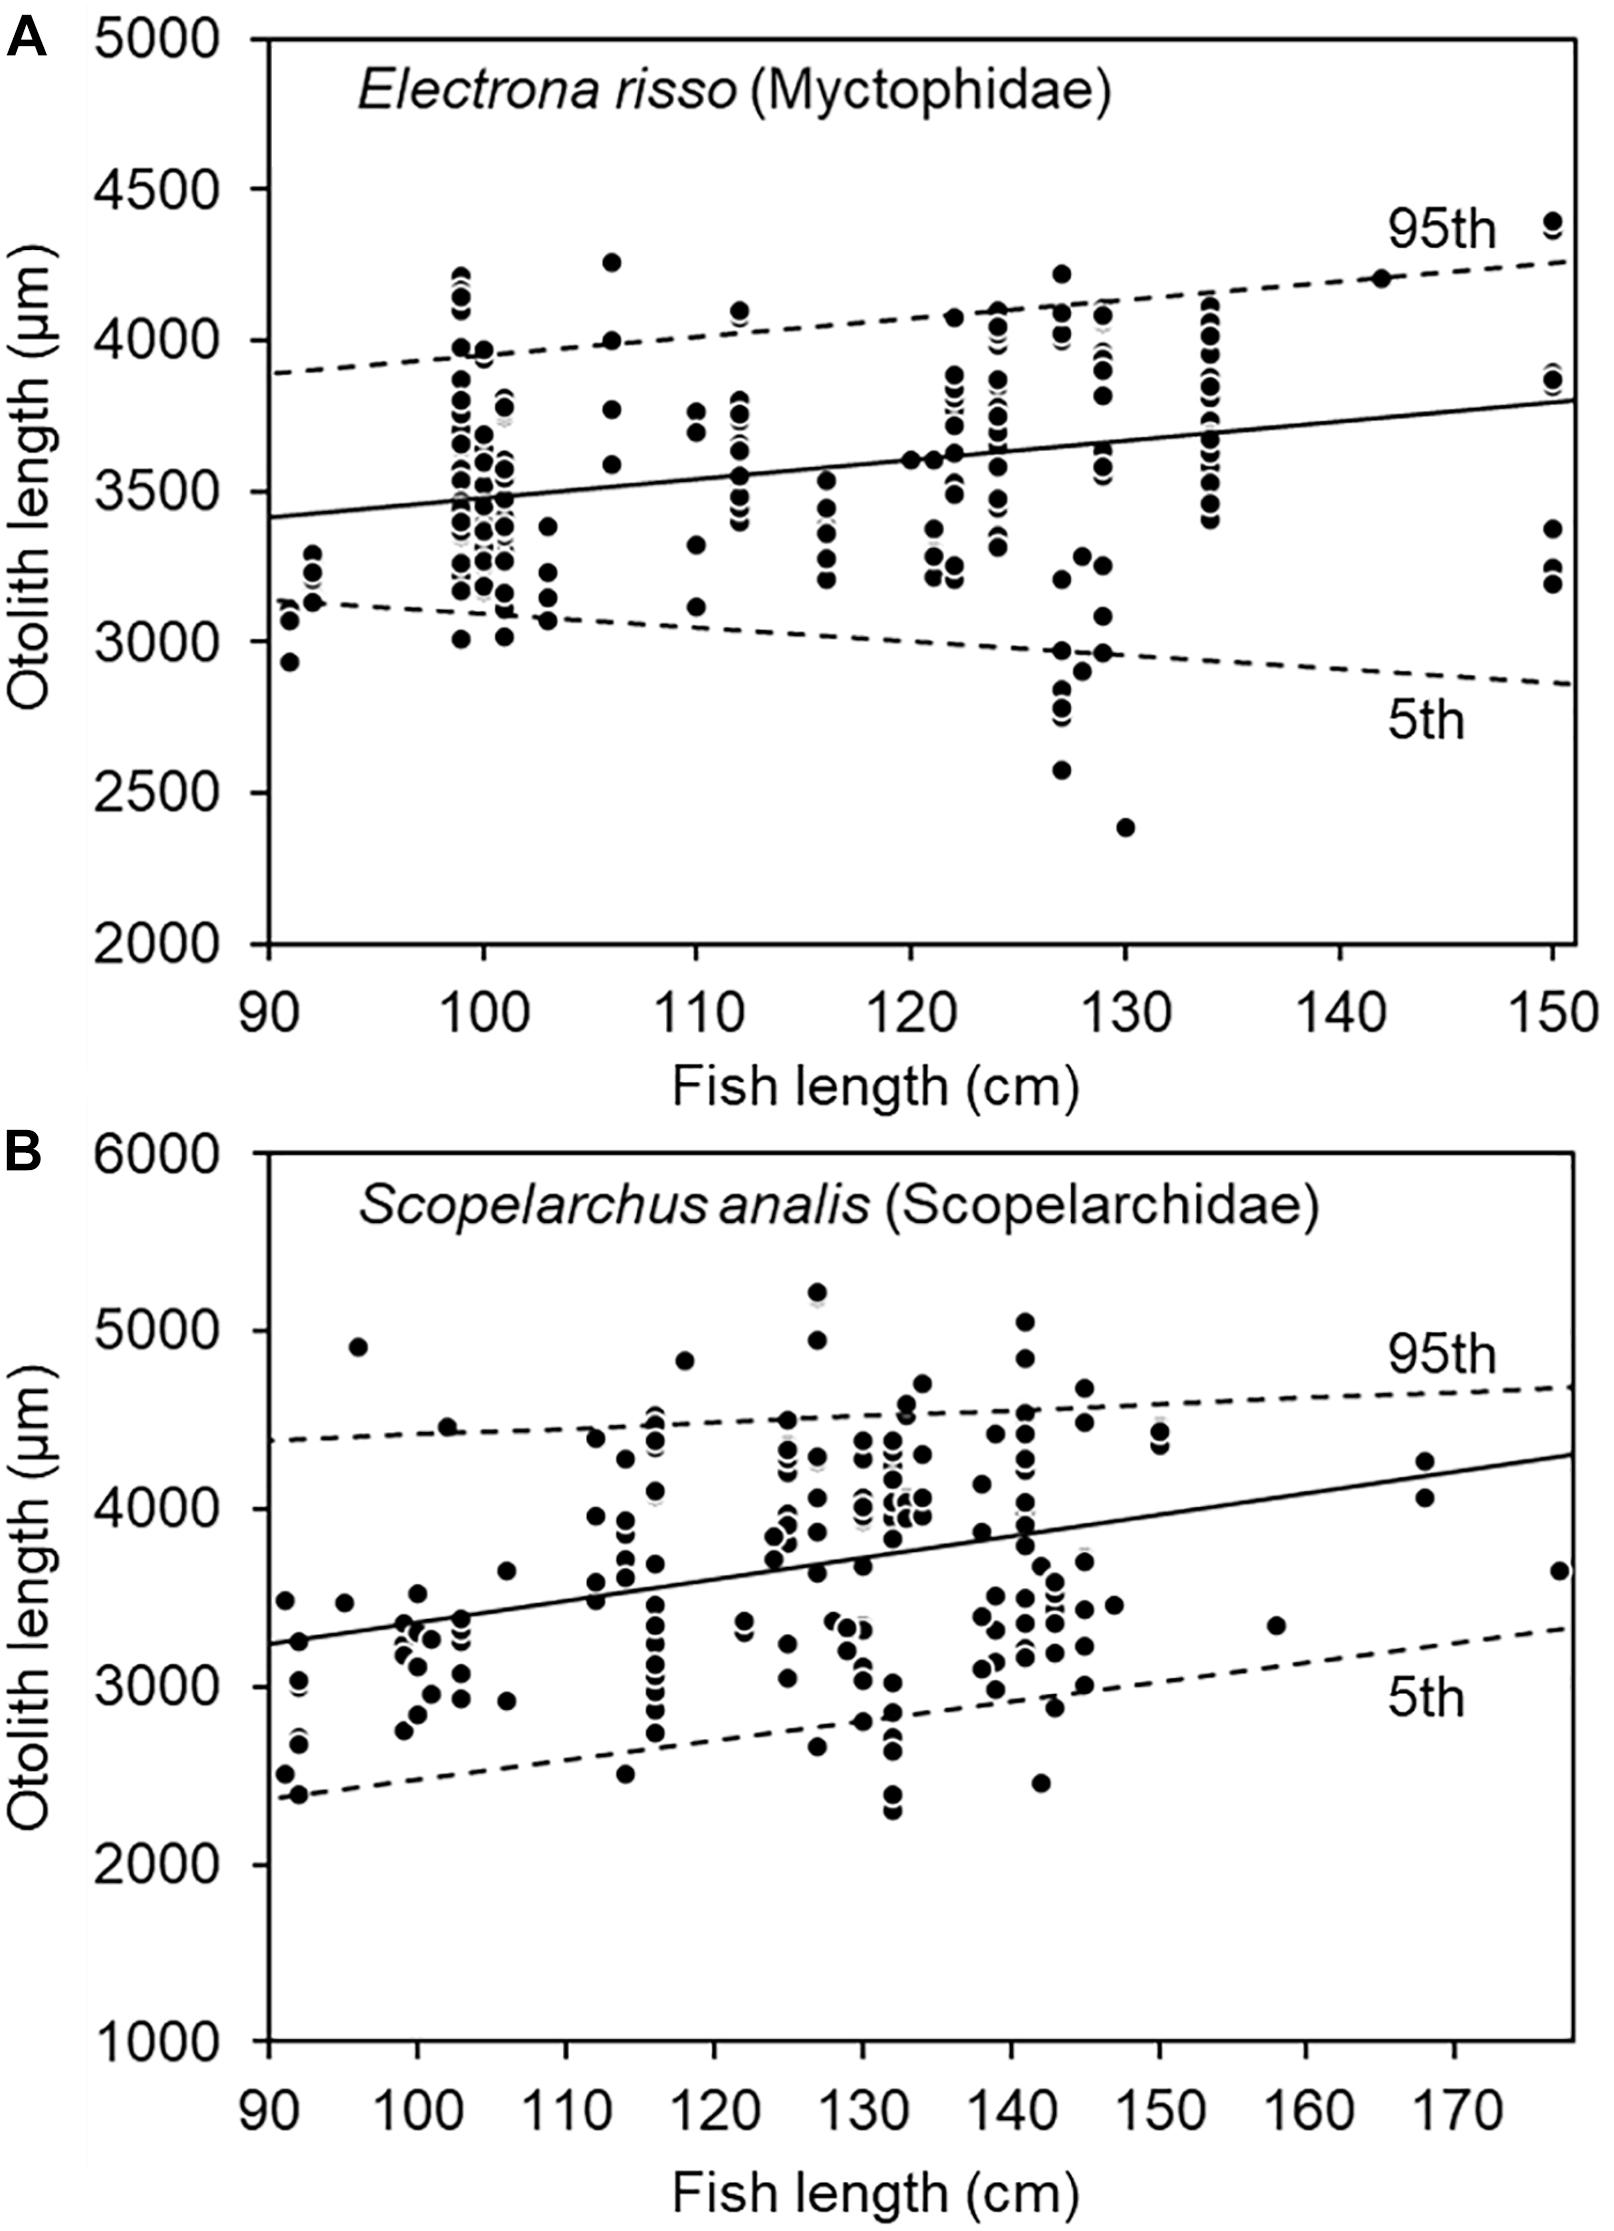
Figure 8. Relationship between fish length of bigeye tuna (Thunnus obesus) and prey otolith length of (A) Electrona risso (Myctophidae) and (B) Scopelarchus analis (Scopelarchidae). The solid lines indicate the least-squares regression and dotted lines the 95th and 5th quantile regressions.
Discussion
Diet Composition of Bigeye Tuna in the Western Indian Ocean: Similarities and Differences
Overall, our results agreed well with those of relevant studies in that teleosts, cephalopods, and crustaceans are the top three major categories consumed by the bigeye tuna. In particular, teleosts are their primary target in terms of %O, %W, and computed IRI (Table 1).
Our result of 56 fish taxa in 26 families (both fish and otolith remains) for the diet of bigeye tuna in the Indian Ocean can be regarded as significant in terms of taxonomic diversity. For example, three previous studies that did not examine otolith remains in stomachs yielded fish prey items of 42 taxa belonging to 29 families (Kornilova, 1980; n = 534 stomachs), 20 families (Bashmakov et al., 1991; n = 56), and eight taxa belonging to six families (Potier et al., 2004; n = 29). Our results are consistent with the findings of Potier et al. (2004) from the same region, where the occurrence of Scopelarchidae, Alepisauridae, Paralepididae, Myctophidae, Diretmidae, and Nomeidae were commonly recorded. By contrast, Kornilova (1980) and Bashmakov et al. (1991) have discovered more nearshore prey items, including Acanthuridae, Sparidae, and Serranidae, which were not reported elsewhere. Although the result of diet composition is primarily related to sample size, we were able to reveal additional prey taxa in fish and otolith remains (five and six families, respectively) as newly recorded food items of bigeye tuna. In addition, new lower taxa including Omosudis lowii (Alepisauridae); Gempylus and Nesiarchus nasutus (Gempylidae); Dolichosudis fuliginosa (Paralepididae), Argyropelecus (Sternoptychidae); and Gephyroberyx darwinii (Trachichthyidae) in fish remains and Diaphus meadi, D. watasei, Electrona risso, and Gymnoscopelus (Myctophidae); Lestrolepis (Paralepididae); and Valenciennellus tripunctulatus (Sternoptychidae) in otolith remains were further recorded. These newly recorded taxa not found in previous studies mainly belong to deep-water mesopelagic species, and they constitute a marginal proportion of the total diet composition (Table 1). For newly recorded fish remains, since other similar taxa were recorded, no evidence existed that their carcasses are more rapidly digested and difficult to identify, and these were not observed in previous studies. Similarly, for the otoliths, these new taxa do not have particularly thick or large otoliths that are resistant to digestion with respect to other mesopelagic taxa. We therefore concluded that these new taxa reflect prey items not consumed historically and/or that were overlooked in previous studies that did not use otoliths.
Taxonomical work on fish otoliths essentially relies on the coverage of reference collections and regional otolith atlases (e.g., Smale et al., 1995). Along with the creation of more collections and references, a higher taxonomic resolution on stomach content diversity, either for fish and otolith remains, is expected to be revealed.
Through a detailed comparison of identifications of both fish and otolith remains and the subsequent independent prey content analyses, we further indicated that otoliths indeed provide a more diverse composition than do fish carcasses alone. This is, however, not only because of a potential higher taxonomical resolution in otoliths but also, to a lesser extent, a broader spectrum of taxonomic composition documenting more families.
The main difference in prey composition between fish and otolith remains is that large fish such as Alepisaurus ferox are more frequently found as carcasses. By contrast, much smaller mesopelagic taxa are only left as isolated otoliths. Such an effect of digestion could result in overestimation in specific prey taxa when using either remains as a single approach (see below).
Use of Otoliths in Stomach Content Analysis: Advantages and Caveats
Fish prey recovered from the alimentary canal of a piscivore can be identified based on fresh and accumulated remains; for example, teeth, otoliths, spines, and occasionally bones. Otoliths, which are taxon-specific, are composed of hard tissue and enclosed by cranial bones that protect them from direct exposure to digestive acids. They are typically easier to recognize by well-trained specialists compared with half-digested fish carcasses, and they are less affected by acid erosion than other parts of a fish. They are thus extensively used to identify the stomach contents of cetaceans (Fitch and Brownell, 1968), seals (Pierce et al., 1991), sharks (Joyce et al., 2002), other large piscivores (Clarke et al., 1995; Watanabe et al., 2004), and sea birds (Neves et al., 2012). The rarefaction curves, extrapolation, and narrow range of 95% confidence intervals for both fish remains and otoliths suggest that the sampling effort was, on the whole, sufficient to characterize diet composition (Figure 3). When extrapolated, however, the diversity of otoliths would likely be slightly higher than that obtained from the fish remains.
Although otoliths have traditionally been used in studying piscivores’ feeding ecology (Jobling and Breiby, 1986), they are often ignored. The primary reason is probably that few taxonomic specialists assist in their identification, which would otherwise be a challenging task to accomplish. However, several other limitations may still have influenced our results. First, most studies have regarded otoliths as accumulated food items, similar to beaks, eye lens, mandibles, and parasphenoids, which were excluded from the analysis because they might have overemphasized the importance of certain prey items (Potier et al., 2007, 2008). Extremely tiny otoliths may have been easily digested, eroded, or lost during the preparation process. Lastly, the otoliths observed may have been the result of secondary predation.
Studies have shown that bigeye tuna forage at both the surface and at depths of 400–500 m (Dagorn et al., 2000; Potier et al., 2004; Ohshimo et al., 2018), implying that a longline catch–based dietary analysis alone might only reflect the food consumed at shallower depths (i.e., less than approximately 200 m), where longline gears operate. The prey items consumed in deeper waters may have been digested for an extended period; consequently, using otolith remains as an identification tool may provide comprehensive results indicating the food items naturally available at deeper depths. Therefore, using both fish and otolith remains would not overemphasize certain prey items in the case of bigeye tuna.
The size of the otoliths examined in this study ranged from 690 to 5,730 μm. Relevant studies have reported that Alepisaurus ferox is a principal bigeye tuna prey item (Kornilova, 1980; Potier et al., 2004). However, only one A. ferox otolith specimen was observed in this study, which might be attributed to its extremely small size (690 μm). Furthermore, if many of the Alepisauridae remains were intact, there would be fewer free otoliths relative to prey with more rapidly digested soft tissue. Moreover, Tetraodontiformes have been reported as bigeye tuna prey items (Bashmakov et al., 1991; Young et al., 2010). This taxon was not observed in this study either because its otoliths are generally less than 1,000 μm in length (Nolf, 1985; Lin and Chang, 2012). However, in both cases, their fish remains would have been easy to recognize; A. ferox has a characteristic long-bodied form that is usually large in size, and tetraodontiforms have a solid body that is more resistant to digestive fluid.
In addition, the otoliths observed may have been consumed by piscivorous prey rather than by bigeye tuna. This condition is of particular concern regarding the consumption of Paralepididae, Gempylidae, and other medium-sized predators (Kornilova, 1980; Bashmakov et al., 1991; Ménard et al., 2000; Young et al., 2010). Cannibalism among Alepisaurus spp. is also common (Young et al., 2010) and may have affected the results. Although these isolated otoliths would likely experience advanced erosion on the surface and be excluded from the analysis, this secondary predation could result in major bias in the study.
Spatiotemporal and Biological Variations in Bigeye Tuna Foraging
Bigeye tuna prey item composition did not differ with site, depth, or time. This is likely because bigeye tuna are highly mobile and can move vertically in the water column; thus, the depth of capture would not affect the overall prey composition (Hanamoto, 1987; Dagorn et al., 2000; Bertrand et al., 2002; Musyl et al., 2003). Teleost assemblages may differ in response to seasonal changes, but because summer season samples were not acquired for analysis, this potential temporal factor did not affect prey composition. During the sampling period (April–September), the prey items did not differ substantially; instead, they presented ontogenetic changes.
A significant result of the present study was the revelation of a shift in both diet composition and prey size from small to large bigeye tuna. Myctophidae and Scopelarchidae are small prey and foraged abundantly by small bigeye tuna. By contrast, large prey, such as Macrouridae, are consumed by large bigeye tuna (Figure 6). More interestingly, evident by the dimension of otolith remains, larger bigeye tuna feed on larger prey of the same taxon (Figures 7, 8), which agrees well with the size dependence in opportunistic predation in tuna reported by Ménard et al. (2006) and Ohshimo et al. (2018).
Conclusion
This study improves the taxonomic resolution of fish prey items, many of which were reported here for the first time. The study demonstrated that diet changes in both prey composition and size can be related to the ontogeny of bigeye tuna. Moreover, the result of the ontogenetic shift in prey item and size suggests a rather rapid change in the trophic level during the life history of bigeye tuna; therefore, understanding the diet composition of this species alludes to a rough index of energetic flux in a regional marine ecosystem and remains for further investigation. Hence, the results provide a more precise scale and analysis of diversified content of the prey fish composition of bigeye tuna in the Indian Ocean.
Despite several caveats, the attempt of our study based on both fish and otolith remains led to a more comprehensive interpretation of the composition of fish prey. Our material provides a unique window into the feeding habits of bigeye tuna more than a decade ago. Multiple-year studies in the future would still be needed and beneficial for delineating whether the entire fish prey composition of bigeye tuna has changed over time under anthropogenic disturbance (cf. Duffy et al., 2017). Genetic barcode analysis could provide substantial improvements regarding the unidentifiable prey items (Jakubavièiûtë et al., 2017), and stable isotope analysis, including nitrogen stable isotopes, could help to elucidate trophic level shifts through ontogeny (Chung et al., 2019).
Data Availability Statement
The raw data supporting the conclusions of this article will be made available by the authors, without undue reservation, to any qualified researcher.
Ethics Statement
Ethical review and approval was not required for the animal study because ethical review and approval were not required for the animal study because the study is using the fisheries catch.
Author Contributions
C-HL identified the otoliths and drafted the manuscript. J-SL identified the fish remains. K-SC processed the stomach samples. M-HC and C-YC designed and directed the project. C-WC led the work and analyzed the data. All authors contributed to the manuscript’s preparation.
Funding
This study was financially supported by the Council of Agriculture [95AS-14.1.2-FA-F1(12), 96AS-15.1.2-FA-F2, and 98ADF-FA-14(3)] and the Ministry of Science and Technology (NSC100-2631-H-291-001 and MOST103-2611-M-291-002) of Taiwan.
Conflict of Interest
The authors declare that the research was conducted in the absence of any commercial or financial relationships that could be construed as a potential conflict of interest.
Acknowledgments
We are indebted to Dirk Nolf of the Royal Belgian Institute of Natural Sciences in Brussels, Belgium for the assistance with otolith identification at the early stage of the study, and also to Ciao-Yun Hung of the Graduate Institute of Marine Biology, National Dong Hwa University, Taiwan for OL measurement. We thank the editor and two reviewers for their constructive comments on the manuscript. This manuscript was edited by Wallace Academic Editing.
References
Bashmakov, V. F., Zamorov, V. V., and Romanov, E. V. (1991). “Diet composition of tunas caught with long lines and purse seines in the western Indian Ocean,” in TWS/91/31 Workshop on Stock Assessment of Yellowfin Tuna in the Indian Ocean, ed. IPTP (Colombo, Sri Lanka: IPTP), 53–59.
Battaglia, P., Malara, D., Romeo, T., and Andaloro, F. (2010). Relationships between otolith size and fish size in some mesopelagic and bathypelagic species from the Mediterranean Sea (Strait of Messina, Italy). Sci. Mar. 74, 605–612. doi: 10.3989/scimar.2010.74n3605
Bertrand, A., Bard, F. X., and Josse, E. (2002). Tuna food habits related to the micronekton distribution in French Polynesia. Mar. Biol. 140, 1023–1037. doi: 10.1007/s00227-001-0776-3
Chung, M.-T., Trueman, C. N., Godiksen, J. A., Holmstrup, M. E., and Grønkjær, P. (2019). Field metabolic rates of teleost fishes are recorded in otolith carbonate. Commun. Biol. 2:24.
Clarke, M. R., Clarke, D. C., Martins, H. R., and Silva, H. M. (1995). The diet of sword-fish (Xiphias gladius) in Azorean waters. Arquipeìlago 13A, 53–69.
Colwell, R. K. (2013). EstimateS: Statistical estimation of species richness and shared species from samples. Version 9. Guide and application User’s. Available online at: http://purl.oclc.org/estimates
Cortés, E. (1997). A critical review of methods of studying fish feeding based on analysis of stomach contents: application to elasmobranch fishes. Can. J. Fish. Aquat. Sci. 54, 726–738. doi: 10.1139/f96-316
Cortés, E. (1998). Methods of studying fish feeding: reply. Can. J. Fish. Aquat. Sci. 55:2708. doi: 10.1139/f98-159
Cortés, E. (1999). Standardized diet compositions and trophic levels of sharks. ICES J. Mar. Sci. 56, 707–717. doi: 10.1006/jmsc.1999.0489
da Silva, G. B., Hazin, H. G., Hazin, F. H. V., and Vaske, T. Jr. (2019). Diet composition of bigeye tuna (Thunnus obesus) and yellowfin Tuna (Thunnus albacares) caught on aggregated schools in the western equatorial Atlantic Ocean. J. Appl. Ichthyol. 35, 1111–1118. doi: 10.1111/jai.13949
Dagorn, L., Bach, P., and Josse, E. (2000). Movement patterns of large bigeye tuna (Thunnus obesus) in the open ocean, determined using ultrasonic telemetry. Mar. Biol. 136, 361–371. doi: 10.1007/s002270050694
Duffy, L. M., Kuhnert, P. M., Pethybridge, H. R., Young, J. W., Olson, R. J., Logan, J. M., et al. (2017). Global trophic ecology of yellowfin, bigeye, and albacore tunas: understanding predation on micronekton communities at ocean-basin scales. Deep Sea Res. Part II Top. Stud. Oceanogr. 140, 55–73. doi: 10.1016/j.dsr2.2017.03.003
Fitch, J. E., and Brownell, R. L. Jr. (1968). Fish otoliths in cetacean stomachs and their importance in interpreting feeding habits. J. Fish. Res. Board Canada 25, 2561–2574. doi: 10.1139/f68-227
Granadeiro, J. P., and Silva, M. A. (2000). The use of otoliths and vertebrae in the identification and size-estimation of fish in predator-prey studies. Cybium 24, 383–393.
Grubbs, R. D., Holland, K. N., and Itano, D. G. (2001). Food habits and tropic dynamics of structure-associated aggregations of yellowfin and bigeye tuna (Thunnus albacares and Thunnus obesus) in the Hawaiian Island: project description, rationale and preliminary results. Noumea: Yellowfin Research Group SCTB.
Hanamoto, E. (1987). Effect of oceanographic environment on bigeye tuna distribution. Bull. Jpn. Soc. Fish. Oceanogr. 51, 203–216.
Harvey, J. T., Loughlin, T. R., Perez, M. A., and Oxman, D. S. (2000). Relationship between fish size and otolith length for 63 species of fishes from the Eastern North Pacific Ocean. NOAA Tech. Rep. NMFS. Washington: National Marine Mammal Laboratory.
Huang, H. W. (2011). Bycatch of high sea longline fisheries and measures taken by Taiwan: actions and challenges. Mar. Policy 35, 712–720. doi: 10.1016/j.marpol.2011.02.012
Hyslop, E. J. (1980). Stomach contents analysis: a review of methods and their application. J. Fish Biol. 17, 411–429. doi: 10.1111/j.1095-8649.1980.tb02775.x
IOTC (2003). Report of the 3rd Session of the IOTC Working Party on Billfish. Perth: Indian Ocean Tuna Commission.
IOTC (2005). “A review of the situation of bigeye tuna (Thunnus obesus) in the Indian Ocean,” in International Commission for the Conservation of Atlantic Tunas Collective Volume of Scientific Papers, (Victoria: IOTC), 201–217.
Jakubavièiûtë, E., Bergström, U., Eklöf, J. S., Haenel, Q., and Bourlat, S. J. (2017). DNA metabarcoding reveals diverse diet of the three−spined stickleback in a coastal ecosystem. PLoS One 12:e0186929. doi: 10.1371/journal.pone.0186929
Jobling, M., and Breiby, A. (1986). The use and abuse of fish otoliths in studies of feeding habits of marine piscivores. Sarsia 71, 265–274. doi: 10.1080/00364827.1986.10419696
Joyce, W. N., Campana, S. E., Natanson, L. J., Kohler, N. E., Pratt, H. L. Jr., and Jensen, C. F. (2002). Analysis of stomach contents of the porbeagle shark (Lamna nasus Bonnaterre) in the northwest Atlantic. ICES J. Mar. Sci. 59, 1263–1269. doi: 10.1006/jmsc.2002.1286
Kornilova, G. (1980). Feeding of yellowfin tuna, Thunnus albacares, and bigeye tuna, Thunnus obesus, in the equatorial zone of the Indian Ocean. J. Ichthyol. 20, 111–119.
Lam, C. H., Galuardi, B., and Lutcavage, M. E. (2014). Movements and oceanographic associations of bigeye tuna (Thunnus obesus) in the northwest Atlantic. Can. J. Fish. Aquat. Sci. 1543, 1–15. doi: 10.1016/j.fishres.2012.08.013
Liao, H., Pierce, C. L., and Larscheid, J. G. (2001). Empirical assessment of indices of prey importance in the diets of predacious fish. Trans. Am. Fish. Soc. 130, 583–591. doi: 10.1577/1548-8659(2001)130<0583:eaoiop>2.0.co;2
Lin, C.-H., and Chang, C.-W. (2012). Otolith Atlas of Taiwan Fishes. Pingtung: National Museum of Marine Biology and Aquarium.
Matsumoto, T., Kitagawa, T., and Kimura, S. (2013). Considerations on diving patterns of bigeye tuna Thunnus obesus based on archival tag data. Fish. Sci. 79, 39–46. doi: 10.1007/s12562-012-0571-8
Ménard, F., Labrune, C., Shin, Y. J., Asine, A. S., and Bard, F. X. (2006). Opportunistic predation in tuna: a size-based approach. Mar. Ecol. Prog. Ser. 323, 223–231. doi: 10.3354/meps323223
Ménard, F., Stéquert, B., Rubin, A., Herrera, M., and Marchal, E. (2000). Food consumption of tuna in the equatorial Atlantic Ocean: FAD-associated versus unassociated schools. Aquat. Living Resour. 13, 233–240.
Musyl, M. K., Brill, R. W., Boggs, C. H., Curran, D. S., Kazama, T. K., and Seki, M. P. (2003). Vertical movements of bigeye tuna (Thunnus obesus) associated with islands, buoys, and seamounts near the main Hawaiian Islands from archival tagging data. Fish. Oceanogr. 12, 152–169. doi: 10.1046/j.1365-2419.2003.00229.x
Neves, V., Nolf, D., and Clarke, M. (2012). Spatio-temporal variation in the diet of Cory’s shearwater Calonectris diomedea in the Azores Archipelago, northeast Atlantic. Deep Sea Res. Part I Oceanogr. Res. Pap. 70, 1–13. doi: 10.1016/j.dsr.2012.08.003
Nolf, D. (1985). “Otolithi piscium,” in Handbook of Paleoichthyology, eds L. Schultze and O. Kuhn (Stuttgart, Germany: Gustav Fischer), 1–21.
Nolf, D. (2013). The Diversity of Fish Otoliths, Past and Present. Brussels: Royal Belgian Institute of Natural Sciences.
Nootmorn, P. (2004). Reproductive biology of bigeye tuna (Thunnus obesus) in the eastern Indian Ocean. IOTC Proc. 7, 1–5. doi: 10.1016/j.fishres.2012.08.013
Ohe, F., and Moriguchi, M. (2009). The mesopelagic fish taken out from the stomachs of Xiphias gladius, Thunnus obesus, and Alepisaurus ferox, captured by the longline fishing at the Hahajima offing of Ogasawara Islands, and those otoliths. Kaseki no Tomo 54, 52–61.
Ohshimo, S., Hiraoka, Y., Sato, T., and Nakatsuka, S. (2018). Feeding habits of bigeye tuna (Thunnus obesus) in the north Pacific from 2011 to 2013. Mar. Freshw. Res. 69, 585–606. doi: 10.1071/mf17058
Olson, R. J., Young, J. W., Ménard, F., Potier, M., Allain, V., Goñi, N., et al. (2016). Bioenergetics, trophic ecology, and niche separation of tunas. Adv. Mar. Biol. 74, 199–344. doi: 10.1016/bs.amb.2016.06.002
Pierce, G. J., Boyle, P. R., and Diack, J. S. W. (1991). Identification of fish otoliths and bones in faeces and digestive tracts of seals. J. Zool. 224, 320–328. doi: 10.1111/j.1469-7998.1991.tb04810.x
Pillai, N. G., and Satheeshkumar, P. (2012). Biology, fishery, conservation and management of Indian Ocean tuna fisheries. Ocean Sci. J. 47, 411–433. doi: 10.1007/s12601-012-0038-y
Pinkas, L., Oliphant, M. S., and Iverson, I. L. K. (1971). Food habits of albacore, bluefin tuna and bonito in Californian waters. Calif. Fish Game 152, 1–105. doi: 10.1201/b18714-2
Polovina, J. J., Abecassis, M., Howell, E. A., and Woodworth, P. (2009). Increases in the relative abundance of mid-trophic level fishes concurrent with declines in apex predators in the subtropical north Pacific, 1996-2006. Fish. Bull. 107, 523–531.
Potier, M., Marsac, F., Cherel, Y., Lucas, V., Sabatié, R., Maury, O., et al. (2007). Forage fauna in the diet of three large pelagic fishes (lancetfish, swordfish and yellowfin tuna) in the western equatorial Indian Ocean. Fish. Res. 83, 60–72. doi: 10.1016/j.fishres.2006.08.020
Potier, M., Marsac, F., Lucas, V., Sabatié, R., Hallier, J., and Ménard, F. (2004). Feeding partitioning among tuna taken in surface and midwater layers: the case of yellowfin (Thunnus albacares) and bigeye (T. obesus) in the western tropical Indian Ocean. Western Indian Ocean J. Mar. Sci. 3, 55–62.
Potier, M., Romanov, E., Cherel, Y., Sabatié, R., Zamorov, V., and Ménard, F. (2008). Spatial distribution of Cubiceps pauciradiatus (Perciformes: Nomeidae) in the tropical Indian Ocean and its importance in the diet of large pelagic fishes. Aquat. Living Resour. 21, 123–134. doi: 10.1051/alr:2008026
Scharf, F. S., Juanes, F., and Rountree, R. A. (2000). Predator size-prey size relationships of marine fish predators: interspecific variation and effects of ontogeny and body size on trophic-niche breadth. Mar. Ecol. Prog. Ser. 208, 229–248. doi: 10.3354/meps208229
Shannon, L. V. (1987). The tunas of the Benguela region off southern Africa – A synthesis. Col. Vol. Sci. Pap. 26, 566–581.
Smale, M. J., Watson, G., and Hecht, T. (1995). Otolith Atlas of Southern African Marine Fishes. Grahamstown: JLB Smith Inst Ichthyol.
Stéquert, B., and Conand, F. (2004). Age and growth of bigeye tuna (Thunnus obesus) in the western Indian Ocean. Cybium 28, 163–170.
Vaske-Jr, T., Travassos, P. E., Hazin, F. H. V., Tolotti, M. T., and Barbosa, T. M. (2012). Forage fauna in the diet of bigeye tuna (Thunnus obesus) in the western tropical Atlantic Ocean. Braz. J. Oceanogr. 60, 89–97. doi: 10.1590/s1679-87592012000100009
Wang, C.-Y. (2010). Study On The Relationship Between Temperature-Depth And Distribution Of Tunas And Billfishes In The Tropical Indian Ocean. Ph. D. dessertation, (Kaohsiung: National Kaohsiung Marine University).
Watanabe, H., Kubodera, T., Ichii, T., and Kawahara, S. (2004). Feeding habits of neon flying squid Ommastrephes bartramii in the transitional region of the central north Pacific. Mar. Ecol. Prog. Ser. 266, 173–184. doi: 10.3354/meps266173
Young, J. W., Lansdell, M. J., Campbell, R. A., Cooper, S. P., Juanes, F., and Guest, M. A. (2010). Feeding ecology and niche segregation in oceanic top predators off eastern Australia. Mar. Biol. 157, 2347–2368. doi: 10.1007/s00227-010-1500-y
Keywords: otolith, feeding ecology, dietary change, prey size distribution, Myctophidae
Citation: Lin C-H, Lin J-S, Chen K-S, Chen M-H, Chen C-Y and Chang C-W (2020) Feeding Habits of Bigeye Tuna (Thunnus obesus) in the Western Indian Ocean Reveal a Size-Related Shift in Its Fine-Scale Piscivorous Diet. Front. Mar. Sci. 7:582571. doi: 10.3389/fmars.2020.582571
Received: 12 July 2020; Accepted: 16 October 2020;
Published: 11 November 2020.
Edited by:
Simone Libralato, Istituto Nazionale di Oceanografia e di Geofisica Sperimentale (OGS), ItalyReviewed by:
John Logan, Massachusetts Division of Marine Fisheries, United StatesJulia Ramos Miranda, Autonomous University of Campeche, Mexico
Copyright © 2020 Lin, Lin, Chen, Chen, Chen and Chang. This is an open-access article distributed under the terms of the Creative Commons Attribution License (CC BY). The use, distribution or reproduction in other forums is permitted, provided the original author(s) and the copyright owner(s) are credited and that the original publication in this journal is cited, in accordance with accepted academic practice. No use, distribution or reproduction is permitted which does not comply with these terms.
*Correspondence: Chih-Wei Chang, changcw1831@gmail.com