Precipitation and the Associated Moist Static Energy Budget off Western Australia in Conjunction with Ningaloo Niño
 Tao Zheng
 Tao Feng
 Kang Xu
 Xuhua Cheng1,2,3,4
- 1Key Laboratory of Marine Hazards Forecasting, Ministry of Natural Resources, Hohai University, Nanjing, China
- 2College of Oceanography, Hohai University, Nanjing, China
- 3Southern Marine Science and Engineering Guangdong Laboratory (Zhuhai), Zhuhai, China
- 4Key Laboratory of Ministry of Education for Coastal Disaster and Protection, Hohai University, Nanjing, China
- 5State Key Laboratory of Tropical Oceanography, South China Sea Institute of Oceanology, Chinese Academy of Sciences, Guangzhou, China
- 6Southern Marine Science and Engineering Guangdong Laboratory (Guangzhou), Guangzhou, China
- 7Key Laboratory of Marine Science and Numerical Modeling, Ministry of Natural Resources, Qingdao, China
Ningaloo Niño is a well-known ocean-atmosphere coupled climate event in the southeastern Indian Ocean that interacts with large-scale atmospheric circulations at the interannual time scale. When a Ningaloo Niño develops, remarkably enhanced precipitation anomalies occur primarily off the coast of northwestern Australia (NWA) rather than over the offshore area of western Australia (WA), where the most significant sea surface temperature warming prevails. This enhanced NWA precipitation manifests as jointly intensified stratiform and convective precipitation accompanied by an increase in high cloud cover. Further analyses of the column-integrated moist static energy (MSE) budget reveal that during Ningaloo Niño events, positive vertical MSE transport moistens and heats the atmosphere in the WA region. However, these moistening and heating effects are mostly offset by the inhibitory effect of the negative horizontal MSE advection, leading to the relatively weak and nonsignificant variation in local precipitation anomalies off the WA coastal region. In contrast, off the coast of the NWA region, the recharge of column-integrated MSE, which is induced by the significant positive radiative and surface heating, horizontal MSE advection, and vertical MSE advection, contributes to the heaviest austral summer precipitation associated with Ningaloo Niño. Therefore, the distinct MSE transport processes result in the particular rainfall pattern in which the most enhanced rainfall is associated with Ningaloo Niño events over the NWA region.
Introduction
Ningaloo Niño/Niña is the dominant mode of interannual variation in the southeastern Indian Ocean (Feng et al., 2013; Kataoka et al., 2014; Tozuka et al., 2014; Zhang et al., 2018). This phenomenon is characterized by the positive (negative) sea surface temperature (SST) anomalies (SSTAs) off the coast of western Australia (WA) and typically matures in austral summer (December-January-February, DJF). The pronounced SST warming causes devastating consequences to coral and biodiversity (Feng et al., 2013; Pearce and Feng, 2013; Wernberg et al., 2013; Zinke et al., 2014). The development of the Ningaloo Niño is attributed to remote atmospheric and oceanic forcing from the Pacific Ocean (Feng et al., 2013; Kataoka et al., 2014; Tozuka et al., 2014; Zhang et al., 2018) or local air-sea interactions in the tropical southeastern Indian Ocean (Marshall et al., 2015; Kataoka et al., 2017; Kataoka et al., 2018; Tozuka and Oettli, 2018; Zhang et al., 2018). Although Ningaloo Niño events are significantly correlated with El Niño-Southern Oscillation (ENSO), the Indian Ocean dipole (IOD) and the Interdecadal Pacific Oscillation (Feng et al., 2013; Pearce and Feng, 2013; Kataoka et al., 2014; Tozuka et al., 2014; Zhang et al., 2018; Zhang and Han, 2018; Kusunoki et al., 2020; Tanuma and Tozuka, 2020), recent studies have demonstrated that Ningaloo Niño/Niña events independently exert a substantial influence on the regional climate and marine ecosystems along the WA coast (Tozuka et al., 2014; Kataoka et al., 2018; Zhang et al., 2018).
The surface heat and radiation influxes play a vital role in anomalous Ningaloo Niño-related SST warming (Tozuka and Oettli, 2018; Zhang et al., 2018; Guo et al., 2020a). Li et al. (2019) indicated that the majority of the decadal SST variability is attributed to surface heat fluxes in the southeast Indian Ocean (SEIO). They found that warm SSTA was associated with positive cloud-radiation-SST feedback, which acted to promote or maintain the SST warming. Surface turbulent heat flux is the most vital process in promoting and damping the SST in most Ningaloo Niño events (Guo et al., 2020a; Guo et al., 2020b). Tozuka and Oettli (2018) revealed that an asymmetrical cloud-shortwave radiation-SST feedback induced by abnormal cloud activity contributed to the increase/decrease in the WA SSTAs associated with Ningaloo Niño/Niña. Due to an increase in the amount of clouds off the coast of WA, less incoming solar radiation reaches the ocean, suppressing the existing SST warming (Zhang et al., 2018; Li et al., 2019). Therefore, the interannual variation in clouds plays an important role in the development of Ningaloo Niño.
The interannual variation in cloud cover exhibits a linear relationship with the precipitation in the tropics (e.g., Richards and Arkin, 1981; Vuille and Keimig, 2004). Previous studies revealed that the enhanced rainfall over WA is accompanied by warming SSTAs in its vicinity during Ningaloo Niño events (Doi et al., 2013; Doi et al., 2015; Kataoka et al., 2014; Tozuka et al., 2014; Li et al., 2019; Su et al., 2019). Marshall et al. (2015) attributed the enhanced rainfall to the warmer SST that was induced by the weakened surface wind during the initiation stage of Ningaloo Niño. Doi et al. (2015) also emphasized that the enhanced rainfall over the WA coastal region was closely related to the warming SSTA in situ. However, the most remarkable Ningaloo Niño-related precipitation anomalies are observed over the northwest Australia (NWA) coastal region near the vicinity of the Intertropical Convergence Zone rather than over the warmest SSTA region near the WA coast (Tozuka et al., 2014, in their Figure 7; Marshall et al., 2015, in their Figure 3; Doi et al., 2015, in their Figure 5). Such precipitation anomalies cannot be explained by the warming of the local SSTAs. In addition, the abnormal rainfall and associated cloud formation play essential roles in the local SSTA change; therefore, the cause of the abnormal rainfall over the SEIO is critical for understanding the overall perspective of Ningaloo Niño events. To this end, we investigated the mechanism of the Ningaloo Niño-related rainfall anomalies over the WA and NWA coastal regions.
The column-integrated moist static energy (MSE) budget is widely used to study the large-scale climatic impacts on tropical convective rainfall at various time scales, e.g., the Madden Julian Oscillation (Benedict and Randall, 2007; Maloney, 2009; Kiranmayi and Maloney, 2011; Arnold et al., 2013; Sobel et al., 2014), the convective coupled equatorial waves (Sumi and Masunaga, 2016; Feng et al., 2020a; Feng et al., 2020b), and the climatology of tropical rainfall (Back and Bretherton, 2006; Schneider et al., 2014; Bui et al., 2016). Column-integrated MSE mainly represents a thermodynamic reference of the atmospheric column. The increase in the column-integrated MSE denotes an import of MSE from the surrounding environment, which destabilizes the atmospheric column by heating and moistening processes and by inducing deep convective rainfall later. Conversely, the decrease in the column-integrated MSE indicates that the troposphere is stabilized by cooling and drying processes accompanied by an export of the MSE to the affected area. The MSE changes correspond to a recharge-discharge paradigm regulating the occurrence of tropical rainfall (Maloney, 2009). In addition, the column-integrated MSE budget equation includes the surface heat and radiation flux, and the role of surface heat forcing can be qualitatively assessed (Neelin and Held, 1987). In the present study, the MSE budget is used to explore the mechanism of Ningaloo Niño-related precipitation variations.
The remainder of the paper is organized as follows. The datasets and methods in this study are briefly introduced in Data and Methodology. Precipitation and Large-Scale Atmospheric Circulation Anomalies Associated With the Ningaloo Niño characterizes the features of the observed precipitation and its related atmospheric circulation variations in association with Ningaloo Niño events. Possible Mechanism of the Ningaloo Niño-Related Precipitation Variations demonstrates the mechanisms of precipitation variability off the WA coast using the column-integrated MSE budget. The conclusions and discussion are presented in Conclusion and Discussion.
Data and Methodology
Data
The atmospheric reanalysis data, including three-dimensional wind, air temperature, specific humidity, surface heat and radiation fluxes, were obtained from the European Center for Medium-Range Weather Forecasts (ECMWF) ERA5 reanalysis dataset (Hersbach and Dee, 2016). These data are available at a horizontal resolution of 0.5° × 0.5° and extend from 1,000 to 100 hPa with 27 vertical pressure levels. The ERA5 data cover the study period from 1981 to 2018. The monthly data are used to provide monthly averaged atmospheric fields including horizontal wind, atmospheric moisture, etc. As the advection terms in MSE budget equation (introduced in Column-Integrated Moist Static Energy Budget) are nonlinear, four times daily data were also used to calculate the MSE budget. The monthly SST with a horizontal resolution of 1° × 1° from 1981 to 2018 was extracted from the NOAA Optimum Interpolation SST v2 data (Reynolds et al., 2002). The Tropical Rainfall Measuring Mission (TRMM) 3A25 version 7 product is also adopted to provide the monthly averaged surface precipitation rate over the tropical ocean and conditional convective or stratiform rainfall rate (Huffman et al., 2007). The rain rate data have a horizontal resolution of 0.5° × 0.5° and a period of 1998–2013. Global Precipitation Climatology Project (GPCP) monthly rainfall data version 2.3 at a horizontal resolution of 2.5° × 2.5° are also included (Adler et al., 2018). In addition, two datasets for outgoing longwave radiation (OLR), namely, the NOAA OLR (Liebmann and Smith, 1996; NOAA, 1996) and the High-Resolution Infrared Radiation Sounder (HIRS) OLR Version 2.2 (Lee et al., 2007), are used to validate the rainfall variation. The NOAA OLR with a horizontal resolution of 2.5° × 2.5° from 1981 to 2013 and HIRS OLR of 1° × 1° from 1981 to 2018 are both monthly averaged. The cloud fraction data were obtained from the Cloud Feedback Model Intercomparison Program (CFMIP) provided by the Cloud-Aerosol Lidar and Infrared Pathfinder Satellite Observation (CALIPSO) from 2007 to 2017 (Webb et al., 2017). The original horizontal resolution of the cloud fraction variables is 1° × 1°, but they are interpolated into a 2.5° × 2.5° horizontal resolution to achieve robust statistical stability. In this dataset, clouds with cloud top pressures lower than 680 hPa (higher than 440 hPa) are classified as low (high) clouds, and clouds with cloud top pressures between 680 and 440 hPa are defined as middle clouds.
Methodology
Definition of the Ningaloo Niño Event
A conventional Ningaloo Niño event starts in October, matures in austral summer (DJF), and finally decays in March (Kataoka et al., 2014). Empirical orthogonal function (EOF) analysis has been frequently utilized to examine the temporal and spatial characteristics of Ningaloo Niño events (Kataoka et al., 2014; Marshall et al., 2015). Thus, we used the EOF approach on the monthly SSTAs from December 1981 to December 2018 over the domain of 100°–120°E, 12°–34°S to distinguish the Ningaloo Niño events. The first EOF (EOF1), which explains 53.8% of the total variance), captures the Ningaloo Niño SST pattern with the warmer-than-normal SST off the WA coast (Figure 1A). The second EOF accounts for only 16.1% of total variance (not shown). The normalized time series of the first principal component (PC1) well resembles the remarkable variability of the Ningaloo Niño index (NNI) calculated by the averaged SSTA in the region of 108°E-coast, 28°S–22°S (see the black box in Figure 1A; Kataoka et al., 2014), with simultaneous correlation coefficients of +0.88 (Figure 1B). Therefore, PC1 effectively provides a benchmark to denote the interannual variation in the Ningaloo Niño events.
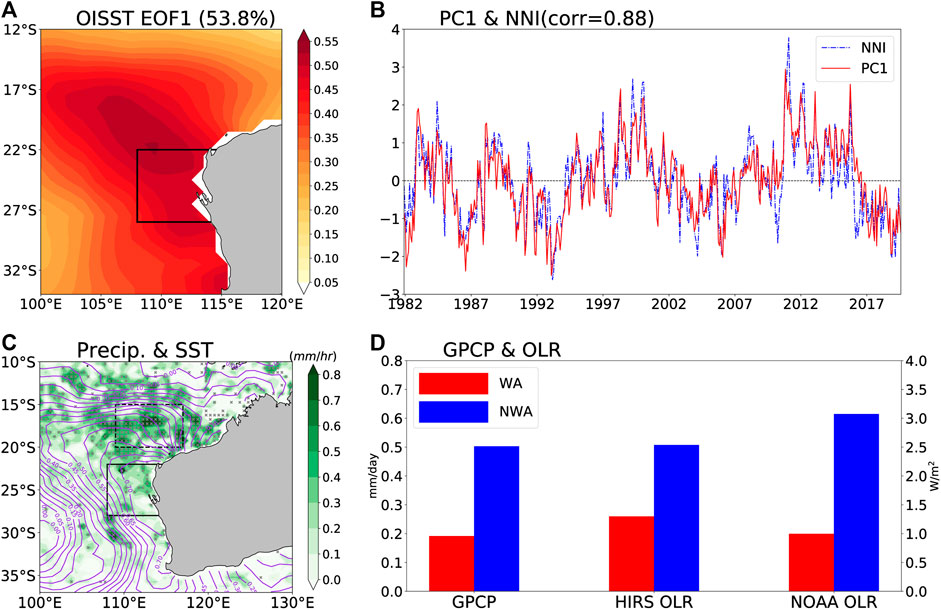
FIGURE 1. (A) The first EOF (EOF1) mode of the SST anomalies (shading: K) off WA during the period of 1981–2018 and (B) the normalized corresponding first principal component (PC1, red solid curve) and the Ningaloo Niño Index (NNI, blue dashed curve) averaged for the region (108°E-coast, 28°S–22°S) marked by the black box in (A). The correlation coefficient between PC1 and NNI is 0.88, which is statistically significant at the 99% level. (C) Austral summer (December-February) mean precipitation rate (shading: mm hr−1) and SST anomalies (contour: K) obtained by regressing against PC1 during 1998–2013. The gray crosses indicate precipitation rate anomalies above the 90% significance level by a Student t test. The solid and dashed boxes indicate the WA (108°E-coast, 28–22°S) and NWA (109–117°E, 20–15°S) coastal regions, respectively. (D) Linear regression coefficients of the austral summer (DJF) mean PC1 with the GPCP precipitation (mm day−1; 1981–2018), HIRS OLR (W m−2; 1981–2018) and NOAA OLR (W m−2; 1981–2013) averaged over the WA (red bars) and NWA (blue bars) coastal regions.
Column-Integrated Moist Static Energy Budget
The MSE is defined as
where
Since the three-dimensional radiative heating rate is not provided in the reanalysis dataset, Eq. 3 is integrated from the sea surface up to the tropopause
In Eq. 4, the terms on the right-hand side represent horizontal MSE advection (HADV), vertical MSE advection (VADV), total radiative and surface heating and moistening, and vertical MSE transport by subgrid-scale processes, respectively. The third term
The MSE budget equation describes the balance of large-scale atmospheric forcing and convective activity. Such a balance is valid over a certain area because convections are still randomly distributed in the area with MSE recharge. Therefore, area averaging should be used to interpret the budget results. It should be noted that the horizontal and vertical advection terms are nonlinear. As a result, these terms were calculated using four times daily data and then averaged to monthly averaged values for further examination. The calculation of MSE budgets from reanalysis datasets remained uncertain because of the parameterization schemes in the numerical models. Thus, the ERA-Interim reanalysis dataset, which provides similar MSE budgets, was also utilized to validate the results (not shown).
Precipitation and Large-Scale Atmospheric Circulation Anomalies Associated With the Ningaloo Niño
Figure 1C shows the linear regression of PC1 with the austral summer (DJF) mean precipitation and SSTAs (the crosses indicate regression coefficient above the 90% significance level by a Student t test). The regression map of the SSTA during the Ningaloo Niño events (Figure 1C, contour) is slightly different from that of the EOF1 mode, while both show that the maximum SSTAs appear along the WA coast with a warm tongue extending northwestward to the equator (Figure 1A). Notably, significant positive precipitation anomaly is primarily observed over the region off NWA (109°E–117°E, 20°S–15°S; dashed box), while the counterpart over the WA coastal region (108°E-coast, 28°S–22°S; solid box, identical to the region used to calculate NNI) is nonsignificant (Figure 1C). Figure 1D confirms the more enhanced rainfall over the NWA coastal region by averaging the regression coefficients over these two regions. In previous studies, Tozuka et al. (2014) and Li et al. (2019) indicated that local SSTA induced the precipitation anomaly during Ningaloo Niño. However, the location between the warmest SSTA (WA region) and the most enhanced rainfall (NWA region) is mismatched, as illustrated in Figure 1C, implying that the rainfall anomaly pattern cannot be fully explained by the enhancement of local ascending motion due to higher SSTA. Such a mismatch generally signifies the importance of the internal atmospheric processes in regulating the rainfall anomaly pattern. Therefore, the present study mainly investigates rainfall mechanisms by comparing the MSE budgets in the NWA and WA coastal regions to understand the fundamental processes affecting such precipitation patterns. The results were not sensitive to the selection of the area after a test by slightly enlarging or narrowing the two study areas (not shown).
Figure 2 depicts the relationships between the Ningaloo Niño and the precipitation variation over the WA and NWA coastal regions at the interannual time scale. For the WA and NWA regions, the area-averaged total precipitation anomalies show a significant positive correlation with the Ningaloo Niño, with correlation coefficients of +0.65 and +0.58, respectively, exceeding the 95% statistical significance level (Figure 2A). However, the regression coefficient for the NWA region is 1.5 times greater than that for the WA region, indicating that the NWA precipitation is more sensitive to the intensity of the Ningaloo Niño events. Similar to the total precipitation rate, both the convective and the stratiform rain rates increase over the WA and NWA coastal regions when Ningaloo Niño events occur; however, those over the NWA coast are more sensitive to Ningaloo Niño events (Figures 2B, C). Another quantity describing the spatial coverage of convective and stratiform rain is the convective and stratiform rain ratio, which is calculated as the number of observed pixels categorized as stratiform and convective rainfall divided by the total number of observed pixels in each grid. The results are identical to those for the convective and stratiform rain rates (not shown), suggesting that the rain rate and coverage over NWA are both more sensitive to Ningaloo Niño events, ultimately resulting in a remarkable increase in the total rainfall anomaly in situ.
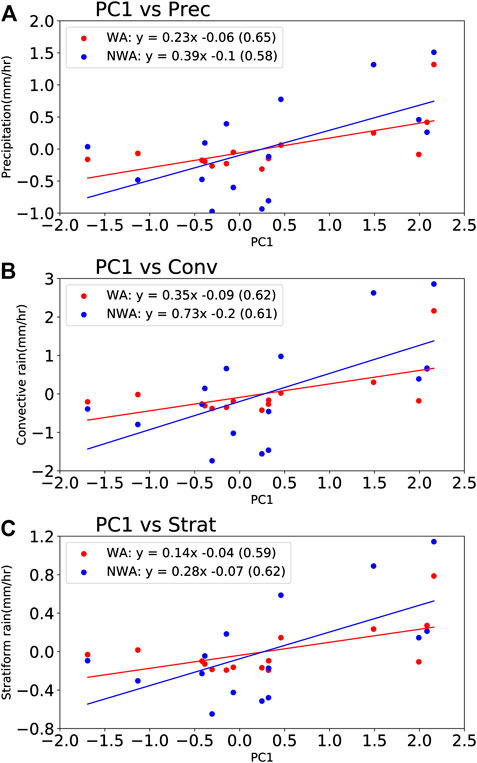
FIGURE 2. Scatter plot of austral summer (DJF) mean (A) total precipitation rate, (B) convective precipitation rate, and (C) stratiform precipitation rate averaged over the WA (red dots) and NWA (blue dots) coastal regions during 1998–2013. The horizontal axis is the value of PC1. The red (blue) solid line denotes the linear regression for the WA (NWA) coastal region, and the regression equation and its associated correlation coefficients are shown on the top in each panel.
On the other hand, the variations in cloud cover usually correspond to the variability of the precipitation rate. The cloud variation displays similar features over the WA and NWA coastal regions (Figure 3). For the total cloud cover, there is no significant change over either region during Ningaloo Niño events (Figure 3A). However, low cloud anomalies have a negative correlation with Ningaloo Niño, while high cloud and middle cloud anomalies have a positive correlation (Figures 3B–D), and the variations in low and high cloud covers are statistically significant in both regions. This result indicates that remarkable increases in high cloud amounts and decreases in low cloud amounts appear over the NWA coastal region, consistent with the occurrence of deeper convections that induce significantly enhanced convective rainfall there.
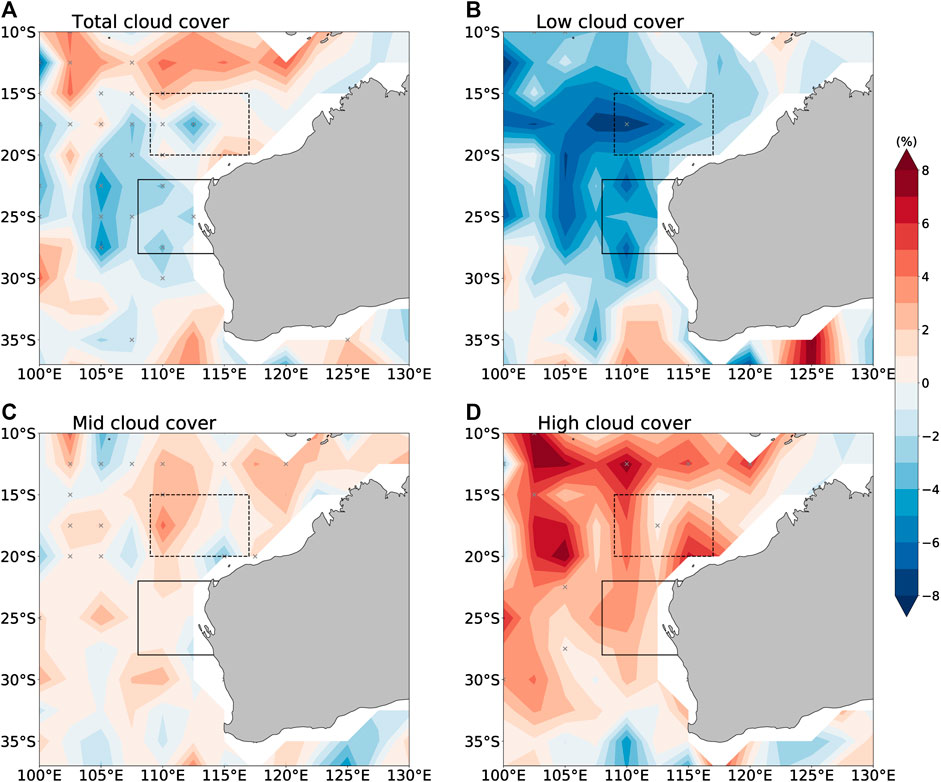
FIGURE 3. Linear regressions of the austral summer (DJF) mean (A) total cloud cover (%), (B) low cloud cover (%), (C) middle cloud cover (%), and (D) high cloud cover (%) against PC1 during 2007–2017. The gray crosses indicate the variable anomalies above the 90% significance level by a Student t test. The solid and dashed boxes indicate the WA (108°E-coast, 28–22°S) and NWA (109–117°E, 20–15°S) coastal regions, respectively.
According to the study of Tozuka and Oettli (2018), the high cloud and low cloud conditions exhibit different sensitivities to the background of positive and negative SSTA in the WA region. A linear decrease in low cloud cover occurs when the NNI is negative, while an increase in high cloud cover occurs when the NNI is positive. This asymmetric variation in cloud cover is important for the surface radiation variation. Considering the radiation budget is not the primary factor affecting the rainfall pattern, as discussed below, only a linear relationship between the SSTA and cloud cover is considered in this study. Notably, the relatively short period of the observed cloud cover data from CFMIP may lead to uncertainty in the linear interpretation. The results were validated using the ERA5 data with an extended period from 1981 to 2018 (not shown). The similar outcomes suggest that the Ningaloo Niño-related variations in cloud cover are robust features that do not show sensitivity to the study period.
Figure 4 depicts the large-scale atmospheric circulation anomalies at different pressure levels associated with Ningaloo Niño events. In association with the warming Ningaloo Niño-related SSTAs, an anomalous cyclone is observed in the lower troposphere, and the northerly anomalies mainly control the region off the WA coast (Figure 4A), consistent with the results of previous studies (Benthuysen et al., 2014; Tozuka et al., 2014; Marshall et al., 2015; Kataoka et al., 2017). Such anomalous low-level northerlies enhance the Leeuwin current, which brings warm water from the equator to WA, favoring an increase in the SSTAs in the WA coastal region along with coastal downwelling anomalies (Benthuysen et al., 2014; Kataoka et al., 2014; Tozuka et al., 2014; Marshall et al., 2015). Since the maximum moisture anomalies are positioned northwest of the NWA coastal region, the anomalous low-level northwesterly, related to the cyclone, acts to bring warmer and more humid air to the NWA coastal region (Figure 4B; in agreement with Zhang et al., 2018). Note that the ascending motion over the NWA coastal region is much stronger than that over the WA coastal region (Figure 4C), consistent with the stronger convective precipitation over the NWA coastal region. In the upper troposphere, an anomalous anticyclone is observed at higher latitudes, and the NWA coastal region is dominated by remarkable southwesterly wind anomalies and significant divergence (Figure 4D). The baroclinic circulations with anomalous anticyclones in the upper troposphere and anomalous cyclones in the lower troposphere, which correspond with anomalously enhanced precipitation near the equator over the NWA coastal region, recall the classical Matsuno-Gill response (Matsuno, 1966; Gill, 1980).
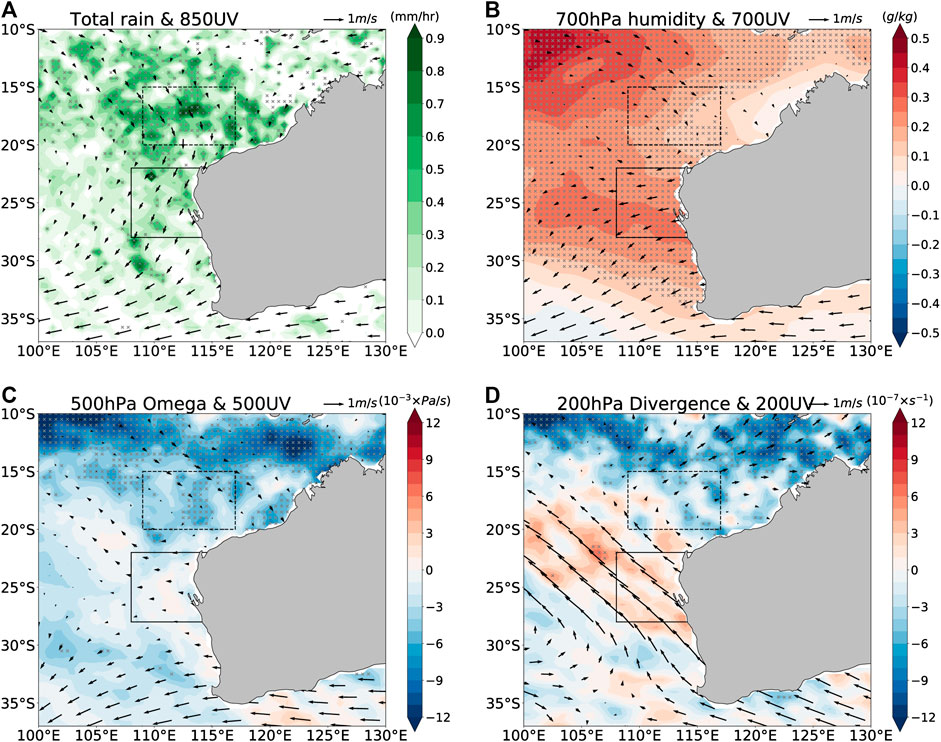
FIGURE 4. Same as in Figure 3 but for (A) precipitation (shading: mm hr−1) and 850-hPa wind (vector: m s−1), (B) 700-hPa specific humidity (shading: g kg−1) and wind (vector: m s−1), (C) 500-hPa vertical velocity (shading: 10−3 Pa s−1) and wind (vector: m s−1), (D) 200-hPa divergence (shading: 10−7 s−1) and wind (vector: m s−1) during 1981–2018 except precipitation during 1998–2013. The gray crosses indicate the variable anomalies above the 90% significance level by a Student t test. The solid and dashed boxes indicate the WA (108°E-coast, 28–22°S) and NWA (109–117°E, 20–15°S) coastal regions, respectively.
In summary, enhanced precipitation anomalies are found over the NWA and WA coastal regions during Ningaloo Niño events, but the heaviest rainfall anomalies with strengthened deep convection activity appear off the NWA coast. In the next section, the column-integrated MSE budget diagnosis is used to clarify why the heaviest rainfall occurs over the NWA coastal region rather than over the WA coastal region, where the greatest SST warming prevails.
Possible Mechanism of the Ningaloo Niño-Related Precipitation Variations
The column-integrated MSE budget is analyzed to explore the mechanisms of the Ningaloo Niño-related precipitation variations, and the results are shown in Figure 5. The HADV terms over the tropical and subtropical regions exhibit opposite signs during Ningaloo Niño events (Figure 5A). Over the tropical region, the horizontal MSE advection is positive, meaning that the horizontal advection brings more moisture and heat from the equator. In contrast, the horizontal MSE advection is negative at higher latitudes south of 20°S, cooling and drying the entire troposphere. This cooling and drying stabilize the atmosphere and prevent the occurrence of deep convections over the WA coastal region. The positive vertical MSE advection dominates the western coast of the Australian continent, and the significantly positive vertical MSE advection is mainly confined to the region south of 20°S (Figure 5B), suggesting that the vertical MSE advection remarkably increases over the WA coastal region when the Ningaloo Niño develops. Over the NWA coastal region, the vertical MSE advection is positive with weaker magnitude. The total radiative and surface heating (<QR>) in the atmospheric column is significantly positive over the NWA coastal region, indicating that the increase in the net radiative and heat income contributes to the heaviest rainfall. Over the WA coastal region, significant positive radiative and heat income occurs only offshore (Figure 5C). The pattern of the subgrid-scale transport term mirrors the <QR> term with an opposite sign (Figure 5D). Based on Eq. 5, the subgrid-scale transport is a measurement of upward MSE transport by convective activity; thus, the subgrid-scale transport pattern corresponds well to the pronounced enhancement of rainfall over the offshore areas of NWA and WA.
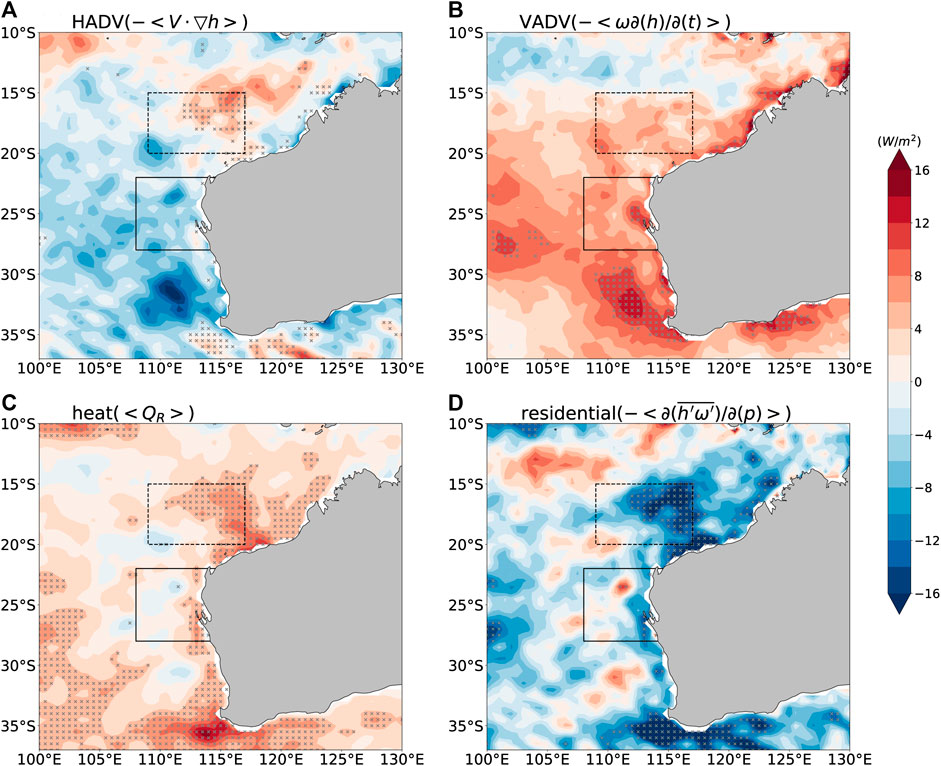
FIGURE 5. Same as in Figure 4 but for (A) column-integrated horizontal advection of MSE (HADV, W m−2), (B) column-integrated vertical advection of MSE (VADV, W m−2), (C) total heat and radiative forcing (<QR>, W m−2) and (D) MSE transport by the subgrid-scale processes (W m−2). The gray crosses indicate the corresponding variable anomalies above the 90% significance level by a Student t test. The solid and dashed boxes indicate the WA (108°E-coast, 28–22°S) and NWA (109–117°E, 20–15°S) coastal regions, respectively.
To quantitatively evaluate the relative contributions of the MSE budget terms to the precipitation variation, Figure 6 presents the regressed MSE budget terms averaged over the NWA and WA coastal regions onto PC1. The subgrid-scale MSE transport term
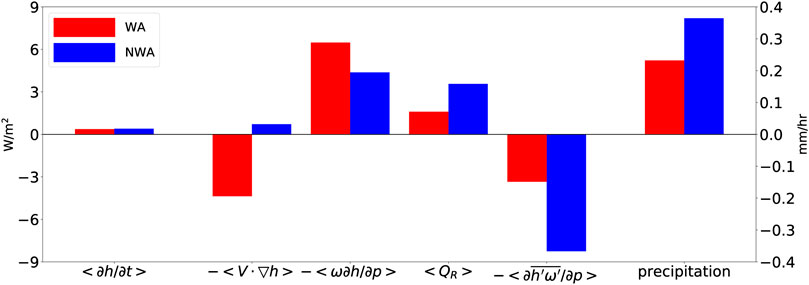
FIGURE 6. Linear regression coefficients of the austral summer (DJF) mean PC1 with the MSE budget terms (W m−2; 1981–2018) and the precipitation rate (mm hr−1; TRMM 1998–2013) averaged over the NWA (blue bars) and WA (red bars) coastal regions.
To investigate the detailed physical processes causing the differences in the MSE budget terms over the WA and NWA coastal regions, we further decompose these terms to investigate the MSE recharge-discharge processes. Figure 7 shows the zonal advection (XADV) and meridional advection (YADV) components of the horizontal MSE advection. Over the southeastern Indian Ocean, significant positive and negative zonal MSE advection appears in the lower latitudes and subtropics (Figure 7A). The meridional MSE advection is the mirror image of the zonal MSE advection with an opposite sign, although its amplitude is relatively weak (Figure 7B). Therefore, the zonal MSE advection term is the primary contributor to the horizontal MSE advection over the WA and NWA coastal regions. The negative horizontal MSE advection over WA is dominated by the negative zonal MSE advection, while the positive counterpart over NWA is principally contributed by the positive zonal MSE advection (Figure 7C). The vertical-resolved horizontal advection at each pressure level was also calculated to reveal the detailed processes behind the vertically integrated horizontal advection terms (not shown). Since the tropical MSE budget is mainly dominated by moisture in the troposphere, the enhanced northwesterlies in the tropics can transport warmer and moister air to the NWA from the relatively wetter tropical eastern Indian Ocean (Figure 4B) and then cause MSE recharge over the NWA coastal region. In the subtropics, however, the anomalous upper-level easterly brings dry air from the Australian continent to the WA region and leads to negative MSE advection, which prohibits the enhancement of convective rainfall.
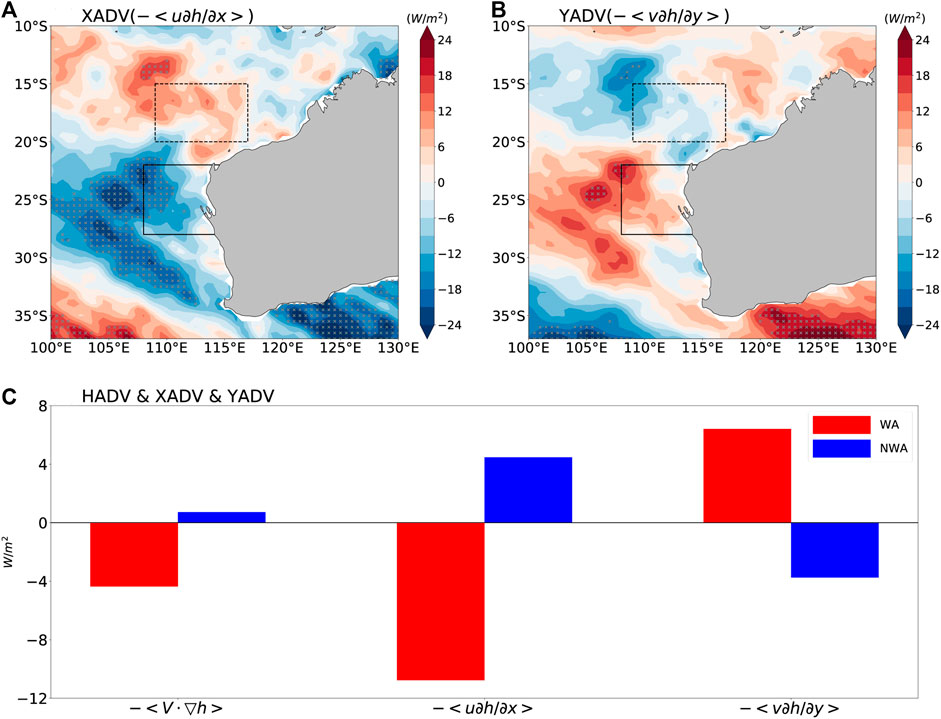
FIGURE 7. Linear regressions of the austral summer (DJF) mean (A) column-integrated zonal advection of MSE (XADV, W m−2) and (B) column-integrated meridional advection of MSE (YADV, W m−2) against PC1 during 1981–2018. The gray crosses indicate the variable anomalies above the 90% significance level by a Student t test. The solid and dashed boxes indicate the WA (108°E-coast, 28–22°S) and NWA (109–117°E, 20–15°S) coastal regions, respectively. (C) Linear regressions of PC1 with the XADV and YADV terms averaged over the NWA (blue bars) and WA (red bars) coastal regions.
The difference in the vertical MSE advection can be explained by the vertical profile of vertical velocity and MSE anomalies (Figure 8). The enhanced ascending motion anomaly over the WA coastal region displays a bottom-heavy structure with the maximum vertical velocity near 750 hPa, but the NWA coastal region shapes a top-heavy structure with the strongest ascending motion at 500 hPa (Figure 8A). Since the vertical distributions of MSE anomalies are concentrated in the lower troposphere (Figure 8B), the vertical motion with a bottom-heavy structure favors the import of MSE from the surrounding environment and develops shallow convections (Back and Bretherton, 2006; Bui et al., 2016), which support weaker rainfall enhancement (Figure 1C) and fewer deep cloud formations (Figure 3D) over the WA region. Over the NWA coastal region, the top-heavy vertical velocity is induced the export of MSE by the large-scale vertical motion, finally leading to much stronger deep convective rainfall (Figures 1C, 3D).
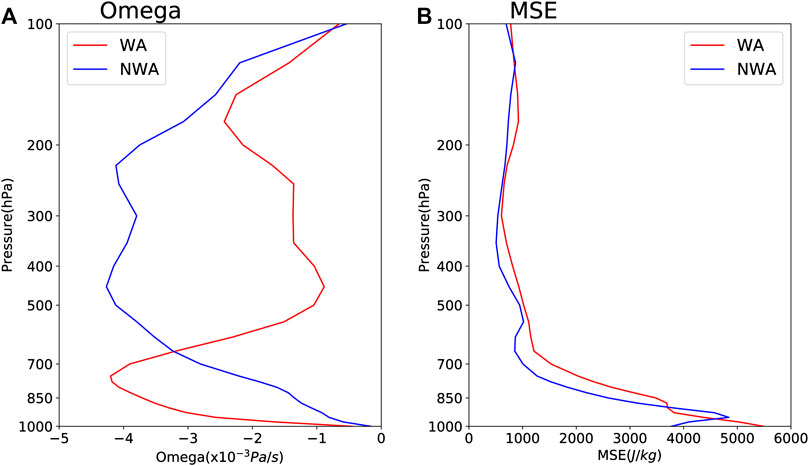
FIGURE 8. Linear regressions of the vertical profile of the austral summer (DJF) mean PC1 with (A) vertical velocity (10−3 Pa s−1) and (B) MSE (J kg−1) averaged over the NWA (blue line) and WA (red line) coastal regions during 1981–2018.
Although the <QR> term is relatively smaller than the horizontal and vertical advection terms (Figure 6), its pattern is similar to that of the subgrid-scale vertical MSE transport in most regions, but they have opposite signals (Figures 5C,D). Therefore, we further decompose the <QR> into the latent heat (LH), the sensible heat (SH), and the net radiation income (Rnet) components to explore their relative contributions (Figure 9). No significant linear relationships exist between the Ningaloo Niño and the surface LH and SH fluxes over the WA coastal regions (Figures 9AFigures 9B). Thus, both the area-averaged surface LH and SH fluxes are trivial compared to the net radiative heating (Rnet) (Figure 9D). While over the NWA coastal region, LH flux is greater than that over WA coastal region. It should be noted that significant column radiative heating mainly occurs over the tropics, but the stronger radiative heating over the NWA region corresponds to more vigorous convective rainfall (Figure 9C). It should also be noted that the maximum column radiative heating occurs in the equatorial region. The radiative heating rate is fundamentally determined by the incipient strength of solar radiation, while the cloud amount modulates only the regional distribution of radiation heating.
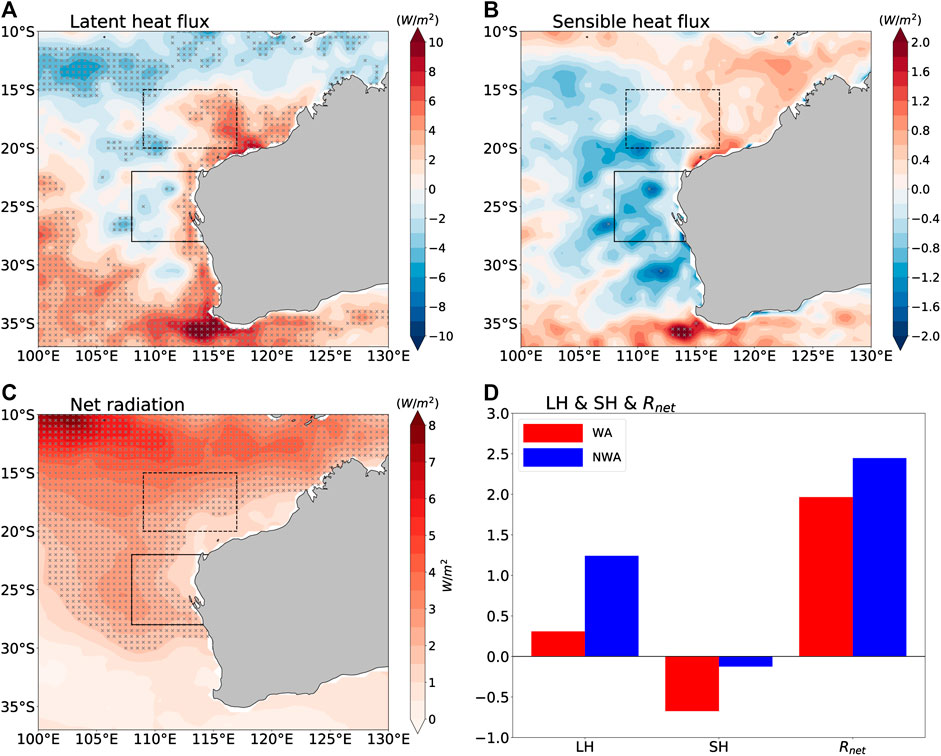
FIGURE 9. Linear regressions of the austral summer (DJF) mean (A) latent heat flux (W m−2), (B) sensible heat flux (W m−2), and (C) net radiative heating rate of the entire atmosphere (W m−2) during 1981–2018. The gray crosses indicate the variable anomalies above the 90% significance level by a Student t test. The solid and dashed boxes indicate the WA (108°E-coast, 28–22°S) and NWA (109–117°E, 20–15°S) coastal regions, respectively. (D) Latent heat flux, sensible heat flux and net radiative heating rate terms averaged over the NWA (blue bars) and WA (red bars) coastal regions.
Conclusion and Discussion
In this study, we investigated the interannual variability of Ningaloo Niño-related rainfall anomalies off the western and northwestern coasts of Australia as well as the associated dynamic mechanisms. During Ningaloo Niño events, the most pronounced rainfall enhancement occurs off the NWA coast. Over the ocean off the WA coast where the most significant SST warming prevails, the precipitation anomaly is also enhanced, but it is much smaller than that over the NWA coastal region. The remarkable enhancement of the Ningaloo Niño-related precipitation anomalies is accompanied by a decrease in low cloud cover and an increase in high cloud cover over both regions. In addition, the differences in cloud cover between WA and NWA verify the differential rainfall distribution in which deeper convections with heavier rainfall are favored over the NWA coastal region. The vertical velocity exhibits a top-heavy structure over the NWA coastal region and a bottom-heavy structure over the WA coastal region. Such vertical motions also correspond to the features of the observed rainfall and clouds.
The column-integrated MSE budget is used to investigate the atmospheric internal and external forcings of the enhanced rainfall over the NWA and WA coastal regions. The column-integrated MSE tendency consists of four major terms: horizontal MSE advection, vertical MSE advection, forcing in each atmospheric column including radiative heating and surface heat exchange, and subgrid-scale vertical transport. The results reveal that the negative horizontal MSE advection over the subtropics is the critical physical process responsible for the occurrence of the enhanced precipitation over the NWA coastal region. Although the vertical MSE advection over the WA is stronger than that over the NWA, the MSE is almost offset by the negative horizontal MSE advection, indicating that the horizontal winds prohibit the MSE recharge over the WA coastal region. Such a negative horizontal MSE advection is closely associated with the anomalous upper-level easterly blowing from the drier Australian continent to the WA coastal region. In contrast, over the NWA coastal region, the positive horizontal MSE advection, vertical MSE advection, and radiative and surface heating contribute to the MSE recharge and then induce the most enhanced precipitation there. Hence, the diverse MSE transport processes give rise to the enhanced precipitation pattern off the WA and NWA coasts during Ningaloo Niño events.
Kataoka et al. (2018) stressed the role of local intrinsic air-sea interactions in the development of the Ningaloo Niño. They revealed that a local positive SSTA enhances atmospheric deep convection and then results in more precipitation over the NWA coastal region via positive air-sea feedback. Anomalous positive precipitation enhances LH release to change the atmospheric circulation and lead to the low sea level pressure (SLP) anomalies off WA and the alongshore-northerly wind anomalies through the Matsuno-Gill response. Then, the anomalous northerly wind, in turn, enhances the warming SST in the WA coastal region. However, the present study demonstrated that the strengthened rainfall over the NWA coastal region was directly caused by internal atmospheric forcing (i.e., moisture and heat transport and direct radiative heating), which corresponds to the large-scale atmospheric anomalous circulation rather than local SH fluxes that are related to the oceanic thermal state. While the anomalous atmospheric circulation can be induced by local SSTA in the southeastern Indian Ocean (Tozuka et al., 2014; Li et al., 2019), it remains vague to separate the cause and effect of the enhanced precipitation and the Matsuno-Gill-like wind anomaly. Moreover, the background SST may also affect the rainfall pattern in which enhanced convection occurs at lower latitudes with warmer background SST. Numerical experiments are required to address the detailed processes of the convection-circulation interaction during Ningaloo Niño.
The present study suggests that the surface sensible and latent heat fluxes are negligible to moistening and heating in the entire troposphere during Ningaloo Niño events. However, the sensible and latent heat fluxes increase with the negative PC1 but decrease with the positive PC1 (not shown); hence, they are not linearly correlated with the Ningaloo Niño events. This result is similar to the asymmetric cloud-shortwave radiation-sea surface temperature feedback, which is considered to play a vital role in warming the Ningaloo Niño-related SST (Tozuka and Oettli, 2018). In addition, surface flux data from a reanalysis dataset are dubious since they are sensitive to the parameterization schemes in the numerical model. Surface heat flux data obtained by direct measurements should be used to validate this result, and an in-depth analysis of all the surface fluxes should be conducted to confirm this asymmetric relationship between the surface heat fluxes and Ningaloo Niño events. Furthermore, a variety of coastal Niño events, i.e., the Dakar Niño (Oettli et al., 2016) and the Benguela Niño (Richter et al., 2010), have been reported in recent years. A comparison of the rainfall mechanism during these coastal Niño events would be beneficial to understand the complex air-sea interaction during these events.
Data Availability Statement
The original contributions presented in the study are included in the article, further inquiries can be directed to the corresponding author.
Author Contributions
KX and TF conceived the idea and designed the analysis. TZ and TF organized the database and performed the relevant analysis. TZ wrote the first draft of the manuscript. All authors contributed to manuscript revision, read, and approved the submitted version.
Funding
This study was jointly supported by the National Key R&D Program of China (2019YFA0606701); the Strategic Priority Research Program of Chinese Academy of Sciences (XDA20060502), the Key Special Project for Introduced Talents Team of Southern Marine Science and Engineering Guangdong Laboratory (Guangzhou) (GML2019ZD0306), the National Natural Science Foundation of China (41775056, 42076020 and 41776023), the Youth Innovation Promotion Association CAS (2020340), the Open Foundation of Key Laboratory of Marine Science and Numerical Modeling, Ministry of Natural Resources (2020-ZD-04); and the Rising Star Foundation of the SCSIO (NHXX2018WL0201).
Conflict of Interest
The authors declare that the research was conducted in the absence of any commercial or financial relationships that could be construed as a potential conflict of interest.
Acknowledgments
We would like to thank Guidi Zhou for providing helpful comments.
References
Adler, R., Sapiano, M., Huffman, G., Wang, J.-J., Gu, G., Bolvin, D., et al. (2018). The global precipitation climatology project (GPCP) monthly analysis (new version 2.3) and a review of 2017 global precipitation. Atmosphere. 9, 138. doi:10.3390/atmos9040138
Arnold, N. P., Kuang, Z., and Tziperman, E. (2013). Enhanced MJO-like variability at high SST. J. Clim. 26, 988–1001. doi:10.1175/JCLI-D-12-00272.1
Back, L. E., and Bretherton, C. S. (2006). Geographic variability in the export of moist static energy and vertical motion profiles in the tropical Pacific. Geophys. Res. Lett. 33, L17810. doi:10.1029/2006GL026672
Benedict, J. J., and Randall, D. A. (2007). Observed characteristics of the MJO relative to maximum rainfall. J. Atmos. Sci. 64, 2332–2354. doi:10.1175/JAS3968.1
Benthuysen, J., Feng, M., and Zhong, L. (2014). Spatial patterns of warming off western Australia during the 2011 Ningaloo Niño: quantifying impacts of remote and local forcing. Continent. Shelf Res. 91, 232–246. doi:10.1016/j.csr.2014.09.014
Bui, H. X., Yu, J.-Y., and Chou, C. (2016). Impacts of vertical structure of large-scale vertical motion in tropical climate: moist static energy framework. J. Atmos. Sci. 73, 4427–4437. doi:10.1175/JAS-D-16-0031.1
Doi, T., Behera, S. K., and Yamagata, T. (2015). An interdecadal regime shift in rainfall predictability related to the Ningaloo Niño in the late 1990s. J. Geophys. Res. Oceans. 120, 1388–1396. doi:10.1002/2014JC010562
Doi, T., Behera, S. K., and Yamagata, T. (2013). Predictability of the Ningaloo niño/niña. Sci. Rep. 3, 2892. doi:10.1038/srep02892
Feng, M., McPhaden, M. J., Xie, S.-P., and Hafner, J. (2013). La Niña forces unprecedented Leeuwin current warming in 2011. Sci. Rep. 3, 1277. doi:10.1038/srep01277
Feng, T., Yang, X.-Q., Yu, J.-Y., and Huang, R. (2020a). Convective coupling in tropical-depression-type waves. Part I: rainfall characteristics and moisture structure. J. Atmos. Sci. 77, 3407–3422. doi:10.1175/JAS-D-19-0172.1
Feng, T., Yu, J.-Y., Yang, X.-Q., and Huang, R. (2020b). Convective coupling in tropical-depression-type waves. Part II: moisture and moist static energy budgets. J. Atmos. Sci. 77, 3423–3440. doi:10.1175/JAS-D-19-0173.1
Gill, A. E. (1980). Some simple solutions for heat-induced tropical circulation. Q. J. R. Meteorol. Soc. 106, 447–462. doi:10.1002/qj.49710644905
Guo, Y., Li, Y., Wang, F., Wei, Y., and Rong, Z. (2020a). Processes controlling sea surface temperature variability of Ningaloo Niño. J. Clim. 33, 4369–4389. doi:10.1175/jcli-d-19-0698.1
Guo, Y., Li, Y., Wang, F., Wei, Y., and Xia, Q. (2020b). Importance of resolving mesoscale eddies in the model simulation of Ningaloo Niño. Geophys. Res. Lett. 47, e2020GL087998. doi:10.1029/2020GL087998
Hersbach, H., and Dee, D. (2016). ERA5 reanalysis is in production. ECMWF Newsl., 147Available at: https://www.ecmwf.int/en/newsletter/147/news/era5-reanalysis-production
Huffman, G. J., Bolvin, D. T., Nelkin, E. J., Wolff, D. B., Adler, R. F., Gu, G., et al. (2007). The TRMM multisatellite precipitation analysis (TMPA): quasi-global, multiyear, combined-sensor precipitation estimates at fine scales. J. Hydrometeorol. 8, 38–55. doi:10.1175/JHM560.1
Kataoka, T., Masson, S., Izumo, T., Tozuka, T., and Yamagata, T. (2018). Can Ningaloo niño/niña develop without El niño-southern oscillation? Geophys. Res. Lett. 45, 7040–7048. doi:10.1029/2018GL078188
Kataoka, T., Tozuka, T., Behera, S., and Yamagata, T. (2014). On the Ningaloo niño/niña. Clim. Dynam. 43, 1463–1482. doi:10.1007/s00382-013-1961-z
Kataoka, T., Tozuka, T., and Yamagata, T. (2017). Generation and decay mechanisms of Ningaloo niño/niña. J. Geophys. Res. Oceans. 122, 8913–8932. doi:10.1002/2017JC012966
Kiranmayi, L., and Maloney, E. D. (2011). Intraseasonal moist static energy budget in reanalysis data. J. Geophys. Res. 116, D21117. doi:10.1029/2011JD016031
Kusunoki, H., Kido, S., and Tozuka, T. (2020). Contribution of oceanic wave propagation from the tropical Pacific to asymmetry of the Ningaloo Niño/Niña. Clim. Dynam. 54, 4865–4875. doi:10.1007/s00382-020-05268-5
Lee, H.-T., Gruber, A., Ellingson, R. G., and Laszlo, I. (2007). Development of the HIRS outgoing longwave radiation climate dataset. J. Atmos. Ocean. Technol. 24, 2029–2047. doi:10.1175/2007JTECHA989.1
Li, Y., Han, W., Zhang, L., and Wang, F. (2019). Decadal SST variability in the southeast indian ocean and its impact on regional climate. J. Clim. 32, 6299–6318. doi:10.1175/JCLI-D-19-0180.1
Liebmann, B., and Smith, C. A. (1996). Description of a complete (interpolated) outgoing longwave radiation dataset. Bull. Am. Meteorol. Soc. 77, 1275–1277. doi:10.1175/1520-0477-77.6.1274
Maloney, E. D. (2009). The moist static energy budget of a composite tropical intraseasonal oscillation in a climate model. J. Clim. 22, 711–729. doi:10.1175/2008JCLI2542.1
Marshall, A. G., Hendon, H. H., Feng, M., and Schiller, A. (2015). Initiation and amplification of the Ningaloo Niño. Clim. Dynam., 45, 2367–2385. doi:10.1007/s00382-015-2477-5
Matsuno, T. (1966). Quasi-geostrophic motions in the equatorial area. J. Meteorol. Soc. Jpn. 44, 25–43. doi:10.2151/jmsj1965.44.1_25
Neelin, J. D., and Held, I. M. (1987). Modeing tropical convergence based on the moist static energy budget. Mon. Weather Rev. 115, 3–12. doi:10.1175/1520-0493(1987)115<0003:mtcbot>2.0.co;2
NOAA (1996). NOAA interpolated outgoing longwave radiation (OLR). NOAA/ESRL/Physical Sci. Div, Available at: https://psl.noaa.gov/data/gridded/data.interp_OLR.html
Oettli, P., Morioka, Y., and Yamagata, T. (2016). A regional climate mode discovered in the north Atlantic: dakar niño/niña. Sci. Rep. 6, 18782. doi:10.1038/srep18782 CrossRef Full Text |
Pearce, A. F., and Feng, M. (2013). The rise and fall of the “marine heat wave” off Western Australia during the summer of 2010/2011. J. Mar. Syst. 111-112, 139–156. doi:10.1016/j.jmarsys.2012.10.009
Reynolds, R. W., Rayner, N. A., Smith, T. M., Stokes, D. C., and Wang, W. (2002). An improved in situ and satellite SST analysis for climate. J. Clim. 15, 1609–1625. doi:10.1175/1520-0442(2002)015<1609:aiisas>2.0.co;2
Richards, F., and Arkin, P. (1981). On the relationship between satellite-observed cloud cover and precipitation. Mon. Weather Rev. 109, 1081–1093. doi:10.1175/1520-0493(1981)109<1081:otrbso>2.0.co;2
Richter, I., Behera, S. K., Masumoto, Y., Taguchi, B., Komori, N., and Yamagata, T. (2010). On the triggering of Benguela Niños: remote equatorial versus local influences. Geophys. Res. Lett. 37, L20604. doi:10.1029/2010GL044461
Schneider, T., Bischoff, T., and Haug, G. H. (2014). Migrations and dynamics of the intertropical convergence zone. Nature 513, 45–53. doi:10.1038/nature13636
Sobel, A., Wang, S., and Kim, D. (2014). Moist static energy budget of the MJO during DYNAMO. J. Atmos. Sci. 71, 4276–4291. doi:10.1175/JAS-D-14-0052.1
Su, L., Du, Y., Feng, M., and Li, J. (2019). Ningaloo Niño/Niña and their regional climate impacts as recorded by corals along the coast of Western Australia. Palaeogeogr. Palaeoclimatol. Palaeoecol. 535, 109368. doi:10.1016/j.palaeo.2019.109368
Sumi, Y., and Masunaga, H. (2016). A moist static energy budget analysis of quasi-2-day waves using satellite and reanalysis data. J. Atmos. Sci. 73, 743–759. doi:10.1175/JAS-D-15-0098.1
Tanuma, N., and Tozuka, T. (2020). Influences of the interdecadal acific oscillation on the locally amplified Ningaloo Niño Geophys. Res. Lett. 47, e2020GL088712. doi:10.1029/2020gl088712
Tozuka, T., Kataoka, T., and Yamagata, T. (2014). Locally and remotely forced atmospheric circulation anomalies of Ningaloo Niño/Niña. Clim. Dynam. 43, 2197–2205. doi:10.1007/s00382-013-2044-x
Tozuka, T., and Oettli, P. (2018). Asymmetric cloud-shortwave radiation-sea surface temperature feedback of Ningaloo niño/niña. Geophys. Res. Lett. 45, 9870–9879. doi:10.1029/2018GL079869
Vuille, M., and Keimig, F. (2004). Interannual variability of summertime convective cloudiness and precipitation in the central Andes derived from ISCCP-B3 data. J. Clim. 17, 3334–3348. doi:10.1175/1520-0442(2004)017<3334:ivoscc>2.0.co;2
Webb, M. J., Andrews, T., Bodas-Salcedo, A., Bony, S., Bretherton, C. S., Chadwick, R., et al. (2017). The cloud feedback model Intercomparison Project (CFMIP) contribution to CMIP6. Geosci. Model Dev. 10, 359–384. doi:10.5194/gmd-10-359-2017
Wernberg, T., Smale, D. A., Tuya, F., Thomsen, M. S., Langlois, T. J., De Bettignies, T., et al. (2013). An extreme climatic event alters marine ecosystem structure in a global biodiversity hotspot. Nat. Clim. Change. 3, 78–82. doi:10.1038/nclimate1627
Yanai, M., Esbensen, S., and Chu, J.-H. (1973). Determination of bulk properties of tropical cloud clusters from large-scale heat and moisture budgets. J. Atmos. Sci. 30, 611–627. doi:10.1175/1520-0469(1973)030<0611:dobpot>2.0.co;2
Zhang, L., and Han, W. (2018). Impact of Ningaloo Niño on tropical Pacific and an interbasin coupling mechanism. Geophys. Res. Lett. 45, 11300–11309. doi:10.1029/2018GL078579
Zhang, L., Han, W., Li, Y., and Shinoda, T. (2018). Mechanisms for generation and development of the Ningaloo Niño. J. Clim. 31, 9239–9259. doi:10.1175/JCLI-D-18-0175.1
Keywords: Ningaloo Niño, precipitation, moist static energy, tropical convection, surface heat flux, interannual variability
Citation: Zheng T, Feng T, Xu K and Cheng X (2020) Precipitation and the Associated Moist Static Energy Budget off Western Australia in Conjunction with Ningaloo Niño. Front. Earth Sci. 8:597915. doi: 10.3389/feart.2020.597915
Received: 22 August 2020; Accepted: 12 October 2020;
Published: 10 November 2020.
Edited by:
Zhiwei Zhu, Nanjing University of Information Science and Technology, ChinaReviewed by:
Yuanlong Li, Chinese Academy of Sciences, ChinaXiaolin Zhang, University of Hamburg, Germany
Copyright © 2020 Zheng, Feng, Xu and Cheng. This is an open-access article distributed under the terms of the Creative Commons Attribution License (CC BY). The use, distribution or reproduction in other forums is permitted, provided the original author(s) and the copyright owner(s) are credited and that the original publication in this journal is cited, in accordance with accepted academic practice. No use, distribution or reproduction is permitted which does not comply with these terms.
*Correspondence: Kang Xu, xukang@scsio.ac.cn