Influence of Lithosphere Rheology on Seismicity in an Intracontinental Rift: The Case of the Rhine Graben
 Denis Anikiev
 Mauro Cacace
 Judith Bott
 Maria Laura Gomez Dacal
 Magdalena Scheck-Wenderoth
- 1Section 4.5: Basin Modelling, Department 4: Geosystems, GFZ German Research Centre for Geosciences, Potsdam, Germany
- 2Faculty of Georesources and Material Engineering, RWTH Aachen University, Aachen, Germany
The Upper Rhine Graben (URG), as a part of the wider European Cenozoic Rift System, is a tectonically active area that has been extensively investigated for its geothermal energy potential. In this study, we carry out a first investigation of the present-day thermo-mechanical stability of the area as based on a detailed 3D geological and thermal model. The overall goal is, therefore, to assess how the lithospheric strength varies within the URG in response to the natural tectonic setting as well as the internal thermal configuration, and how those variations can be related to the recorded seismicity. The results from the modeling indicate that there is a spatial correlation between the predictions for the graben-wide rheological configuration with both the deep thermal field and the configuration of the crystalline crust. We find that the regional characteristics of the long-term strength of the lithosphere match the spatial distribution of seismicity, indicating that the mechanical stability of the area is primarily controlled by resolved strength variations. By cross-plotting the modeled strength distribution with available seismicity catalogs, our results suggest that seismicity in the graben area is shallower and of lower intensity due to a hotter and weaker crust compared to its surrounding areas. In contrast, seismic energy release appears to occur at deeper levels and being of larger magnitudes east of the graben and in the adjacent Lower Rhine Graben to the north. These results demonstrate the relevance of a proper quantification of the lithospheric rheological configuration and its spatial variability in response to its tectonic inheritance as an asset to interpret the pattern and distribution of seismicity observed in the area.
Introduction
The Upper Rhine Graben (URG) is a continental rift that extends for roughly 320 km in a NNE-SSW direction (Mayer et al., 1997; Lopes Cardozo and Granet, 2005; Barth et al., 2015) along the French-German border in Central Europe (Figures 1A,B). It formed as a part of European Cenozoic Rift System (Ziegler, 1992) on a heterogeneous crust which was consolidated during the Variscan orogeny in the Latest Paleozoic and subsequently affected by regional subsidence during the Mesozoic (Ziegler, 1990; Franke, 2000). Bounded by the Vosges and Black Forest mountain ranges in the south (Figure 1B), the URG has an average width of 36 km (Mayer et al., 1997). Extensional tectonics in the graben started in Eocene times and has evolved into a transtensional regime at present with predominant sinistral-normal kinematics (Schumacher, 2002; Lopes Cardozo and Granet, 2005; Homuth et al., 2014; Bertrand et al., 2018). This makes the URG one of the seismically most active areas in Germany (Henrion et al., 2020; Figure 1C).
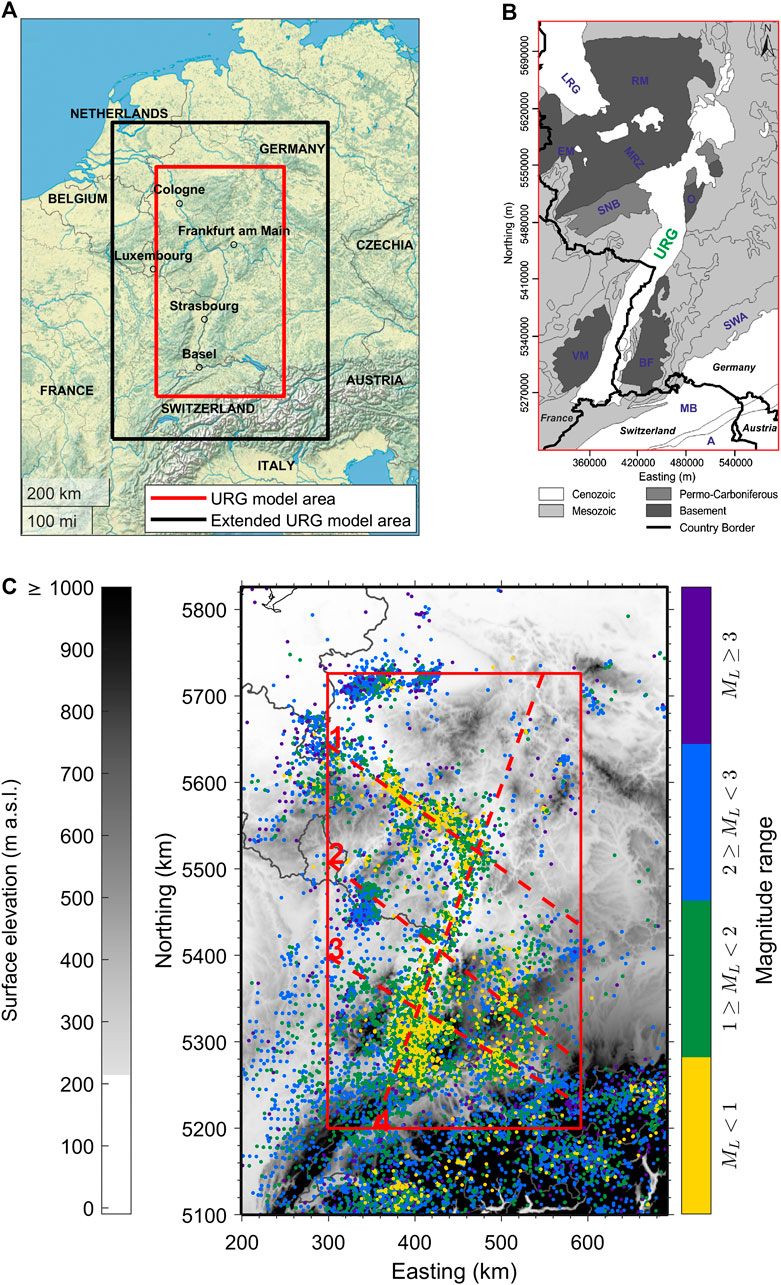
FIGURE 1. (A) Geographical location of the area of interest: original 3D URG (Freymark et al., 2017; Freymark et al., 2020) area (inner red rectangle) and extended study area (outer black rectangle); (B) geological map of the URG model [modified from Freymark et al. (2017)], depicting the main tectonic domains: Upper Rhine Graben (URG), Lower Rhine Graben (LRG), Black Forest (BF), Eifel Mountains (EM), Vosges Mountains (VM), Molasse Basin (MB), Middle Rhine Zone (MRZ), Odenwald (O), Rhenish Massif (RM), Saar Nahe Basin (SNB), Swabian Alb (SWA) and Alps (A); (C) topography (ETOPO1, Amante and Eakins, 2009] of the extended study area in grayscale (left color bar) with recorded seismicity shown as dots color-coded according to their magnitudes (right color bar); the original 3D URG model area is limited by the red rectangle; red dashed lines display the four vertical profiles selected for a detailed study (see text for more details). Coordinates are given in UTM Zone 32 N.
In the last decades, the URG has been the focus of a long list of exploration studies aiming at quantifying the distribution and availability of potential geothermal resources in the subsurface (e.g., Meixner et al., 2016; Vidal and Genter, 2018). Given its geological setting, all geothermal operations so far have considered its petrothermal potential (Cuenot et al., 2006; Baujard et al., 2017; Kushnir et al., 2018; Vallier et al., 2019), thereby relying on stimulation techniques to enhance the productivity of the in-situ reservoirs (“hot dry rock system”). These stimulation treatments have been shown to potentially increase the seismic hazard in the URG, thus posing safety concerns among the public (Egert et al., 2020). Different studies have investigated the mechanical response of specific targeted reservoirs during reservoir operations (Charléty et al., 2007; Calò et al., 2014; Maurer et al., 2020), though a regional investigation of the graben stability under the in-situ stress field is still lacking. Therefore, in this study, we investigate the thermo-mechanical configuration of the whole region with respect to the natural, that is, the tectonic and structural framework. We make use of a recently published 3D structural and thermal model of the URG (Freymark et al., 2017; Freymark et al., 2020) to derive spatial variations in lithospheric and crustal strength. The input 3D structural and thermal model integrate detailed information about the geology of the area, comprising a heterogeneous sedimentary sequence, upper and lower crustal domains and a lithospheric mantle. The model area also covers parts of the Alpine Orogen south of the URG as well as the western Molasse Basin and extends northward to the Lower Rhine Graben (LRG) and the Eifel region (Figure 1B). The model has originally been developed to assess the geothermal potential based on the variability in predicted temperatures, to overcome the lack of direct observables for the deeper crust and mantle. This structural and thermal model has been input into a rheological module (Cacace and Scheck-Wenderoth, 2016) to compute the steady strength distribution for the study area describing the long-term background rheological configuration.
The model outcomes are compared to the observed distribution of seismicity (Figure 1C) in the region (e.g., Homuth et al., 2014; Barth et al., 2015) in an attempt to understand if a causative relationship exists between the resolved variations in crustal rheology and the seismic activity in the area and to derive insights into the interaction of deformation controlling factors across the entire rift.
Materials and Methods
Seismic Catalog
For the purpose of our study, we first derive a consistent seismic catalog as based on available sources. In total, we rely on eight different seismic catalogs: four catalogs are available from global earthquake web services: the GEOFON program of the GFZ German Research Centre for Geosciences using data from the GEVN partner networks (GEOFON Data Centre, 2020), USGS (U.S. Geological Survey, 2020), International Seismological Centre: ISC Bulletin (Storchak et al., 2017; International Seismological Centre, 2020b) and ISC-EHB Bulletin (Weston et al., 2018; International Seismological Centre, 2020a). These have been integrated both with earthquake catalogs of specific regions in the study area—the federal states of Baden-Württemberg (Seismisches Bulletins Baden-Württemberg, 1996–2019; LGRB, 2020) and Hessen (Seismischer Katalog des Landes Hessen, Version 2019, SKHe 2019; HLNUG, 2020) and with two combined earthquake catalogs published by Homuth et al. (2014) and Barth et al. (2015).
Based on these instrumental seismic records and harmonized data from modern and ancient sources dating back to the XI century (Grünthal et al., 2009; Barth et al., 2015), seismic activity in the URG has been constrained to occur preferentially within the graben area proper and, though minor, along its shoulders (Figure 1C). The largest known event in the area occurred near Basel in 1356 with an estimated MW of 6.9 ± 0.2 (Fäh et al., 2009; Barth et al., 2015).
The seismic catalogs were analyzed for their consistency and spatial reliability and finally merged into a unified catalog for our area of interest. In the following, we describe in some details the processing sequence followed [as also suggested by Barth et al. (2015)], which comprises the following steps:
• merging all available information to a single joint catalog of seismicity;
• limiting the data with respect to the spatial extent of the study area;
• evaluating the type of seismic events and restricting them to natural seismicity;
• limiting the data to a relevant time frame for the study;
• identifying and removing all double-listed events;
• evaluating the depth reliability/validity of events.
After merging the available information, we selected the spatial coverage of the seismicity data by extending by 100 km across each side the original 3D model of the URG (Freymark et al., 2017; Freymark et al., 2020; Figure 1A). This was done to include events that may affect the model boundaries. The final box for which seismic events are considered (Figure 1A) therefore covers an area of 493 km in W-E direction times 726 km in N-S direction (Figure 1C).
The catalog provided by Barth et al. (2015) contains information about the type of event (main shock, aftershock, foreshock, induced, single event) as described in the supplementary materials of Barth et al. (2015). For the sake of consistency, we have limited our catalog to single and main shock events only, thus dismissing all fore-/aftershocks and induced seismicity. Our choice stems from the fact that we are interested in correlating the first-order variations in the long-term crustal strength to the recorded seismic activity as occurring naturally from the background thermo-mechanical configuration of the area and therefore not being overprinted by anthropogenic sources and or transients.
The Baden-Württemberg (LGRB, 2020) and the Hessen (HLNUG, 2020) earthquake catalogs are complete till the end of 2019. Therefore, we have limited the time frame of the joint catalog to the end of December 2019. The time frame starts from December 1080, when the first event described in the literature (CENEC; Grünthal and Wahlström; 2003; Grünthal et al., 2009; Supplementary Material) took place.
Double-listed events were sampled out from the joint catalog by following the procedure suggested by Barth et al. (2015): we assumed two events to represent the same earthquake, if their origin times differ by less than 5 s and their epicenters are closer than 15 km. This left us with 17,886 seismic events in the final catalog (Figure 1C; Supplementary Material).
The majority of magnitude values gathered in the joint catalog are local magnitudes
The source depth of an earthquake is the most difficult parameter to be determined. Its accuracy depends on the density and proximity of the seismic stations to the earthquake epicenter. It is quite often that the reported depth of an event hypocenter is not explicitly determined but is rather fixed (see, e.g., GEOFON Data Center, 2020; U.S. Geological Survey, 2020). Therefore, in the final processing step, we removed events with unreliable depths. At first, all events reported to have fixed and zero depths were excluded. Then, we removed all events with depth errors larger than 5 km from the USGS (U.S. Geological Survey, 2020) and the ISC-EHB Bulletin (Weston et al., 2018; International Seismological Centre, 2020a) catalogs. Finally, we excluded events with assigned constant depths of 5 and 10 km from the GEOFON catalog (GEOFON Data Centre, 2020), the ISC Bulletin (International Seismological Centre, 2020b) and the catalog from Barth et al. (2015). This was done because these data entered a significant and unrealistic bias to the trend, as seen from comparison of depth distributions between the full catalog and the resulting catalog of events with reliable depths (Figure 2).
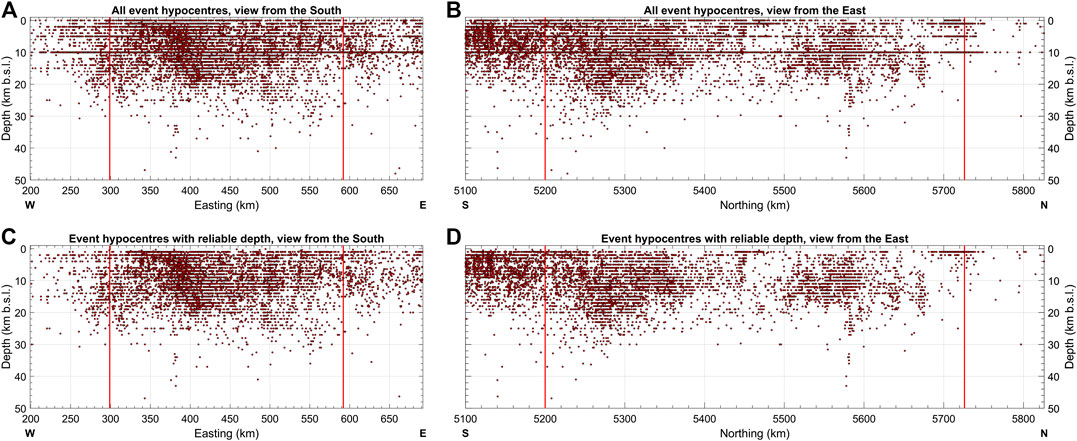
FIGURE 2. Depths of hypocenters of seismic events bounded by the extended model rectangle: (A)–(B) all events; (C)–(D) events with reliable depths; (A) and (C) correspond to the view from the South; (B) and (D) shows the view from the East. Hypocenters are shown by red dots. The two red vertical lines depict the boundaries of the 3D URG model.
Figures 2A,B portray the depths of all 17,886 events in the extended model area (Figures 1A,C; Supplementary Material) along a south and east perspective, whereas Figures 2C,D show a similar view though limited to events with reliable hypocenter depths (9,522 events; Supplementary Material). Although Figure 2 represents only a cumulative view of the distribution of hypocenter depths, it already reveals the seismicity in the southern part of the URG to have a larger depth variability and density when compared to the central part of the graben (Figure 2D). In the south, the majority of events are shallower than 25 km b.s.l., whereas in its central part a gap of seismicity is evident at depths between 1 and 10 km b.s.l. In the northern part of the URG, the majority of events is above 20 km b.s.l. with a clear vertical trend of seismic events down to 45 km b.s.l. at the border of the URG with the Rhenish Massif (380 km Easting, 5,580 km Northing on Figures 2C,D; see also Figure 1B). The southern part of the URG, as well as the Alpine region, are the two areas that are more densely and accurately observed for seismic events which results in a higher accuracy of seismic events depths (reported depths for these areas often have extended accuracy beyond the usual rounded values, thus filling gaps between integer depth levels in Figure 2). In general, the Alpine region reveals a denser and shallower (above 15 km b.s.l.) distribution of earthquakes.
Though the time frame for the full catalog starts from December 1080 (as mentioned above), the first event with sufficient reliability of depth occurred on August 1, 1956. Therefore, we finally restricted the time frame of the catalog of events with reliable depth to start on August 1956 and to end on December 2019 (see Supplementary Material).
To further explore the depth trends, we have selected four vertical profiles across the model based on their spatial proximity to seismicity clusters (Figure 1C). In order to associate seismicity with these selected profiles, we have picked seismic events with reliable depths (from Figures 2C,D) and epicenters within 5 km distance from each profile. Figure 3 shows the four selected profiles where different colors are used to highlight events associated to each profile.
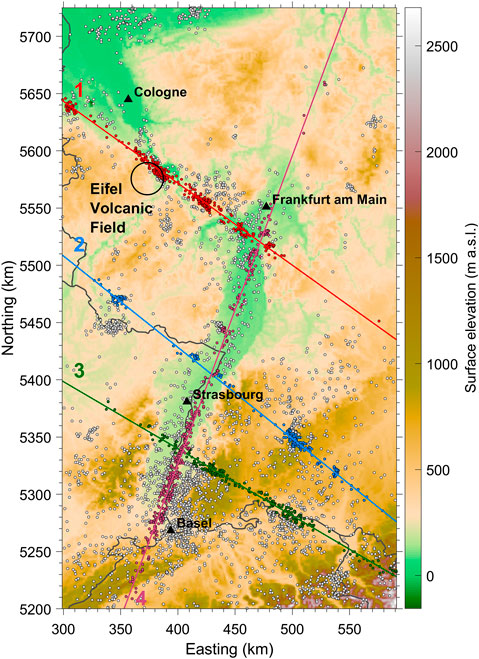
FIGURE 3. Selected vertical profiles and associated seismic events with reliable depths and epicenters (within 5 km distance from each profile), shown with dots color-coded by profile colors and plotted on topography background (ETOPO1, Amante and Eakins, 2009). Profile 1 has 775 associated events, profile 2: 480 events, profile 3: 486 events; profile 4: 679 events. White dots represent remaining non-associated events. Deep-grey lines show country boundaries. Black circle shows the location of the Eifel Volcanic Field. Black triangles depict reference cities.
3D Geological and Thermal Model
The Cenozoic and Permo-Mesozoic sedimentary basins covering the area are located in the foreland of the Alps (Figure 1B) and were studied by integrating boreholes and seismic data (Behrmann et al., 2005; GeORG-Projektteam, 2013; Freymark et al., 2017). The crystalline crust, imaged by deep seismic experiments (Lüschen et al., 1989; Blundell et al., 1992; Meissner and Bortfeld, 2014, among others), is differentiated into a “transparent” upper crust and a reflective lower crust. Furthermore, seismological models provided information about the variability in lithospheric mantle thickness across the region (Geissler et al., 2010). These different types of data have been integrated into a lithospheric-scale 3D density model by Freymark et al. (2017), which was further constrained against the observed gravity. The model covers a region extending 525 km in N-S direction and 290 km in E-W direction (Figure 1C).
According to differences in rock types, as constrained from outcropping sections and from geophysical data, the 3D model of Freymark et al. (2017) differentiates 24 units that altogether represent the sedimentary and volcanic cover, the crystalline upper and lower crust and the lithospheric mantle (Table 1). The first-order structural characteristics, as relevant for this study, are illustrated in Figure 4, where the maps of the upper and lower crustal thickness (Figures 4A and 4B, respectively) as well as the depth to the crust-mantle-boundary (Moho; Figure 4C) and to the Lithosphere-Asthenosphere Boundary (LAB; Figure 4D) are depicted. Also, the structural configuration is exemplary shown along the profile 4 (Figure 4E).
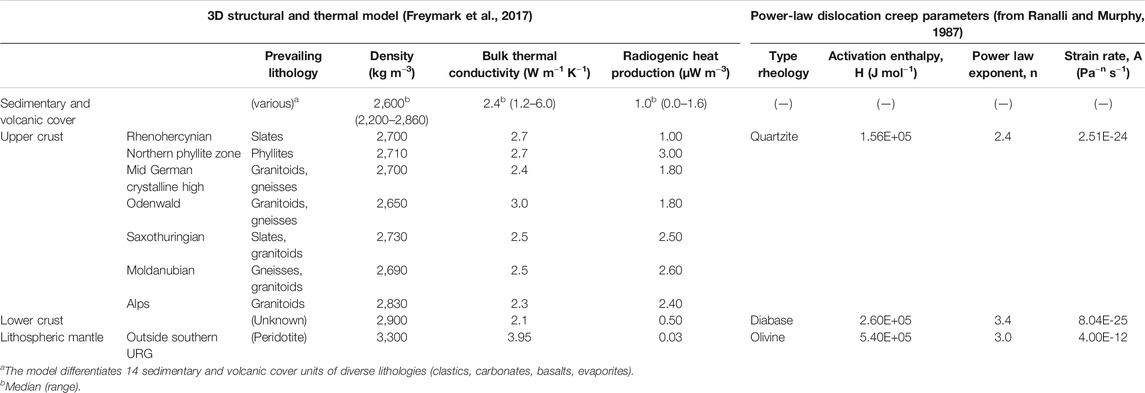
TABLE 1. Thermal and mechanical properties of model units.
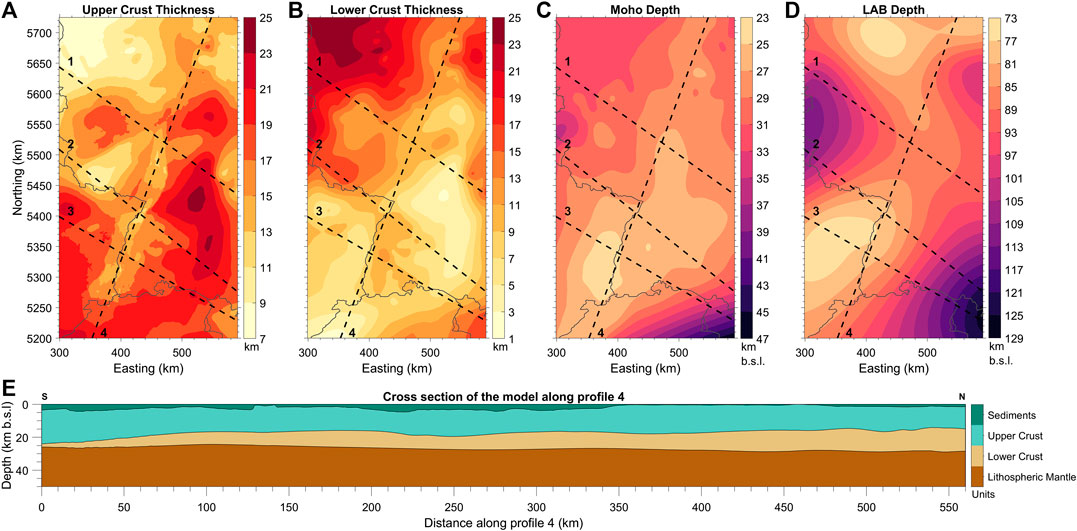
FIGURE 4. Main characteristics of the 3D structural model after Freymark et al. (2017):(A) thickness of the Upper Crust; (B) thickness of the Lower Crust; (C) depth to the Moho crust-mantle boundary; (D) depth to the Lithosphere-Asthenosphere boundary; (E) geological units across profile 4 [simplified after Freymark et al. (2017)]. Deep-grey lines on (A)–(C) delineate country boundaries.
As a result of a comprehensive integration of existing 3D models [e.g., “Hessen 3D” of Arndt et al. (2011); “GeORG” of the GeORG-Projektteam (2013)] and various geological and geophysical observations, the 3D model of Freymark et al. (2017) is consistent with geological maps, borehole formation top data, reflection and refraction seismic profiles and major gravity anomalies (Freymark et al., 2017 and references therein). Furthermore, the 3D model resolves computed variations in the thermal field that have been validated against a set of available borehole temperatures. Hence, the model provides us with unit-specific information on the prevailing lithology, bulk density, and bulk rock thermal properties (Table 1) as well as computed temperatures under the assumption of steady-state heat conduction. These attributes are distributed on a grid of 1 km horizontal resolution and a vertical resolution corresponding to the variable thicknesses of the geological layers.
The modeled crystalline crust below the depositional cover is bi-parted with a homogeneous lower crust and a laterally differentiated upper crust representing crustal blocks of different tectonic origins (Freymark et al., 2017). The configuration of the crystalline upper crust traces back to the Variscan Orogeny when terranes of different composition collided and experienced intensive syn- and post-orogenic deformation and metamorphism (e.g., Franke, 2000). These developments find their expression in a lateral differentiation of the upper crust into seven sub-units considered as individual units with specific rock properties in the model of Freymark et al. (2017) (Table 1). At present day, the study area is part of the northern Alpine foreland where the Rhine graben developed as a part of the European Cenozoic Rift System through different tectonic phases dating back to the Eocene (e.g., Dèzes et al., 2004). As a result of rifting, the upper crust in the URG was thinned by several kilometers compared to the adjacent domains (Figure 4A). The upper/lower crustal interface (Freymark et al., 2017) has been derived based on 21 reflection and refraction seismic profiles (mainly originating from the DEKORP seismic program, e.g., Meissner and Bortfeld, 2014) and thus widely corresponds to the interface between the “transparent,” seismically slower upper crust and the highly reflective, faster lower crust. Off the seismic profiles, the 3D depth configuration of this interface has been derived by relying on the best gravity response of the model considering observed gravity anomalies and density differences between the upper and the lower crust (Table 1). Based on seismic velocities and modeled densities, Freymark et al. (2017) interpreted the upper crust to be composed of felsic rocks, whereas the lower crust is interpreted to be of a mafic composition. Overall the work of Freymark et al. (2017) integrating seismic data with the observed gravity field, demonstrated that both the upper and the lower crust show large lateral thickness variations (Figures 4A,B) that in turn will influence the rheological characteristics of the lithosphere. In particular, the upper crust is thicker in the surroundings of the URG whereas the mafic lower crust severely thickens in the north-western part of the model area.
The depth to the crust-mantle-boundary (Moho; Figure 4C) is the result of an interpolation between the seismically constrained dataset derived from Mechie (2007) and NAGRA (Heidbach and Hergert, 2012). The Moho is shallowest (<25 km deep) below the URG, moderately deep in the NW domain (30–35 km) and deepest in the SE below the Alps (>40 km).
The deepest structural element of the 3D model is the seismological lithosphere-asthenosphere boundary (LAB) as derived from SP receiver functions (Geissler et al., 2010). The latter is assumed to coincide with an internal thermo-chemical boundary separating the rigid lithosphere from the underlying convective viscous mantle (1,300° isotherm). The most important features in the LAB topology are 1) a NE-SW elongated structural high in the SW, 2) a N-S striking high below the Eifel region, and 3) a structural low below the Alpine foothills in the SE (Figure 4D). The LAB is assumed to coincide with an isotherm (fixed lower boundary condition of T = 1,300°C), therefore variations in its topography (ca. 75–125 km) have important implications for the steady-state conductive thermal state of the whole plate, where a shallower LAB corresponds to a steeper geothermal gradient and vice versa.
The other boundary condition adopted in the thermal modeling is a fixed, though spatially varying temperature (range between 1 and 12°C) at the model surface [global Earth’s surface elevation derived from Amante and Eakins (2009)], here adopted as representing an annual mean of surface temperature in the study area (Freymark et al., 2017 and references therein).
As the details of the thermal modeling study have been published elsewhere (Freymark et al., 2017), we here only outline the most important features, as relevant for the rheological study that follows. Therefore, we limit our discussion to the description of depth maps for two isotherms (450–600°C; Figure 5). These isotherms are considered representative for the thermal field at crustal and deeper levels. They also have important rheological implications as upper and lower bounds of the region of maximum dissipation potential for a viscous fluid-like plate parameterized in terms of commonly assumed minerals representative of crustal and mantle rocks, respectively (see also next paragraph). The 450°C isotherm (Figure 5A) is located within the upper crust in the SE parts of the study area and within the lower crust in the NW. The match between the domain where this isotherm attains greater depths in the NW and the extent of the thickened mafic lower crust (Figure 4B) is striking and we relate this finding to the fact that this model unit is depleted in radiogenic minerals (Table 1). Moreover, the parameterization of the different upper crustal blocks in terms of heat generation rates differentiates less radiogenic domains in the NW consistent with the main lithological trends outcropping at the surface (Freymark et al., 2017). The same authors demonstrated that such differentiation was indeed needed to fit observed borehole temperatures. The 450°C isotherm is shallowest in the domain of the URG proper and in the area adjacent to the URG in the SW, areas where a thick sedimentary cover is also present. Sediment thickness varies from 0 m in the NW part of the study area to locally >3.5 km in the URG (Freymark et al., 2017). Also, the Moho and the LAB are significantly elevated in this region (Figures 4C,D), the latter implying an overall steeper geothermal gradient in this area. Accordingly, the thermal influences of the thick radiogenic upper crust and the shallow LAB depth are superimposed in these domains by thermal blanketing from the sedimentary and volcanic units. The latter are characterized by lower thermal conductivities than the crystalline crustal rocks (Table 1), which results in heat storage in the shallow part of the crust.
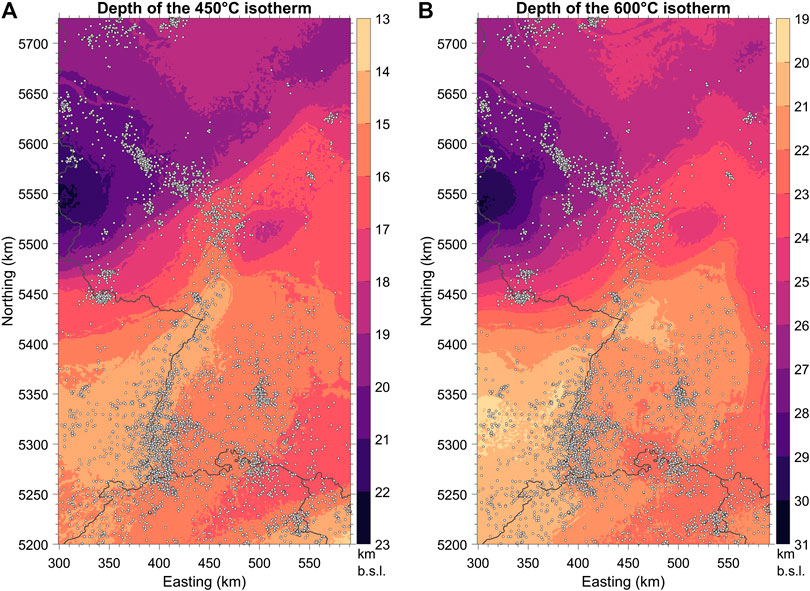
FIGURE 5. Maps of depths of the (A) 450°C isotherm and (B) 650°C isotherm compared with seismicity. Light-grey dots show epicenters of seismic events with reliable depths. Deep-grey lines show country boundaries.
The 600°C isotherm (Figure 5B) is located within the lower crystalline crust and in the upper lithospheric mantle. Overall the 600°C isotherm displays a similar pattern as the 450°C isotherm, indicating a colder NW half of the study area and a hotter SW domain with shallowest depths in the URG. The isotherm is deepest (up to 31 km b.s.l.) NW of the URG and S of the LRG. Northeast of the LRG, the isotherm rises again in the central part of the northern model boundary in response to a shallowing of the LAB in the Eifel region.
The distribution of seismicity (Figure 1C) indicates a clustering of earthquakes in the domains where the two isotherms are shallowest in the URG, an aspect that already suggests a first-order correlation between the regional tectono-thermal configuration of the study area and its mechanical stability. However, there are also clusters of seismicity in the colder NW part aligned along the 20 and 27 km depth isolines for the 450–600°C isotherms, respectively. These observations will be investigated in more details in the following.
Rheological Modeling Approach
As discussed in the introduction, the main goal of this study is to investigate whether a correlation between the seismicity distribution and the internal thermal and rheological configuration exists in the study area. We therefore assess its rheological state as based on the previously described data-constrained 3D structural and thermal model (Freymark et al., 2017). The model is the main input into a rheological module to compute the steady strength distribution following the approach as described in more details in Cacace and Scheck-Wenderoth (2016). The long-term mechanical behavior of the lithosphere (i.e., for time scales greater than the characteristic relaxation time of the considered plate) is usually modeled by relying on the concept of a static (secondary creep) rheology. Under this assumption, at shallow depth levels rocks exhibit primarily static frictional behavior. Frictional rock behavior is considered to follow Byerlee’s law, thereby being independent of the background temperature conditions, but only sensitive to the level of effective confining pressure (static friction) described by the following constitutive law (e.g., Ranalli, 1995):
In Eq. 1,
With increasing depths, rocks tend to deform as a viscous (non)Newtonian fluid, though experiments demonstrated the onset of low temperature crystal plasticity to occur at confining pressures higher than approximately 200 MPa (Katayama and Karato, 2008), which can be parameterized as:
where
This view of rock deformation leads to the overly famous Brace and Kohlstedt strength concept (Brace and Kohlstedt, 1980), where the envelope in a differential stress vs. depth diagram (minimum between
The BDT is thought to provide a conservative estimate of the seismogenic zone, and therefore, of the depth distribution of seismicity within a lithospheric plate. The assumption at play is that stored elastic energy can be effectively dissipated by viscous creep below the BDT, thus limiting earthquake occurrence to the brittle realm (Burov, 2011). The efficiency of viscous creep can be parameterized in terms of an effective viscosity parameter that follows a thermally activated power-law flow law, as typical for dislocation creep as:
Given that the rate of viscous dissipation depends primarily upon background temperature conditions, it seems rather obvious to correlate the seismicity pattern beneath a specific area to the resolved thermal configuration of the plate. This approach has been extremely successful when applied to the study of the evolution of oceanic plates, though its direct use for the continental lithosphere has been hindered by the relative geological complexity of the latter (Burov, 2011).
The main assumption of our rheological approach stems from quasi-static loading conditions, i.e., a steady strain rate approximation. Though, strain rate values can be assigned as non-uniform across the model, we decided at this stage to make use of a constant and uniform strain rate value of
To assign viscous creep parameters, we follow the main structural units of the 3D model, whereby each unit has been parameterized as uniform in terms of its prevalent lithology. In doing so, we opt for a quartzite upper crust, a diabase enriched lower crust, and a peridotitic upper mantle (Table 1). This differentiation accounts for an overall strength increase from felsic to mafic and to ultramafic composition (e.g., Ranalli and Murphy, 1987). Table 1 lists the rheological parameters adopted in the study. Frictional brittle behavior has been parameterized consistent with the prevailing extensional-to-transtentional kinematics observed across the region (Heidbach et al., 2016) with additional constraints from the model by Freymark et al. (2017) (Table 1). In the present study, we did not attempt any further differentiation in the bulk rheological behavior of the different upper crustal sub-units since we consider that such a differentiation would lead to over-interpreting the geodynamic implications of the structural model. Instead, by assuming a constant rheology for all upper crustal sub-units, we are able to quantify the first-order effects of the resolved thermal configuration on the regional mechanical behavior, and, by direct comparison with the available seismic catalog, to the observed seismicity distribution in the area.
Results
Figure 6 portrays the computed map of integrated strength [crust and total lithosphere in panels (A) and (B), respectively] for the whole study area. A remarkable feature of the two maps is a heterogeneous strength distribution, with a clear minimum across the URG. The presence of lower than surrounding crustal (and lithospheric) strength values in this domain are structurally linked to the regional thermal configuration, with the URG being hotter than the surrounding domains (Figure 5). This is due to the concomitant presence of an elevated LAB underlying a thinned and mechanically decoupled upper crust (in response to transtentional tectonics).
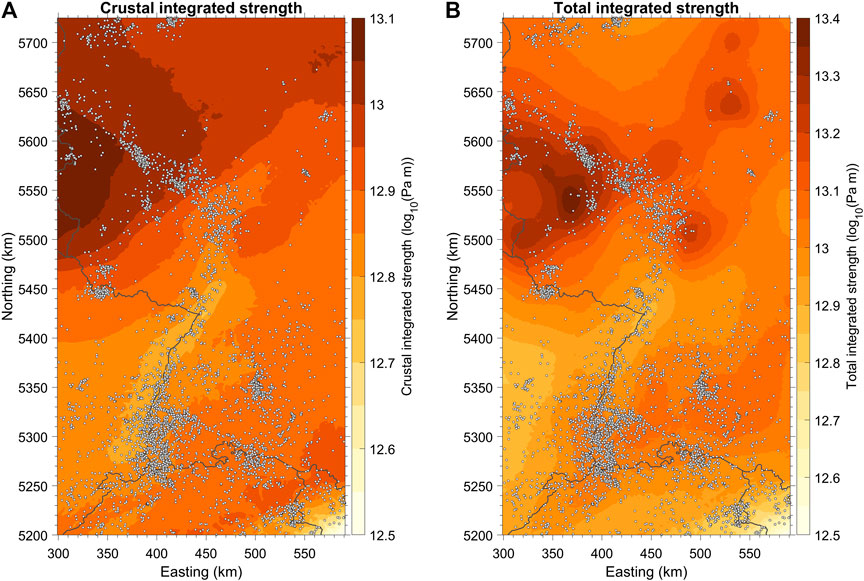
FIGURE 6. Maps of the integrated (A) crustal and (B) total strength compared with seismicity. Light-grey dots show epicenters of seismic events with reliable depths. Deep-grey lines show country boundaries.
The degree of mechanical decoupling inversely correlates with the local temperature conditions, where the presence of higher mid-crustal temperatures (shallower 450–600°C isotherms; Figure 5) leads to an internal decoupling as the hot crust is no longer able to sustain imposed stress but would rather accommodate stored deformation by ductile creep. Accordingly, higher than background temperatures in the graben proper imply a weak crust, an aspect that correlates with the clustering of, preferentially low-magnitude, earthquakes in the area (Figure 1C).
There is an overall spatial correlation between the distribution of hypocenters and lateral variations in the computed crustal strength, with the majority of events lying within the boundaries of the weakest crust (Figure 6). This clear correlation between earthquake distribution and crustal and lithosphere strength breaks down, however, when moving toward the NW domain, for example, along the Middle Rhine Zone (MRZ) which connects the URG with the LRG (compare with Figure 1B). Moving virtually from the northern parts of the URG toward the NW means entering a domain that is characterized by lower temperatures (larger depth of the 450–600°C-isotherms; Figure 5) as mostly controlled by the lower radiogenic heat production of the Rhenohercynian upper crust (Table 1) and a thicker lower crust (Figure 4B). As a consequence, our model predicts overall larger crustal and lithospheric strengths for this domain, which appears at odds with the presence of a second belt of seismicity striking NW-SE and connecting the URG with the LRG (Figure 6). Under a similar background stress field, we would expect few if not no earthquake activity to occur within a stronger and thicker crust. Comparing the crustal and lithospheric strength maps we note, however, that in this area the mantle contribution to the total strength is larger than in the other parts of the study area where the crustal and lithosphere strength maps display more consistent patterns. This configuration of a strong crust and a strong mantle indicates a mechanically coupled crustal-upper mantle lithosphere, i.e., a thicker elastic root in this part of the study area. Increasing the contribution of the lower crust and upper mantle to the total plate strength would therefore translate in an increase in the portion of the lithosphere that is able to sustain imposed stress, thus resulting in a deepening of higher in magnitudes seismic events in this area (Figures 7A, 1C—see also the discussion that follows). Such a rheologically heterogeneous lithosphere is likely to control also the horizontal distribution of hypocenters, which in the MRZ are located within a domain of finite lateral extent. This hypocenter cluster spatially correlates with transitional LAB depths (Figure 4D; deep south of the seismicity cluster and shallow north of it) and thus a gradient in the long-term strength of the plate. In addition, the localization of seismicity in the MRZ might be causally related with smaller-scale crustal features not resolved by our model. This includes, for example, 1) the NW-SE striking Lower Rhine Graben System of presently reactivated faults (Cloetingh et al., 2006) which tapers off toward the MRZ as it is increasingly outranged by NE-SW trending Variscan lineaments of the Rhenish Massif [e.g., compiled tectonic map in Grünthal et al. (2018)] or 2) the magmatic and tectonic structures related to the Eifel volcanic field (black circle in Figure 3).
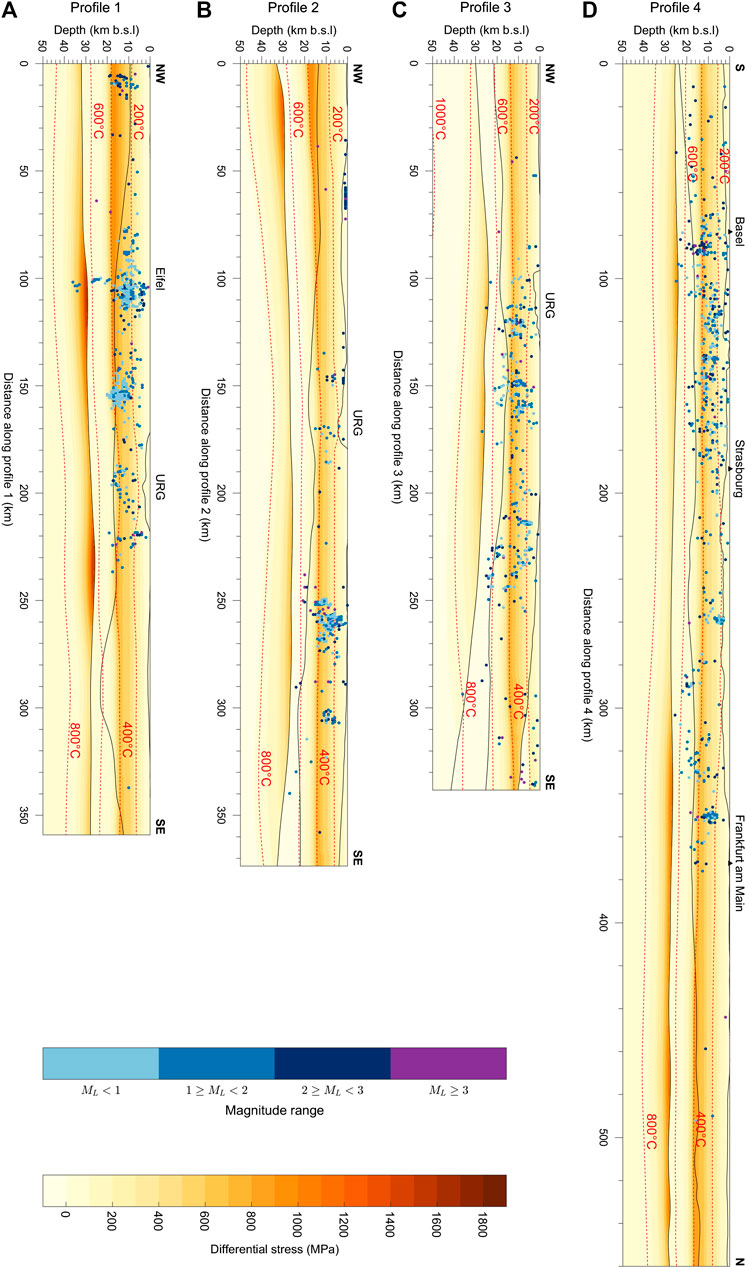
FIGURE 7. Differential stress displayed along depth cross-sections for each profile: (A) profile 1; (B) profile 2; (C) profile 3; (D) profile 4. Dots indicate hypocenters of seismic events associated with the profile (see Figure 3) and are color-coded by their local magnitude (the upper color bar). The differential stress color legend is explained by the lower color bar. Dashed red lines depict isotherms derived from the thermal model, and gray lines mark the structural model units (see Figure 4E).
So far, the discussion has mostly been limited to the regional characteristics of the modeling in terms of computed integrated strength maps (Figure 6). Despite the general agreement found between seismicity and first-order lateral rheological contrasts, no information has been derived on their depth distributions. An attempt is done in Figure 7 where we plot the computed differential stress together with the depth locations of hypocenters across the four profiles introduced in the previous chapters.
In our modeling approach, the depth at which a maximum in the differential stress occurs marks the transition between the brittle frictional deformation regime and the ductile domain, i.e., the BDT. Therefore, we could consider this depth level, to a first order, as indicative of the lower boundary for the seismogenic zone. If we compare this depth level to the depth distribution as provided by the seismic catalog, we note an overall correlation between the rheological modeling results and the depth distribution of hypocenters. The majority of the recorded events are shallower than and limited by our computed BDT, despite the steady-state assumptions of our modeling approach. We can go that far in interpreting these results as to provide a causative mechanism explaining the observed variations in the depth distribution of hypocenters, characterized by shallower seismic events in the S than in the N(W). Accordingly, the observed northward increasing depth of hypocenters can be related to a northward thickening of the brittle crustal portion of the lithosphere and to a deepening of the BDT as evident in all profiles (Figure 7). Thus, a thicker and therefore stronger brittle crust would have the potential to produce deeper and larger in magnitude events. This is again in agreement with the distribution of the seismic magnitudes (Figure 1C). Thickening of the brittle crustal layer can also explain the deepening of hypocenters along profile 3 while moving from the URG proper to the east and the associated increase in earthquake magnitudes (Figure 1C). Based on these findings, we can conclude that, on a regional scale, first-order lithology contrasts in the crust within an overly diffusive lithosphere loaded by a background stress likely control the overall mechanical behavior of the plate.
Locally, also seismic events that are deeper than the modeled 450°C isotherm are observed as shown in profile 1 at the western graben margin or in profile 3 east of the URG. Also, along the graben axis (profile 4) such deeper events are evident. Most of these deeper events are within the mafic lower crust and their depth is mostly shallower than the 600°C isotherm. Given that the BDT is occurring at higher temperatures in mafic rocks (e.g., Ranalli and Murphy, 1987), the seismicity down to the depth of 600°C is therefore not surprising in these domains. Alternatively, the presence of hypocenters deeper than the resolved BDT could be related to secondary, transient and therefore other than conductive thermal effects associated with local structural heterogeneities (i.e., faults) and variations in rock properties, which could affect the location of the BDT in the modeling. Such transient effects are important, though locally, and were already evidenced in previous works (Freymark et al., 2017; Freymark et al., 2019), where the local mismatch between computed temperature and T-logs has been explained by active fluid circulation along major fault zones. This can explain the presence of hypocenters along the western portion in profile 1 reaching down to more than 30 km (lithospheric mantle) that appear to be aligned.
An important factor controlling the depth distribution of the brittle frictional domain is viscous relaxation by crustal and mantle creep. The ability of crustal and mantle rocks to efficiently accommodate accumulated stress can be parameterized in terms of an effective viscosity (see the previous paragraph). Based on experimental evidence, in the present study we have assumed dislocation creep to be the only active relaxation mechanism. Dislocation creep is characterized by a nonlinear relationship between stress and strain rate (Eq. 2), thus by a nonlinear effective viscosity that has a power-law dependence on the assumed strain rate (or stress) and an exponential dependence on temperature (Eq. 3). The profiles in Figure 8 illustrate this non-linear behavior. Despite assuming a uniform and constant background strain rate and a constant uniform lithology for each major geological unit, the viscosity profiles are characterized by a marked viscosity gradient in each unit due to a heterogeneous thermal field. Average values of the calculated effective viscosity for the upper crust are in a range between 10e21 and 10e24 Pa*s, with a two to four orders of magnitude decrease in viscosity at lower crustal and upper mantle levels, respectively. A drastic jump in effective viscosity is indeed evident at the upper-lower crustal discontinuity, indicating that most of the relaxation takes place in the lower crust and upper mantle. Relatively low viscosity values in the lower crust and upper mantle promote stable aseismic creep, possibly enhanced by lower crustal flow, thus explaining the overall drop in seismic activity at these depths. As described above, we can correlate the depth location of recorded seismicity to the upper crustal configuration, with deeper events occurring within a thicker and stronger crust in the north and south-east of the URG, while being limited to shallower depths in the URG due to efficient lower crustal viscous relaxation in the presence of a thin brittle upper crust. Though we cannot rule out that there might be other active co-players, including transient creep processes or pore pressure mediated effects, the results of Figure 9 provide additional evidence on the role of crustal rheological contrasts in controlling the overall strength and mode of lithospheric deformation in the study area.
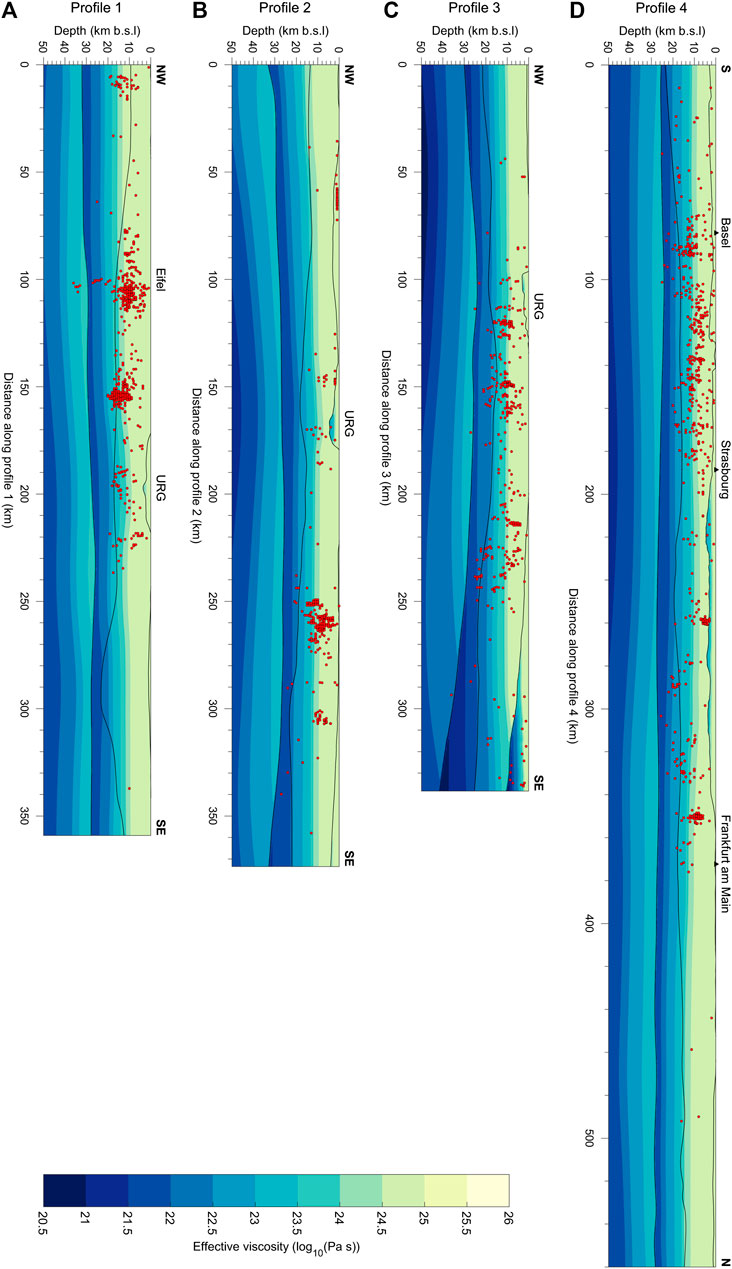
FIGURE 8. Effective viscosity cross-sections along each profile: (A) profile 1; (B) profile 2; (C) profile 3; (D) profile 4. Red dots represent hypocenters of seismic events associated with the profile (see Figure 3). The color legend of effective viscosity is explained by the color bar. Gray lines mark the boundaries of the structural model units (see Figure 4E).
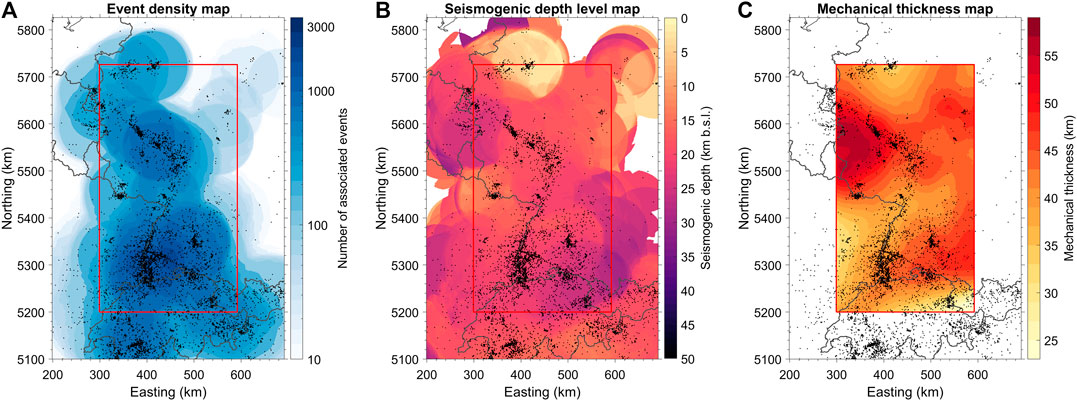
FIGURE 9. Maps of (A) event density derived by considering circular bin of 75 km radius (logarithmic scale); (B) seismogenic depth level map derived as the depth above which 95% of events occur for each circular bin; (C) mechanical thickness derived from the rheological model of the area. Black dots mark the epicenters of seismic events with reliable depths.
To discuss in a more quantitative way the implications of the modeled crustal thermo-mechanical configuration and the potential seismic hazard in the study area, we present a map of spatial variations in the base of the seismogenic crust in Figure 9B. The seismogenic depth level has been calculated from the seismic dataset as the depth above which 95% of the total seismicity occurs. To derive the map, we have first subdivided the model area into a grid of equal radius bins by using an effective searching radius of 75 km. Figure 9A shows the density of events in terms of number of events associated with each grid point of the model. To compute the base map of the seismogenic zone, we considered for any given bin that seismicity is inactive below a depth level underlying the majority of hypocenters. We disregarded distributions with less than five events that are considered as statistically meaningless. The radius has been defined in order to ensure that a statistically significant number of epicenters could be located inside each of the grid bins. For the radius of 75 km, the minimum number of associated events in each bin turned out to be eight which ensures that no gaps exist in the seismogenic depth level map in Figure 9B.
Figure 9B displays a seismogenic depth that is highly variable across the study area, covering a range of less than 5 km below sea level up to 50 km below sea level. There is a systematic deepening in the seismogenic base at the northern boundary of the URG, toward the northwest and toward the east of the graben proper, which also correlates spatially with a change in the seismic energy released as evidenced by the catalog (Figure 1C). Events of higher magnitude occur in areas where the seismogenic depth is larger. These variations positively correlate with the topography of the 450°C isotherm in Figure 5A, which we have taken as representative of the maximum dissipation potential isosurface in the crust. This correlation suggests that, on a regional scale, the brittle portion of the crust in the area is controlled by the geothermal diffusive gradient and that first-order variations in the crustal configuration and their thermal consequences exert the primary control on the spatial distribution of the seismicity.
We have based our evaluation so far by relying on the hypothesis that the recorded seismicity distribution provides a direct observation-based constraint for the lithospheric strength. The rationale behind this assumption stems from the fact that a rock must be able to retain enough strength in order to nucleate an earthquake, though a finite strength does not necessarily imply seismicity to happen. This said, we can interpret the seismogenic depth level map described above as an observation-driven estimate of the depth levels in the plate that are able to retain enough strength so to store elastic strain energy under a given in-situ stress state. Therefore, the implications of our study can be further quantitatively tested by a direct comparison of the observation summarized in Figure 9B with the map depicting lateral variations in the computed mechanical thickness as derived from our rheological study (Figure 9C). The mechanical thickness, not to be confounded with the effective elastic thickness, is defined as an integrated value corresponding to the depth at which the strength of the rocks becomes negligible, that is smaller than a finite threshold level for which usually 20 MPa is considered (Ranalli, 1995). Therefore, the computed mechanical thickness is, like the effective viscosity introduced above, an effective parameter, rather than a rock property sensu stricto and it is used to represent the thickness of the stress bearing part of the plate (seismically active) in an integral sense. In other words, it provides an estimate for the strength of the plate itself, defined by the depth levels above which dissipation of stored elastic energy is negligible, thus being directly comparable to the seismogenic base map in Figure 9B.
The map in Figure 9C displays a mechanical thickness that is highly variable over the study area in a range from 24 to 57 km. In general, the spatial distribution of minima and maxima resembles variations in the lithospheric strength (Figure 6), with lower values within the URG area, the Eifel area in the central part, at the northern model boundary and across the Alps, that are bordered by maxima in mechanical thickness to the east and to the north-west of the URG. The range of variations in modeled mechanical thickness is in the same order of magnitude like the one obtained for the seismogenic base derived from the seismicity data and the two maps also show a spatially similar pattern. The agreement between the two maps obtained with completely independent methods suggests that the bulk of the seismic activity in the study area is indeed controlled by the long-term thermo-mechanical configuration of the crust under a consistent in-situ stress field.
Discussion
A major outcome of the modeling is the correlation between the regional seismicity observed in the study area and the crustal rheological configuration, the latter being, to a first order, controlled by resolved variations in the thermal configuration within a heterogeneous crust. We, therefore, open this paragraph by deepening the discussion of these implications. The seismicity in the study area shows a bimodal distribution in its spatial trend. A first cluster of seismic events, aligned NNE-SSW is found in the southern-central part of the area, that follows the outlines of the URG. To the north, at the northern end of the URG and up to the southern boundary of the LRG, a second cluster of seismic events displays a counter-clockwise rotation and higher local magnitudes. Another cluster is located in the south, between the eastern flank of the URG and the Black Forest region, that also features increased earthquake magnitudes (Figure 1C). This systematic variation in the spatial distribution and local magnitudes in the seismic catalog raises the question on the causative mechanisms to the observed distribution.
Cloetingh et al. (2005) found that zones of concentrated seismic activity correspond to areas of crustal contrast between the Cenozoic rifts and their surrounding platform areas, which is consistent with our findings. In our study we go one step further by comparing the depth distribution of seismicity in addition to a lateral distribution. An attempt to provide an answer to the aforementioned question is provided below where we correlate these observations with the results of our rheological modeling exercise.
The URG proper is a domain of a thin and hot upper crust and therefore of reduced crustal strength (see Figures 4AFigures 5Figures 6A). To the east of the URG, the model features a gradual increase in crustal thickness superposed to a deepening of the LAB, leading to overall lower deep temperatures and to a mechanically stronger crust. The presence of a heterogeneous crustal configuration across this area is indicative of an asymmetric strength configuration, which, in turn, can explain observed variations in the seismicity. That a causative relation exists between the distribution of earthquakes and the crustal structure is also evident when looking at the depth distribution of the hypocenters (Figures 7, 8 and 9). As also reported by previous studies (e.g., Faber et al., 1994; Mayer et al., 1997), seismicity reaches its maximum down to 25 km (approximately coinciding with the Moho boundary of our model) in the easternmost domain of the URG and toward the Black Forest, and it exhibits a pronounced peak between 12 and 18 km within the graben proper. If we take the 450° isotherm as indicative of a maximum crustal dissipation potential, it is striking how the majority of recorded seismic events are delimited by the topology of this isotherm that also marks the maximum strength level in the upper crust. The observed shallow seismicity in the URG aligns with a local minimum in the depth of the same isotherm at around 13–16 km. The observation that the majority of shallow hypocenters concentrate above and/or along this rheological boundary is indicative of an internal decoupling horizon at upper crustal depths that provides an effective limit to the depth distribution of earthquakes to the shallower brittle crust. The shallower this horizon is, the lower are the magnitudes of potential earthquakes. The observed eastward deepening in hypocenter locations (with maxima toward the Black Forest area) is also consistent with the modeled increase in integrated crustal strength due to a gradual crust-mantle coupling. This in turn provides additional evidence of the correlation between seismic activity and resolved variations in the crustal rheological configuration.
Following a similar reasoning, we can also explain the NNW-SSE trend in the seismicity pattern across the northern boundary of the URG (Figure 1C). This second cluster of seismic events spatially correlates with a region of increased crustal strength (Figure 6A) associated to a thicker mafic lower crust and a deepening in the LAB (Figure 4) that spatially correlates to a seismicity trend that features deeper sources of earthquakes (Figures 7Figures 8). Also, the seismic energy release in this area is found to vary more than an order of magnitude if compared to the values within the graben domain proper (Figure 1C). We can summarize these findings by stating that: earthquakes preferentially rupture with moderate magnitudes through a weaker crust within the URG and through a stronger crust to the east and in the north, thereby being accompanied by higher energy release as evidenced by the seismic catalog. Based on all these observations, we can therefore conclude that rapid accommodation of permanent deformation by thermally activated viscous-creep efficiently limits the deepening of seismic energy release in the graben area to the shallower portion of the upper crust, the latter being mechanically decoupled from the deeper crustal domain.
To explain the presence of, relatively few in number, hypocenters deeper than the modeled BDT in the URG (Figure 7D) requires a mechanism to either locally increase the strain rate or to lower the temperature with respect to the background values. Observations within the study area are indicative of a regional stress field (Heidbach et al., 2016) that shows an overall consistent pattern across the graben. This aspect makes it difficult to envisage any mechanism that could promote a local and systematic increase in the background strain rates without disturbing the regional stress field. It is, therefore, likely that the local deepening in the hypocenters could correlate with the presence of a preferential westward dipping plane of weakness or local faults which have not been included in the current input model. Such geological discontinuities would have the potential to cause local deviations from the average stress field in the near fault area as well as in the local temperature conditions, which, if also accompanied by fluid induced metamorphism, could be considered as a viable mechanism to explain the observed deepening in the seismicity. Though at a speculative level, we can conclude that the presence of major rupture planes might be effective in promoting local changes in the rheological crustal configuration (frictional weakening) resulting in a locally mechanically coupled reflective crust, which would explain the deepening in the hypocenter locations with respect to an overall shallow crustal seismicity in the graben area.
Seismicity is a slip-pulse mechanism “sensu” (Scholz, 1998) and it therefore reflects a frictional coseismic instability along a certain fault patch in response of dynamic weakening, thereby leading to an overall reduction in the dynamic stress that could or could not affect the long-term stress state (Ohnaka, 2013). We have already pointed out current limitations of the study being confined to capture first-order indicators that could be useful to link seismicity to the lithospheric strength in the area. In doing so, we have been inspired by an increasing amount of experimental evidence demonstrating how coseismic dynamic weakening is limited by depth and temperature (Maggi et al., 2000; Ohnaka, 2013). This is mainly the result of ongoing (mostly off-fault) viscoplastic deformation leading to an overall increase in the fault frictional resistance. At upper crustal conditions, rocks might undergo time- and displacement-dependent changes in their frictional coefficient which could potentially lead to slip instabilities along fault surfaces (Marone and Scholz, 1988; Rice, 1993; Cowan, 1999). However, and most important to our study, independent to the local mechanism at play within the fault, for a slip instability to occur it requires a gradient in the mechanical strength among the fault-host rock system even at upper crustal pressure (equal to mean stress)-temperature conditions. In contrast, deeper in the crust and upper mantle, thermally activated viscous creep is velocity strengthening, preventing deformation from attaining seismic rates even upon localization (Scholz, 1989). This provides a direct link between the degree of velocity weakening on a seismogenic fault and the background shear stress required to trigger the seismic pulse. If based on studies of fault rocks in exhumed continental crust (Handy and Brun, 2004; Niemeijer and Spiers, 2007), it also becomes clear that faults in the upper crust are dominated by a low effective coefficient of friction due to the presence of a clay-rich fault gouge, and that they rapidly transition to higher effective coefficient of frictions at deeper depth levels (approximately at the BDT). The most important implication of these observations is that this change from brittle cataclastic deformation to a more ductile flow mode of deformation can still be captured and approximated to a first degree by the intercept point between Byerlee’s law and ductile creep in a static long-term rheological profile.
A second point worth discussing is how to best reconcile observed earthquake magnitudes to the long-term strength of a plate. During an earthquake cycle the fault-host rock system will undergo an overall increase in its strength as a non-linear function of progressive deformation and temperature conditions (strain rates and temperature dependency of viscous creep). Upon reaching (or approaching) the system static strength, the stored internal energy would be released coseismically only within mechanically compliant domains. Following an earthquake, the system will be then reloaded interseismically and the lithosphere strength will gradually recover to its long-term profile. If we follow the established concept of an earthquake as a frictional dynamic instability (Ruina, 1983; Dieterich, 1994), we should also conclude that its magnitude does not only correlate to the peak strength of a specific rock, but must also scale with the gradient in stress drop resolved between the fault and host rock. This picture does entail a subtle, though important causal correlation between the static strength of the host crustal rock domain and the transient co-seismic strength. On the one hand, it suggests that earthquakes are likely to nucleate within strong and stress bearing layers of the lithosphere upon reaching their peak strength. The fact that the latter increases with depth thereby results in higher magnitudes events nucleating at larger depths. In contrast, weak areas would rather yield in an aseismic manner. Indeed, if the seismogenic portion of the plate would be completely dissected by weak faults, it will be unlikely to transmit any stress. This situation might change depending on local conditions where dynamic weakening processes like frictional melting, flash heating, thermal pressurization and endothermic fluid mediated reactions (Di Toro et al., 2011; Rice, 2017) might result in runaway instabilities even under near-adiabatic and lower than critical temperature conditions (though grain growth could lead to a (re)-stabilization of the system). On the other hand, the generally observed cut-off depth for coseismic slip (i.e., the thickness of the seismogenic zone defined as the depth below which earthquake frequencies and magnitudes rapidly decrease) can be taken as a quantitative indication of how the downward propagation of the velocity weakening domain is a function of the actual deformation and thereof of the geothermal gradient and overall strain rate. Viscous creep is, therefore, the process limiting the extent of downward coseismic rupture by preventing, via energy dissipation, stresses from attaining the fracture strength of the surrounding rock. This observation once again implies a causal correlation between the long-term lithosphere strength and frictional seismic instabilities and the usefulness of quantitative studies on the long-term rheological behavior of the plate.
Conclusion
Calculated 3D rheological characteristics, using a data-based lithosphere-scale 3D thermal model of the URG and adjacent areas, show remarkable consistency with independent data on seismicity distribution. Resolving the first-order lithological variations in the plate, consisting of a sedimentary cover, the upper and lower crystalline crust as well as the lithospheric mantle, we found that the computed 3D strength configuration and its major gradients correspond to the main characteristics of observed seismicity with respect to both seismogenic depth and magnitudes.
We find that, on a regional scale, the brittle portion of the crust is controlled by the geothermal diffusive gradient. As the latter is determined by the structural configuration of the crust and lithosphere, the depth level to which seismic activity may occur, varies significantly. For the URG area, first-order variations in the crustal configuration and in lithosphere thickness exert the primary control on the spatial distribution of the seismicity. The calculated variations in strength, differential stress and effective viscosity show clear spatial correlations with observed seismicity in that:
• The URG is mainly characterized by a hotter and weaker crust than its surroundings with seismic events of moderate magnitude largely shallower than the depth to the 450°C isotherm. The brittle part of the crust is thinner in the URG compared to the surroundings and mechanically decoupled from the mantle, which leads to shallow and moderate in magnitudes seismic events. Deeper events are local and probably related to deep reaching faults. A similar rheological configuration is found for the Alps and the Eifel area.
• The areas north-west and east of the URG are characterized by a thicker, colder and stronger crust and are characterized by deeper seismic events of higher magnitudes.
In general, we find a correlation between the computed mechanical thickness and the data derived seismogenic base. The study demonstrates how the assessment of potential seismic hazards can profit if observation-based knowledge of the 3D thermal field is integrated with seismic catalogs.
Data Availability Statement
All datasets presented in this study are included in the article/Supplementary Material.
Author Contributions
DA performed the seismic catalog processing and analysis, wrote the relevant parts in the manuscript and prepared all figures and the final manuscript for submission. MC performed the rheological modeling, investigated the results from the model and their comparison to the seismic catalogs and wrote the relevant parts in the manuscript. JB has been strongly involved in the development of the basic 3D structural and thermal model of the URG and thus contributed to the parameter selection for the rheological modeling and to the writing of the manuscript (in particular to chapters 2.2 and 2.3). MG contributed to preparation of the seismic catalog and rheological modeling setup, and helped with writing of the relevant chapters. MS leaded the research group and contributed to the structuring and writing of the manuscript, especially of discussion and conclusions parts.
Funding
The research is funded by the Helmholtz Centre Potsdam—GFZ German Research Centre for Geosciences.
Conflict of Interest
The authors declare that the research was conducted in the absence of any commercial or financial relationships that could be construed as a potential conflict of interest.
Acknowledgments
We would like to thank the Hessian Agency for Nature Conservation, Environment and Geology (HLNUG) who kindly provided us with data of the seismic catalog of Hessen.
Supplementary Material
The Supplementary Material for this article can be found online at: https://www.frontiersin.org/articles/10.3389/feart.2020.592561/full#supplementary-material
References
Amante, C., and Eakins, B. W. (2009). “ETOPO1 arc-minute global relief model: procedures, data sources and analysis,” in NOAA Technical Memorandum NESDIS NGDC-24. Boulder, CO: National Geophysical Data Center, NOAA).
Arndt, D., Bär, K., Fritsche, J.-G., Kracht, M., Sass, I., and Hoppe, A. (2011). 3D structural model of the federal state of Hesse (Germany) for geopotential evaluation [Geologisches 3D-Modell von Hessen zur Bestimmung von Geo-Potenzialen]. Zeitschrift der Deutschen Gesellschaft für Geowissenschaften. 162 (4), 353–369. doi:10.1127/1860-1804/2011/0162-0353
Barth, A., Ritter, J. R. R., and Wenzel, F. (2015). Spatial variations of earthquake occurrence and coseismic deformation in the upper rhine graben, central Europe. Tectonophysics 651-652, 172–185. doi:10.1016/j.tecto.2015.04.004
Baujard, C., Genter, A., Dalmais, E., Maurer, V., Hehn, R., Rosillette, R., et al. (2017). Hydrothermal characterization of wells GRT-1 and GRT-2 in Rittershoffen, France: implications on the understanding of natural flow systems in the rhine graben. Geothermics 65, 255–268. doi:10.1016/j.geothermics.2016.11.001
Behrmann, J. H., Ziegler, P. A., Schmid, S. M., Heck, B., and Granet, M. (2005). The eucor-urgent project. Int. J. Earth Sci. 94 (4), 505–506. doi:10.1007/s00531-005-0513-0
Bertrand, L., Jusseaume, J., Géraud, Y., Diraison, M., Damy, P.-C., Navelot, V., et al. (2018). Structural heritage, reactivation and distribution of fault and fracture network in a rifting context: case study of the western shoulder of the upper rhine graben. J. Struct. Geol. 108, 243–255. doi:10.1016/j.jsg.2017.09.006
Blundell, D. J., Freeman, R., and Mueller, S. (1992). A continent revealed: the European geotraverse, structure and dynamic evolution. Cambridge, United Kingdom: Cambridge University Press.
Brace, W. F., and Kohlstedt, D. L. (1980). Limits on lithospheric stress imposed by laboratory experiments. J. Geophys. Res. Solid Earth. 85 (B11), 6248–6252. doi:10.1029/JB085iB11p06248
Burov, E. B. (2011). Rheology and strength of the lithosphere. Mar. Petrol. Geol. 28 (8), 1402–1443. doi:10.1016/j.marpetgeo.2011.05.008
Cacace, M., and Scheck-Wenderoth, M. (2016). Why intracontinental basins subside longer: 3-D feedback effects of lithospheric cooling and sedimentation on the flexural strength of the lithosphere. J. Geophys. Res. Solid Earth. 121 (5), 3742–3761. doi:10.1002/2015jb012682
Calò, M., Dorbath, C., and Frogneux, M. (2014). Injection tests at the EGS reservoir of Soultz-sous-Forêts. Seismic response of the GPK4 stimulations. Geothermics 52, 50–58. doi:10.1016/j.geothermics.2013.10.007
Charléty, J., Cuenot, N., Dorbath, L., Dorbath, C., Haessler, H., and Frogneux, M. (2007). Large earthquakes during hydraulic stimulations at the geothermal site of Soultz-sous-Forêts. Int. J. Rock Mech. Min. Sci. 44 (8), 1091–1105. doi:10.1016/j.ijrmms.2007.06.003
Cloetingh, S., Ziegler, P. A., Beekman, F., Andriessen, P., Hardebol, N., and Dezes, P. (2005). Intraplate deformation and 3D rheological structure of the rhine rift system and adjacent areas of the northern Alpine foreland. Int. J. Earth Sci. 94 (4), 758–778. doi:10.1007/s00531-005-0502-3
Cloetingh, S., Cornu, T., Ziegler, P., and Beekman, F. (2006). Neotectonics and intraplate continental topography of the northern Alpine foreland. Earth Sci. Rev. 74 (3-4), 127–196. doi:10.1016/j.earscirev.2005.06.001
Cowan, D. S. (1999). Do faults preserve a record of seismic slip? A field geologist’s opinion. J. Struct. Geol. 8 (21), 995–1001. doi:10.1016/S0191-8141(99)00046-2
Cuenot, N., Charléty, J., Dorbath, L., and Haessler, H. (2006). Faulting mechanisms and stress regime at the European HDR site of Soultz-sous-Forêts, France. Geothermics 35 (5), 561–575. doi:10.1016/j.geothermics.2006.11.007
Dèzes, P., Schmid, S. M., and Ziegler, P. A. (2004). Evolution of the European cenozoic rift system: interaction of the alpine and pyrenean orogens with their foreland lithosphere. Tectonophysics 389 (1), 1–33. doi:10.1016/j.tecto.2004.06.011
Di Toro, G., Han, R., Hirose, T., De Paola, N., Nielsen, S., Mizoguchi, K., et al. (2011). Fault lubrication during earthquakes. Nature 471 (7339), 494–498. doi:10.1038/nature09838
Dieterich, J. (1994). A constitutive law for rate of earthquake production and its application to earthquake clustering. J. Geophys. Res.: Solid Earth. 99 (B2), 2601–2618. doi:10.1029/93JB02581
Egert, R., Korzani, M. G., Held, S., and Kohl, T. (2020). Implications on large-scale flow of the fractured EGS reservoir Soultz inferred from hydraulic data and tracer experiments. Geothermics 84, 101749. doi:10.1016/j.geothermics.2019.101749
Faber, S., Bonjer, K.-P., Brüstle, W., and Deichmann, N. (1994). Seismicity and structural complexity of the Dinkelberg block, southern rhine graben. Geophys. J. Int. 116 (2), 393–408. doi:10.1111/j.1365-246X.1994.tb01805.x
Fäh, D., Gisler, M., Jaggi, B., Kästli, P., Lutz, T., Masciadri, V., et al. (2009). The 1356 basel earthquake: an interdisciplinary revision. Geophys. J. Int. 178 (1), 351–374. doi:10.1111/j.1365-246X.2009.04130.x
Franke, W. (2000). The mid-European segment of the variscides: tectonostratigraphic units, terrane boundaries and plate tectonic evolution. Geol. Soc. Spec. Publ. 179 (1), 35–61. doi:10.1144/gsl.sp.2000.179.01.05
Freymark, J., Sippel, J., Scheck-Wenderoth, M., Bär, K., Stiller, M., Fritsche, J.-G., et al. (2017). The deep thermal field of the upper rhine graben. Tectonophysics 694, 114–129.
10.1016/j.tecto.2016.11.013CrossRef Full Text | Google Scholar
Freymark, J., Bott, J., Cacace, M., Ziegler, M., and Scheck-Wenderoth, M. (2019). Influence of the main border faults on the 3D hydraulic field of the central upper rhine graben. Geofluids 2019, 1–21. doi:10.1155/2019/7520714
Freymark, J., Bott, J., Scheck-Wenderoth, M., Bär, K., Stiller, M., Fritsche, J.-G., et al. (2020). [Dataset] 3D-URG: 3D gravity constrained structural model of the upper rhine graben. GFZ Data Services.
Fuhrmann, T., Heck, B., Knöpfler, A., Masson, F., Mayer, M., Ulrich, P., et al. (2013). Recent surface displacements in the upper rhine graben—preliminary results from geodetic networks. Tectonophysics 602, 300–315.
10.1016/j.tecto.2012.10.012CrossRef Full Text | Google Scholar
Geissler, W. H., Sodoudi, F., and Kind, R. (2010). Thickness of the central and eastern European lithosphere as seen by S receiver functions. Geophys. J. Int. 181 (2), 604–634. doi:10.1111/j.1365-246X.2010.04548.x
GEOFON Data Centre (2020). [Online] GEOFON seismic network Deutsches GeoForschungsZentrum GFZ. Available at: https://geofon.gfz-potsdam.de/eqinfo/list.php (Accessed Jun 11, 2020).
GeORG-Projektteam (2013). GeORG FTA-2. Geopotenziale des tieferen Untergrundes im Oberrheingraben, Fachlich-Technischer Abschlussbericht des INTERREG-Projekts GeORG LGRB-Informationen. Available at: http://www.geopotenziale.eu (Accessed January, 2013).
Grünthal, G., and Wahlström, R. (2003). An Mw based earthquake catalogue for central, northern and northwestern Europe using a hierarchy of magnitude conversions. J. Seismol. 7 (4), 507–531. doi:10.1023/b:Jose.0000005715.87363.13
Grünthal, G., Stromeyer, D., and Wahlström, R. (2009). Harmonization check of M w within the central, northern, and northwestern European earthquake catalogue (CENEC). J. Seismol. 13 (4), 613–632. doi:10.1007/s10950-009-9154-2
Grünthal, G., Stromeyer, D., Bosse, C., Cotton, F., and Bindi, D. (2018). The probabilistic seismic hazard assessment of Germany—version 2016, considering the range of epistemic uncertainties and aleatory variability. Bull. Earthq. Eng. 16 (10), 4339–4395. doi:10.1007/s10518-018-0315-y
Handy, M. R., and Brun, J.-P. (2004). Seismicity, structure and strength of the continental lithosphere. Earth Planet Sci. Lett. 223 (3-4), 427–441. doi:10.1016/j.epsl.2004.04.021
Heidbach, O., and Hergert, T. (2012). NAGRA interner bericht NIB 12-007. Geomechanisch-numerische Modellierung des rezenten Spannungsfeldes der Nordschweiz. Available at: https://gfzpublic.gfz-potsdam.de/pubman/item/item_1529126 (Accessed 2012).
Heidbach, O., Rajabi, M., Reiter, K., Ziegler, M. O., and Team, W. (2016). [Dataset] Version 1.1. World stress map database release 2016. GFZ Data Services. doi:10.5880/WSM.2016.001 (Accessed May 25, 2020)
Henrion, E., Masson, F., Doubre, C., Ulrich, P., and Meghraoui, M. (2020). Present-day deformation in the upper rhine graben from GNSS data. Geophys. J. Int. 223, 599–611. doi:10.1093/gji/ggaa320
HLNUG (2020). [Online]. Version 2019 (SKHe2019). Seismischer Katalog des Landes Hessen, Hessisches Landesamt für Naturschutz, Umwelt und Geologie. Available at: https://www.hlnug.de/themen/geologie/erdbeben (Accessed Jun 11, 2020).
Homuth, B., Rümpker, G., Deckert, H., and Kracht, M. (2014). Seismicity of the northern upper rhine graben—constraints on the present-day stress field from focal mechanisms. Tectonophysics 632, 8–20. doi:10.1016/j.tecto.2014.05.037
International Seismological Centre (2020a). Dataset [Online]. ISC-EHB. Available at: (Accessed Jun 12, 2020).
International Seismological Centre (2020b). [Online]. On-line Bulletin. Available at: (Accessed Jun 11, 2020).
Katayama, I., and Karato, S.-i. (2008). Low-temperature, high-stress deformation of olivine under water-saturated conditions. Phys. Earth Planet. Inter. 168 (3), 125–133. doi:10.1016/j.pepi.2008.05.019
Kushnir, A. R. L., Heap, M. J., and Baud, P. (2018). Assessing the role of fractures on the permeability of the Permo-Triassic sandstones at the Soultz-sous-Forêts (France) geothermal site. Geothermics 74, 181–189. doi:10.1016/j.geothermics.2018.03.009
LGRB (2020). [Online]. Seismisches Bulletins baden-württemberg 1996–2019 Landesamt für Geologie, Rohstoffe und Bergbau, Regierungspräsidium Freiburg, Baden-Württemberg. Available at: https://lgrb-bw.de/erdbeben/jahresbulletins (Accessed Jun 11, 2020).
Lopes Cardozo, G. G. O., and Granet, M. (2005). A multi-scale approach to study the lithospheric structure of the southern upper rhine graben: from seismic tomography through reflection seismics to surface geology. Int. J. Earth Sci. 94 (4), 615–620. doi:10.1007/s00531-005-0476-1
Lüschen, E., Wenzel, F., Sandmeier, K. J., Menges, D., Rühl, T., Stiller, M., et al. (1989). “Near-vertical and wide-angle seismic surveys in the schwarzwald,” in The German continental deep drilling program (KTB). Editors R. Emmermann, and J. Wohlenberg (Berlin, Germany: Springer), 297–362.
Maggi, A., Jackson, J., McKenzie, D., and Priestley, K. (2000). Earthquake focal depths, effective elastic thickness, and the strength of the continental lithosphere. Geology 28 (6), 495–498. doi:10.1130/0091-7613(2000)28<495:EFDEET>2.0.CO;2
Marone, C., and Scholz, C. (1988). The depth of seismic faulting and the upper transition from stable to unstable slip regimes. Geophys. Res. Lett. 15 (6), 621–624. doi:10.1029/GL015i006p00621
Maurer, V., Gaucher, E., Grunberg, M., Koepke, R., Pestourie, R., and Cuenot, N. (2020). Seismicity induced during the development of the Rittershoffen geothermal field, France. Geotherm. Energy. 8 (1), 5. doi:10.1186/s40517-020-0155-2
Mayer, G., Mai, P. M., Plenefisch, T., Echtler, H., Lüschen, E., Wehrle, V., et al. (1997). The deep crust of the Southern rhine graben: reflectivity and seismicity as images of dynamic processes. Tectonophysics 275 (1), 15–40. doi:10.1016/S0040-1951(97)00014-0
Mechie, J. (2007). “A 3-D P-wave velocity crustal structure model for Germany derived from seismic refraction/wide-angle reflection data,” in Proceedings of the 67th annual meeting of the German geophysical society (DGG). Aachen, Germany. March 26–29, 2007.
Meissner, R., and Bortfeld, R. K. (2014). DEKORP-atlas, results of deutsches kontinentales reflexionsseismisches programm. Berlin, Germany: Springer-Verlag.
Meixner, J., Schill, E., Grimmer, J. C., Gaucher, E., Kohl, T., and Klingler, P. (2016). Structural control of geothermal reservoirs in extensional tectonic settings: an example from the upper rhine graben. J. Struct. Geol. 82, 1–15. doi:10.1016/j.jsg.2015.11.003
Niemeijer, A. R., and Spiers, C. J. (2007). A microphysical model for strong velocity weakening in phyllosilicate‐bearing fault gouges. J. Geophys. Res. Solid Earth. 112 (B10). doi:10.1029/2007JB005008
Ohnaka, M. (2013). The physics of rock failure and earthquakes. Cambridge,UnitedKingdom: Cambridge University Press.
Ranalli, G., and Murphy, D. C. (1987). Rheological stratification of the lithosphere. Tectonophysics 132 (4), 281–295. doi:10.1016/0040-1951(87)90348-9
Regenauer-Lieb, K., and Yuen, D. A. (2008). Multiscale brittle-ductile coupling and genesis of slow earthquakes. Pure Appl. Geophys. 165 (3), 523–543. doi:10.1007/s00024-008-0326-8
Rice, J. R. (1993). Spatio‐temporal complexity of slip on a fault. J. Geophys. Res. Solid Earth. 98 (B6), 9885–9907. doi:10.1029/93JB00191
Rice, J. R. (2017). Heating, weakening and shear localization in earthquake rupture. Philos. Trans. A Math. Phys. Eng. Sci. 375 (2103), 20160015. doi:10.1098/rsta.2016.0015
Rózsa, S., Mayer, M., Westerhaus, M., Seitz, K., and Heck, B. (2005). Towards the determination of displacements in the upper rhine graben area using GPS measurements and precise antenna modelling. Quat. Sci. Rev. 24 (3), 425–438. doi:10.1016/j.quascirev.2004.07.007
Ruina, A. (1983). Slip instability and state variable friction laws. J. Geophys. Res. Solid Earth. 88 (B12), 10359–10370. doi:10.1029/JB088iB12p10359
Scholz, C. H. (1989). Mechanics of faulting. Annu. Rev. Earth Planet Sci. 17(1), 309–334. doi:10.1146/annurev.ea.17.050189.001521
Schumacher, M. E. (2002). Upper rhine graben: role of preexisting structures during rift evolution. Tectonics 21 (1), 1–17. doi:10.1029/2001tc900022
Storchak, D. A., Harris, J., Brown, L., Lieser, K., Shumba, B., Verney, R., et al. (2017). Rebuild of the bulletin of the international seismological centre (ISC), part 1: 1964–1979. Geosci. Lett. 4 (1), 32. doi:10.1186/s40562-017-0098-z
Tesauro, M., Hollenstein, C., Egli, R., Geiger, A., and Kahle, H.-G. (2006). Analysis of central western Europe deformation using GPS and seismic data. J. Geodyn. 42 (4), 194–209. doi:10.1016/j.jog.2006.08.001
U.S. Geological Survey (2020). [Online]. USGS earthquake catalog. Available at: https://earthquake.usgs.gov/earthquakes/search/ (Accessed Jun 11, 2020).
Vallier, B., Magnenet, V., Schmittbuhl, J., and Fond, C. (2019). Large scale hydro-thermal circulation in the deep geothermal reservoir of Soultz-sous-Forêts (France). Geothermics 78, 154–169. doi:10.1016/j.geothermics.2018.12.002
Vidal, J., and Genter, A. (2018). Overview of naturally permeable fractured reservoirs in the central and southern upper rhine graben: insights from geothermal wells. Geothermics 74, 57–73.
https://doi.org/10.1016/j.geothermics.2018.02.003 | Google Scholar
Weston, J., Engdahl, E. R., Harris, J., Di Giacomo, D., and Storchak, D. A. (2018). ISC-EHB: reconstruction of a robust earthquake data set. Geophys. J. Int. 214 (1), 474–484. doi:10.1093/gji/ggy155
Ziegler, P. A. (1990). Geological atlas of western and central Europe. Bath, England: Geological Society Publishing House.
Keywords: lithosphere rheology, seismicity, 3D thermal model, effective viscosity, integrated strength, intracontinental rift, upper rhine graben, lower rhine graben
Citation: Anikiev D, Cacace M, Bott J, Gomez Dacal ML and Scheck-Wenderoth M (2020) Influence of Lithosphere Rheology on Seismicity in an Intracontinental Rift: The Case of the Rhine Graben. Front. Earth Sci. 8:592561. doi: 10.3389/feart.2020.592561
Received: 07 August 2020; Accepted: 30 September 2020;
Published: 10 November 2020.
Edited by:
Antonella Peresan, Istituto Nazionale di Oceanografia e di Geofisica Sperimentale (OGS), ItalyReviewed by:
Piotr Åšroda, Institute of Geophysics (PAN), PolandEnzo Mantovani, University of Siena, Italy
Copyright © 2020 Anikiev, Cacace, Bott, Gomez Dacal and Scheck-Wenderoth. This is an open-access article distributed under the terms of the Creative Commons Attribution License (CC BY). The use, distribution or reproduction in other forums is permitted, provided the original author(s) and the copyright owner(s) are credited and that the original publication in this journal is cited, in accordance with accepted academic practice. No use, distribution or reproduction is permitted which does not comply with these terms.
*Correspondence: Denis Anikiev, denis.anikiev@gfz-potsdam.de