

Abstract
The Ba5Ta4O15-Ba3Ta5O15-BaTa2O6 heterojunction was synthesized for the first time at ambient pressure and mild temperatures without further need of calcination. By systematically adjusting the synthesis parameters, the composition of the composite could be tailored. Detailed Rietveld refinement revealed the highest amount of by-phases for the non-calcined sample with around 12% of Ba3Ta5O15 and 12% of BaTa2O6, respectively. Ba5Ta4O15 represented the main phase for all samples. The non-calcined heterojunction showed the highest activity in photocatalytic hydrogen production with 2360 µmol h−1m−2 corresponding to 1180 µmol h−1 without any co-catalyst. A Rh-Cr2O3 co-catalyst was photodeposited on all samples depending on the surface area for overall water splitting. All samples were active in overall water splitting. This novel synthesis strategy paves the way towards a general low-cost and energy-saving synthesis route to achieve highly crystalline and highly active metal oxide semiconductor photocatalysts.
Export citation and abstract BibTeX RIS

Original content from this work may be used under the terms of the Creative Commons Attribution 4.0 license. Any further distribution of this work must maintain attribution to the author(s) and the title of the work, journal citation and DOI.
1. Introduction
Since the beginning of research in photocatalytic hydrogen production and overall water splitting, many semiconductor materials have been investigated as possible photocatalyts [1–5]. One group of materials are (111) layered perovskites A5B4O15( A = Ba, Sr; M = Nb, Ta) [6–10]. They are highly active in photocatalytic water splitting under UV light due to their layered crystal structure, which offers additional reaction sites in the interlayers [6, 11].
The photocatalytic activity of the wide-band gap material Ba5Ta4O15 can be improved for example via ammonolysis [12, 13], or by formation of heterojunctions such as Ba5Ta4O15-AgVO3[ 14], and Ba5Ta4O15-g-C3N4[ 15], thereby gaining visible-light absorption properties.
Different synthesis strategies for semiconductor materials such as Ba5Ta4O15 are known, the most used is the solid state reaction due to its simplicity [3, 16, 17]. However, the necessary high reaction temperatures and times result in the formation of large particle sizes in the range of several micrometres, and therefore very low surface areas. For example, Ba5Ta4O15 requires 24 h at 1150 °C synthesis time and temperature, which is highly energy-consuming [17].
Alternative synthesis methods for layered perovskites A5M4O15 are the flux-assisted method [13, 18], hydrothermal synthesis [14, 15, 19, 20], the polymerisable complex method [7–9], electrospinning [21–23], sol-gel synthesis [24, 25], as well as a citrate synthesis route [26, 27]. Such synthesis methods need either high temperatures, high pressures, long reaction times or additional calcination steps.
For example, Ba5Ta4O15[ 26] and the multicomponent heterojunctions Ba5Ta4O15-Ba3Ta5O15 and Ba5Ta4O15-Ba3Ta5O15-BaTa2O6[ 27] were prepared by adjustment of the precursor ratios in a citrate synthesis route. Powder precursors obtained in this syntheses need to be calcined to obtain the final crystalline products. The heterojunctions showed an improved photocatalytic activity compared to phase-pure Ba5Ta4O15[ 27]. The formation of the three-component heterojunction Ba5Ta4O15-Ba3Ta5O15-BaTa2O6 resulted in a 70% higher gas evolution rate in overall water splitting measurements with Rh-Cr2O3 as co-catalyst as compared to pure Ba5Ta4O15. An improved charge separation and extended lifetime of electrons due to the electron injection from the ·CH2OH radical into the conduction band of Ba3Ta5O15( photocurrent doubling), revealed by laser flash photolysis experiments on Ba5Ta4O15-Ba3Ta5O15 and Ba5Ta4O15 in N2-methanol atmosphere, was shown to be the reason for the enhanced photocatalytic activity. Trapped electrons accumulate in the system. In case of the phase-pure Ba5Ta4O15, the ·CH2OH radical acts as recombination centre. Without methanol, no difference in the decay behaviour could be found [28]. A comparison of the photocatalytic activity to phase-pure Ba3Ta5O15 via citrate synthesis route is hitherto not reported, which can be explained with the complex synthesis of Ba3Ta5O15 reported by Feger et al. This synthesis is highly energy-consuming as a pressed pellet of Ba5Ta4O15, Ta2O5, and Ta needs to be sealed with BaCl2 in a tantalum ampule and heat treated at 1640 °C for 12 h [29].
The group of Marschall synthesized Ba5Ta4O15, Ba5Nb4O15, and Ba5Nb2Ta2O15 nanofibers by electrospinning [21]. Later they were able to adjust the diameter of Ba5Ta4O15 nanofibers and Ba5Ta4O15-Ba3Ta5O15 heterojunction nanofibers and showed also an improved activity for the Ba5Ta4O15-Ba3Ta5O15 heterojunction compared to phase-pure Ba5Ta4O15 nanofibers. An intense interfacial contact and improved charge carrier separation together with the photocurrent doubling effect were shown to be the reason for the improved photocatalytic activity in the composite nanofibers, which was demonstrated by variation of sacrificial hole scavengers [22, 23].
Even in electrospinning a calcination step is needed to decompose the used spinning polymer and to crystallize the layered perovskite nanofiber materials. In the citrate synthesis route as well as in the electrospinning, the calcination temperatures are comparably low and reaction times are shorter—compared to solid state reaction—resulting in reduced particle sizes and a better energy efficiency of these two synthesis methods. Energy efficiency is one of the 12 principles of green chemistry in designing new reaction processes [30]. Synthesis at ambient conditions is one possible way to reduce the energy consumption of chemical syntheses.
Since the composite materials Ba5Ta4O15-Ba3Ta5O15 and Ba5Ta4O15-Ba3Ta5O15-BaTa2O6 have been shown to be much more active in photocatalysis than phase-pure Ba5Ta4O15, we have developed a faster and more facile synthesis route for such composites. We present an optimized citrate synthesis route followed by combustion, which allows the synthesis of Ba5Ta4O15-Ba3Ta5O15-BaTa2O6 heterojunctions at ambient pressure and at comparatively low temperatures without further need of calcination. This was achieved by systematically adjusting the intensity of the combustion reaction. The photocatalytic activity of the synthesized powders in hydrogen evolution and overall water splitting experiments were investigated. A non-calcined sample showed a higher photocatalytic activity compared to the powders synthesized with an additional calcination step, despite having the smallest surface area. The reason for this is the optimized composition of the heterojunction, resulting in improved charge carrier separation.
We think that this synthesis route could be an energy efficient way to synthesize many other semiconductor materials without diminishing the photocatalytic activity.
2. Experimental section
2.1. Materials preparation
The heterojunctions were prepared via a citrate synthesis route, using an adapted synthesis of Marschall et al[ 26]. 0.7058 g EDTA (99.4%, Alfa Aesar) and 0.6283 g citric acid monohydrate (Bernd Kraft) were dissolved in 60 ml water by adding different amounts of ammonia solution (25%,VWR) (either 3.5 ml, 4.2 ml, 4.5 ml or 6 ml). Afterwards different amounts (2 ml, 3 ml, or 4 ml) of conc. nitric acid (65%, Bernd Kraft) were added. The synthesis with 4.5 ml ammonia solution was done without addition of nitric acid. To stabilize the highest oxidation state of Ta, 5 ml hydrogen peroxide (30%, Fisher Scientific) were added. 0.9344 g Ta(OEt)5( 99.99%, abcr) were dissolved in 6 ml abs. ethanol (99.5%, Acros Organics) and were added in portions while heating the solution to 90 °C. 0.7514 g Ba(NO3)2( 99.95%, Alfa Aesar) dissolved in 10 ml water, were added in small portions. In all cases, except the synthesis without addition of nitric acid, a clear solution was obtained. The volume of the solution was reduced to approx. 10 ml and then transferred in a heating mantel, where the entire solvent was evaporated. The obtained powders were completely black if no nitric acid was added with an increasing amount of white powder with increasing amounts of used ammonia solution and nitric acid. The powder precursors with dark components were grinded completely and were calcined at 1000 °C for 10 h (5 °C min−1) in air. In the case of the sample, prepared with 6 ml ammonia solution and 4.5 ml nitric acid, the obtained white powder was used without further calcination.
2.2. Methods of characterization
Powder x-ray diffraction (XRD) patterns were recorded on a PANalytical Empyrean with a Pixcel 1D detector using Cu Kα in a 2θ range of 10–80°. The divergence slit was fixed to 0.5° and an anti-scatter slit of 1° was used. Rietveld refinements were performed with the program Fullprof [31]. Instrumental broadening was determined with a LaB6 standard (NIST SRM 660 c). Reflections were modelled with an Thompson-Cox-Hastings pseudo-Voigt function [32] and the background was approximated with a Chebychev polynomial. Rietveld refinements were based on the crystal structure information published by Hojamberdiev et al for Ba5Ta4O15[ 13], Feger et al for Ba3Ta5O15[ 29], Ling et al for hexagonal (h) Ba4Ta2O9[ 33], and Galasso et al for orthorhombic (o) BaNb2O6, which is isostructural to BaTa2O6[ 34]. Simulated diffraction patterns were also calculated with Fullprof.
Raman spectra were recorded using a LABRAM I from Horiba Jobin Yvon with a HeNe 632.817 nm laser with a laser power of 20 mW, equipped with an Olympus BX41 microscope (50x magnification).
Diffuse reflectance FTIR spectra were measured on a Bruker alpha II spectrometer equipped with a DRIFT module using a gold standard for measuring background spectra.
A PerkinElmer Lambda 750 UV/VIS/NIR spectrometer, equipped with a Praying-Mantis mirror unit from Harrick was used to record the diffuse reflectance spectra using a spectralon pellet as white standard. The spectra were converted into absorption spectra using Kubelka-Munk function; bandgaps were estimated using Tauc-Plots.
Krypton physisorption data were collected at 77 K in the p/p0 range of 0.05–0.3 (fixed p0: 2.63 Torr) by using an Anton Paar QuantaTec ASiQ-MP-MP-AG setup. Specific surface area was determined by BET (Brunauer–Emmet–Teller) method. The samples were degassed at 200 °C for 3 h with subsequent testing of complete degassing.
Scanning electron microscopy (SEM) images were recorded with a Zeiss LEO 1530 at the Bavarian Polymer Institute (BPI) KeyLab Electron and Optical microscopy. An acceleration voltage of 3 kV was set and the working distance was chosen between 6 mm and 8 mm with an aperture set to 30 µm.
Transmission electron microscopy (TEM) was carried out using a JEOL JEM-2200FSat an acceleration voltage of 200 kV at the BPI KeyLab Electron and Optical microscopy.
2.3. Photocatalytic reactions
2.3.1. Hydrogen evolution and photodepostion of Rh-Cr2O3 co-catalyst
For the hydrogen evolution experiments, a dispersion of 200 mg photocatalyst in 550 ml water and 50 ml methanol was used. The photocatalyst was dispersed at 30 °C for 15 min in an ultrasonic bath. The dispersion was filled into a homemade double-walled inner-irradiation glass reactor with a quartz glass housing for the lamp and was stirred with 250 rpm. A 700 W Hg mid-pressure lamp (Peschl UV-Consulting) set to 500 W was placed in an inlet of double walled quartz glass. The reactor was cooled to 10 °C with a thermostat (LAUDA RP845). The whole system was flushed with Ar 5.0 with 100 ml min−1 using a Bronkhorst mass flow controller for approximately 1 h to remove residual air. The gas evolution was detected online using a mass spectrometer (Hiden HPR-20 Q/C). During the experiment oxygen, hydrogen and carbon dioxide were detected. The gas evolution was measured for 4 h to investigate the activity without any co-catalyst deposited.
After 4 h the lamp was shortly switched off to add an aqueous solution of Na3RhCl6( 99.999%, Sigma Aldrich) through a rubber sealing. The amount was adjusted, depending on the surface area of the used photocatalyst to achieve an Rh co-catalyst loading of 0.3 µmol m−2 for all samples. Before the addition, the stirring speed was raised to 500 rpm to ensure a uniform distribution of the co-catalyst. After stirring for 10 min the stirring speed was set back to 250 rpm and the lamp was switched on again for 2 h. Then, an aqueous solution of K2CrO4( 99.5%, Sigma Aldrich) was added in the same way resulting in Cr2O3 amount of 0.205 µmol m−2. After two more hours, the reaction was stopped. The sedimented samples were centrifuged and thoroughly washed with water and dried at 80 °C.
2.3.2. Overall water splitting
100 mg of the recovered photocatalyst with Rh-Cr2O3 co-catalyst were dispersed in 600 ml water in the same reactor system as described above. The system was flushed overnight with 50 ml min−1 Ar before the experiment. The reaction conditions were the same as in the photodeposition experiments. The gas evolution was measured for 7.5 h.
3. Results and discussion
3.1. Characterization
All prepared samples were thoroughly characterized before and after photocatalytic experiments. Since a stoichiometric amount of Ba(NO3)2 was used in the synthesis, the heterojunction Ba5Ta4O15-Ba3Ta5O15 should be formed as presented by Marschall et al[ 26]. As can be seen in the XRD patterns in figure 1(a), the crystallinity of the obtained powders after combustion increases with increasing amounts of ammonia solution and nitric acid. If no nitric acid is used, a completely amorphous powder is obtained. In contrast to this, a crystalline powder precursor is obtained even without calcination if 6 ml ammonia solution and 4.5 ml of nitric acid are used in the synthesis. XRD pattern confirms formation of heterojunctions with Ba5Ta4O15 as majority phase with several reflections belonging to impurity phases. Reflections of the main phase are in accordance with reference pattern of Ba5Ta4O15( JCPDS 18–0193/JCPDS 72–0631). Lower amounts of ammonia solution and nitric acid, result in lower crystallinity of the obtained powders. Table S1 (available online at http://stacks.iop.org/JPENERGY/3/014002/mmedia) gives an overview of the assignment of the reflections of the powder precursors obtained with 4.2 ml of ammonia solution and 3.5 ml of ammonia solution, respectively, to each phase.
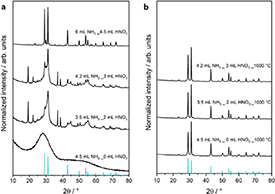
Figure 1. XRD patterns of (a) powder precursors, and (b) calcined powders. Reference line pattern of Ba5Ta4O15 is shown for comparison.
Download figure:
Standard image High-resolution imageThe increasing crystallinity with increasing amounts of ammonia solution and nitric acid can be explained by the formation of ammonium nitrate during the synthesis. The ammonium nitrate ignites when most of the solvent is evaporated, which is comparable to auto-combustion methods shown before in the literature [35–37]. The more ammonium nitrate is formed, the higher the temperature will become during combustion, resulting in a higher crystallinity of the obtained powder. As no ammonium nitrate can be formed in the synthesis without nitric acid, the combustion proceeds at significantly lower temperature and an amorphous product is obtained instead. Images made of the obtained powder precursors (figures S1(a)–(d)) show an increasing amount of white material with an increasing amount of ammonium nitrate in the synthesis. As expected, the optical impression of the increasing amount of white sample can be verified by reflection measurements (figure S1(e)). With increasing amounts of used ammonia solution and nitric acid, the reflection increases, therefore supporting the optical impression.
After calcination of the powders prepared with 0 ml, 2 ml and 3 ml of nitric acid, XRD confirms the formation of Ba5Ta4O15 as main phase with small amounts of by-phases for all calcined samples (figure 1(b)). Identification of the impurity phases is complicated by the small amounts and the similar diffraction patterns of most Bax Tay Oz phases. In order to unambiguously identify the samples, we have calculated simulated diffraction patterns for 90 wt.% Ba5Ta4O15 with each 10 wt.% of Ba3Ta5O15, orthorhombic (o) BaTa2O6 and hexagonal (h) Ba4Ta2O9( figure S2). These calculations take into account similar reflection broadening of all phases—due to crystallite size and micro-strain—and preferred orientation of Ba5Ta4O15 as the experimental patterns in figure 1. By comparing the experimental and simulated diffraction patterns, the impurity phases could be reliably identified: all four samples consist of Ba5Ta4O15 as majority phase and BaTa2O6( o) and Ba3Ta5O15 as impurity phases. The sample synthesised with 4.2 ml ammonia solution and 3 ml nitric acid has additional small reflections that can be assigned to Ba4Ta2O9( h). No reflections belonging to hexagonal BaTa2O6 or monoclinic Ba4Ta2O9 could be observed.
In order to obtain a reliable quantification of relative phase content, Rietveld refinements were performed (figure 2). The synthesis without nitric acid results in the highest amount of Ba5Ta4O15( 94.2%) and a combined 5.8% of BaTa2O6( o) and Ba3Ta5O15. An increasing amount of nitric acid—and thus a more intense combustion—results in a higher content of the two minority phases; however, no clear preference between those two phases is discernible. The sample synthesised without nitric acid also has the smallest mean crystallite size with 47 nm as compared to the other samples with 76 nm (3.5 ml/2 ml), 64 nm (4.2 ml/3 ml), and 70 nm (6 ml/4.5 ml).

Figure 2. Rietveld refinements of all four samples; red circles indicate measurement points, the black line is the calculated pattern, the blue line is the difference curve and the green dashes indicate theoretical reflection positions: (I) Ba5Ta4O15, (II) BaTa2O6( o), (III) Ba3Ta5O15, and (IV) Ba4Ta2O9( h).
Download figure:
Standard image High-resolution imageThe SEM images of the powder precursors in figure 3 show the typical intergrown sheet-like structure of Ba5Ta4O15 for the non-calcined sample prepared with 4.5 ml nitric acid. The other samples show a smooth dense structure. After calcination, all samples exhibit the intergrown sheet-like structure (figure 4).
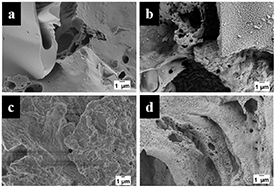
Figure 3. SEM images of powder precursors prepared with (a) 0 ml HNO3, (b) 2 ml HNO3, (c) 3 ml HNO3, and (d) 4.5 ml HNO3.
Download figure:
Standard image High-resolution image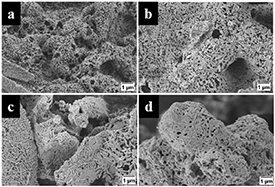
Figure 4. SEM images of calcined powders initially prepared with (a) 0 ml HNO3, (b) 2 ml HNO3, and (c) 3 ml HNO3, compared to (d) the non-calcined powder precursor prepared with 4.5 ml HNO3.
Download figure:
Standard image High-resolution imageTEM images confirm the formation of a highly crystalline heterojunction for the non-calcined sample (figure 5(a)). Since the lattice plane distances for Ba5Ta4O15, Ba3Ta5O15, and BaTa2O6 are very similar, it is not possible to assign the visible lattice planes to either compound of the heterojunction unambiguously, even in high-resolution TEM (figure 5). Nevertheless, the TEM images confirm the intense interfacial contact between the crystallites of the heterojunction for optimum charge transport, already without calcination. The calcined powder prepared with 2 ml nitric acid was also investigated for comparison (figure 5(b)), showing similarly very high crystallinity and an intense interfacial contact between crystallites. A close contact between the components is crucial for good charge separation [38] and enhanced photocatalytic activity.
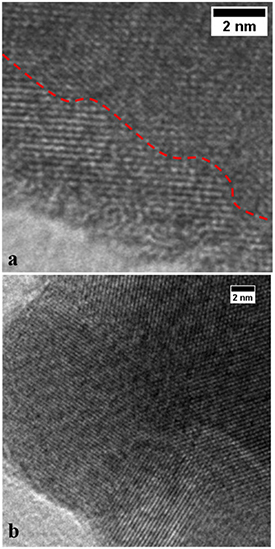
Figure 5. TEM images of (a) the non-calcined powder and (b) the calcined powder prepared with 2 ml HNO3.The red dashed line in (a) shows the borderline between two crystallites.
Download figure:
Standard image High-resolution imageRaman spectra of the synthesized heterojunctions are shown in figure 6(a), the main Raman bands are in agreement to the reported Raman spectra of Ba5Ta4O15 in the literature [39, 40]. The DRIFT spectra in figure 6(b) are also in consistence with the reported spectra of Ba5Ta4O15[ 23, 39]. As expected, BaCO3 and Ba(NO3)2 bands can be identified additionally in Raman and DRIFT spectra at 1059 cm−1, 1046 cm−1 and in the range of 1400 cm−1–1800 cm−1. The formation of small amounts of BaCO3 was already shown before in the synthesis of Ba5Ta4O15 and Ba5Ta4O15-Ba3Ta5O15 nanofibers [21, 23]. Samples prepared with 2 ml of nitric acid, 3 ml of nitric acid, and the non-calcined sample exhibit additionally Raman bands, which are in correspondence with the Raman spectra of orthorhombic BaTa2O6[ 41]. The intensity variation of these bands confirms the fractions of orthorhombic BaTa2O6 obtained from Rietveld refinement for the samples. An assignment of Raman bands to Ba3Ta5O15 is not possible as no reference spectrum could be found and no unassigned Raman bands are present in the spectra.
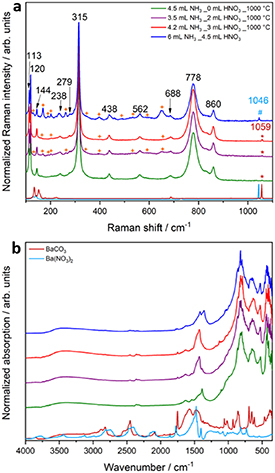
Figure 6. Raman spectra (a) and DRIFT spectra (b) of calcined powders and non-calcined sample. The colour code is identical in a and b. Measured commercial BaCO3 and Ba(NO3)2 references are shown for comparison. Black numbered bands correspond to Raman bands of Ba5Ta4O15. The light blue mark correspond to Raman band of Ba(NO3)2, red marked bands to BaCO3, and orange marked bands correspond to Raman bands of orthorhombic BaTa2O6.
Download figure:
Standard image High-resolution imageTauc plots and absorption spectra (figure 7) confirm the formation of heterojunctions, as a clear shoulder at lower energy is visible additionally to the main absorption edge. The main absorption edge can be attributed to Ba5Ta4O15 and is in the range of 4.3 eV to 4.4 eV for all samples. The small shoulder is related to Ba3Ta5O15 and the band gaps are in the range of 3.6 eV to 3.8 eV for all samples. Estimated band gaps are in consistence with literature values [12, 21, 22, 26, 27]. A clear identification of BaTa2O6 and Ba4Ta2O9 out of the UV–Vis spectra is not possible as the band gap of orthorhombic BaTa2O6 is overlaid by the smaller band gap of Ba3Ta5O15 and as the amount of hexagonal α-Ba4Ta2O9 is too small with 1%. Reported band gaps of orthorhombic BaTa2O6 are in the range of 4.1 eV [42] and 4.2 eV [27].
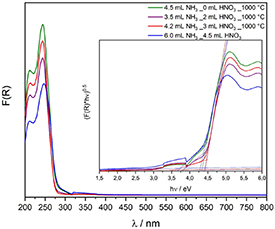
Figure 7. Kubelka–Munk UV–Vis spectra and Tauc-Plots (inset) of synthesized heterojunctions.
Download figure:
Standard image High-resolution imageAdditionally to the two absorption edges of the heterojunction, a small absorption giving a band gap of 2.9 eV is visible in the Tauc plots of the synthesized materials. This absorption can be attributed to oxygen vacancy defects in the material as it was calculated for Ta2O5[ 43].
Table 1 summarizes the estimated band gaps and measured surface areas of the materials. The surface areas are in the range of 2.5 m2g−1–5.4 m2g−1. Thereby, the non-calcined Ba5Ta4O15-Ba3Ta5O15-BaTa2O6 heterojunction exhibits the smallest surface area. The values are comparable to Ba5Ta4O15-Ba3Ta5O15 heterojunction synthesized by a citrate route in literature [27].
Table 1. Band gaps and BET surface areas of synthesized heterojunctions.
| Sample | Calcination temperature/°C | Band gaps/eV | BET surface area/m2 g−1 |
|---|---|---|---|
| 4.5 ml NH3 _0 ml HNO3 | 1000 | 3.8/4.3 | 3.3 |
| 3.5 ml NH3 _2 ml HNO3 | 1000 | 3.8/4.4 | 5.4 |
| 4.2 ml NH3 _3 ml HNO3 | 1000 | 3.6/4.4 | 4.7 |
| 6 ml NH3 _4.5 ml HNO3 | as-syn | 3.7/4.3 | 2.5 |
3.2. Photocatalytic results and post-photocatalytic characterization
To investigate the photocatalytic activity of the synthesized heterojunctions, hydrogen evolution and overall water splitting under UV-light from water with and without methanol were measured.
3.2.1. Hydrogen evolution and photodeposition results
All synthesized heterojunctions are able to generate hydrogen from water/methanol mixture without addition of a co-catalyst (figure S3). Steady state was reached after approximately 3.5 h with hydrogen evolution rates ranging from 930 µmol h−1 up to 1493 µmol h−1 for the calcined samples. The non-calcined heterojunction shows comparable photocatalytic activity to the calcined samples with an evolution rate of 1180 µmol h−1. A direct comparison of these results is difficult due to the differences of the observed surface areas of the samples and thus the presumable differences in the number of reaction sites. To exclude this influence, the hydrogen evolution rate was normalized to the absolute surface area of the samples. The resulting hydrogen evolution curves are shown in figure 8.
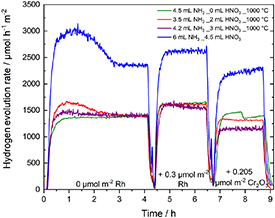
Figure 8. Hydrogen evolution curves during photodeposition experiments, normalized on absolute surface area.
Download figure:
Standard image High-resolution imageThe non-calcined sample—with the smallest surface area and therefore the presumably smallest number of reaction sites—shows the highest activity per hour and surface area. The hydrogen evolution diminishes strongly from the non-calcined sample with 2360 µmol h−1m−2 to the calcined samples, which altogether show a highly similar evolution rate of ∼ 1380 µmol h−1m−2.
These results correlate with the obtained results from the Rietveld refinements. The non-calcined sample has, with 11.7% of Ba3Ta5O15 and 12.1% of BaTa2O6, the highest fraction of by-phases. The overall amount of by-phases in the other samples are in the range of 5.8% up to 11%. The nearly doubled amount of evolved hydrogen therefore correlates with the amount of by-phases, showing the positive effect of heterojunctions in photocatalytic hydrogen evolution.
For later overall water splitting experiments, a Rh-Cr2O3 co-catalyst was photodeposited on the heterojunctions. The enhancement of the stirring speed during the addition of co-catalyst solution is the reason for the two peaks in the hydrogen evolution rates in figure 8. A quite low activity enhancement of all samples after addition of 0.3 µmol m−2 Rh co-catalyst is detected, which was already shown before and can be explained by the greater impact of heterojunction formation on charge carrier separation than Rh co-catalyst decoration [27]. As expected, the photodeposition of Cr2O3 results in a decrease of photocatalytic activity. Exemplarily, TEM images of sample prepared with 2 ml nitric acid were recorded and show the photodeposited Rh-Cr2O3 co-catalyst (figure S4). Additional detection of Rh and Cr in XPS was impossible (not shown) with the small amounts of co-catalyst deposited in this work [22].
All samples were characterized after photodeposition (figure S5): XRD characterization (figure S5(a)) reveals no changes in the crystal structure of all samples, diffuse reflectance UV/vis spectra show no changes in the band gaps (figure S5(b), table S2). Small changes in the DRIFT spectra (figure S5(c)) can be seen. The bands for carbonates and nitrates are lower in intensity after photodeposition for all samples. Parts of the residual barium carbonate and barium nitrate from synthesis dissolve during the photocatalysis. Additionally, bands of organic residues from the photodeposition process are visible. Raman spectra (figure S5(d)) are comparable to the spectra before photodeposition.
3.2.2. Overall water splitting results
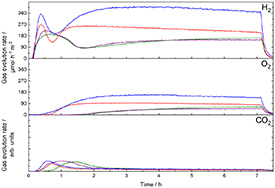
Overall water splitting experiments were performed with the Rh-Cr2O3 decorated heterojunctions (figure S6). All prepared samples show activity in overall water splitting experiments with typical curve characteristics shown before [22]. The strong peak in the hydrogen evolution at the beginning of the measurements is due to organic residues in the samples, which are still present after photodeposition experiments as the DRIFT spectra revealed for all samples (figure S5(c)). The additional detection of carbon dioxide evolution in the beginning of the overall water splitting experiments verifies this fact, as it shows also a strong peak at the beginning of the curves. After nearly all residual carbonate is oxidized, the evolution of carbon dioxide nearly stops and the water splitting reaction starts, as also indicated by the increase in oxygen evolution.
All samples show a hydrogen and oxygen evolution with ratios larger than 2:1, which can be explained still by residual carbonates, as the carbon dioxide evolution never stops completely. The hydrogen evolution varies from 112 µmol h−1 for the most active sample prepared with 3.5 ml of ammonia solution and 2 ml nitric acid to 55 µmol h−1 for the sample prepared without nitric acid (figure S6). The non-calcined sample shows again a comparable activity to the calcined samples with 92 µmol h−1.
Again, it has to be taken into account that the surface area of the prepared samples varies and needs to be excluded to give a clear statement about the effect of the different amounts of by-phases in the synthesized samples. Normalizing the evolution rates with respect to absolute surface area again, the non-calcined sample offers the best activity with 368 µmol h−1m−2 hydrogen evolution rate (figure 9).
Figure 9. Overall water splitting hydrogen, oxygen and carbon dioxide evolution curves during overall water splitting experiments, normalized on absolute surface area. Colour code is identical to figure 8.
Download figure:
Standard image High-resolution image
The activity of the samples in overall water splitting correlates with the amount of Ba3Ta5O15 in the synthesized composites. The higher the amount of Ba3Ta5O15 estimated by Rietveld refinement, the better is the activity in overall water splitting. This clearly confirms the improved charge separation in Ba5Ta4O15-Ba3Ta5O15-BaTa2O6 heterojunctions. Roughly calculated band position from literature [26, 27] confirm this, as the conduction band of Ba5Ta4O15 is slightly more negative than the conduction band of Ba3Ta5O15 and BaTa2O6. Therefore, the photoexcited electrons are transferred from the conduction band of Ba5Ta4O15 to the conduction bands of Ba3Ta5O15 and BaTa2O6 and recombination with the holes in Ba5Ta4O15 is reduced. The improved charge carrier separation for the Ba5Ta4O15-Ba3Ta5O15 heterojunction was already shown by transient absorption measurements in the literature [28]. A characterization of all samples with XRD, Raman, DRIFT, and UV–Vis after overall water splitting experiments reveals no changes in these samples (figure S7). The DRIFT spectra still show bands of organic residues, carbonates and nitrates after the overall water splitting experiments. The bands for carbonates and nitrates show only very small decrease compared to measurements before the overall water splitting. Most intense reduction of these bands can be seen in case of the non-calcined sample.
4. Conclusion
The Ba5Ta4O15-Ba3Ta5O15-BaTa2O6 heterojunction was prepared with a new and fast low temperature, energy efficient synthesis under ambient pressure conditions without further need of calcination. The photocatalytic activity of this non-calcined material was comparable or even better in hydrogen production without any co-catalyst and in overall water splitting after Rh-Cr2O3 deposition compared to samples prepared with an additional calcination step. In times of ever-growing energy demand, this energy efficient fast synthesis could be a new way for the synthesis of other crystalline and defined semiconductor materials without diminishing the photocatalytic activity.
Acknowledgments
We thank Dr Jana Timm for Kr physisorption measurements, and for fruitful discussions. Furthermore, we would like to thank Christopher Simon (all University of Bayreuth, Germany) for TEM measurements. Additionally, we thank the BPI KeyLab Electron and Optical Microscopy for the possibility to use the Zeiss Leo 1530 and JEOL JEM-2200FS.