
Abstract
The Fano absorption line shape of an autoionizing state encodes information on its internal atomic structure and dynamics. When driven near-resonantly with intense extreme ultraviolet (XUV) electric fields, the absorption profile can be deliberately modified, including observable changes of both the line-shape asymmetry and strength of the resonance, revealing information on the underlying dynamics of the system in response to such external driving. We report on the influence of the XUV pulse parameters at high intensity that can be achieved with a free-electron laser (FEL) with statistically broadened spectra based on self-amplified spontaneous emission (SASE). More specifically, the impact of the FEL pulse duration is studied for the example of the doubly excited 2s2p resonance in helium, where line-shape modifications have been measured with XUV transient absorption spectroscopy in Fraunhofer-type transmission geometry. A computational few-level-model provides insight into the impact of different average pulse durations of the stochastic FEL pulses. These findings are supported by measurements performed at the Free-Electron Laser in Hamburg (FLASH) and provide further insight into XUV strong-coupling dynamics of resonant transitions driven by intense high-frequency FEL sources.
Export citation and abstract BibTeX RIS

Original content from this work may be used under the terms of the Creative Commons Attribution 4.0 licence. Any further distribution of this work must maintain attribution to the author(s) and the title of the work, journal citation and DOI.
1. Introduction
If one excites an atomic or molecular system with more energy than it needs to be ionized, phenomena like fluorescence, Auger decay or semi-stable resonance states embedded in the continuum—so-called autoionizing states—come into play. A special species of the latter with direct electron–electron interaction are doubly excited states, which have been extensively studied in helium (for a review see e.g. [1]). The decay of such two-electron transitions is dominated by the interaction of the doubly excited state with the singly ionized continuum. In helium this typically occurs on the order of a few tens to hundreds of femtoseconds (fs) for the lower lying states [2, 3], which eventually leads to the ejection of one of the two electrons.
Autoionizing states hereby exhibit a characteristic asymmetric absorption line shape which has been measured with synchrotron extreme ultraviolet (XUV) light [2, 4–6]. The theoretical description was given by Fano [7], attesting the system a quantum-interferometric character, and explaining the asymmetric line shape through the phase-sensitive interaction of different electron configurations, nowadays well known as the Fano profile. The autoionizing states in helium represent a fundamental example of a correlated two-electron transition in a natural atomic system and can be used as a benchmark for the theoretical description of the Coulombic three-body problem [1, 8].
Over the years a general interest has developed, how this correlated two-electron system changes when driven with strong electric fields. Initial theoretical work already predicted interesting effects in strong laser fields [9–11], also under the influence of FEL pulse shapes [12]. On the experimental side, the modification of autoionizing states in helium in the presence of strong DC electric fields have been reported [13]. More recently, AC strong-field effects have been experimentally realized through the time-resolved XUV interaction in the presence of strong near-infrared laser fields, where attosecond XUV pulses are generated with high-harmonic generation, and a precise time synchronization between both pulses is possible. These experiments thus enabled a direct time-domain view into the strong-field driven autoionization dynamics in helium, both through XUV attosecond transient absorption spectroscopy (TAS) [14–20] as well as with electron photoemission spectroscopy [3, 21, 22]. With the recent availability of intense and ultrashort XUV pulses generated by free electron lasers [23] it became possible to directly investigate strongly coupled resonant transitions with intense XUV pulses, and an absorption line-shape distortion in helium has been observed [24]. Further theoretical investigations of the influence of FEL pulse parameters on these autoionization dynamics have been performed [25–27].
Here we present a study on the FEL pulse-length-dependent modification of the 2s2p autoionizing absorption line shape in helium when driven directly by intense and partially coherent XUV fields which are generated through self-amplified spontaneous emission (SASE). This is performed within the TAS scheme, an all-optical method that works in transmission mode and is sensitive to the interference of the incoming and scattered light in forward direction, which recently has been experimentally realized with intense FEL pulses [24, 28]. With a few-level model simulation, the impact of high-intensity XUV pulse parameters on the line-shape modification is investigated by a variation of the average pulse duration of stochastically structured FEL pulses. We find that with increasing FEL pulse duration, but fixed average bandwidth, the magnitude of observable line-shape asymmetry changes decreases significantly. These model predictions can be intuitively understood through the peak intensity distribution of individual temporal SASE spikes contained in each pulse, and are further confirmed by transmission-mode TAS measurements of the 2s2p resonance in helium at the Free-Electron Laser in Hamburg (FLASH).
We would like to note that absorption line-shape modifications are not a unique feature of multi-electron resonances and can also be observed for one-electron transitions [15]. FEL pulse-length effects are expected to become important whenever the resonance lifetime and FEL pulse duration are comparable.
2. Strongly coupled 1s2–2s2p transition in helium in intense SASE fields
The measurement concept is illustrated in figure 1. In the case of the first dipole-allowed two-electron resonance in helium, a single photon is sufficient to excite both electrons simultaneously from the ground state (1s2) into the doubly excited state 2s2p. With its energy (60.15 eV) above the single ionization threshold (24.6 eV), this is an autoionizing state, having a lifetime of 17 fs, after which the excitation almost exclusively decays into the single-ionization continuum of the ground-state helium ion He+ [2, 3]. Since this ionization can also happen directly, without involving the doubly excited state, the corresponding transition amplitudes interfere and the resonant absorption line shows the typical asymmetric Fano shape in the limit of weak (perturbative) XUV fields [7]. Dressing the system resonantly with a more intense XUV field, strong-coupling effects start to occur [10], and for the case of short pulses, the involved two-electron energy levels can be transiently shifted during the interaction with the external fields [15, 24].
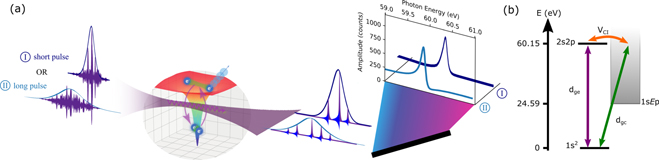
Figure 1. Sketch of the measurement and physics scheme. (a) SASE-based FEL pulses of either short (I) or long (II) duration are focused into a moderately dense helium gas target, leading to a single-photon two-electron excitation of an autoionizing state. The transmitted XUV light contains a dipole response (illustrated with blue color) of the target, dominant for each strong feature of the SASE structure (illustrated with violet color). It is spectrally dispersed and recorded with an XUV-sensitive CCD camera. In combination with the reference spectra acquired before or without the target, the optical density (OD) is determined, shown here averaged for short (I) and long (II) pulses, respectively. (b) Energy-level scheme of helium. From the two-electron ground state (1s2) the near-resonant photons couple either to the autoionizing two-electron resonance (2s2p, violet arrow), which decays via the configuration interaction (VCI, orange arrow) with a life time of 17 fs into the singly ionized continuum (1sEp), or it ionizes directly into the same continuum state (green arrow). As the final state of singly ionized helium is identical, both pathways interfere.
Download figure:
Standard image High-resolution imageA SASE-based FEL pulse has a substructure containing coherent sub-spikes [29–31]. The minimum duration of these intensity spikes can be related to the averaged spectral bandwidth of the pulse ensemble according to the time-frequency Fourier relationship. For a 0.4 eV average spectral bandwidth at 60 eV, this corresponds to a temporal duration of about 5 fs, which is significantly shorter than the autoionization lifetime of the 2s2p excitation. The short-pulse dressing with an isolated and intense spike thus leads to an impulsive change in the initial phase Δφ of the XUV-induced dipole response according to Δφ ∼ ΔE⋅ΔT, where ΔE and ΔT are the energy level shift and pulse duration, respectively, due to the interaction with the spike. This phase shift Δφ can be directly measured in a modified absorption line-shape q-parameter with φ = 2 ⋅ arg(q − i) [15], since its signature is measured in forward direction and imprinted on the transmitted FEL pulses. Thus, the XUV-induced strong-coupling regime can be quantified via the asymmetry of the measured absorption line shape, as parametrized by the well-known Fano q parameter [7].
Interestingly, the 17 fs lifetime of the 2s2p excitation in helium falls right between the typical intra-pulse spike (5 fs) and pulse-envelope duration (∼100 fs) at FLASH. The natural question arises: what is the influence of different pulse-envelope durations on this nonlinear excitation process driven by such statistical XUV pulses from a SASE FEL.
3. Simulation
A computational few-level model is employed to investigate the influence of SASE pulse duration onto the strongly driven double excitation, including only the involved resonant transitions and their coupling, which results in the Hamiltonian

Besides the ground state (Eg = 0 eV) and the 2s2p doubly excited configuration state at energy Ee, the continuum is modeled as an ultra-broad, thus fastly decaying state with a complex eigenenergy, being effectively the loss channel to this simulation. Its spectral position (Ec = 32.65 eV) and width (Γ/2 = 39.73 eV) as well as the dipole matrix element for direct ionization (dgc = 0.6753 a.u.) are chosen such that the non-resonant absorption cross section is reproduced in the region of interest [32, 33] for the limiting case of weak XUV pulses.
The coupling of the doubly excited configuration state to the continuum state is described by the configuration interaction matrix element VCI = 0.0373 a.u.. This coupling, as well as the eigenenergy of the doubly excited configuration state (Ee = 60.12 eV) and its dipole matrix element to the ground state (dge = −0.04932 a.u.), are determined such that the model reproduces tabulated values for the 2s2p absorption line shape in the weak-field limit [2, 34].
For the real-valued electric field E(t) to be representative of the XUV pulses of FLASH, which are generated by the SASE process, the partially-coherent pulse model [35] is utilized. The starting point is a flat-phased spectral amplitude of desired position and width corresponding to a typically averaged spectral intensity measured at a SASE FEL. This is combined with a fully random spectral phase and Fourier-transformed into the time domain. It is then windowed with a Gaussian envelope of a width corresponding to the required overall pulse duration. These pulses obtain a SASE-like stochastic structure in the time domain. The subspike features exhibit a duration on the order of 5 fs, corresponding to the bandwidth of the initial averaged spectrum of 0.4 eV full width at half maximum (FWHM).
Inserting the Hamiltonian into the time-dependent Schrödinger-equation (TDSE)  , the eigenvalue problem is solved by diagonalizing the matrix. The state vector (
c
(t) = [cg(t), ce(t), cc(t)]T)—initially fully in the ground state (
c
initial(t = 0) = [1, 0, 0]T)—is propagated in time with the time-evolution operator
, the eigenvalue problem is solved by diagonalizing the matrix. The state vector (
c
(t) = [cg(t), ce(t), cc(t)]T)—initially fully in the ground state (
c
initial(t = 0) = [1, 0, 0]T)—is propagated in time with the time-evolution operator  after rotating the state vector into the diagonal basis, where
  is the (in general complex-valued) eigenenergy to the dressed state i ∈ {1, 2, 3}. The propagation is performed for each time step (Δt = 0.1 a.u. ≈ 0.0024 fs) on a discretized time grid.
After having solved the TDSE, the complex-valued time-dependent dipole moment  is Fourier transformed back into the spectral domain obtaining
  and one evaluates the optical density OD(ω) after transmission through a moderately dense helium target with
Hereby the electric field spectrum  is also obtained after the Fourier transform of the complex-valued electric field E+(t). The interferometric superposition of the input spectrum
  and the macroscopic polarization response
  follows Maxwell's equations of propagating electric fields through the target medium [36] where the transmitted spectrum is measured in forward direction. The parameter η = 10−4 hereby represents the macroscopic particle density, interaction length and other fundamental constants. It is set sufficiently small to suppress propagation effects such that the resulting OD directly encodes the microscopic single-atom response.
The 〈...〉 in equation (2) represents an average over an ensemble of 200 pulses of the same fluence but with different initial (randomized) phases to account for fluctuating SASE intra-pulse intensity spikes across the ensemble.
Considering the stochastic nature of SASE pulses, the fluence, i.e. the temporally or spectrally integrated pulse intensity distribution, is a well-defined measure to compare different FEL pulses across the statistical ensemble. It is also the fluence which relates to directly accessible experimental parameters like the total pulse energy and the focal spot size.
First the computational model is applied to perform a fluence scan for a short ensemble-averaged pulse duration of 30 fs (figure 2). The 2D-plot shows significant line-shape changes toward a more symmetric line shape, validated by the lineouts (see figures 2(b)–(d)). For the quantification of the absorption line-shape parameters, the shape is fitted with the normalized Fano profile [15]:


Figure 2. Few-level model simulations of the helium 2s2p resonance with SASE-based XUV pulses at 59.7 eV central energy and 0.4 eV average bandwidth. The average pulse duration is 30 fs. The absorbance (a), represented in OD over photon energy, shows the characteristic Fano absorption line shape to change with increasing fluence. For each fluence bin, 200 pulses of different initial (random) phases are used. Lineouts of the absorbance (blue) and the fit of the Fano profile (orange) at fluences indicated in (a) are shown for (b) 14.0 J cm−2, (c) 7.5 J cm−2, (d) 0.5 J cm−2. The resulting asymmetry q-parameter and absorption strength (amplitude a) are indicated. The values of the fit parameter for the (e) asymmetry (q-)parameter and (f) absorption strength (amplitude a) quantify the trend for increasing fluence.
Download figure:
Standard image High-resolution imagewith the reduced energy ε(ω) = 2(ω − ωr)/Γ, the asymmetry parameter q, the line width Γ, resonance position ωr, the amplitude a, and the offset b.
The fit allows the quantitative extraction of the asymmetry q-parameter and the line strength a. By design the fit of the absorption line delivers the literature values in the weak-field limit (figure 2(d)), provided by synchrotron measurements of this transition with q = −2.75 and line width Γ= 37 meV [2]. With increasing fluence up to 15 J cm−2 the absorption line shape evolves toward a more symmetric profile up to q ≈ −7 (figures 2(b), (c) and (e)). This is in good agreement with previous experimental findings [24].
This fluence scan is repeated for a much longer average pulse duration of 150 fs (figure 3). In contrast to the case above, the line-shape asymmetry shows a significantly reduced variation with fluence (figures 3(b)–(d)). This is quantitatively confirmed by the fit of the Fano profile and the resulting q-parameter (figure 3(e)). Despite the markedly different behavior of the asymmetry of the absorption line, its amplitude shows an almost identical trend (compare figures 2(f) and 3(f)). Hence, the strength of the absorption line appears to be independent of the pulse duration but rather correlates to the fluence of the pulses. This indicates that the total ionization yield, i.e., the reduced population of the ground state, which is independent of the SASE sub-structure of the pulse and only depends on the total pulse fluence, is the dominating contribution to the observed reduction in amplitude. Normalizing to the initial absorption amplitude in the weak-field limit, its decrease can thus serve as a fluence metric and as such enables a direct comparison with experimental results.
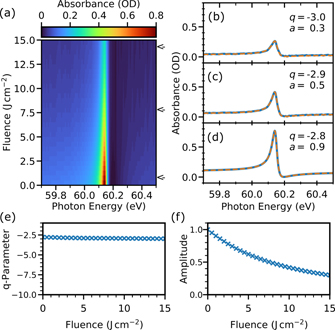
Figure 3. See caption of figure 2, except that here the average pulse duration is set to 150 fs (FWHM).
Download figure:
Standard image High-resolution imageIn order to investigate the pulse-duration dependence of the line-shape asymmetry, a high fluence of 15 J cm−2 is selected. A set of different pulse durations between 20 fs and 180 fs are used for a systematic scan in the computational model. The resulting OD(ω) (see equation (2)) is fitted in the same way (see equation (3)) and the extracted asymmetry parameter q is plotted as a function of the averaged pulse duration (figure 4).
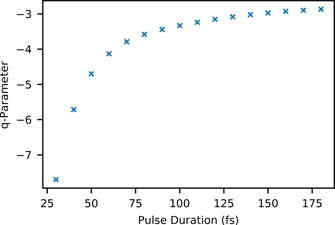
Figure 4. The few-level simulation is performed at 59.7 eV central energy for a high fluence of 15 J cm−2 with pulse durations between 20 fs and 180 fs (FWHM). Each bin includes an ensemble of 200 pulses with different initial phases. The asymmetry (q-parameter) from the fitted Fano profile of the resulting absorbance shows the dependence of the line-shape distortion on the average duration of the SASE pulse ensemble.
Download figure:
Standard image High-resolution imageMoving toward shorter pulse duration we observe q to become increasingly negative. Non-trivial strong-coupling effects, which may change the balance between the transition into the doubly excited state and the ionization continuum, thus seem to be more relevant for short average SASE pulse durations. For a longer pulse duration we observe the asymmetry to change much more slowly, approaching the reported weak-field limit (q = −2.75), indicating that strong-coupling effects become less prominent here. It is to be noted that the fluence is the same here for all pulses and all durations.
Since the overall pulse durations between 30 and 180 fs are all larger than the lifetime of the state, the explanation for the strong sensitivity of the q parameter on this duration can be found in the temporal (sub-)structure of the SASE pulses. As introduced above (see figure 1 and section 2), the individual spikes that are contained in the SASE pulse are much shorter than the excited-state lifetime (17 fs) as well as the average pulse duration. It is predominantly the interaction with a single spike that leads to a transient energy shift of the two-electron resonance, which is then encoded in a modified line-shape asymmetry. Therefore, a change in the average pulse duration effectively leads to a different number of temporal intra-pulse spikes, the number of 'micro-experiments' so to speak. Keeping the fluence constant, the SASE pulse energy is then distributed over a larger number of individual spikes for increasing average pulse duration. This obviously causes a decrease of the peak intensity that is reached in each individual intra-pulse spike, thus explaining why the line-shape asymmetry is less affected in this regime.
For a quantification of the bunched intra-pulse intensity distribution of the individual spikes, the histogram (figure 5) depicts the peak intensity probability comparing a short (30 fs) and long (150 fs) average pulse duration for an ensemble of 100 pulses each. This directly confirms the above explanation. For shorter pulses, peak intensities as high as 1.5 × 10¹⁵ W cm−2 can be reached, while for longer pulses the peak intensity barely reaches above 5 × 10¹⁴ W cm−2 and the fluence is distributed over many more low-intensity spikes. From previous work with 5 fs Gaussian pulses [24] we found that the upper 1014 W cm−2 is the expected intensity regime where impulsive strong-coupling effects start to play a significant role. As we have shown here, SASE pulses with much longer average duration can contain several of such sub-spikes in that intensity regime. For a fixed fluence that will not cause ionization depletion before the peak of the pulse envelope is reached, strong-coupling XUV effects (e.g. as shown here, the modification of the q parameter) thus increase for shorter pulses.

Figure 5. Analysis of the temporal structure of an ensemble of 100 simulated SASE pulses at a fluence of 15 J cm−2. The histogram shows the distribution of individual intensity spikes sorted by their peak intensity for pulse ensembles of 30 fs (blue) and 150 fs (orange) (FWHM) average duration. Note the larger probability to find spikes with peak intensities between 0.5–1.5 1015 W cm−2 for shorter pulse duration.
Download figure:
Standard image High-resolution image4. Experimental
For an experimental demonstration of the computational findings above, a home-built XUV-TAS setup was connected to the beamline BL2 at FLASH. The FEL was operated in single-bunch mode at 10 Hz repetition rate. An ellipsoidal mirror focused the beam down to a spot size of a few ten micrometers onto a helium gas target with a path-length density on the order of 1017 cm−2. After transmission through this moderately dense target, the beam was spectrally dispersed with a variable-line-space grating onto a flat surface, where it was measured with a back-illuminated XUV-sensitive CCD camera. A parasitic reference spectrometer, installed in the FLASH beamlines [37], recorded online single-shot spectra before the target which are used for the experimental quantification of the OD. To control the fluence of the XUV pulses, the pulse energy was controlled with a facility-based gas absorber filled with a tunable density of molecular nitrogen, which acts as a non-resonant absorber medium in the spectral region of interest. The resulting pulse energy was parasitically measureded for each individual pulse with a gas-monitor-detector (GMD) [38, 39]. The pulse energy is distributed over several ten μJ and reaches an average of 75 μJ in the high pulse-energy setting, that is without any nitrogen absorption along the beam path. Considering losses of the XUV optics, the beamline transmission is estimated at 50%, leading to about 36 μJ pulse energy available on target. This corresponds to a fluence on the order of ∼10 J cm−2. With an assumed constant focal spot size, which is reasonable since the nitrogen gas absorber has not been observed to modify the far-field beam parameters, fluence and pulse energy are directly proportional to each other. Since the pulse energy is the directly measured quantity during the experiment, it will be used as the equivalent parameter to the fluence in this section. The spectral position of the XUV pulse was tuned to 60 eV, energetically slightly below the 2s2p resonance, with a spectral bandwidth of 0.4 eV.
Measuring the spectral intensity Strans(ω, Ep) after the transmission through the helium target, the OD is determined following Beer–Lambert's law by

where Sref(ω, Ep) is the reference spectral intensity measured parasitically with the FLASH online spectrometer. All measured quantities are sorted by the pulse energy Ep according to the GMD reading. Hereby the gas absorber was used to increase the number of events for low pulse energy. The measured ensemble spectra are averaged 〈...〉 over at least 200 events.
Pulse-energy scans have been performed for two different sets of FEL machine parameters (figures 6 and 7) and show significantly different behavior. From typical FEL conditions at this pulse energy, the pulse duration of the first setting is estimated to be ∼75 fs [40]. The results of the OD over pulse energy (figure 6) show a clear modification of the line-shape asymmetry. With increasing pulse energy the Fano line-shape asymmetry changes from the weak-field limit q-parameter of q ≈ −2 toward a more symmetric shape around q ≈ −6 (figure 6(e)), while the normalized amplitude decreases to 0.3 (figure 6(f)).
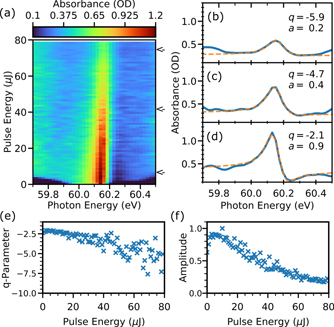
Figure 6. Experimental TAS measurement of the helium 2s2p resonance at FLASH with SASE-based XUV pulses at 60 eV central energy and 0.4 eV average bandwidth. The overall pulse duration is estimated at 75 fs (FWHM). The absorbance (a), represented in OD over photon energy, shows the absorption line to change with increasing pulse energy. For each bin several hundreds of single-shot pulses are averaged. Lineouts of the absorbance (blue) and the fit of the Fano profile (orange) at measured pulse energy indicated in (a) are shown for (b) 73 μJ, (c) 40 μJ, (d) 5 μJ to illustrate examples for the absorption line shape along with the fit. The resulting asymmetry q-parameter and absorption strength (amplitude a) are indicated. The values of the fit parameter for the (e) asymmetry (q-)parameter and (f) absorption strength (amplitude a) show the detailed behavior for increasing pulse energy. First results of this measurement have been previously discussed in [24].
Download figure:
Standard image High-resolution image
Figure 7. See caption of figure 6, but here the overall pulse duration in the experiment is estimated to about 130 fs (FWHM). Lineouts of the absorbance (blue) and the fit of the Fano profile (orange) at pulse energy (b) 73 μJ, (c) 41 μJ, (d) 9 μJ illustrate examples for the absorption line shape along with the fit.
Download figure:
Standard image High-resolution image
The second measurement (figure 7) was performed during a later campaign with a different set of machine parameters. By spectral analysis of the spectral intensity of individual FEL pulses, the pulse duration is estimated at 130 fs, whereas other parameters (photon energy and the on-target fluence) are comparable to the previous measurement. The recorded absorption lines show similar decrease in line strength (amplitude a, compare figures 6(f) and 7(f)), but the asymmetry q-parameter (compare figures 6(e) and 7(e)) now follows a different trend. Indeed, the q-parameter remains approximately constant, which is compatible with the previous discussion of long average pulse duration.
With the above mentioned direct connection between amplitude a and fluence (i.e., the pulse energy), created by ground-state depletion, the on-target fluence is assumed equal for both experiments. Therefore, the influence of the average duration of the SASE pulse on the line-shape parameters can be confirmed also experimentally, and is in qualitative agreement with the theoretical findings from above.
5. Conclusion
To summarize, we have demonstrated that the average pulse duration of SASE XUV pulses has a significant impact on XUV strong-coupling-induced line-shape asymmetry changes of the 2s2p double-excitation resonance in helium. The line strength (amplitude a) has been shown to mainly depend on the fluence and appears rather independent of the intrinsic temporal structure of the SASE pulses. The line-shape asymmetry q by contrast has been found to strongly depend on the average SASE pulse duration. We have explained this observation computationally with the stochastic intra-pulse spiked intensity structure, where the line-shape asymmetry is mainly impacted by the peak intensity of individual spikes. Our findings are also in agreement with experiments utilizing different FEL parameters. In the future, the understanding of such XUV strong-coupling effects will be helpful for the interpretation of FEL-based spectroscopy and imaging studies at intermediate and up to very high intensities, and is not limited to autoionizing transitions. This understanding can also turn into tools for characterizing FEL pulses on one hand, and for understanding mechanisms in XUV/x-ray coherent control of atoms and molecules on the other hand.
Acknowledgments
We gratefully acknowledge technical support from C Kaiser, N Mollov, B Knape and the technical shops at MPIK. We are greatly indebted to the technical and scientific teams at FLASH, in particular, Dr. S Düsterer, Dr. G Brenner, Dr. R Treusch as well as Dr. B Keitel et al for their support during the experiment. We acknowledge funding from the European Research Council (ERC) (X-MuSiC-616783).