
Abstract
The relationship between the cooling rate and microstructure evolution and the performance improvement of an Al–4.5 wt% Cu alloy prepared using different casting methods was investigated. The microstructure evolution, solute element distribution, and mechanical properties of specimens prepared using different cooling rates were systematically investigated using multi-scale optical microscopy, scanning electron microscopy, transmission electron microscopy, tensile testing, and hardness testing. Upon increasing the cooling rate from 1.65 to 117.3 K s−1, the average grain size, secondary dendrite arm spacing, and width and area fraction of eutectic phases significantly decreased, and the density of the precipitated phase, super-saturation degree of solute elements, and mechanical properties improved. Through a combination of grain-boundary, solid-solution, and precipitation strengthening, the cooling rate indirectly affected the mechanical properties of the heat-treated alloy sheets. The Al−4.5 wt% Cu alloy prepared by twin-roll casting under a cooling rate of 117.3 K s−1 exhibited a strength between 145.33 and 321.79 MPa and an elongation of 11.65%, demonstrating its potential as a high-performance aluminium alloy.
Export citation and abstract BibTeX RIS

Original content from this work may be used under the terms of the Creative Commons Attribution 4.0 licence. Any further distribution of this work must maintain attribution to the author(s) and the title of the work, journal citation and DOI.
1. Introduction
The ageing process refers to a metal or alloy workpiece held at a specific temperature for a period after solution treatment. Generally, after ageing heat treatment, the properties change with holding time, the strength and hardness increase, while the plasticity, toughness, and internal stress decrease. Age-hardened Al–Cu alloys are widely used in the transportation and aerospace industries, because of their advantages of light weights, high strengths, good heat resistances, easy processing abilities, and recyclabilities [1, 2]. As a near-net shape processing technique, twin-roll casting (TRC) is a continuous casting technique used to produce metallic sheets directly from molten metal, which minimises the need for subsequent secondary processing. This process offers a number of significant advantages over conventional direct-chill (DC) casting, including a shorter production period, reduced energy consumption, a lower scrap rate, and higher added value [3–5]. If the metallurgical and technological challenges for producing alloys with high alloy content and wide solidification intervals can be overcome, it is likely that TRC will become one of the most promising technologies of the 21st century.
Aluminium alloys with high elemental content and large solidification intervals produced by the traditional semi-continuous DC casting technique suffer from the negative consequences of additional residual crystalline phases, serious macro/micro-segregation, hot cracking, and poor casting performance [6, 7]. Consequently, the extensive application of traditional ingot metallurgy to fabricate high-quality aluminium alloys has been limited. It is well known that many of the mechanical properties of materials are affected by their microstructures, with a finer grain size being beneficial to improve the ductility [8, 9], mechanical properties, hardness, corrosion resistance [10, 11], and distribution uniformity of solute elements [12], and to reduce the interface between the secondary phases and the matrix [13].
In general, the grain size, morphologies of the secondary phases, supersaturated solid solution degree, and distribution of solute elements are directly affected by the cooling rate. In previous studies, the effect of the cooling rate on the microstructure and properties of different alloys was examined using various experimental methods for the design of high-performance materials. A V-shaped Cu mould was used to fabricate Al–3.0 wt% Si and Al–0.1 wt% Ti alloy ingots (cooling rates of 15.82, 36.78, 50.75, and 64.72 K s−1) [9]. A step-like iron mould with thicknesses ranging from 5 to 50 mm was used to realise different cooling rates (2.3, 3.4, 9.8, and 24.1 K s−1) [13]. A Gleeble 1500D thermo-mechanical simulator was used to produce specimens at different cooling rates (0.1, 0.2, 0.3, 0.5, 1, 5, and 30 K s−1) [14]. Fast cooling technology using a Cu mould was used to prepare cast A356 alloy at a cooling rate of approximately 102 K s−1 [15]. A cast-iron die with a cylindrical cavity was used to prepare 2-in.-diameter and 5-in.-high specimens (cooling rates of 0.4, 6.3, 9.7, 12.1, 30.9, and 33.4 K s−1) [16]. Permanent mould casting was used to prepare Zn–Al–Cu alloys with diameters varying from 74 to 124 mm at different pouring and mould temperatures (cooling rate of 0.21.4.70 K s−1) [17]. A novel circulated water mould was designed to fabricate 2024 aluminium alloy with different diameters (cooling rates of 0.42, 0.65, 0.74, 1.14, 2.46, and 15.51 K s−1) [18]. These studies showed that under near-equilibrium solidification conditions, with an increasing cooling rate, the grain size and dendrite arm spacing significantly decreased, while the super-saturation of solute elements, mechanical properties, ductility, and hardness simultaneously increased.
Teng et al [19, 20] reported that AZ61 magnesium alloy foils of 0.5.3.0 mm thickness were successfully produced using a self-designed sub-rapid solidification setup, indicating that the super-saturation degree of the solid solution was significantly increased, the size of the β-Mg17Al12 phases was reduced, and the micro-segregation was remarkably suppressed. Alcoa reported a new manufacturing technology, the Micro-mill, in 2014, which produced high-quality automotive body sheets. Compared with those of the conventional DC casting process, the formability improved by 40%, the strength increased by 30%, and the production cycle was shortened from 20 days to 20 min. These excellent properties were attributed to the special microstructure, finer grains, and uniform distribution of reinforced phases and solute elements in the matrix. In addition, the microstructure, deformation, and subsequent solid-state transformation were highly coupled. Increasing the cooling rate generally suppresses the formation of or refines the secondary phases and may also affect their morphologies or growth modes [21–24]. In summary, to establish a logical closed loop between processing conditions, microstructure, and mechanical properties, the accuracy of regulation and control of non-equilibrium solidification and solid-state transformation will directly determine the optimisation of the composition/process design and properties. Therefore, the use of an appropriate cooling rate is crucial for improving the mechanical properties of alloys with wide solidification intervals.
Previous studies on the effect of the cooling rate on the microstructure and properties have been limited to the near-equilibrium cooling rate range. In the present work, Al−4.5 wt% Cu alloy sheets were prepared with wide solidification intervals using different casting methods, and the relationship between the cooling rate and microstructure evolution, mechanical properties, and solute distribution during different solidification processes were explored. This work provides technological support for the industrial manufacture of high-performance aluminium alloys with competitive advantages via a novel, short, and low-cost process, opening the door for further development of TRC based on a sub-rapid solidification technique in industry.
2. Experimental procedures
2.1. Melting and casting of experimental alloy
The Al−4.5 wt% Cu alloy was prepared using pure Al (99.7 wt%) and an Al−50 wt% Cu master alloy melted into a graphite crucible in an intermediate frequency furnace. After the aluminium ingot was melted completely, the melt was transferred to an electric resistance furnace and heated at 710 °C for 1 h; next, the melt was degassed with 0.2 wt% C2Cl6 followed by removal of the slag. An Al–Ti–B (0.4 wt%) grain refiner was also added to the melt, which was regularly stirred to achieve a homogenised melt for the casting experiment [3].
As shown in figure 1, the alloy was cast into 6-mm-thick slabs using three different methods: sand mould, water-cooled Cu mould, and TRCs, to investigate the relationship between the cooling rate and microstructure evolution and the mechanical properties of Al–4.5 wt% Cu alloy. The dimensions of the solidification samples were 6 mm × 200 mm × 400 mm with a pouring temperature of 710 °C. For twin-roll casting, a horizontal twin-roll caster with two rolls (500 mm in diameter and 500 mm in width) was used. The thicknesses of the roll sleeve, maximum roll gap, and maximum separation rolling force were 50 mm, 50 mm, and 1000 kN, respectively. The initial cast-rolling speed, melt temperature, casting nozzle width, and cooling water pressure were 1.2 m min−1, 710 °C, 200 mm, and 0.4 MPa, respectively.

Figure 1. Schematic diagram of solidification cooling curve collected with different casting methods. (a) Sand mold casting and copper mold casting; (b) Twin-roll casting.
Download figure:
Standard image High-resolution image2.2. Determination of cooling curves during different casting methods
Cooling curves were obtained for the thermal analysis of all the samples using a thermal analyser and K-type thermocouples. The thermocouples were inserted into a stainless-steel sheath and connected to a high-speed data acquisition system. The data signals were recorded every 100 ms in all experiments. During the casting experiment using sand and water-cooled Cu moulds, the thermocouples were inserted into the mid-section at the heights of each mould (150 mm from the bottom of the mould). To improve the reliability of the collected data, before each series of experimental tests, the thermocouples were calibrated by melting and solidification of high-purity aluminium, and two thermocouples were inserted into each group of samples at the same time to prevent experimental failure caused by thermocouple damage. The thermal analyser indicated the cooling curves, temperature, and time on the monitor in real time for instant observation. Time–temperature data were recorded at a frequency of 10 readings per second, and the cooling curve was plotted using Origin 9.0 software. The parameters of solidification, including the cooling rate, nucleation temperature, solidification intervals, and solidification time, were determined by data processing.
2.3. Microstructural characterization and mechanical property tests
The as-cast alloys were milled, hot-rolled, cold-rolled to 1 mm, solution-treated at 535 °C for 6 h and quenched in water at 25 °C. Next the alloys were aged at 200 °C for 6 h in an air cushion furnace. Specimens for microstructural observations and tensile tests were cut from the central area of the sheets. Characterisation of the constituent phases was performed by X-ray diffraction (XRD) with a Cu Kα source operating at 25 kV and 50 mA and a scanning rate of 5° min−1. The metallographic samples were prepared by standard mechanical polishing and etched with 25 g l−1 hydrofluoric acid solution to form an anode coating. The microstructure was examined using a Zeiss polarising optical microscope (OM). The morphologies of the constituent phases with different specimens were examined using field-emission scanning electron microscopy coupled with X-ray energy dispersive spectroscopy (EDS). The secondary dendrite arm spacing (SDAS) and average grain size of α-Al were measured using the linear interception method. Furthermore, transmission electron microscopy (TEM) specimens were cut from the end of the tensile specimen. Vickers hardness tests were performed on the polished specimens (load: 5 N, holding time: 10 s). Subsequently, the average value of five groups of measurements was recorded. Finally, tensile tests were performed on an AG-X100 kN tensile tester at room temperature with a deformation speed of 1 mm min−1.
3. Results
3.1. Thermal analysis of cooling curves
Figure 2(a) presents the thermal analysis of the solidification curves of the as-cast alloys prepared using different casting methods. The solidification time varied significantly with the casting method selected, indicating that the average cooling rate was considerably affected by the heat-transfer capabilities of the different casting moulds. As observed in figure 2(b), the use of the first derivative improved the accuracy of determining the characteristics of the solidification cooling curves. This benefit was not realised in the original solidification curves. The first derivative of the cooling curve was numerically equal to the slope of the solidification curve, which represented the average cooling rate of the metal during solidification.
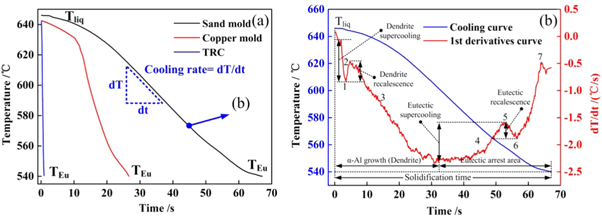
Figure 2. Thermal analysis curves of Al−4.5 wt% Cu alloys with different cooling rates. (a) Cooling curves of different casting methods; (b) 1st derivative of cooling curve in sand casting.
Download figure:
Standard image High-resolution imageAs previously reported [25, 26], the inflection points (Points 1 and 6 in figure 2(b)) on the first derivative curve represent the formation of a new phase. There were two obvious inflection points, indicating that two phase transformations occurred during solidification, the formation of α-Al dendrite and eutectic phases. The results indicate that the α-Al dendrites were formed in the early stages; stages one, two, and three represent the nucleation, growth, and thickening of α-Al dendrites, respectively, and the eutectic phases were formed during the late stage of solidification. The corresponding cooling rates were calculated for the different casting methods: the cooling rates of the sand mould, water-cooled Cu mould, and TRC methods were 1.65, 5.70, and 117.3 K s−1, respectively.
3.2. As-cast microstructure
The microstructures of the as-cast alloys prepared with different cooling rates are shown in figure 3. As observed in figure 3(a), under the condition of a slow cooling rate in sand mould casting, the as-cast microstructure of the Al–4.5 wt% Cu alloy is coarse and uneven, and the grain size ranges from tens to hundreds of microns. The alloy was mainly composed of the primary α-Al phase and Al2Cu eutectic phase that are distributed along the grain boundary. The secondary dendrite spacing was observed to be large. As observed in figure 3 (c), with an increasing cooling rate during solidification, the primary α-Al phase changes from a coarse phase to a fine phase for the water-cooled Cu mould casting. This transformation resulted from the increase in the nucleation rate caused by large undercooling; at the same time, the growth and coarsening of grains after nucleation was inhibited. One may observe from figures 3(e) and (f) that with a higher cooling rate, the dendrite structure become more evident, indicating that increasing the cooling rate promotes the formation of dendrites. Although the grain size showed no obvious change, the SDAS clearly decreased.

Figure 3. The microstructure at the edge and center region of the samples with different cooling rates. (a) (b) (c) Sand mold 1.65 K s−1; (d) (e) (f) Copper mold 5.70 K s−1; (g) (h) (i) Twin-roll casting 117.3 K s−1
Download figure:
Standard image High-resolution imageTo characterise the microstructures of the Al–4.5 wt% Cu alloys prepared with different cooling rates, XRD patterns and DSC curves were obtained, as shown in figure 4. The XRD data reveal that the as-cast alloys mainly contained α-Al and Al2Cu phases and with an increasing cooling rate, the α-Al peak shifted. Furthermore, with an increasing cooling rate, the moving speed of the liquid–solid interface clearly increased, more Cu were captured and dissolved in the α-Al matrix, and the lattice of α-Al was distorted. In addition, less Cu remained to form the Al2Cu eutectic phase; thus, the peak intensity of the Al2Cu phases was significantly changed.

Figure 4. The XRD patterns and DSC curves of as-cast alloys with different cooling rates. (a) (b) XRD patterns with different cooling rates; (c) DSC curves with 1.65 K s−1; (d) DSC curves with 5.70 K s−1; (e) DSC curves with 117.3 K s−1; (f) The enthalpy with different cooling rates.
Download figure:
Standard image High-resolution imageAs shown in figures 4(c)–(e), the DSC results were consistent with the conclusions drawn from the XRD patterns. At approximately 545 °C, obvious endothermic peaks appear for the three groups of specimens at the same time, indicating that the eutectic phases were dissolved at this temperature. The area around the endothermic peak in figure 4 is proportional to the precipitation amount of the Al2Cu phases. The precipitation of the Al2Cu phase was inhibited and decreased with an increasing cooling rate. The endothermic peak area (i.e., enthalpy change) was calculated using Origin 9.0 software, and the results in figure 4(f) indicated that upon increasing the cooling rate, the content of the Al2Cu eutectic phases decreased and the peak area decreased from 11.34 J g−1 for sand mould casting, to 6.22 J g−1 and 4.57 J g− for water-cooled Cu mould casting and the TRC method, respectively; the ratio of the peak areas was 2.48:1.36:1.00.
Figure 5 presents backscattered scanning electron microscopy (SEM) images of the as-cast Al–4.5 wt% Cu alloys prepared using different cooling rates. It is well established that the as-cast microstructure contains α-Al and Al2Cu phases and that the cooling rate has a significant effect on the grain size, the width of eutectic phases, and the secondary dendritic arm spacing. In addition, the cooling rate also affects the area fraction of Al2Cu eutectic phases. As the cooling rate increases from 1.65 to 117.3 K s−1, the average width of the eutectic phases decreases from 25.94 to 5.28 μm, and the average area fraction of Al2Cu eutectic phase decreases from 4.4% to 1.8%. The relationship between the cooling rate and eutectic phase is plotted in figure 5(d).
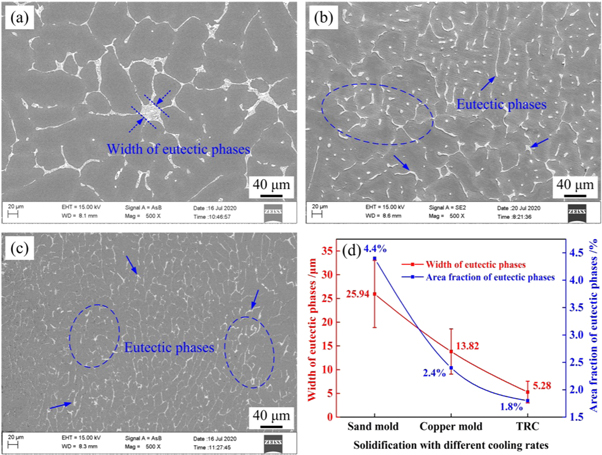
Figure 5. Backscattered SEM images of the as-cast alloys with different cooling rates. (a) 1.65 K s−1; (b) 5.70 K s−1; (c) 117.3 K s−1; (d) width of eutectic phases.
Download figure:
Standard image High-resolution imageThe measured values of the secondary dendritic arm spacing and width of eutectic phases are presented in figure 6. With an increasing cooling rate, the average grain size decreased from 309.5 μm with the sand mould to 185.7 μm with the water-cooled Cu mould to 148.6 μm using the TRC method. In addition, the average secondary dendritic arm spacing decreased from 53.4 μm with the sand mould, to 26.3 μm with the water-cooled Cu mould, and to 7.33 μm using the TRC method. A 40% reduction in grain size and 86.3% reduction in SDAS were observed upon increasing the cooling rate from 1.65 to 117.3 K s−1. From the above analysis, the higher cooling rate affects not only the grain size and secondary dendrite spacing, but also the area fraction and width of eutectic phases.
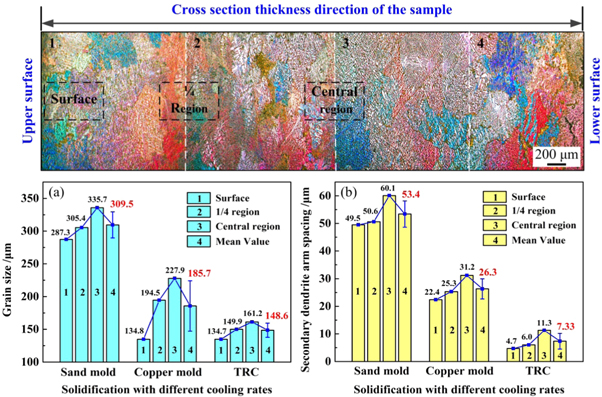
Figure 6. Grain size and secondary dendrite arm spacing with different cooling rates. (a) Grain size; (b) SDAS with different cooling rates.
Download figure:
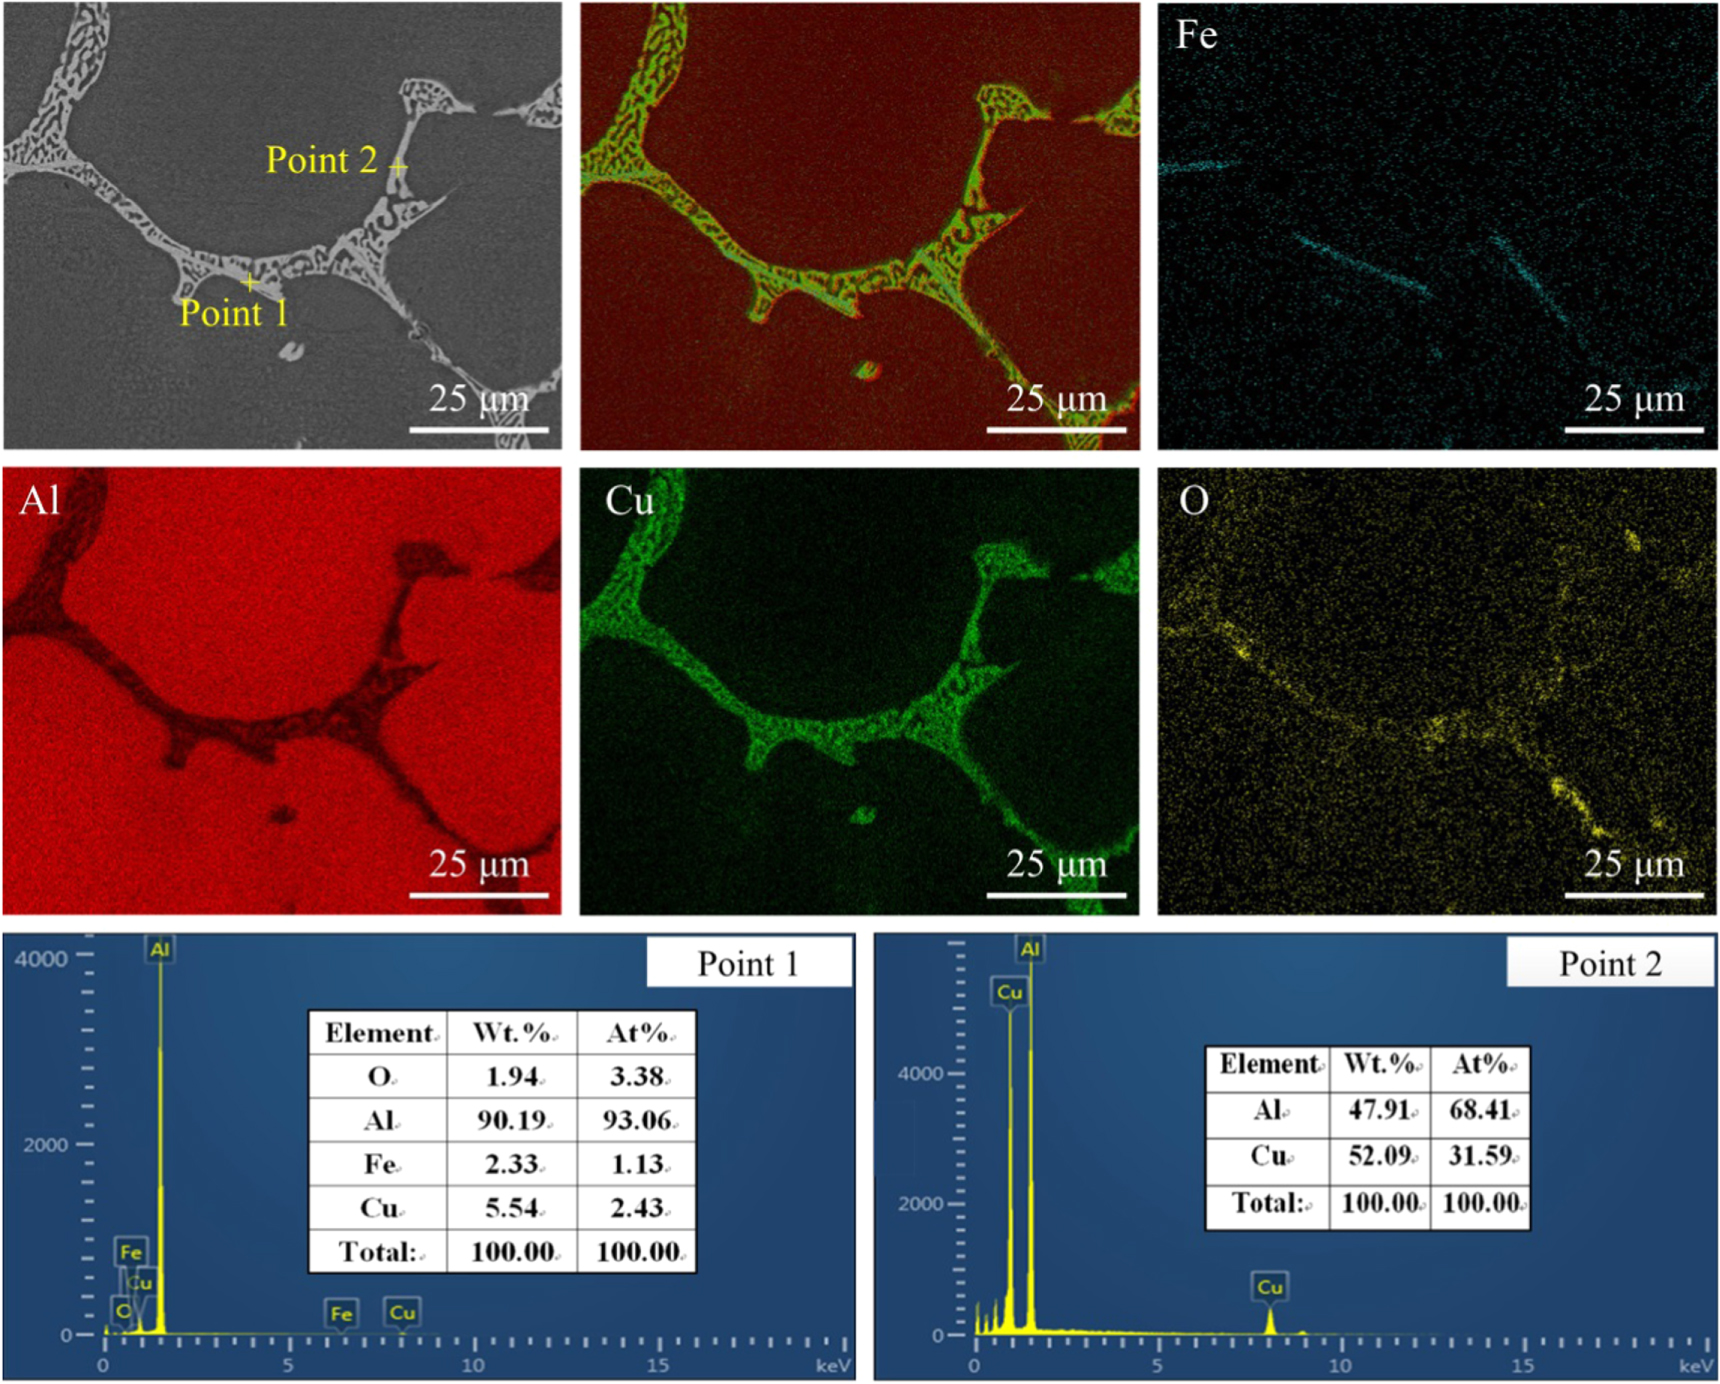
Standard image High-resolution imageThe SEM morphologies and corresponding distributions of alloying elements of as-cast Al–4.5 wt% Cu alloys produced with a cooling rate of 1.65 K s−1 are shown in figure 7. In addition to Al, the alloying elements mainly consisted Cu and a small amount of Fe and O. It can be clearly observed that the eutectic phases at the grain boundary had a lamellar distribution. According to the XRD patterns in figure 4(a) and EDS analysis in figure 7, these eutectic phases are mainly composed of α-Al and Al2Cu; the weight percentages of Cu and Fe in the eutectic phase with different morphologies in the grain boundary are 5.54% and 2.33%, respectively, as shown in figure 7. The Al:Cu atomic ratio of 68.41%:31.59% is close to 2:1. Thus, the grey rod phase could be assumed to be the Al2Cu phase.

Figure 7. SEM map scanning results of solute elements and corresponding EDS point scanning analysis of point 1 and point 2 from the as-cast alloy produced with the cooling rate of 1.65 K s−1.
Download figure:
Standard image High-resolution imageLine-scanning images of different solute elements in the grains and grain boundaries of the as-cast alloy produced at cooling rates of 1.65 and 117.3 K s−1 are presented in figure 8. As observed in figures 8(a) and (b), the non-equilibrium eutectic phase is lamellar for the cooling rate of 1.65 K s−1 using the sand mould. The lamellar thickness was in the range of 1–2 μm. When the cooling rate was 117.3 K s−1 for TRC, the width of the eutectic phases at the grain boundary was obviously refined, being reduced from approximately 10 to 5 μm, and the non-equilibrium eutectic phase was dispersed on the grain surface or grain boundary in the form of particles. Furthermore, as observed, with an increasing cooling rate, the Cu content in the α-Al matrix clearly increased, with the average peak content of 334.87–349.69 at 1.65 K s−1 increasing to 894.92–1000.8 at 117.3 K s−1. It indicates that the increase of cooling rate caused the content of Cu in the crystal increase nearly three times.
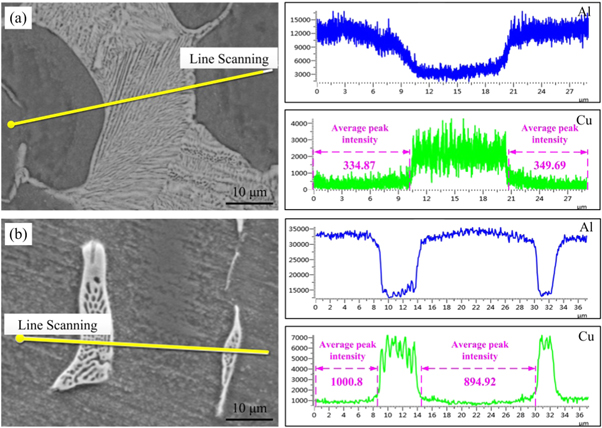
Figure 8. Line scanning analysis results of the eutectic phases with different cooling rates. (a) 1.65 K s−1, (b) 117.3 K s−1
Download figure:
Standard image High-resolution image3.3. Eutectic phase transformation after homogenization treatment
Figure 9 presents SEM micrographs of the Al–4.5 wt% Cu alloys after homogenisation treatment at 500 °C for 10 h, showing the effect of cooling rate on the eutectic phase transformation. After homogenisation treatment, the grain boundaries became fine and clear, and fewer crystalline phases remained on the grain boundary, indicating that most of the eutectic phases decomposed and dissolved into the α-Al matrix. As observed in figures 5 and 6, with an increasing cooling rate, the SDAS, width of the eutectic phase, and area fraction decrease. These fine eutectic phases at the grain boundary were more likely to decompose during homogenisation treatment, and the time required for complete homogenisation of the alloy decreased.

Figure 9. SEM images of samples with different cooling rates after homogenization. (a) (b) 1.65 K s−1, (c) (d) 5.70 K s−1, (e) (f) 117.3 K s−1.
Download figure:
Standard image High-resolution imageUsing Al−4.5 wt% Cu alloy as an example, during the ageing kinetics precipitation process, the precipitation sequence is known to be supersaturated solid solution (SSSS) → GPI → GPII → Al2Cu. GPI is a segregation region of Cu atoms in the {100} Al plane. These phases are coherent, semi-coherent, and non-coherent with Al matrix, respectively.
TEM images of Al–4.5 wt% Cu alloy with different cooling rates are presented in figure 10, and the results indicated that the cooling rate can significantly affect the densities and sizes of the precipitated phases. For a cooling rate of 1.65 K s−1 with the sand mould, the precipitate density was relatively low (see figure 10(a)). For the TRC, when the cooling rate was increased to 117.3 K s−1, the precipitate density significantly increased (see figure 10(e)). The results showed that a higher cooling rate increases the dislocation density in the matrix, that in turn provides more nucleation sites for the subsequent precipitation of precipitates.
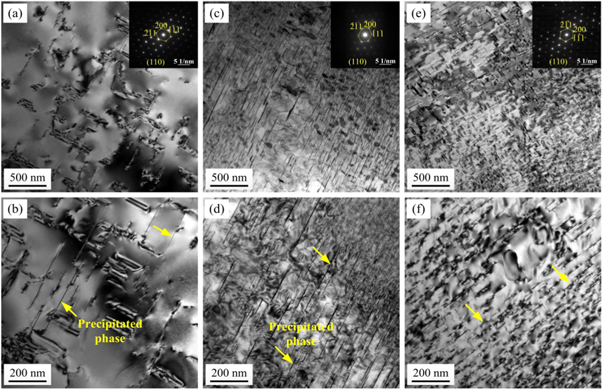
Figure 10. TEM images of Al−4.5 wt% Cu alloy solidified at different cooling rates after solution and aging treatment. (a) (b) 1.65 K s−1; (c) (d) 5.70 K s−1; (e) (f) 117.3 K s−1.
Download figure:
Standard image High-resolution imageThe number and lengths of precipitates increased with an increasing cooling rate, and the length distributions of precipitates at cooling rates of 1.65 to 117.3 K s−1 were also measured. The results in figure 11 show that the average length of the precipitates decrease from 259.18 μm to 94.68 μm upon increasing the cooling rate from 1.65 to 117.3 K s−1. Thus, it could be concluded that the higher cooling rate of TRC accelerates age-hardening and promotes the precipitation for the same ageing time. From the above analysis, a higher cooling rate not only improved the dislocation density in the matrix but also increased the number and densities of precipitates and decreased the average length of the precipitates.

Figure 11. Statistical results of the precipitate length with different cooling rate. (a) 1.65 K s−1; (b) 5.70 K s−1; (c) 117.3 K s−1.
Download figure:
Standard image High-resolution image3.4. Mechanical properties of T6-treated alloys
As demonstrated in figure 12, the age-hardening curves of the age-treated alloys at 200 °C for different times with different cooling rates were measured. In the early stage, the average hardness significantly increased with increasing ageing time. When the ageing time reached 16 h, the hardness reached the highest peak-aged hardness of 107.13 HV for the TRC alloys. After reaching the peak-aged point, the hardness began to gradually decrease with increasing ageing time. For the alloy prepared at a cooling rate of 117.3 K s−1 using TRC, the time to reach the peak hardness was 16 h. However, for the alloy prepared at a cooling rate of 1.65 K s−1 for sand mould casting, the time to reach the peak hardness was 20 h. The results indicated that a higher cooling rate promoted the age-hardening behaviour of the alloy and reduced the ageing time to reach the peak hardness.
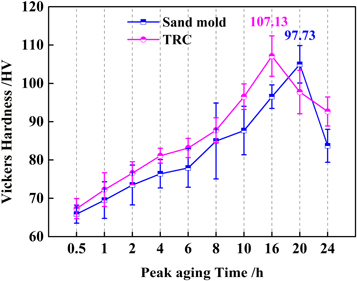
Figure 12. The Vickers hardness of alloys aged at 200 °C for different times with the cooling rates of 1.65 K s−1 and 117.3 K s−1.
Download figure:
Standard image High-resolution imageTo better understand the effect of cooling rate on the mechanical properties, the T6-treated alloys were investigated, and the results are presented in figure 13. When the cooling rate is increased from 1.65 to 117.3 K s−1, the strength, elongation, and area fraction of the T6-treated alloys increase rapidly from 109.64 MPa, 263.18 MPa, and 9.98% to 145.33 MPa, 321.79 MPa, and 11.65%, respectively. The mechanism consisted of two parts: (1) Higher cooling results in smaller grains and higher dislocation density. When plastic deformation occurs, more dislocations can move in more grains. Moreover, the plastic deformation becomes more uniform, simultaneously resulting in higher strength and elongation. (2) The area fraction of eutectic phases and the size of intermetallic compounds decrease with an increasing cooling rate, and the distribution becomes more uniform, which correspondingly increases the elongation.

Figure 13. The strength and elongation of Al−4.5 wt% Cu alloys with different cooling rates. (a) Stress-strain curve; (b) Strength and elongation.
Download figure:
Standard image High-resolution image4. Discussion
4.1. Effect of the cooling rate on the as-cast microstructure
The growth morphologies and characteristic sizes of dendrites are determined by thermal diffusion, solute diffusion, interfacial energy, liquid convection, and interfacial atomic dynamics during solidification. After the alloy composition is given, the composition can be controlled by modifying the control parameters of solidification. The growth rate and temperature gradient are the control parameters for the directional solidification characteristic size, and the cooling rate and undercooling degree are the control parameters for free dendrites. For cast rolling, sub-rapid solidification is achieved by dynamic quenching. When the alloy composition is constant, the main factor affecting the SDAS is the cooling rate.
In reference [26], the following relationship between the SDAS and solidification time and cooling rate was determined:

Image-pro software was used to measure the SDAS at different positions of the samples for different cooling rates, and the average values of 10 groups of data were calculated. The measured data are presented in table 1.
Table 1. Secondary dendrite arm spacing of samples with different cooling rates.
| Conditions | Average SDAS λ2(μm) | Surface λ2(μm) | 1/4 λ2(μm) | Central λ2(μm) | Cooling rate T(K s−1) |
|---|---|---|---|---|---|
| Sand mold | 53.4 | 49.5 | 50.6 | 60.1 | 1.65 |
| Copper mold | 26.3 | 22.4 | 25.3 | 31.2 | 5.70 |
| TRC | 7.33 | 4.7 | 6.0 | 11.3 | 117.3 |
A theoretical model for the relationship between the SDAS and cooling rate was established using the data in table 1. The undetermined coefficients in the calculation formula of simultaneous equations were used, with values of 71.04 and −0.57, respectively. The modified model of the relationship between the SDAS and cooling rate was as follows:

As observed in equation (1), the theoretical index is −1/3. Because of the differences in the alloy composition system and cooling rate test method, this index will have certain differences. In this study, the experimental index is −0.57, as shown in equation (2). From the growth analysis of the secondary dendrite arm, the SDAS will be greatly increased with an increasing cooling rate.
The final solidification region of the alloy is the triangular grain-boundary region and the inter-dendritic region, where the intermetallic compounds are formed. With an increasing cooling rate, the primary dendrite α-Al grains shrink, the number of grain boundaries increases, and the SDAS decreases significantly. These indicate a smaller size, narrower width, and more uniform distribution of the inter-crystalline eutectic phases when compared to those of the initial case. The shorter dendrite arm spacing reduced the holding time for the subsequent heat treatment, resulting in a more fully dissolved eutectic phase and improved the overall mechanical properties of the alloy sheet.
4.2. Mechanism of cooling rate on mechanical properties
From the tensile test results in figure 13, as the cooling rate increases from 1.65 to 117.3 K s−1, the yield strength and elongation increase from 109.64 to 145.33 MPa and 9.98% to 11.65%, respectively. The strengthening mechanism involves a combination of grain-boundary, solid-solution, and precipitation strengthening. From the results in figures 3, 8, and 10, increasing the cooling rate leads to grain refinement, an increase in the supersaturated solid solution degree of solute elements, and a clear enhancement of the age-hardening kinetics. The results indicate that under the multiple effects of these mechanisms, the strength as well as plasticity and toughness of the material can be improved. Therefore, the yield strength of the material can be expressed as follows [13, 27]:

Here, σy is the yield strength measured from the tensile test, σ0 is the friction stress during the experiment, which is approximately 5.5 MPa [28, 29]; Δσ gb is the yield strength increase obtained by grain-boundary strengthening, Δσ ss is the yield strength increase obtained by solid-solution strengthening from the solutes of Cu; Δσ pr is the yield strength increase obtained by precipitation strengthening; ky is the Hall–Petch coefficient and the values are as described in Ref. [30]; d is the average diameter of the grains, as shown in figure 3, M is the mean orientation factor, G is the shear modulus, b is the magnitude of the Burgers vector, ε is the lattice strain, and c is the concentration.
Figure 14 presents a schematic illustration of the solid phase transformations at different cooling rates. With an increasing cooling rate, the grain size decreases and the number of grain boundaries increases, which increases the resistance to dislocation movement (see figure 14(a)); the number and width of the eutectic phase at the grain boundary decrease; and the initial network distribution of the eutectic phase disperses into a point-like and discontinuously distributed eutectic phase. The decrease in the amount of the eutectic phase indicates that more solute elements are solids dissolved into the matrix (see figure 14(b)). In addition, with increasing the solute content in the matrix, the driving force for the second-phase precipitation increases. For smaller precipitates, the distribution is more uniform (see figure 14(c)). The coupling effect of these mechanisms leads to an improvement in the strength and hardness of the alloy sheet, and plastic deformation to be more uniform.
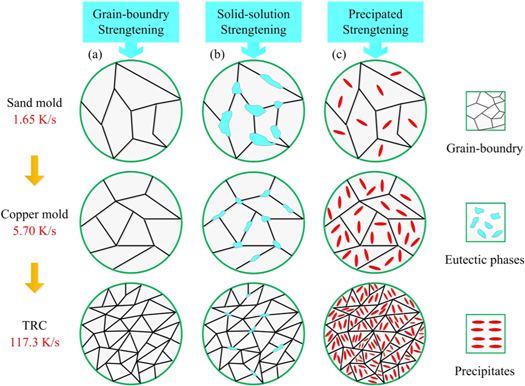
Figure 14. Schematic illustration of solid phase transformation during different cooling rates. (a) Grain-boundary strengthening; (b) Solid-solution strengthening; (c) Precipitate strengthening.
Download figure:
Standard image High-resolution image4.3. Effect of cooling rate on the super-saturation
From the above discussion, it is apparent that the cooling rate affects the age-hardening behaviour, and that different mechanical properties can be obtained after heat treatment. This mechanism can be explained by the effect of the cooling rate on the super-saturation of solute elements in the matrix. The results in figure 6(b) show that the cooling rate has a direct effect on the SDAS; a faster cooling rate result in a shorter SDAS. As observed in figures 9(b) and (f), after the same homogenisation treatment, the decomposition degree of the eutectic phase and super-saturation of solute elements are different. To clarify the relationship between super-saturation and SDAS, the dissolution time of the Al2Cu eutectic phases is calculated using the following formula [31]:

Here, T, Q, L, D0, and R denote the homogenisation temperature, activation energy of diffusion, dendritic spacing, a constant, and the gas constant, respectively. By substituting Q (Cu) = 136.8 kJ mol−1, D0 (Cu) = 0.084 cm2 s−1, and R = 8.31 J/(mol K) into Eq. (4), the relationship between the dendritic spacing and homogenisation time curves of the Al–Cu alloy is obtained.
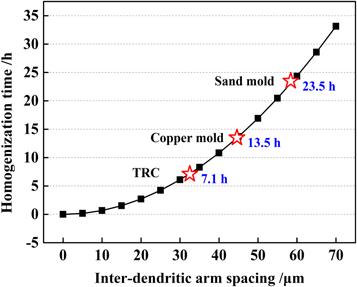
The calculated results are presented in figure 15. The homogenisation time rapidly increases with increasing dendritic spacing. For example, for a dendritic spacing of 32.5 μm at a cooling rate of 117.3 K s−1, the complete homogenisation time of the alloy sheet is 500 °C × 7.1 h. Upon increasing the dendrite spacing to 58.4 μm at a cooling rate of 1.65 K s−1, the homogenisation time increases to 23.5 h. Under such conditions, some large eutectic phases are only partially dissolved after homogenisation treatment and some eutectic phases remain at the grain boundaries, as shown in figure 9(b). Therefore, it can be reasonably assumed that after homogenisation treatment, the super-saturation of the matrix at a cooling rate of 1.65 K s−1 is significantly lower than that at a cooling rate of 117.3 K s−1. This assumption is also consistent with the as-cast alloy line-scanning results in figure 8.
Figure 15. Relationship between inter-dendritic arm spacing and homogenization time at different cooling rates.
Download figure:
Standard image High-resolution image
According to the conclusions of previous studies and the above analysis of this paper, we can see that the cooling rate has a significant effect on the microstructures and mechanical properties of different metals or alloys. Higher cooling rates result in the formation of finer grains [32], the thinning of intermetallic phase of β-Mg17Al12 at the grain boundaries [33], the increase in dislocation density [34], and uniform distribution of second-phase particles [35]. Additionally, rapid cooling can significantly reduce the SDAS in the as-cast microstructure. After solution treatment, the smaller eutectic phase of the alloy with smaller dendrite spacing can be rapidly decomposed to realise the accelerated dissolution of solute elements. Therefore, the precipitation behaviour will be promoted and more complete, resulting in improved strength, hardness, and other mechanical properties.
5. Conclusion
In the present work, a systematic study of Al–4.5 wt% Cu cast alloys was completed and the effect of the cooling rate on the microstructure and mechanical properties of the alloys after casting and heat treatment was investigated. The relationship between the microstructural evolution and performance improvement was studied, and the mechanisms of grain refinement and super-saturation of solute elements were discussed. The main conclusions are as follows:
- (1)Upon increasing the cooling rate from 1.65 to 117.3 K s−1, the microstructure was clearly refined. The average grain size, SDAS, and area fraction decreased from 309.5 to 148.6 μm, 53.4 to 7.33 μm, and 4.4% to 1.8%, respectively.
- (2)Upon increasing the cooling rate, the amount of eutectic phase at the grain boundary was clearly reduced, indicating that more solute elements were dissolved into the α-Al matrix, and the peak strength of Cu in the α-Al matrix increased by a factor of nearly three, from 334.87 at 1.65 K s−1 to 1000.8 at 117.3 K s−1.
- (3)With an increasing cooling rate, the homogenisation time was shortened from 23.5 h at 1.65 K s−1 to 7.1 h at 117.3 K s−1, and the coarse eutectic phases formed at a lower cooling rate remained after homogenisation. After ageing precipitation, the density of the precipitated phase increased, and the precipitate size became finer and more uniform than that of the precipitate before ageing precipitation.
- (4)An increase in the cooling rate was helpful for improving the mechanical properties of T6-treated alloys. With an increasing cooling rate, the time required for the alloy to reach peak hardness was reduced from 20 h at 1.65 K s−1 to 16 h at 117.3 K s−1. In addition, the strengths increased from 109.64 MPa and 263.18 MPa to 145.33 MPa and 321.79 MPa, respectively. Moreover, the elongation increased from 9.98% to 11.65%.
Acknowledgments
This study was supported by the National Nature Science Foundation of China (Grant No.51790485).