
Abstract
Reactive oxygen species (ROS) supplied into liquids by plasma irradiation must be identified and controlled for the safe and effective use of plasmas in biomedical applications. This study aims to obtain information on the key ROS regarding ROS transportation through a liquid layer for realization of spatial ROS identification. Two-dimensional distributions of ROS after passing through liquids with and without ROS scavengers were visualized and compared to assess the suppression effects of each scavenger using a measurement system combined with a gel ROS detector. The plasma was generated under helium and 1% oxygen mixture gases. It was experimentally confirmed that a hydroxyl radical is not a key species, whereas, superoxide anion radicals and hydrogen peroxide play a key role for ROS transportation in our system. The results also suggested that the chemical processes for ROS transportation change at a liquid layer thickness of less than 1 mm.
Export citation and abstract BibTeX RIS
1. Introduction
Nonthermal plasma-jets have been actively studied and developed for biomedical applications.1–9) Plasma-induced biomedical effects markedly depend on reactive oxygen species (ROS) supplied in liquids by plasma-jet irradiation because biomedical tissues are usually covered by a liquid layer.10–15) Plasma-jet irradiation sometimes inflicts damage upon normal tissues and DNA if a ROS is indefinitely supplied to biomedical tissues.5,16,17) Therefore, a ROS supply to a liquid has to be precisely controlled for the safe and effective use of plasma technologies. ROS supply control through a liquid layer by nonthermal plasma-jet irradiation is important for development of biomedical applications. However, a detailed understanding of the mechanisms of ROS supply control is currently unavailable.
There have been many reports on the average density measurement of ROS in plasma-irradiated liquids by a variety of methods such as electron spin resonance (ESR) for hydroxyl radicals (·OH), singlet oxygen (1O2), and superoxide anion radicals ( );18–20) UV–vis spectroscopy for hydrogen peroxide (H2O2), nitrate (NO3−), and nitrite (NO2−);21) liquid chromatography for NO3− and NO2−;22) terephthalate dosimetry for ·OH;23–26) and various reagents including fluorescence dyes for H2O2 and other species.1,5,8,27,28) Simulations have also been actively performed to study the chemical processes in ROS transportation from a gas to a liquid through their boundaries.1,15,29) However, although there are many successful studies on their quantitative specifications, there have been few studies on spatial concentration distributions of ROS supplied in liquids. Understanding ROS transportation in the liquid depth direction is considered to be one of the most important issues in this research field. Spatiotemporal identification in a liquid for each ROS must be clear for the further development of plasma technologies.
We have used a KI–starch gel reagent that induces color reactions with several ROS as the plasma-generated ROS detection method. The gel reagent allows a two-dimensional (2D) ROS concentration distribution to be easily visualized even in a liquid. The 2D distributions of the ROS after passing through water30–32) and a tissue model33–35) have already been reported under various experimental conditions. However, it is difficult to identify the ROS detected by the proposed method because all of them induce the same color reactions. If a detected ROS can be specified using the gel reagent, spatiotemporal ROS identification in a plasma-irradiated liquid will be close to reality. He et al. have reported the spatiotemporal identification of ozone (O3), NO2−, and hydrogen ions (H+) on various gel reagents directly irradiated with plasma in a gas phase.36) There have been no reports on spatiotemporal ROS identification in liquids.
In the present study, we studied the effects of scavengers added in liquids on ROS transportation as the first step toward the realization of spatiotemporal ROS identification. A scavenger can reduce a target ROS depending on the type of scavenger. Therefore, 2D ROS distribution in liquids can be visualized in the absence of chemical reactions relating to the target ROS. Mannitol, disodium terephthalate (NaTA), 5-(2,2-dimethyl-1,3-propoxy cyclophosphoryl)-5-methyl-1-pyrroline N-oxide (CYPMPO), and catalase were selected as the scavengers for ·OH,  and H2O2. 2D distributions of the ROS transported through a liquid layer with and without the scavengers were visualized and compared to assess the suppression effect of each scavenger. The results indirectly indicate a key ROS for the ROS transportation in liquids.
2. Experimental methods
Figure 1 shows a schematic of the plasma-jet generator and target equipped with the KI–starch gel reagent which is described in detail later. The plasma-jet generator was made of a Pyrex glass tube with wrapped powered and grounded electrodes (width 13 mm) that were separated by 20 mm on the tube. The outer and inner diameters of the glass tube were 8 mm and 2.5 mm, respectively. A powered electrode was located 10 mm from the open end of the glass tube. The O2(1%)/He mixture gas, with 99.995% purity of He gas, was supplied into the glass tube at a flow rate of 1 l min−1. This is because the oxidation reactions induced by the ROS transported in liquid cannot be clearly detected without adding O2 to the supplied gas.30) The O2/He plasma-jet was generated at a sinusoidal high voltage of 20 kVp−p (3 kHz) using a function generator (Iwatsu, SG-4105) and an amplifier (Trek, 20/20 C). The target was irradiated with the plasma-jet at a distance of 10 mm for 5 min. In this case, the plasma-jet fully reached the target surface.
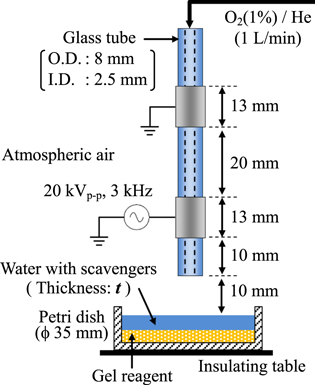
Fig. 1. (Color online) Schematic of the experimental setup consisting of the plasma-jet generator and two-layered target.
Download figure:
Standard image High-resolution imageThe target in a ϕ 35 mm Petri dish had a two-layered structure: an upper layer of distilled water (with and without scavengers) and a lower layer of KI–starch gel reagent. The KI–starch gel reagent was used for a ROS detector. It was prepared prior to being used to serve as the target of the plasma jet. The gel reagent contains 0.3% potassium iodide (KI), 0.5% starch, and 0.5% agarose. It was gelled by adding agarose to fix the color reactions. The color reactions are as follows. Iodine ion (I−) is first oxidized to molecular iodine (I2) by ROS, and I2 reacts with excess I− to form triiodide (I3−). I3− then forms complexes with starch, resulting in the color change from transparent to purple. Because the oxidation potential of I2 is approximately 0.54 V, it can detect several ROS with oxidation potentials >0.54 V. OH (oxidation potential 2.80 V), O (2.42 V), O3 (2.07 V), H2O2 (1.78 V), and hydroperoxyl radical (1.70 V) can be detected by this reagent. Therefore, the two-layered target enabled the visualization of the 2D ROS distribution pattern after passing through the liquid layer. The liquid layer thickness t was varied from 1 to 10 mm. It was confirmed that a dent, which may affect the liquid layer thickness, formed on the liquid surface by gas exposure and plasma irradiation is negligibly small for a gas flow rate of 1 l min−1. Distilled water with or without scavengers was used as the liquid layer in this study. The suppression effects of scavengers on 2D ROS distribution in the liquids were assessed in comparison with cases without scavengers. Four types of scavengers often used in investigating plasma−liquid interactions: mannitol (Wako), NaTA (Wako), CYPMPO (RR-102-B, PRINC), and catalase (from bovine liver, Wako) were selected.23–26,37–45) Mannitol and NaTA at concentrations of 1 and 10 mM were used as scavengers of ·OH. CYPMPO at concentrations from 1 to 50 mM was used as a scavenger for ·OH and  Catalase at concentrations from 0.01 to 0.1 mM was used as a scavenger for H2O2. Other scavengers like L-histidine (a scavenger of 1O2) and superoxide dismutase (a scavenger of
  ), which are also often used in other reports, were tried in this study. However, it was confirmed in the preliminary experiments that these scavenger solutions cause a loss in the function of chemical reactions of the KI–starch gel reagent.
Figure 2 shows the typical experimental procedures. The gel reagent and the scavenger solutions (or distilled water) were prepared separately, and the solutions were supplied on the gel reagent in a Petri dish. The solution surface was irradiated with the plasma-jet for 5 min under open air conditions. After plasma irradiation, the solutions were immediately removed. The 2D ROS distribution patterns visualized on the gel reagent were recorded from above by a digital camera. Finally, the relative ROS concentration profiles were obtained using the absorbance measurement of the visualized 2D ROS distribution patterns; the apparatus and procedure for which are described in detail elsewhere.30–32) All experiments were carried out more than three times to confirm their reproducibility.
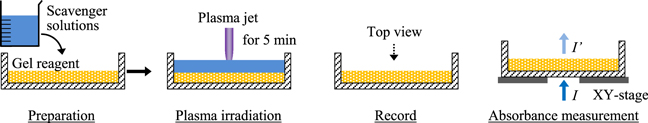
Fig. 2. (Color online) Experimental procedures from preparation to absorbance measurement.
Download figure:
Standard image High-resolution image3. Results and discussion
3.1. Effects of the ·OH scavengers
·OH is well known to be one of the important ROS for plasma–liquid interactions. Therefore, ROS transportation in the solutions with the ·OH scavengers of mannitol and NaTA were compared to that of distilled water at t = 1–8 mm range, as shown in Fig. 3. Figures 3(a-1)–3(a-4) show the visualized 2D ROS distributions in distilled water without any scavengers. Figures 3(b) and 3(c) show the results of the mannitol solutions at concentrations of 1 and 10 mM, respectively. The 2D distributions observed after passing through the mannitol solutions at both concentrations were visually similar to that of the distilled water. To confirm these results, Figs. 3(d) and 3(e) show the results of NaTA solutions at concentrations of 1 and 10 mM, respectively. Similarly, the suppression effects induced by the NaTA solutions were not clear. To clearly evaluate the intensity of the color reactions, the absorbance proportional to the concentration was measured. Unfortunately, it was difficult to accurately discuss the relative ROS concentration profiles because the color reactions were distributed in a non-uniform manner. Therefore, in the present study, the maximum absorbance at a certain point was scanned and evaluated by using an XY stage with the colored reagent in a Petri dish placed onto the XY stage. Figures 4(a) and 4(b) show the maximum absorbance as a function of t for the mannitol and NaTA solutions, respectively. The results for the distilled water were also indicated together to assess the suppression effects. These results show that ROS transportation did not depend on the ·OH scavengers. The concentrations for each scavenger in the present study are considered to be sufficient for our purpose.24,26,39) Based on these results, it was established that ·OH is not the key species that induce the oxidation reactions detected in the liquid with the KI–starch gel reagent. However, ·OH was detected in a liquid with an ESR and chemical dosimetry.20,24) Moreover, it has been experimentally confirmed that the ·OH transportation in 1 mm-thick liquid irradiated with a similar plasma-jet is suppressed with the mannitol solutions.43) It has also been reported that the concentration of ·OH detected in a liquid is in the order of μM.1,46–48) For this study, it was observed that a small amount of ·OH might be supplied and scavenged in the liquid at the experimental conditions, but the KI–starch gel reagent would not detect the suppression effect due to the detection limit. Hence, it can be concluded that ·OH does not play a key role for the 2D ROS distribution obtained in our system.

Fig. 3. (Color online) Visualized 2D ROS distributions after passing through the water layer (a), mannitol solutions [(b) 1 mM and (c) 10 mM], and NaTA solutions [(d) 1 mM and (e) 10 mM]. The liquid layer thickness t was varied from 1 to 8 mm.
Download figure:
Standard image High-resolution image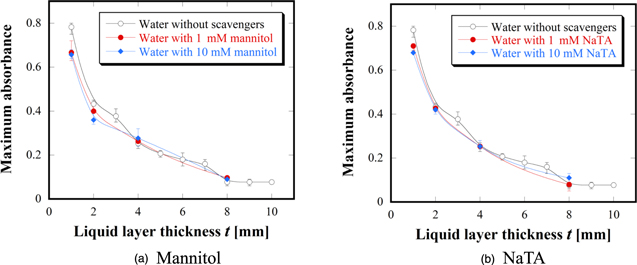
Fig. 4. (Color online) Maximum absorbance as a function of the liquid layer thickness t for (a) mannitol and (b) NaTA solutions together with water.
Download figure:
Standard image High-resolution image3.2. Effects of the ·OH and O2− · scavenger
Figures 5(a) and 5(b) show the visualized 2D ROS distributions after passing through the CYPMPO solutions (t = 1–8 mm) at concentrations of 1 and 10 mM, respectively. The color reactions were clearly suppressed in comparison with Figs. 3(a-1)–3(a-4) for the distilled water. CYPMPO acts as the scavengers for ·OH and  As discussed in Figs. 3 and 4, the 2D ROS distributions were not changed even when ·OH was scavenged with mannitol and NaTA. Therefore, the suppression effect on the color reactions was considered to be due to
  This suggests that
  is one of the key species for the 2D ROS distribution obtained in our system. Figure 6 shows the maximum absorbance obtained from Figs. 5(a) and 5(b) as a function of t together with the results of the distilled water. The results clearly indicate the relationship between the suppression of the color reactions and t. For 1 mM CYPMPO, the ROS could be slightly detected even at t = 8 mm although the ROS transportations were suppressed with increasing t. On the other hand, for 10 mM CYPMPO, almost all oxidation reactions could not be detected when t was more than 2 mm. The decreasing trends with t seemed to be similar in cases with and without CYPMPO. Here, we focused on the change between t = 1 and 2 mm. The change in this range was large in comparison with that of other ranges. This result corresponds to our previous results.30) To consider the change between t = 1 and 2 mm, the suppression effects of the CYPMPO concentration on ROS transportation at t = 1 mm was studied. Figures 7(a)–7(f) show the visualized 2D ROS distributions after passing through the CYPMPO solutions at concentrations from 0 to 50 mM. Figures 7(a)–7(c) were indicated again for comparison, although they were already shown in Figs. 3 and 5. The increase in CYPMPO concentration clearly suppressed the color reaction without changing the distribution patterns. The corresponding maximum absorbances as a function of the CYPMPO concentration were shown in Fig. 8. In this figure, 0 mM on the horizontal axis means the case for distilled water without CYPMPO. The maximum absorbance became constant above 30 mM. This means that the scavenger CYPMPO cannot fully suppress ROS transportation at t = 1 mm. Considering that ROS transportation was almost suppressed when t is greater than 2 mm, the ROS that cannot be scavenged with CYPMPO is considered to reach the gel reagent through the solutions when t is less than 1 mm at least. Based on these results, the chemical processes having an impact on ROS transportation in the liquid depth direction are inferred to remarkably change at t = 1 mm under the experimental conditions. Simulation results have also reported that most reactive species such as ·OH, atomic oxygen, 1O2, and ozone disappear at a liquid thickness of less than 1 mm.1) Hence, it was concluded from the measured result that
  plays a key role for ROS transportation, and some reactive species unrelated to
  also play a key role when the liquid layer thickness is less than 1 mm.
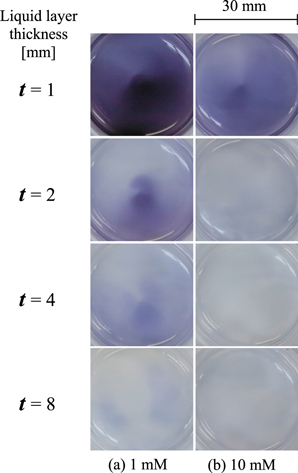
Fig. 5. (Color online) Visualized 2D ROS distributions after passing through the CYPMPO solutions at the concentrations of (a) 1 mM and (b) 10 mM. The liquid layer thickness t was varied from 1 to 8 mm.
Download figure:
Standard image High-resolution image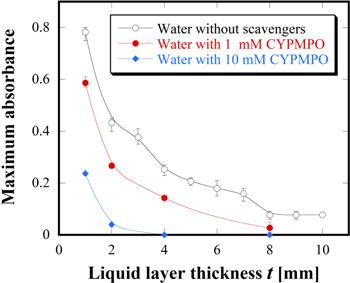
Fig. 6. (Color online) Maximum absorbance as a function of the liquid layer thickness t for the 1 and 10 mM CYPMPO solutions together with water.
Download figure:
Standard image High-resolution image
Fig. 7. (Color online) Visualized 2D ROS distributions after passing through the 1 mm thick CYPMPO solution at the concentrations from (a) 0 to (f) 50 mM.
Download figure:
Standard image High-resolution image
Fig. 8. (Color online) Maximum absorbance as a function of the CYPMPO concentration at the liquid thickness t of 1 mm.
Download figure:
Standard image High-resolution image3.3. Effects of the H2O2 scavenger
H2O2 is also well known to be one of the important species for biomedical effects. Therefore, the suppression effects of the H2O2 scavenger catalase on ROS transportation in the liquid depth direction were studied. Figures 9(a)–9(e) show the visualized 2D ROS distributions after passing through the catalase solutions (t = 1–8 mm) at concentrations of 0.01 and 0.1 mM, respectively. The 2D ROS distributions without catalase are shown in Figs. 3(a-1)–3(a-4). The color reactions were clearly suppressed with increasing t and catalase concentration. Here, it should be note that the ROS distribution patterns were also affected by the catalase addition. Especially, the influence on the distribution patterns could be clearly observed when t was more than 4 mm. For instance, the ROS reached the gel reagent in the ring-shaped pattern in cases without catalase, as shown in Figs. 3(a-3) and 3(a-4). On the other hand, when catalase was added, the ROS was transported in a radial-shaped pattern as the center just under the contact point between the plasma jet and liquid surface. These results are considered to indirectly give important insight about the spatiotemporal distributions of ROS unrelated to the chemical reactions accompanied by H2O2 suppression. However, we have reported that the ROS distribution patterns in liquid strongly depend on liquid flows induced by plasma irradiation.30–32) In addition, plasma-induced liquid flows also depend on liquid characteristics such as conductivity.49) The conductivities of the catalase solutions at concentrations from 0.01 to 0.1 mM changed from 450 to 4200 μS cm−1, respectively. Plasma-induced liquid flow in the catalase solutions might change when the catalase is added. Moreover, the chemical reactions involving the catalase should be carefully taken into account because they cannot be ignored as described later. Therefore, ROS distribution patterns were not discussed in the present study and they are one of the significant subjects that need further investigations. Figure 10 shows the maximum absorbances obtained from the color reactions in Fig. 9 as a function of the catalase concentration for t form 1 to 8 mm. In this figure, 0 mM on the horizontal axis means the case of the distilled water without catalase. The maximum absorbances increased in comparison with 0 mM for all t when the catalase concentration was 0.01 mM. For catalase concentrations more than 0.03 mM, the maximum absorbance decreased with increasing catalase concentration. Other mechanisms different from the simple suppression effects using catalase were considered: for instance, ROS supply centralization to the position just under the plasma irradiation. However, this idea was considered to be wrong because the color reaction can be observed on the entire surface, especially for the results for t = 1 mm and 0.01 mM catalase. On the other hand, it has been reported that the catalase, which is a protein, is inactivated by ·OH, 1O2,  50–52) It has been experimentally confirmed that plasma irradiation causes a change in the structure of proteins.12) Ultrasonic cavitation that generates reactive species such as ·OH in liquid also seems to inactivate catalase.53,54) Based on these reports, it is reasonable to consider that the increase in the maximum absorbance at lower catalase concentrations was due to the chemical reactions between catalase and plasma-supplied species. These unexpected chemical reactions are considered to enhance the oxidation reactions in the liquid. The suppression effects due to H2O2 scavenger catalase may occur in the catalase solutions simultaneously. Therefore, the suppression effects become dominant when the catalase concentration is increased, reaching almost 0 around 0.05–0.09 mM depending on t. It can be concluded from the results that H2O2 scavenger catalase fully suppressed the oxidation reactions even in 1 mm-thick liquid layer although the catalase inactivation was considered to disturb our discussion. Hence, H2O2 plays a key role in ROS transportation.
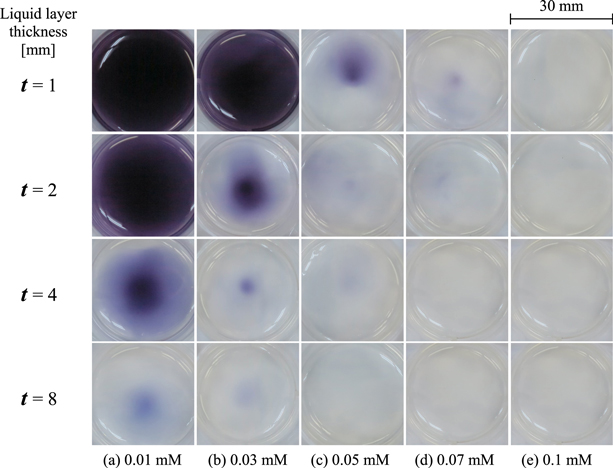
Fig. 9. (Color online) Visualized 2D ROS distributions after passing through the catalase solutions at the concentrations from (a) 0.01 to (f) 0.1 mM. The liquid layer thickness t was varied from 1 to 8 mm.
Download figure:
Standard image High-resolution image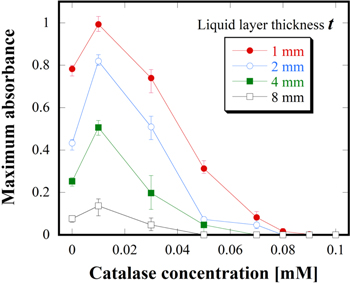
Fig. 10. (Color online) Maximum absorbance as a function of the catalase concentration for the liquid layer thicknesses from 1 to 8 mm.
Download figure:
Standard image High-resolution image
Overall, the experimental results indicate that  and H2O2 play important roles for ROS transportation in the liquid depth direction. It was also determined that other reactive species also play a key role at a liquid layer less than 1 mm. As a next step, the suppression effects of other scavengers on ROS transportation using the gel reagent would be further studied. In addition, quantitative discussion to realize the spatiotemporal identification of ROS transported in liquid by plasma irradiations must be performed.
4. Conclusions
The ROS supplied to a liquid by plasma–liquid interactions have to be identified and controlled for the safe and effective use of plasma technology in biomedical applications. There have been few experimental reports on 2D ROS identification in the liquid depth direction. In the present study, key species for ROS transportation from the viewpoint of 2D ROS distribution using the KI–starch gel reagent combined with the scavenger solutions were studied. In the experiments using the mannitol and NaTA solutions, it was concluded that ·OH does not play a key role for the 2D ROS distribution obtained in our system. On the other hand,  and H2O2 are considered to be the key species from the experiments using CYPMPO and catalase solutions. In addition, our results suggest that other reactive species generated in the chemical reactions unrelated to
  can be considered to also play a key role when the liquid layer thickness is less than 1 mm.
Acknowledgments
This work was partly supported by JSPS KAKENHI Grant Numbers JP25820113 and JP17K05100.