Summer Regional Pentad Heat Wave in Eastern China and Their Possible Causes
 Jingxin Yao
  Xuguang Sun
 Jianping Tang
 Yaqin Ji
- CMA-NJU Joint Laboratory for Climate Prediction Studies, School of Atmospheric Sciences, Nanjing University, Nanjing, China
Identification and understanding of persistent regional heat wave are essential for adaption and alleviation of its severe effects on human health and ecological environment, particularly under the situation of rapid global warming. Based on Climate Prediction Center global daily maximum temperature from 1979 to 2019, considering extreme, persistence and regionality of heat wave, summer regional pentad heat wave (RPHW) is defined by summer daily maximum temperature above 35°C with no less than 3 days in a pentad, which is also required to cover more than 2% grids over the eastern China. It breaks down the continuity constraints in both time and space in previous regional heat wave definitions that mainly indicate the synoptic phenomena. Besides, our RPHW is much useful in examining climatic features of regional heat wave, since it filters out the weather noises to some extend in terms of a pentad window. Three categories of RPHW are identified by K-means cluster analysis over the eastern China, i.e., North-Central China (NCC), Central China (CC), and South China (SC). Generally, intensity and area of RPHW are positively proportional to each other, and more RPHW appears in SC but with weaker intensity, whereas less RPHW locates in NCC and CC with stronger intensity. While RPHW in CC and SC mostly appears in middle-late summer, RPHW in NCC mainly occurs in early-middle summer which is transferred from the middle-late summer before the late 1990s. Most RPHW persists for one pentad and occasionally for five or six pentads at most. And both frequency and accumulated days of RPHW have been significantly increased since the late 1990s, particularly in CC and SC. Significant high-pressure anomalies are accompanied with the RPHW in China, which favor more incoming net solar radiation, increasing surface soil temperature, and more upward surface longwave radiation and sensible heat flux as well, eventually forming the RPHW. Specifically, the RPHW in NCC and SC are mainly caused by diabatic heating from the land surface and adiabatic heating due to the anomalous subsidence movement, respectively; however, both the diabatic heating and the adiabatic heating are responsible for the RPHW in CC.
Introduction
Heat wave (HW) is a common phenomenon in summer, manifested as continuous high temperature, which has a great impact on people’s production and life, and is likely to cause people’s physical discomfort (Hoffmann et al., 2008), and also has an impact on social economy (Cadot and Spira, 2006). HW has been very serious in the end of the 20th century, but in the future, no matter in the intensity, frequency or duration of event, HW will increase significantly (IPCC, 2013). HW disaster has become one of the hot topics of natural disaster research (Qin, 2014). Therefore, studying the distribution characteristics of HW and exploring the mechanism behind its occurrence are very important to scientific understand and reasonable prevent it.
At present, there is no uniform criterion for judging HW, and the HW definition can be either absolute or relative (Robinson, 2001). National standards for HW are also inconsistent. For instance, it requires that the daily maximum temperature (Tmax) is above 32.2°C and lasts for more than 3 days in the United States (Tamrazian et al., 2008), the daily maximum temperature is above 25°C and lasts for more than 5 days with three of these above 30°C in the Europe, and the daily maximum temperature is above 35°C and lasts for more than 3 days in China. The World Meteorological Organization (WMO) suggests a period of at least 5 consecutive days when the daily maximum temperature exceeds its climatology by 5°C. In addition, HW tends to show cluster characteristics in frequency, scope and degree of influence (Ren et al., 2012). While many studies on HW only focus on a certain point (station), which goes against their regional characteristics, this study will mainly investigate the regional HW.
HW can be characterized by its extreme high temperature (Im), accumulated high temperature intensity (Is), maximum impacted area (Am), accumulated impacted area (As), and an integrated index Z (Wang et al., 2017). The metrics generally used to evaluate HW are amplitude (HWA), number (HWN), duration (HWD) and frequency (HWF) (Fischer and Schär, 2010), and average HW magnitude (HWM) (Perkins and Alexander, 2013; Russo et al., 2014). The metrics can represent some aspects of the HW and effectively identify HW (Huang et al., 2011). These assessment indicators can give us a comprehensive understanding of HW in terms of their impact range, duration and intensity, so that we can compare the characteristics of HW in different regions and in different years. Nevertheless, there is still a lack of research on depicting the center of gravity of HW, which will be addressed to this study.
In recent years, there have been some achievements in the study of HW in China. From the perspective of HW spatial distribution characteristics, the frequency, duration and intensity of HW in China defined by relative threshold are basically consistent with each other, which mainly appear in Yangtze–Huaihe River basin, most regions in the south of the Yangtze River and eastern Sichuan Basin, among which the northwestern part of The Yangtze River and the northern part of Zhejiang province have the highest frequency, the longest duration days, and the regional variation characteristics are obvious (Ye et al., 2013). Studies have also shown that the HW defined by the absolute threshold of 35°C occurs more frequently in most regions of Zhejiang, Anhui and Jiangxi provinces in eastern and western China (Shi et al., 2009). In the past few decades, northern China has also experienced frequent heat waves, accompanied by severe drought and desertification in summer (Zhai et al., 1999). However, previous studies were basically based on administrative divisions to determine the scope and classification of HW, and to some extent, such classification of HW is kind of artificial and not rigorous enough. Rotated EOF is one of the objective methods to isolate regional HW in China (Wang et al., 2017), but it assumes the local pattern is symmetric about time. As another objective method, K-means cluster analysis has been successfully applied to group rainfall into different categories (Maxwell and Benjamin., 2020), and it could be more scientific and rigorous in HW clustering studies.
As for the temporal characteristics of HW, since 1990, most regions of China, especially Yangtze-Huaihe River basin and South China, have showed increased HW frequency, reflecting the rapid global warming since 1990 (You et al., 2017). It is found that the high temperature day starting earlier (later) in regions over China ends up relatively later (earlier), and the nationwide severe HW could last from early July to early September, but with great differences in frequency among each period of 10 days (Shen et al., 2018). If the HW is grouped into dry HW and wet HW in terms of relative humidity, the wet HW events are commonly distributed in the southeast of East Asian monsoon region and mostly occur in July and August, whereas the dry HW events are mainly located in northwestern China and North China mostly in June. Besides, the average duration of wet HW is longer than that of dry HW, while the average intensity of wet HW is weaker than that of dry HW (Ding and Ke, 2015).
Causes of HW are complicated, which may be attributed to the anomalous atmospheric circulations and surface boundary conditions. The adiabatic heating can be generated by the large-scale abnormal downdraft in the western Pacific subtropical high (WPSH) control zone, and it is the main reason for the HW formation (Xia and Xu, 2017). In particular, the stable and strong WPSH is directly responsible for the extreme HW in the middle and lower reaches of the Yangtze River in 2013 summer. And accordingly, the total amount of HW days in the middle and lower reaches of the Yangtze River are closely related to the zonal wind anomalies in mid- and high latitudes, sea surface temperature anomaly (SSTA) in the Indian Ocean and Pacific, and local dry soil conditions in spring and summer (Li et al., 2015). The decrease of soil moisture in North China and East China could result in reduction of latent heat flux and enhancement of sensible heat flux, so as to induce significant surface temperature increase over there (Wang and Zhang, 2015). Furthermore, the interannual and interdecadal HW modes in China are also due to the local high-pressure anomaly and dry soil conditions, which are closely associated with the anomalous convection activities over the tropical western Pacific (Wang et al., 2017). In addition, the atmospheric heat sources over Qinghai-Tibet Plateau in spring can be used as an early forecast factor for HW in the middle and lower reaches of Yangtze River (Luo et al., 2016).
Considering the extreme, persistence and regionality of HW, this study will define the regional pentad heat wave over China in summer at a large scale, and further analyze its climatological characteristics from the aspects of intensity, frequency, duration, area and location for three clustering regions by the K-means cluster analysis. Then, the corresponding formation mechanisms are further investigated from both dynamic and thermal sides. Only by clarifying the mechanism of HWs in different China regions, can we predict the HWs more accurately and alleviate their influences effectively.
Data, Definition And Methods
Data
Both daily maximum temperature and daily total of precipitation over eastern China (105–123°E, 20–43°N) are obtained from the NOAA Climate Prediction Center (CPC), and they are gridded at a 0.5 × 0.5 resolution (Fan and Van den Dool, 2008). It can capture the most common temporal and spatial characteristics in observed climatology and anomalies in the field of regional and global domains (Yang and Zhang, 2020). Other daily datasets used in this study are from National Centers for Environmental Prediction/National Center for Atmospheric Research (NCEP/NCAR) Reanalysis 1 (Kalnay et al., 1996), and the variables include geopotential height at 500 hPa, wind vector at 850 hPa, vertical velocity at 500 hPa are gridded at a 2.5 × 2.5 resolution, and the 2-m temperature, soil temperature, soil moisture, and surface radiations and fluxes including net shortwave radiation and upward longwave radiation, latent and sensible heat fluxes, are on T62 Gaussian grids. Wherein, upward surface heat fluxes are denoted as positive. All the variables are converted from daily to pentad before analysis, and their climatology and anomalies are calculated accordingly based on the period from 1979 to 2019. In this study, pentads in summer season (June, July and August, JJA) are employed for analysis.
Definitions and Indices of Heat Wave
Considering the definition of China Meteorological Administration, but different from the previous definition, which requires strict continuity in time and space, summer regional pentad heat wave (RPHW) is defined by summer daily Tmax above 35°C no less than 3 days in a pentad that covers more than 2% grids over the eastern China. Wherein, 35°C as the threshold of daily Tmax is used to indicate the extreme of RPHW, and to show the persistence, no less than 3 days with daily Tmax above 35°C in a pentad is required, which is not necessary to be consecutive. Such loose constrain on the continuity of high temperature days not only makes the definition easier, but also filters out the weather noise by examining the pentad status, which is suitable to investigate the HW from the perspective of climate. There are 26 grids for the demand of 2% land grids over the eastern China, which covers about 2.5 × 2.5 area in terms of CPC Tmax resolution and is appropriate to stand for the regional HW. Similarly, no requirement for the spatial continuity is also better to represent the large-scale regional characteristics of HW. Therefore, the definition for the RPHW in this study can reasonably reflect the extreme, persistence and regionality of HW.
According to the RPHW definition, there are 271 pentads of summer RPHW obtained over eastern China, which is 38.9% of the total 697 pentads during the summer from 1979 to 2019. The characteristics of RPHW are represented by frequency (HWF), cumulative temperature (HWCT), intensity (HWI), area (HWA), center of gravity (HWCG), duration pentad (HWP), and duration day (HWD), which are defined and calculated by the formula listed in Table1.
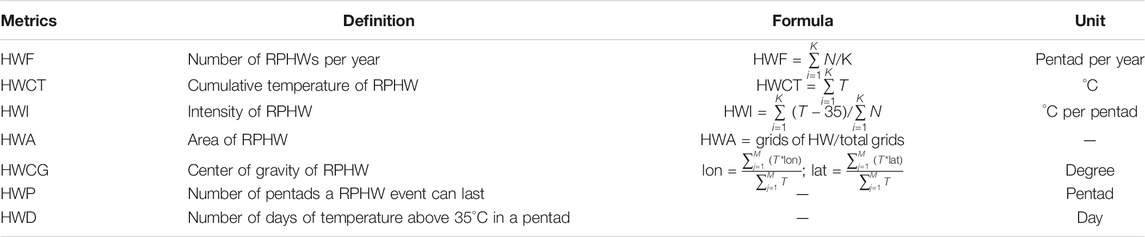
TABLE 1. Details for RPHW.
Methods
K-means cluster analysis is a centroid-based cluster method, and it can efficiently group objects into several clusters, within which objects have great similarity and cluster sum of squares is minimized (Hartigan and Wong, 1979). By applying K-means cluster analysis to the above 271 RPHWs, three clusters centered in the Central China (CC) (106–122°E, 26–34°N), Northern-Central China (NCC) (108–118°E, 30–40°N) and Southern China (SC) (108–122°E, 23–31°N) are identified over eastern China (Figure 1). To ensure the selected RPHWs mainly residing in the three cluster regions, those with their HWCGs outside the corresponding regions are removed from the three specific clusters. Therefore, 234 RPHWs remain for further study, out of which, there are 55 RPHWs in CC (Table A1), 68 RPHWs in NCC (Table A2), and 111 RPHWs in SC (Table A3), respectively.
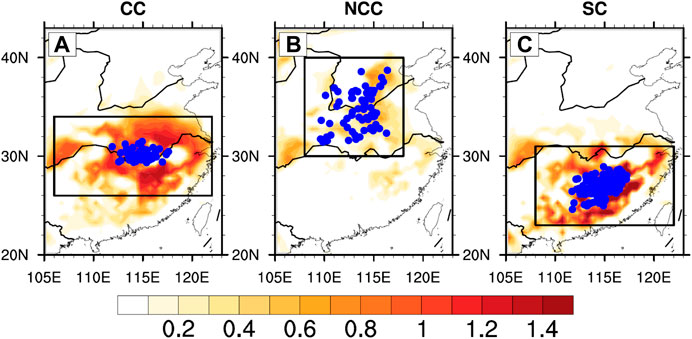
FIGURE 1. Spatial distributions of HWF (shaded, unit: pentad per year) and HWCG (blue dot) for cluster regions in CC (A), NCC (B), and SC (C) over eastern China. The black boxes indicate the specific cluster regions.
Composite analysis is used to reveal the common features and mechanisms of RPHW for each cluster. Furthermore, thermodynamic equation1 is diagnosed for T2m tendency to clarify the causes of RPHW in each cluster region. On the right hand side of Eq. 1, from left to right, the forcing terms are advection, adiabatic heating, and diabatic heating, respectively.
In this study, relative contributions of advection, adiabatic heating and diabatic heating to the temperature tendency related to RPHW are diagnosed at 925 hPa. Wherein, the diabatic heating includes solar shortwave radiation, longwave radiation and sensible heat flux.
Spatial and Temporal Characteristics of Regional Pentad Heat Wave
Figure 1 shows the three clusters of RPHW over eastern China based on K-means cluster analysis. It is clearly seen that RPHWs in CC, NCC, and SC are well separated, and frequency of RPHWs (HWF) in SC is the largest, and they are more concentrated in most parts of Jiangxi province (Figure 1C). In CC, the large HWFs are mainly located on the two sides of Yangtze River, whereas their centers of gravity (HWCGs) intensively lie in the middle of Yangtze River (Figure 1A). The HWFs in NCC are relatively smaller together with incompact HWCGs of the RPHWs over there (Figure 1B), which means the RPHW in NCC has stronger variance in location from case to case compared with those in CC and SC. It is also interesting to note that the HWF distributions are not homogeneous in all the three cluster regions, and the white holes embedded are due to the high mountains since the air temperature above cannot reach the 35°C threshold value at higher altitudes. Generally, the HWF occur more frequently in southern China and less in northern China, which is consistent with Wang et al. (2017) based on the relative threshold of HW.
In accordance with the HWF, the cumulative temperature of RPHW (HWCT) is also the highest in SC (Figure 2C), followed by those in CC (Figure 2A) and NCC (Figure 2B) in order since HWCT is positively proportional to HWF. However, different from HWF and HWCT, the average intensity of HW (HWI) is much stronger in CC (Figure 3A) than those in NCC (Figure 3B) and SC (Figure 3C), and the HWI in SC is the least. It indicates that in terms of the northmost location among the three cluster regions, the average intensity is rather high in NCC albeit with less HWs, whereas SC has the weakest average intensity although more HWs occur over there.
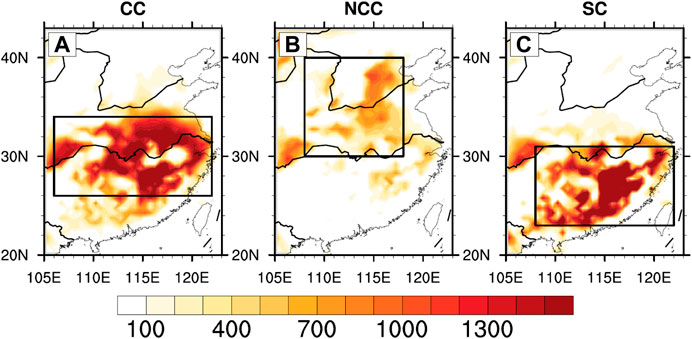
FIGURE 2. Same as Figure 1, but for HWCT (unit: °C).
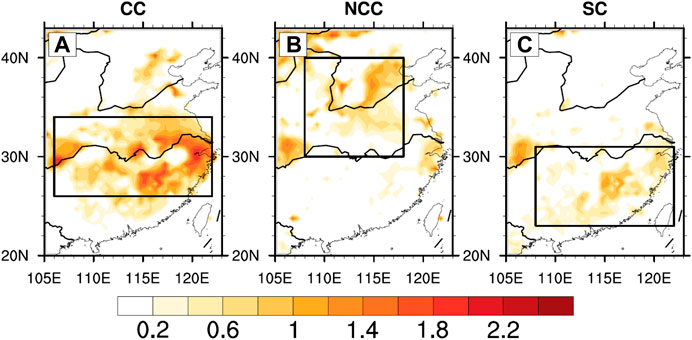
FIGURE 3. Same as Figure 1, but for HWI (unit: °C per pentad).
Figures 4A–C show the distributions of area and intensity of RPHW during summer, and it can be clearly seen that RPHW mainly occurs between 39th pentad and 45th pentad (middle-late summer) in CC, between 32nd pentad and 45th pentad (early-middle summer) in NCC and between 35th pentad and 48th pentad (middle-late summer) in SC, respectively, demonstrating gradually postponed occurred time of RPHW from north to south in eastern China. In CC, the intensity of RPHW ranges mainly from 1.0 to 3.0 with the maximum in late summer (Figure 4A), followed by NCC from 1.0 to 2.5 with the maximum in early summer (Figure 4B) and SC around 1.0 with the maximum in middle summer (Figure 4C). The area of RPHW is comparable to each other in CC and SC with relatively higher values, which are above 0.25 of the CC region and around 0.25 of the SC region, separately (Figures 4A,C). However, in NCC (Figure 4B), the area of RPHW is generally below the 0.25, and they have large variations from case to case. The intensity and area of RPHW have similar distributions during summer (Figures 4A–C), and their relationship can be demonstrated more clearer according to the scatter plots (Figures 4D–F). The corresponding correlation coefficients between them are 0.89, 0.64, and 0.85 in CC, NCC, and SC, respectively, which means the increase of intensity of RPHW is often accompanied with the expansion of its area coverage, and vice versa, especially in CC and SC.
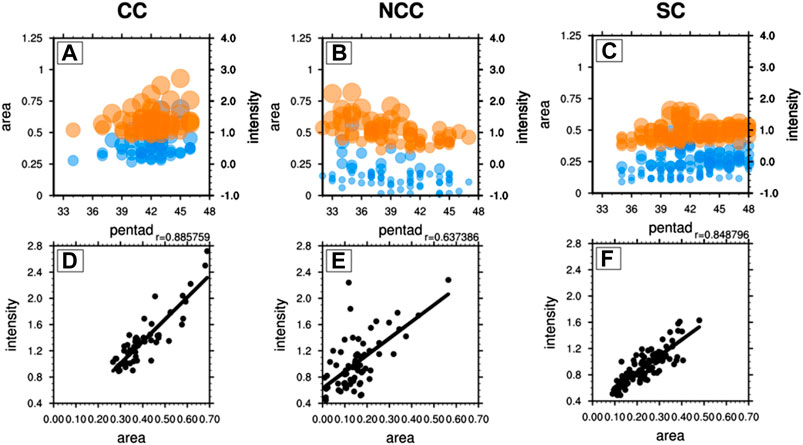
FIGURE 4. Temporal distributions of area (blue dot) and intensity (orange dot) (unit: °C per pentad) of RPHWs during summer (A–C) and their relationship according to scatter plots (D–F) in CC (A, D), NCC (B, E), and SC (C, F). In (A–C), the larger the dot is, the larger the area and intensity are. In (D–F), the black line and r are the linear regression line and correlation coefficient, respectively between area and intensity of RPHWs, and they are all exceed the 95% confidence level.
As for the individual RPHW in CC (Figure 5A), their occurred time is basically same as the climatology (Figure 4A), i.e., mostly from the 39th pentad to the 45th pentad. However, the frequency of RPHW is getting larger after the late 1990s, so is the consecutive RPHW, and furthermore, the HWP is becoming longer during recent decades (Figure 5A). Accordingly, the accumulated days also show an obvious increasing trend, which is also more significant since the late 1990s, with the maximum in 2013 (Figure 5D). In NCC, the occurred time of RPHW demonstrate obvious interdecadal changes, i.e., it is shifted from the middle-late summer to the early-middle summer around the late 1990s, and moreover, the RPHW seldom happens before 1990s (Figure 5B). Besides, there are more HWDs in 1990s and 2000s compared with other decades (Figure 5E), which is in accordance with many more consecutive RPHWs during those periods (Figure 5B). There is no obvious interdecadal variation in occurred time of RPHW in SC, which is mainly in middle-late summer during the whole study period (Figure 5C), consistent with the climatology (Figure 4C). However, the frequency of RPHW, especially the consecutive RPHW is significantly increased after the late 1990s (Figure 5C), so is the HWD, which has a remarkable increasing trend as well (Figure 5F). In addition, most RPHWs last for only one pentad in all the three cluster regions, accounting for about 70% in CC (Figure 5G) and SC (Figure 5I) and about 80% in NCC (Figure 5H), and some RPHWs can occasionally last for five pentads in CC (Figure 5G) during 2013 summer and six pentads in SC (Figure 5I) during 1998 summer.
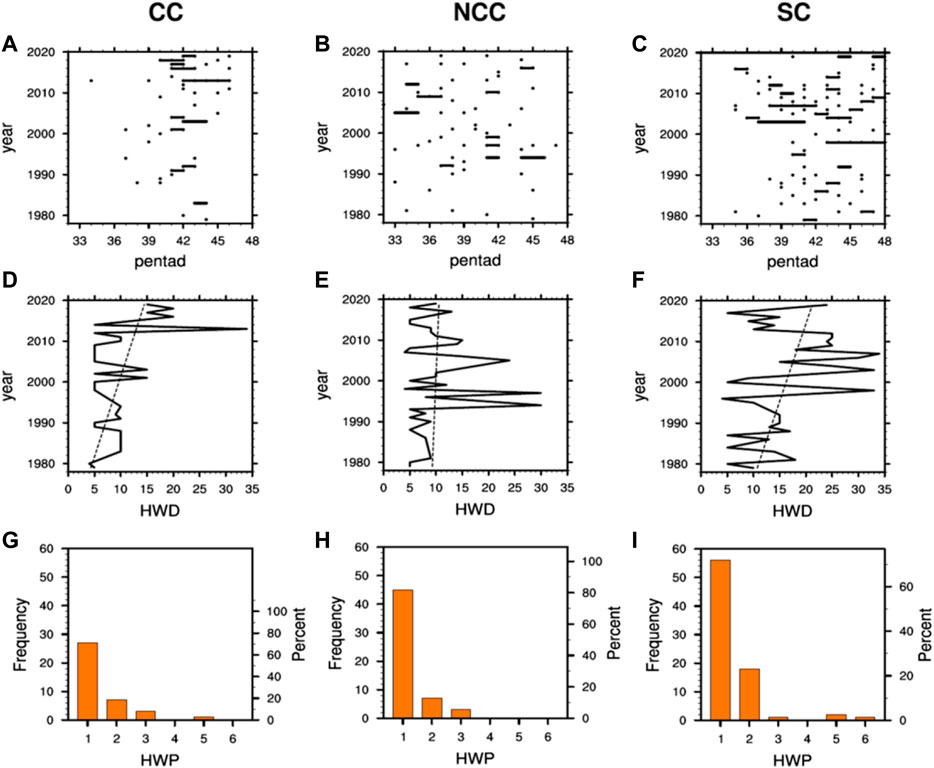
FIGURE 5. Interannual variations of occurred time of individual RPHW (A–C) and HWD (D–F), and frequency of HWP (G–I). In (A–C), one dot indicates one RPHW, and the black line links the consecutive RPHW. In (D–F), the straight line indicates the corresponding linear trend.
Mechanism of Regional Pentad Heat Wave
To investigate the possible causes of RPHW in eastern China, composite of anomalous atmosphere and soil variables is carried out in terms of the selected RPHW in CC (Figure 6), NCC (Figure 7), and SC (Figure 8), respectively. It is expected and apparent that corresponding to the RPHW, both Tmax and T2m have significantly positive anomalies in the cluster regions (Figures 6A,B, 7A,B, 8A,B), and at the same time, precipitation anomalies are significantly reduced (Figures 6C, 7C, 8C). Therefore, there is an obvious negative relationship between HW and precipitation (Liang and Wu, 2015), which can be seen in all three clustering regions. It has been pointed out that HW is usually accompanied with high pressure anomalies (Wang et al., 2017), and we do find significant positive 500 hPa geopotential height anomalies over the three cluster regions (Figures 6D, 7D, 8D), however, different from those in NCC and SC, the high pressure anomaly in CC is closely related to the enhanced and westward extended western Pacific subtropical high (Figure 6D). On the other hand, associated with the positive geopotential height anomalies, strong anticyclone anomalies appear in the lower troposphere (Figures 6E, 7E, 8E), and 500 hPa vertical velocity shows large downward vertical motion anomalies (Figures 6F, 7F, 8F). All these atmospheric circulation anomalies are unfavorable for the local precipitation (Figures 6C, 7C, 8C) whereas favorable for the local high temperature (Figures 6A,B, 7A,B, 8A,B).
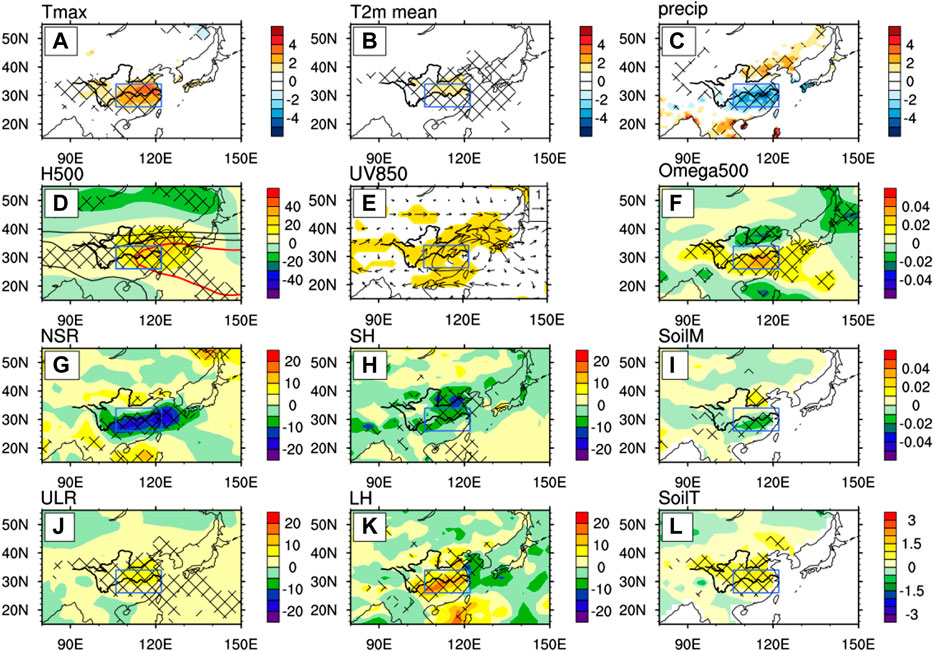
FIGURE 6. Composite of anomalous atmosphere and soil variables in terms of RPHWs in CC that are departures from the long-term climate mean over the whole study period, i.e., Tmax (unit: °C) (A), T2m (unit: °C) (B), precipitation (unit: mm) (C), 500 hPa geopotential height (shading, unit: gpm) and isolines of 588 (red contours), 586 and 584 (black contours) (D), 850 hPa wind vector (vector, unit: m s−1) (E), 500 hPa ω (unit: Pa s−1) (F), net shortwave radiation at surface (unit: W m−2) (G), sensible heat flux (unit: W m−2) (H), surface soil moisture (unit: proportion) (I), upward longwave radiation at surface (unit: W m−2) (J), latent heat flux (unit: W m−2) (K), and surface soil temperature (unit: K) (L). Where, in radiation (G, J) and heat flux (H, K), positive is upward. The 95% confidence level is indicated by the shading in (E) and the hatched area in others.
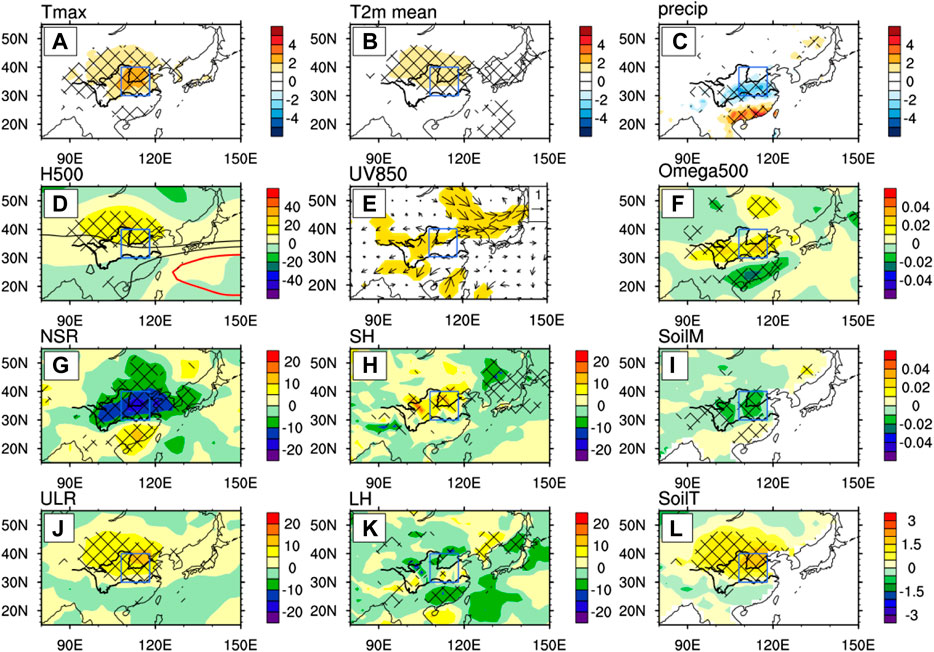
FIGURE 7. Same as Figure 6, but for NCC.
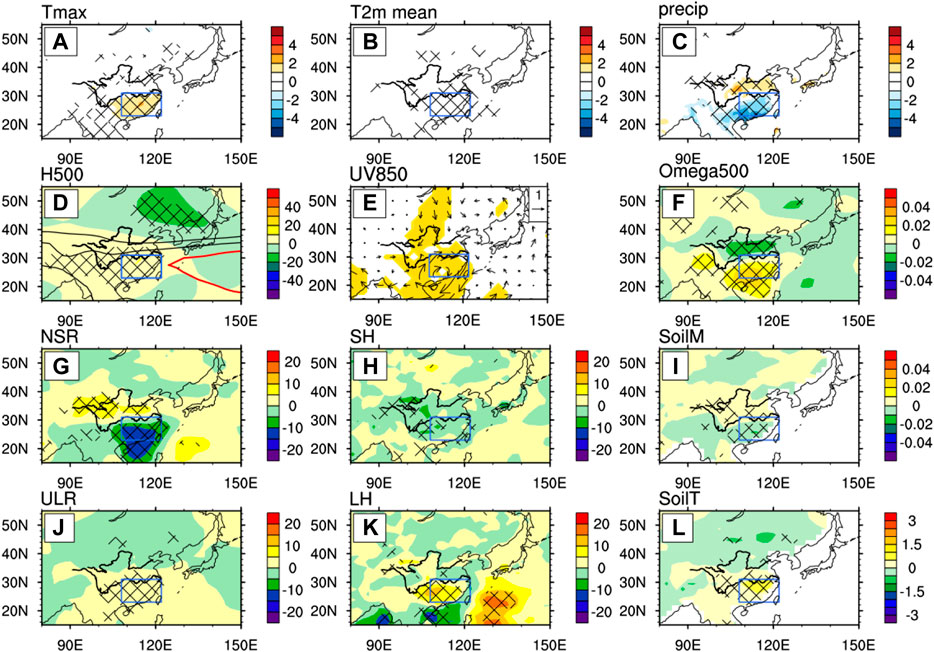
FIGURE 8. Same as Figure 7, but for SC.
It is easy to understand that regions with less precipitation under the control of high pressure can receive much more net shortwave radiation (Figures 6G, 7G, 8G) because of less cloud cover (Black et al., 2004). The excessive incoming shortwave radiation heats the ground and make surface soil temperature higher than normal (Figures 6L, 7L, 8L) as well as surface soil moisture drier than normal (Figures 6I, 7I, 8I). On one hand, warm surface can heat the low-level atmosphere by two pathways, i.e., emitting more upward longwave radiation according to the Stefan-Boltzmann law (Figures 6J, 7J, 8J) and tending to increase the sensible heat flux through turbulent processes in the boundary layer. On the other hand, combined with the effect of higher surface soil temperature, drier surface soil moisture contributes to the increased latent heat flux because of enhanced evaporation (Bateni and Entekhabi, 2012). The positive latent heat flux anomalies in CC and SC are much larger and significant than those in NCC (Figures 6K, 7K, 8K), which may be attributed to the richer climatological soil moisture in southern China including CC and SC. In turn, the cooling effect due to greatly enhanced latent heat flux in CC and SC could partly cancel out the warming effect of increased shortwave radiation, thus the positive surface soil temperature anomalies in CC and SC are relatively weaker albeit significant at 95% confidence level (Figures 6L, 8L). Therefore, the expected increased sensible heat flux in CC and SC with respect to the positive surface soil temperature is actually decreased (Figures 6H, 8H), which is the result of RPHW rather than a cause factor over there. On the contrary, in NCC, the positive latent heat flux is too weak to greatly affect the local surface soil temperature, leaving quite warmer surface soil temperature and resulting in increased sensible heat flux (Figures 7H,L), which can heat the atmosphere as an important cause factor.
Since both atmospheric circulation and diabatic heating anomalies mentioned above have impacts on the RPHW, their relative contributions are further diagnosed and identified by employing the thermodynamic equation at 925 hPa. As shown in Figures 9A–C, the advection term always tends to cool the temperature in the cluster regions, which actually offsets the RPHW to some extent. The adiabatic heating term is mainly determined by the vertical velocity, and because of the significant descending motion anomalies (Figures 6F, 7F, 8F), it has significant warming effect in all the three cluster regions accordingly, especially over their southern parts, among which it is the largest in CC, followed by that in SC and NCC (Figures 9D–F). The essential role of adiabatic heating is also addressed by Xia and Xu (2017) to explain the extreme HW in the middle-lower reaches of Yangtze River in 2013, which is controlled by the western Pacific subtropical high with large-scale subsidence movement. Positive contributions to the air temperature can also be found in diabatic heating term, which generally locates in the northern parts of cluster regions (Figures 9G–I). Wherein, the forcing of diabatic heating in NCC is the largest (Figure 9H), which may mainly come from the consistent positive effects of both upward longwave radiation and sensible heat flux (Figures 7H,J), in contrast to the single influence of positive upward longwave radiation offset by negative sensible heat flux in CC and SC. Therefore, in terms of the spatial distributions of Tmax anomalies (Figures 6A, 7A, 8A), RPHW in NCC and SC are primarily caused by the diabatic heating and adiabatic heating forcing, respectively. However, in CC, both adiabatic heating and diabatic heating have significant contributions to the RPHW, but the adiabatic heating is more important.
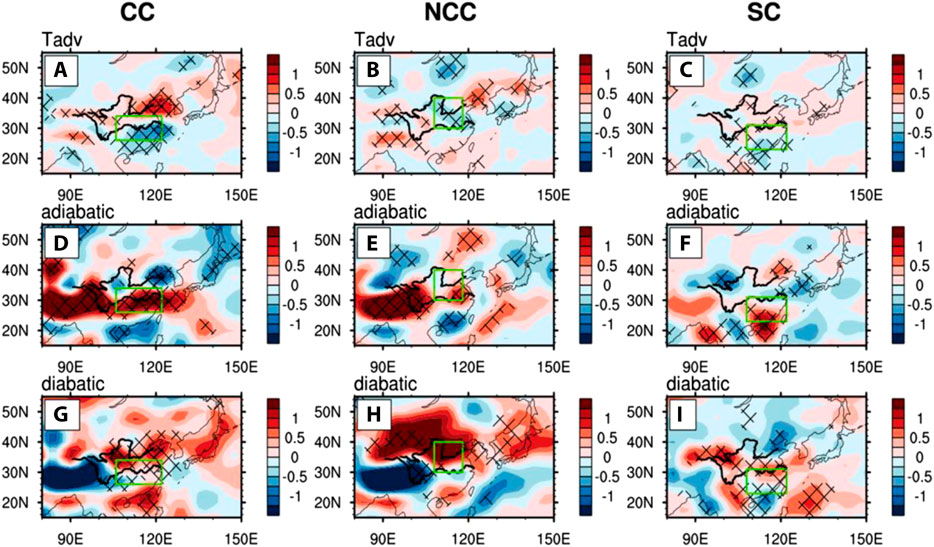
FIGURE 9. The composite anomalies of temperature advection (A–C), adiabatic heating (D–F), and diabatic heating (G–I) (unit: K day−1) on the right hand side of thermodynamic equation in term of RPHW in CC (A, D, G), NCC (B, E, H), and SC (C, F, I). These are departures from the long-term climate mean over the whole study period. The hatched area indicates it is significant at 95% confidence level.
Summary and Discussions
With the rapid global warming in recent decades, HW has an obviously increasing trend, which poses serious threats to nature and society. How to depict its climate characteristics and understand its formation mechanism are essential for us to minimize its harmful influences. In this study, we examine the summer HW in eastern China from a new perspective, and define the RPHW as summer daily Tmax above 35°C no less than 3 days in a pentad that covers more than 2% grids over the eastern China. Such definition removes the assumption of strict continuity of time and space in previous studies, and facilitates the understanding of HW from the aspect of climate, which is more in line with the characteristics of HW that is often distributed by the mountains. Based on K-means cluster analysis, the RPHW in eastern China is naturally divided into three categories, which are located in the Central China (CC) (106–122°E, 26–34°N), Northern-Central China (NCC) (108–118°E, 30–40°N) and Southern China (SC) (108–122°E, 23–31°N).
In order to better describe the RPHW, seven RPHW metrics, namely HWF, HWCT, HWA, HWI, HWCG, HWP, and HWD, are used to measure the characteristics of RPHW from different aspects. It is found that among the three cluster regions, the most frequent RPHW occurs in SC but with the weakest intensity, and the strongest RPHW occur in CC but with the least frequency. There is good relationship between intensity and area of RPHW, increasing intensity is usually accompanied with growing area, and vice versa. The RPHW in CC and SC mostly occur in middle-late summer with former slightly earlier than latter, while they mainly appear in early-middle summer in NCC, demonstrating a gradual postponed tendency of occurred time in RPHW from northern China to southern China. Most RPHWs only last for one pentad, and occasionally, some cases can last for five to six pentads in some specific years, for example, 2013 in CC and 1998 in SC. Late 1990s is the turning point in the interdecadal variations of RPHW characteristics. Compared to the previous period, many more consecutive RPHWs as well as HWDs emerge in CC and SC after the late 1990s, which means the RPHW can last for many more pentads during that period, and it may be attributed to the rapid global warming. Whereas in NCC, the interdecadal change of RPHW is reflected by the occurred time rather than the consecutive HWP, which is shifted from the middle-late summer to the early-middle summer around the late 1990s.
Based on the composite analysis, it shows that associated with RPHW, both Tmax and T2m are significantly increased together with decreased precipitation. The corresponding RPHW cluster regions are all controlled by significant high pressure anomalies. On one hand, it allows more shortwave radiation coming into and heating the ground, on the other hand, it is conducive to large-scale subsidence movement and heats the low-level atmosphere by adiabatic heating. Then warmer surface soil temperature directly heats the low-level atmosphere by increasing upward long-wave radiation and sensible heat flux. At the same time, it can also help to enhance the evaporation and increase the latent heat flux, which offsets the warming effect of sensible heat flux to a certain extent, especially in CC and SC where soil moisture is abundant. Diagnosis with thermodynamic equation further indicates that temperature advection always tends to cool the atmosphere. RPHW is primarily formed by the diabatic heating from the land surface in NCC, by the adiabatic heating due to high pressure driven subsidence movement in SC, and by both the diabatic heating and the adiabatic heating in CC, which may explain why intensity of RPHW is the strongest in CC.
In addition, the definition of RPHW in this study is capable of capturing the climate characteristics of HW, and is also easy to be used for monitoring HW. Different characteristics and formation mechanisms of RPHW in NCC, CC and SC obtained in this study can be applied for future predictions, especially under the rapid global warming.
Data Availability Statement
Publicly available datasets were analyzed in this study. This data can be found here: The daily maximum temperature data is obtained from the NOAA Climate Prediction Center (CPC): https://psl.noaa.gov/data/gridded/data.cpc.globaltemp.html. The daily total of precipitation data is obtained from the NOAA Climate Prediction Center (CPC): https://psl.noaa.gov/data/gridded/data.cpc.globalprecip.html. The reanalysis datasets are from the National Centers for Environment Prediction and National Center for Atmospheric Research (NCEP/NCAR): https://psl.noaa.gov/data/gridded/data.ncep.reanalysis.html.
Author Contributions
JY produced the figures and wrote the manuscript. XS was responsible for the main idea of the manuscript and contributed to the manuscript revision. JT, YJ, YX and XY provided input to figure and text editing. All the authors contributed to the article and approved the submitted version.
Funding
This study was jointly funded by the National Key R&D Program of China (2018YFC1505803), the National Natural Science Foundation of China (Grant Nos. 41775074, 41621005, 41275069, and 41330420) and the Fundamental Research Funds for the Central Universities.
Conflict of Interest
The authors declare that the research was conducted in the absence of any commercial or financial relationships that could be construed as a potential conflict of interest.
Appendix
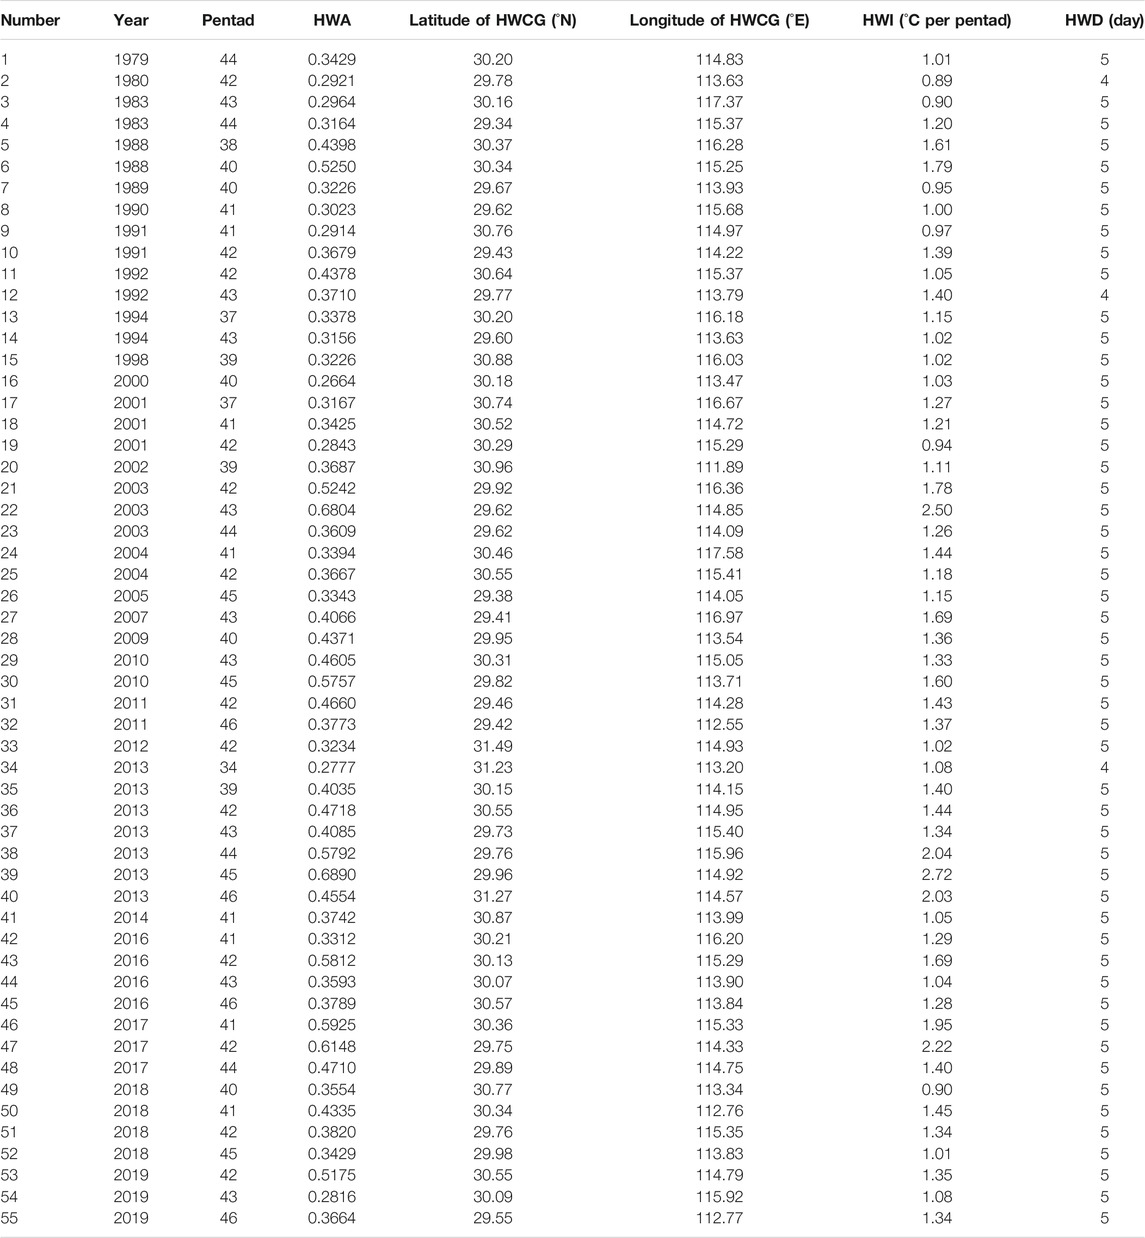
TABLE A1. Detailed information of RPHW in CC, including number, occurred year, occurred pentad in a year, HWA, latitude of HWCG, longitude of HWCG, HWI, and HWD.
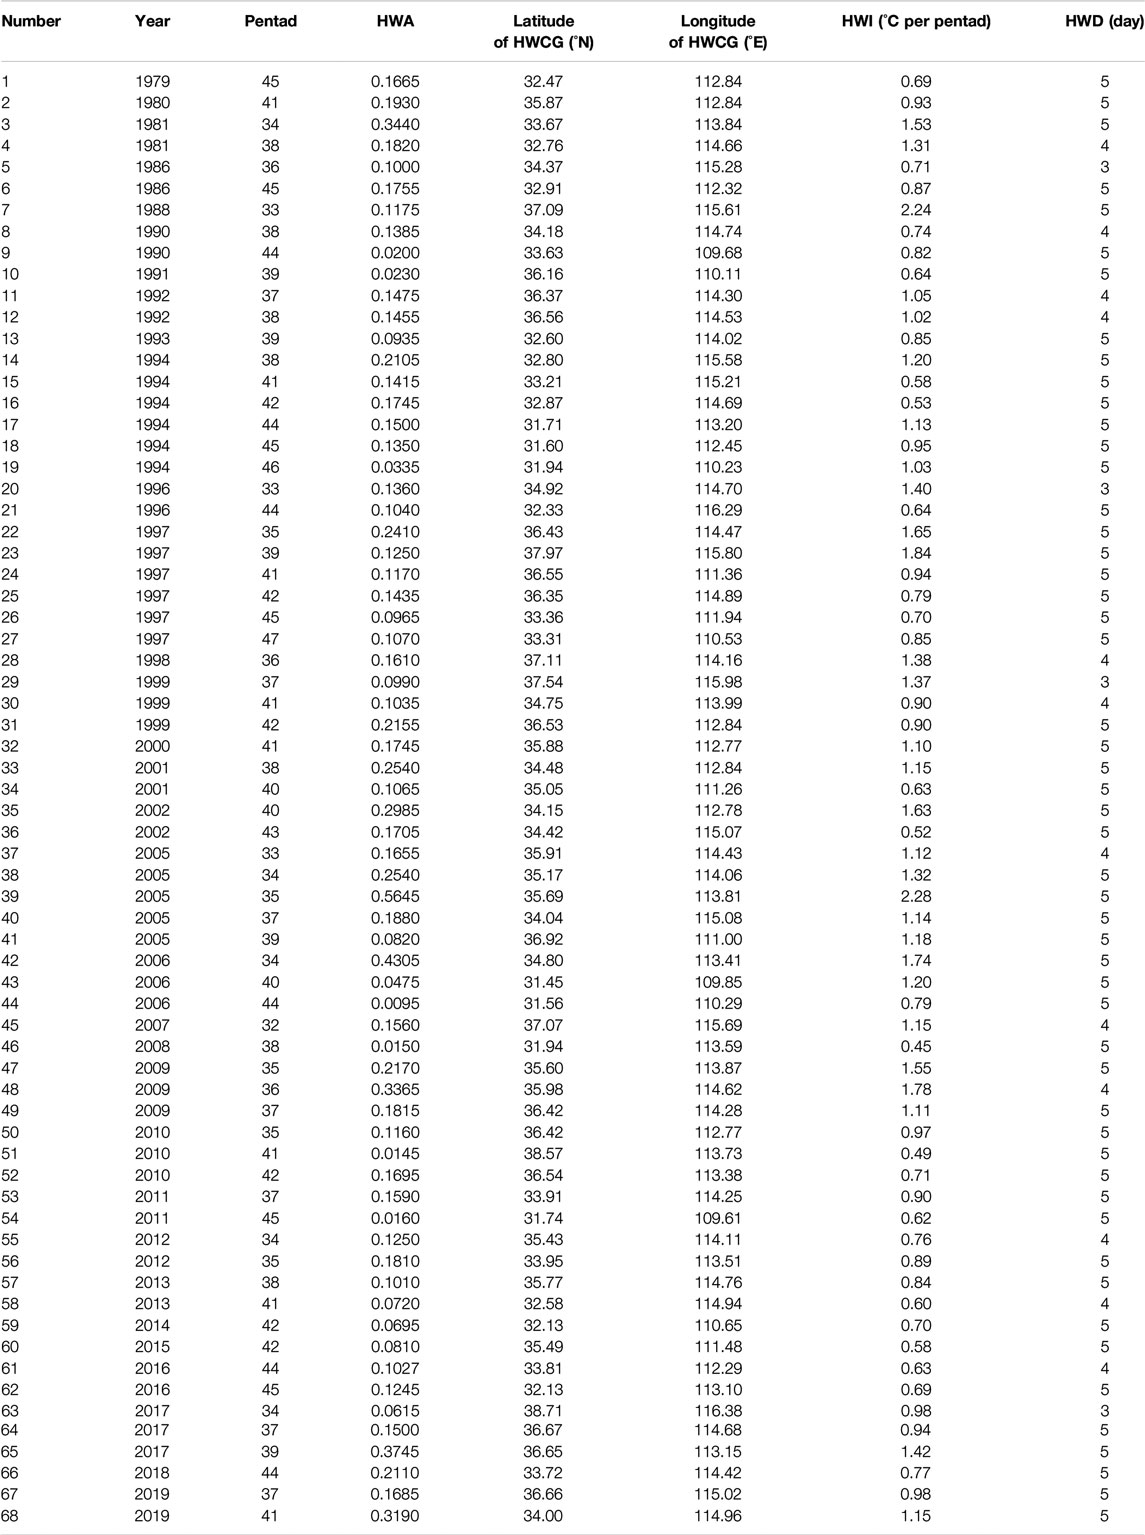
TABLE A2. Same as Table A1, but for RPHWs in NCC.
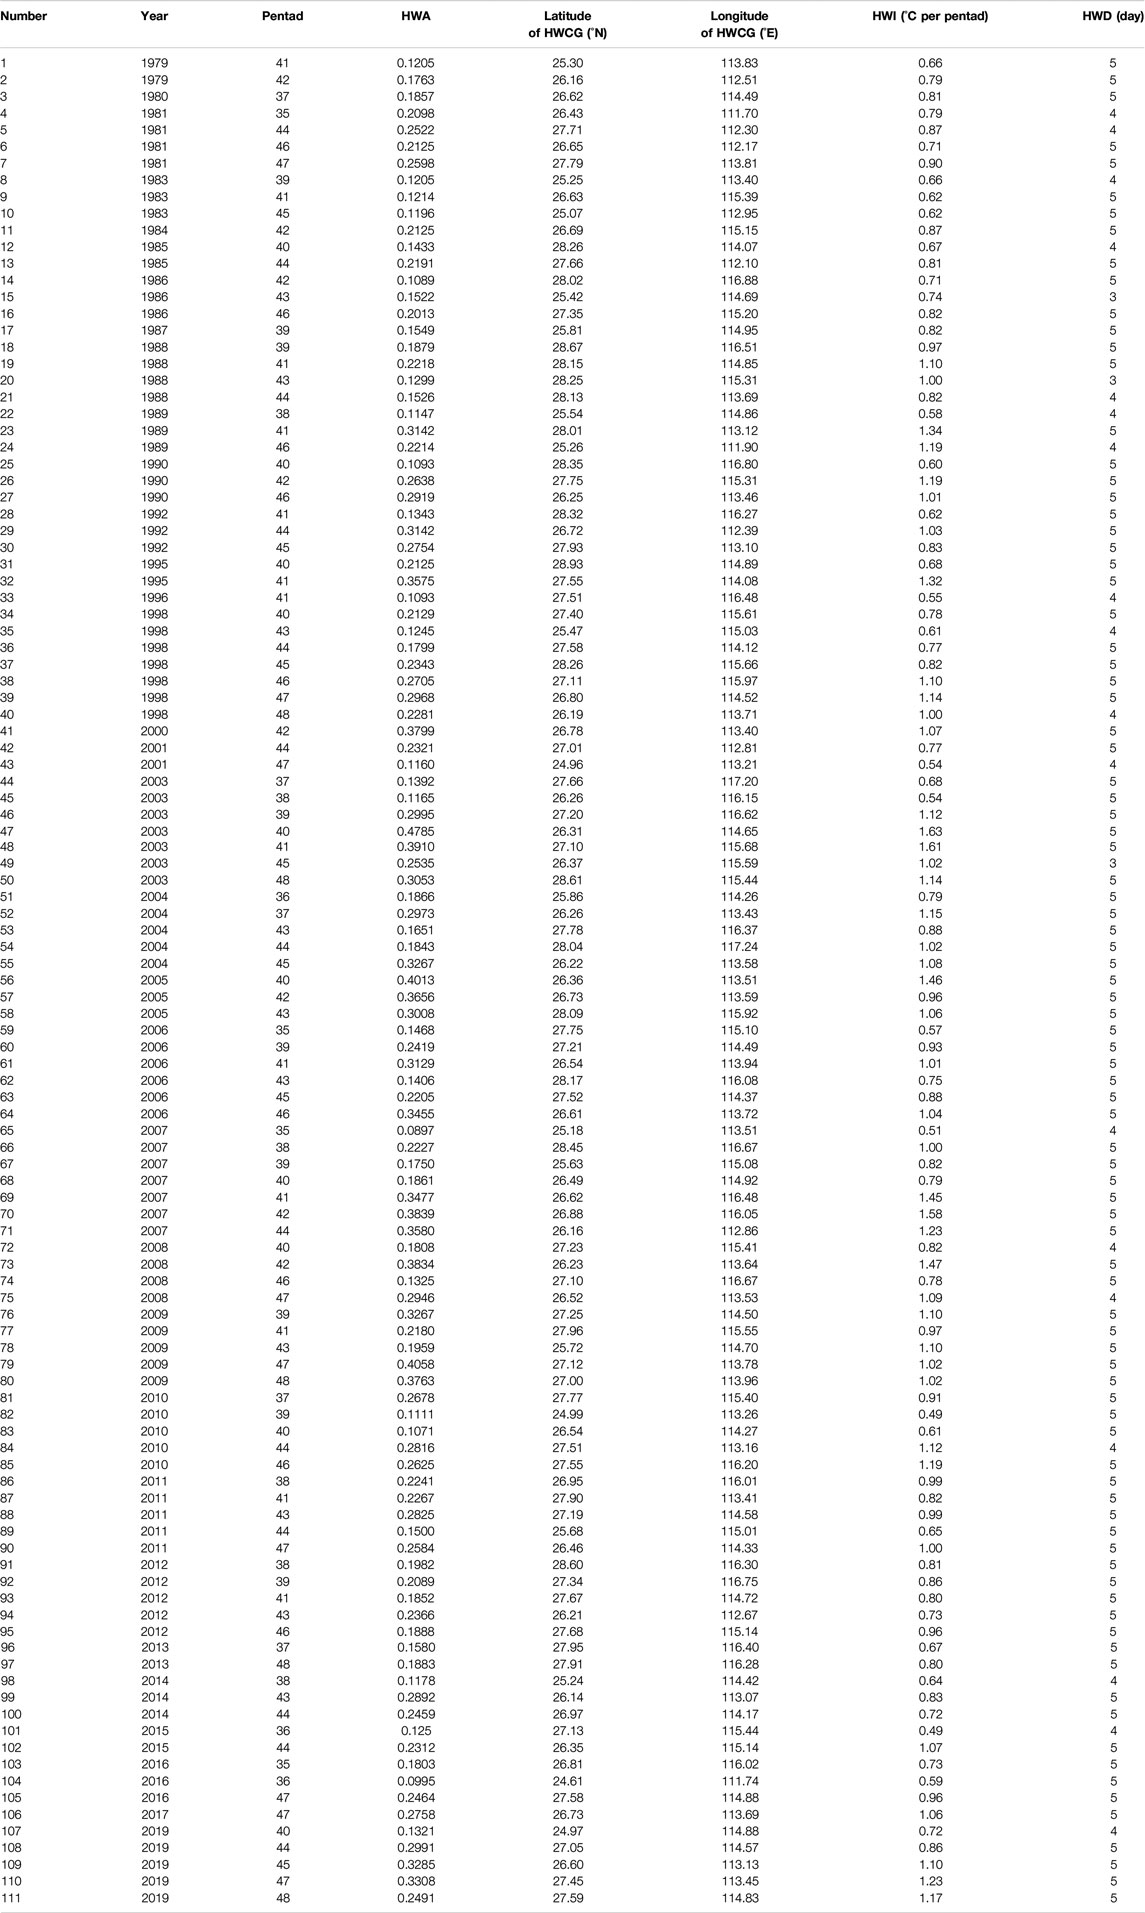
TABLE A3. Same as Table A2, but for RPHWs in SC.
References
Bateni, S. M., and Entekhabi, D. (2012). Surface heat flux estimation with the ensemble Kalman smoother: joint estimation of state and parameters. Water Resour. Res. 48, W04510. doi:10.1029/2011wr011357
Black, E., Blackburn, M., Harrison, G., Hoskins, B., and Methven, J. (2004). Factors contributing to the summer 2003 European heatwave. Weather 59, 217–223. doi:10.1256/wea.74.04
Cadot, E., and Spira, A. (2006). Heat wave and excess mortality in Paris in August 2003, the impact of the socio-economic factors. Espace Popul. Soc. 2–3, 239–249. doi:10.4000/eps.1383
Ding, T., and Ke, Z. (2015). Characteristics and changes of regional wet and dry heat wave events in China during 1960–2013. Theor. Appl. Climatol. 122, 651–665. doi:10.1007/s00704-014-1322-9
Fan, Y., and Van den Dool, H. (2008). A global monthly land surface air temperature analysis for 1948-present. J. Geophys. Res. 113, D01103. doi:10.1029/2007jd008470
Fischer, E. M., and Schär, C. (2010). Consistent geographical patterns of changes in high-impact European heatwaves. Nat. Geosci. 3, 398–403. doi:10.1038/ngeo866
Hartigan, J. A., and Wong, M. A. (1979). Algorithm as 136: a K-means clustering algorithm. J. Appl. Stat. 28, 100–108. doi:10.2307/2346830
Hoffmann, B., Hertel, S., Boes, T., Weiland, D., and Jöckel, K. H. (2008). Increased cause-specific mortality associated with 2003 heat wave in essen, Germany. J. Toxicol. Environ. Health. Part A 71, 759–765. doi:10.1080/15287390801985539
Huang, Z., Chen, H., and Tian, H. (2011). Research on the heat wave index (in Chinese). Meteor. Mon. 37, 345–351.
IPCC (2013). Climate change 2013: the physical science basis. Cambridge, United Kingdom: Cambridge University Press.
Kalnay, E., Kanamitsu, M., Kistler, R., Collins, W., Deaven, D., Gandin, L., et al. (1996). The NCEP/NCAR 40-year reanalysis project. Bull. Am. Meteorol. Soc. 77, 437–471. doi:10.1175/1520-0477(1996)077<0437:tnyrp>2.0.co;2
Li, J., Ding, T., Jia, X., and Zhao, X. (2015). Analysis on the extreme heat wave over China around Yangtze River region in the summer of 2013 and its main contributing factors. Adv. Meteorol. 2015, 1–15. doi:10.1155/2015/706713
Liang, M., and Wu, L. G. (2015). Analysis on features of summer extreme high temperature in eastern China (in Chinese). J. Meteorol. Sci. 35, 701–709.
Luo, L. S., Duan, C. F., Bi, Y., Tang, W. A., and Ding, X. J. (2016). Relation between atmospheric heat source in spring over the Tibetan Plateau and mid-summer high temperature events in middle-lower reaches of the Yangtze river (in Chinese). J. Meteorol. Sci. 36, 614–621. doi:10.3969/2015jms.0062
Maxwell, P., and Benjamin, R. L. (2020). Application of clustering algorithms to TRMM precipitation over the tropical and South pacific ocean. J. Clim. 33, 5767–5785. doi:10.1175/JCLI-D-19-0537.1
Perkins, S. E., and Alexander, L. V. (2013). On the measurement of heat waves. J. Clim. 26, 4500–4517. doi:10.1175/jcli-d-12-00383.1
Qin, D. H. (2014). Climate change science and sustainable development (in Chinese). Prog. Geogr. 33, 874–883.
Ren, F. M., Cui, D. L., Gong, Z. Q., Wang, Y., Zou, X., and Li, Y. (2012). An objective identification technique for regional extreme events. J. Clim. 25, 7015–7027. doi:10.1175/jcli-d-11-00489.1
Robinson, P. J. (2001). On the definition of a heat wave. J. Appl. Meteorol. 40, 762–775. doi:10.1175/1520-0450(2001)040<0762:otdoah>2.0.co;2
Russo, S., Dosio, A., Graversen, R. G., Sillmann, J., Carrao, H., Dunbar, M. B., et al. (2014). Magnitude of extreme heat waves in present climate and their projection in a warming world. J. Geophys. Res. Atmos. 119, 12500–12512. doi:10.1002/2014jd022098
Shen, J. H., You, Q. L., Wang, P. L., and Kong, L. (2018). Analysis on heat waves variation features in China during 1961–2014 (in Chinese). J. Meteorol. Sci. 38, 28–36.
Shi, J., Ding, Y. H., and Cui, L. L. (2009). Climatic characteristics of extreme maximum temperature in East China and its causes (in Chinese). Chin. J. Atmos. Sci. 33, 347–358.
Tamrazian, A., LaDochy, S., Willis, J., and Patzert, W. C. (2008). Heat waves in southern California: are they becoming more frequent and longer lasting? Yearbk. Assoc. Pac. Coast. Geogr. 70, 59–69. doi:10.1353/pcg.0.0001
Wang, L. W., and Zhang, J. (2015). Relationship between summer heat waves and soil moisture in North-East China (in Chinese). J. Meteorol. Sci. 35, 558–564. doi:10. 3969/2014jms. 0056
Wang, P. Y., Tang, J. P., Sun, X. G., Wang, S. Y., Wu, J., Dong, X. N., et al. (2017). Heat waves in China: definitions, leading patterns and connections to large-scale atmospheric circulation and SSTs. J. Geophys. Res. Atmos. 122. doi:10.1002/2017jd027180
Wang, P. Y., Tang, J. P., Wang, S. Y., Dong, X. N., and Fang, J. (2017). Regional heat waves in China: a cluster analysis. Clim. Dynam. 50, 1901–1917. doi:10.1007/s00382-017-3728-4
Xia, Y., and Xu, H. M. (2017). Circulation characteristics and causes of the summer extreme high temperature event in the middle and lower reaches of the Yangtze river of 2013 (in Chinese). J. Meteorol. Sci. 37, 60–69. doi:10. 3969/2015jms.0072
Yang, Z. M., and Zhang, J. Y. (2020). Dataset of high temperature extremes over the major land areas of the belt and road for 1979–2018. Big Earth Data. 4 (2), 128–141. doi:10.1080/20964471.2020.1718993
Ye, D. X., Yin, J. F., Chen, Z. H., Zheng, Y. F., and Wu, R. J. (2013). Spatiotemporal change characteristics of summer heatwaves in China in 1961–2010 (in Chinese). Progressus Inquisitions de Mutatione Climatis., 9, 15–20.
You, Q. L., Jiang, Z. H., Kong, L., Wu, Z. W., Bao, Y. T., Kang, S. C., et al. (2017). A comparison of heat wave climatologies and trends in China based on multiple definitions. Clim. Dynam. 48, 3975–3989. doi:10.1007/s00382-016-3315-0
Keywords: regional pentad heat wave, high-pressure anomaly, net solar radiation, diabatic heating, adiabatic heating, subsidence movement
Citation: Yao J, Sun X, Tang J, Ji Y, Xu Y and Yang X-Q (2020) Summer Regional Pentad Heat Wave in Eastern China and Their Possible Causes. Front. Earth Sci. 8:598027. doi: 10.3389/feart.2020.598027
Received: 23 August 2020; Accepted: 09 October 2020;
Published: 05 November 2020.
Edited by:
Pang-chi Hsu, Nanjing University of Information Science and Technology, ChinaReviewed by:
Qinglong You, Fudan University, ChinaDongdong Peng, Guangzhou Institute of Tropical and Marine Meteorology (GITMM), China
Copyright © 2020 Yao, Sun, Tang, Ji, Xu and Yang. This is an open-access article distributed under the terms of the Creative Commons Attribution License (CC BY). The use, distribution or reproduction in other forums is permitted, provided the original author(s) and the copyright owner(s) are credited and that the original publication in this journal is cited, in accordance with accepted academic practice. No use, distribution or reproduction is permitted which does not comply with these terms.
*Correspondence: Xuguang Sun, xgsun@nju.edu.cn