Introduction
Polycystic ovary syndrome (PCOS), as one of the most common female endocrine disorders, represents a leading cause of infertility with an incidence of 6–26% [1, 2]. Three criteria can be used to diagnose PCOS. The National Institute of Child Health and Human Development (NICHD) of the National Institutes of Health (NIH) in 1990 developed the oligo-ovulation, clinical or biochemical hyperandrogenism. In addition, the Rotterdam European Society for Human Reproduction (ESHRE)/American Society of Reproductive Medicine (ASRM) in 2003 established criteria such as oligo/amenorrhea, as well as the clinical and biochemical signs of hyperandrogenism and confirmed PCOS by ultrasonography. Two of the above-mentioned criteria are required for diagnosis. The Androgen Excess Society (AES) in 2006 defined androgen excess, along with various combinations of phenotypic features (e.g., hyperandrogenaemia, hirsutism, oligo-ovulation/anovulation, and/or polycystic ovaries) that could lead to more accurate diagnosis [3]. Although the clinical manifestation of PCOS may vary among women, hyperandrogenism and chronic anovulation are the main hallmarks of this disorder [4]. The androgen excess is manifested as hirsutism, acne/seborrhea while the chronic anovulation is manifested as oligomenorrhea/amenorrhea and reduction in fertility rate. Furthermore, PCOS is associated with dyslipidemia, obesity, insulin resistance, and multiple ovarian cysts [5]. The action of the gonadotropins, follicle-stimulating hormone (FSH), and luteinizing hormone (LH) regulates steroidogenesis [6]. However, excessive androgen production by the ovary is considered as the main physiological abnormality in women with PCOS. This pathway is driven by the enhanced pituitary-released LH secretion and increased theca cell sensitivity to gonadotropin stimulation [7]. Similarly, fast gonadotropin-releasing hormone (GnRH) pulse frequencies, an increase in LH pulse frequency, and a reduction in FSH in PCOS patients contribute to impaired folliculogenesis and low levels of granulosa cell aromatase enzyme that are responsible for converting androgen precursors (e.g., androstenedione) to estrogen. Therefore, inadequate FSH leads to hyperandrogenism [8].
The growth of the ovarian follicle fails to succeed in completing its maturation for ovulation, and most follicles are arrested at the antral stage [9]. Moreover, hyperinsulinemia, as the main feature of PCOS, leads to the over-production of ovarian androgens [10] and has a negative impact on artery function and cardiovascular diseases [11]. In addition, it raises the levels of low-density lipoprotein cholesterol (LDL-C), very low-density lipoprotein cholesterol (VLDL-C), triglyceride (TG), and total cholesterol (TC) while decreasing the level of high-density lipoprotein cholesterol (HDL-C) [12]. The management of PCOS depends on the symptoms including menstrual disorders, ovulatory dysfunction-related infertility, or androgen-related symptoms. Several factors improve PCOS such as weight loss, clomiphene citrate (CC), gonadotropins (i.e., human menopausal gonadotropin (HMG) and FSH), and aromatase inhibitors (i.e., letrozole and anastrozole) by inducing ovulation. An antidiabetic agent (metformin), antiandrogens (spironolactone, flutamide, and finasteride), and oral contraceptives also play a role in this respect through decreasing insulin resistance, and androgen levels, as well as regulating menstrual periods, respectively [3]. Although PCOS is a metabolic disorder, the hypothalamic-pituitary axis is targeted as the first-line therapy. CC as a selective estrogen-receptor modulator, increases pituitary gonadotropin (i.e., FSH and LH) release, promotes ovulation, and improves menstrual cycles by exerting negative feedback on the hypothalamus [13]. However, it may be associated with a number of side effects including the reduction in the endometrial thickness [14], nausea, vomiting, hot flashes, higher multiple pregnancy, breast discomfort, and ovarian hyperstimulation syndrome [13].
Recent studies have indicated that complementary medicine therapies such as herbal medicine have a potent effect on regulating LH, FSH, testosterone, fasting blood sugar (FBS), and insulin, and alleviate the symptoms of PCOS [15]. Furthermore, they can be counted as natural antioxidants that increase the rate of infertility and the level of serum antioxidants [16].
Cinnamomum zeylanicum Nees (cinnamon) from the Lauraceae family is shown to diminish insulin resistance by enhancing phosphatidylinositol 3-kinase activity in the insulin signaling pathway [17]. It not only increases glucose uptake but also reduces TG, LDL, and TC [18]. Additionally, cinnamon has polyphenolic polymers, including epicatechin, camphene, eugenol, γ-terpinene, phenol, salicylic acid, and tannin, that are potent antioxidants which promote glucose metabolism in people with diabetes [19]. Moreover, cinnamon enhances ovary function and improves menstrual cyclicity by gonadotropin stimulation [20].
Zingiber officinale Roscoe (ginger) from the Zingiberaceae family reduces the serum levels of FBS, TC, and TG while it enhances HDL [21]. In addition, it contains phenolic compounds such as zingerone, gingerols, and shogaols that are regarded as the main factors of antioxidant activity. These antioxidants prevent lipid oxidation and free-radical-induced diseases such as diabetes [22, 23]. 6-gingerol, as an active constituent of ginger, has anti-oxidant, anti-inflammatory, and anti-carcinogenic activity [24, 25]. Furthermore, ginger improves fertility by increasing antral follicle count, folliculogenesis, and implantation [26].
Citrus sinensis (L.) Osbeck from the Rutaceae family encompasses naringin and naringenin as two kinds of flavonoid which have anti-diabetic, anti-hyperlipidemic, and antioxidant properties [27, 28]. Further, the hydroethanolic extract of the C. sinensis peel improves insulin sensitivity by the expression of the insulin receptor, GLUT 4, and adiponectin [29]. C. sinensis has polymethoxylated flavones which demonstrate beneficial efficacy in glucose tolerance, lipid levels, and weight reduction [30].
Similarly, Mentha spicata (spearmint) from the Lamiaceae family, which is widespread in the temperate zone and has anti-androgen properties, decreases testosterone production, but it improves hirsutism and has anti-inflammatory, anti-diabetic, and anticancer effects as well [31]. Moreover, spearmint in PCOS improves ovarian cysts, reduces atretic follicles, and enhances Graafian follicles [32].
Although the aforementioned studies have demonstrated the potency of each herb, it is hypothesized that a mixture of these herbs could have a more potent impact on insulin resistance, lipid profile, and sex steroid regulation in PCOS patients. Therefore, the present study evaluated the effect of the “herbal mixture” and “herbal mixture, along with CC” in comparison with “CC” on serum HOMA-IR, sex steroids (i.e., FSH, LH, free testosterone (T), total testosterone (TT), and estradiol (E2)), and lipid profile (i.e., TC, TG, LDL-C, HDL-C, and VLDL-C) as the primary outcomes. The study further investigated the efficacy of these mixtures on thyroid hormones (i.e., thyroid-stimulating hormone (TSH), free thyroxine (FT4), free triiodothyronine (FT3)) and clinical features (i.e., hirsutism, acne, oligomenorrhea, amenorrhea, menstrual regulation, and the rate of pregnancy) as the secondary outcomes in PCOS patients.
Material and methods
Study population
A total of 60 women with polycystic ovary syndrome (PCOS) aged 18–35 years with primary and secondary infertility, as well as body mass index (BMI) between 26.5 and 28.5 kg/m2, and willing to be pregnant, were included in this single-blind, parallel randomized clinical trial. The subjects were selected from the infertility clinic of Alzahra Hospital in Tabriz (Iran) and evaluated for approximately 9 months (from 16th January 2016 to 25th October 2016). The inclusion criteria were suffering from PCOS based on Rotterdam criteria (2003), having primary or secondary infertility, being within the age range of 18–35 years, and having a BMI < 30 kg/m2. The exclusion criteria included patients with diabetes mellitus, thyroid disorders, as well as the current use of medication such as helping ovulation or insulin sensitizers and cholesterol-lowering drugs, smoking, the current treatment of infertility, hypertension, cardiovascular diseases, Cushing’s syndrome, and finally, allergy to spearmint, ginger, cinnamon, and C. sinensis.
The sample size was calculated as 20 individuals per group, 95% confidence interval, 80% power, ∂ = 0.5, ε = 0.1, and α = 0.05. The final sample was estimated as 25 women considering a 25% probable drop-out for each group.
The Ethics Committee of Tabriz University of Medical Science authorized the research protocol (Code: TBZMED.REC.1394.576) on 2015-11-26 and the research was certified in the Iranian Registry of Clinical Trial Website (IRCT201509295563N7) on 2016-01-09.
All study subjects were explained about the purpose of the study, and informed consent was obtained by a member of the research team. They were also asked to record their routine daily intake of food during 3 months of the study. Women were randomly allocated to three groups. After spontaneous or progestin-induced (a single intramuscular injection of 100 mg progesterone at the end of the 35th day of the menstrual cycle after a β-hCG test for ruling out the possibility of pregnancy) menstrual cycles, group 1 (n = 20) received routine treatment with a clomiphene citrate (CC) pill of 50–150 mg from day 3 to 5 of menstruation for 5 days. Group 2 (n = 20) consumed a 700 mg herbal mixture capsule daily and group 3 (n = 20) used a 700 mg herbal mixture capsule along with CC for 3 months. Additionally, the compliance of the subjects was followed up via phone consultation every week.
Randomization
The subjects were divided into three groups by using random allocation software (RAS, version 1.0.0) through randomized blocks of three and six with an allocation ratio of 1 : 1 : 1 by a person who was not involved in the study. For allocation concealment, according to the sequence generation the opaque and sealed envelopes were numbered from 1 to 75 and the type of allocation was placed into these envelopes. The first envelope was dedicated to the first subject and this process continued up to the end of the research. It is worth mentioning that only the statistician was blind in this study.
Data collection
A socio-demographic and clinical feature questionnaire was developed to assess the age, marital age, weight, BMI, the history and type of infertility, hirsutism, acne, oligomenorrhea, and amenorrhea.
Serum sample collection
On the second day of the women’s menstrual cycle, 10 ml blood samples were collected twice before and after the intervention (3 months later) from antecubital veins in the morning after overnight fasting. The blood samples were then centrifuged for 10 min at 4000 rpm in order to separate the serum. The extracted serum was divided into four aliquot samples and was frozen immediately at –70°C until assay. All laboratory tests were conducted at the same laboratory and by an expert before and after the intervention.
Sexual and thyroid hormone measurement
The levels of FSH, LH, TT, and E2, as well as TSH, FT4, and FT3 were measured by the electrochemiluminescence (ECL) method using a Cobas E 411 analyzer (Germany).
Free testosterone measurement
The level of T was determined by the ELISA method using a commercial kit (free testosterone: Monobind Inc., lake Forest, CA, USA).
Insulin measurement
Insulin was evaluated through a fully automated chemiluminescence assay (LIAISON C-Peptid, Byk-Sangtec) [33].
Fasting blood sugar measurement
Fasting blood sugar (FBS) was measured by enzymatic methods using commercial kits (Pars Azemun, Iran) and the auto-analyzer system (Selectra E, Vitalab, Netherland).
HOMA-IR measurement
The homeostatic model assessment of insulin resistance was calculated according to the  The 75th percentile of HOMA-IR in the whole population is 3.027, in normal weight 1.68 and obese 3.42.
Lipid profile measurement
TC, TG, LDL, HDL, and VLDL were determined by an auto-analyzer system (Vita lab Selectra E, Netherlands).
Ultrasonography
The volume of the ovary, along with the numbers and the size of follicles, was probed by vaginal ultrasound (5 MHz Ultramark 4 Plus; Advanced Technology Laboratories, Bothell, WA).
Clinical Feature Checklist
Information about acne and hirsutism were asked at the end of the 3-month treatment, amenorrhea and oligomenorrhea were followed up 3 months after the intervention, and finally, pregnancy was checked every 3 months of intervention and the checklists were filled out by the researcher.
Side effects checklist
A checklist on the side effects of the medications was given to the participants in order to complete during the intervention.
Medicinal plants and capsule (700 mg) preparation and standardization
The dried plant samples consisting of the leaves of spearmint, the rhizomes of ginger, the bark of cinnamon, and the peels of C. sinensis were provided from the herbal medicine market and identified by the Department of Pharmacognosy, Faculty of Pharmacy, Tabriz University of Medical Sciences, Tabriz, Iran. Different plant samples were thoroughly powdered and sieved and the powders were mixed with 5 (250 mg) : 4 (200 mg) : 3 (150 mg) : 2 (100 mg) weight ratios of spearmint, ginger, cinnamon, and C. sinensis, respectively.
Since antioxidant activity increased proportionally to the polyphenol component and had a tremendous effect on the treatment of PCOS, different proportions of each herb powder were mixed and then phenol and flavonoid were measured in the standardization of the herbal mixture. The highest levels of phenol and flavonoid were obtained in the weight ratios of 5 (250 mg) spearmint: 4 (200 mg) ginger : 3 (150 mg) cinnamon : 2 (100 mg) C. sinensis. Finally, the obtained ratio was used for the preparation of 700 mg capsules. The lethal dose value (LD50) of cinnamon is 1850 ±37 mg/kg in the animals, which is equivalent to a human dose of 11.4 ±0.2 g/kg [34] and that of C. sinensis, ginger, and spearmint is 4837.5 mg/kg [35], 5 g/kg [36], and 5000 mg/kg [37], respectively.
Total phenol content (TPC)
The total amount of the phenolic components was determined by the Folin-Ciocalteu method. About 1 ml of methanolic extract (5 mg/ml in acetone-water solution) was mixed with 200 μl of Folin-Ciocalteu reagent and 1 ml of 2% Na2CO3 and the new solution was incubated for 30 min at room temperature. Then, the absorbance was determined at 750 nm using a spectrophotometer (Spectronic Genesys 5). Various concentrations of gallic acid were used as the standard while the control samples contained no extract. All evaluations were performed in triplicate.
Total flavonoid content (TFC)
The total flavonoids were estimated using the AlCl3 method. 80% methanol was applied as the test solution. In addition, 133 mg of crystalline AlCl3 and 400 mg of crystalline NaCOOCH3 were dissolved in 100 ml of 80% methanol and used as the AlCl3 reagent. To estimate the flavonoid content of the extract, 2 ml of the extract solution, 400 μl of water, and 1 ml of the AlCl3 reagent were mixed and the absorbance was set at 430 nm using a spectrophotometer (Spectronic Genesys 5). The blank solution containing no AlCl3 reagent and with different concentrations of quercetin were utilized as the standard. The amount of flavonoids was estimated according to the calibration curve of the quercetin as well. All measurements were performed in triplicate.
Statistical analysis
Descriptive statistics, including the frequency and percentage, and the measures of central tendency and dispersion, namely, the mean and standard deviation, were employed to describe the study variables. The results were analyzed using one-way ANOVA by post-hoc Tukey test for the baseline quantitative variables. The paired t-test was applied to compare quantitative data before and after the trial within the three groups and ANCOVA was used for between-group analysis after the intervention adjusted for baseline values. In addition, between-group analysis for nominal and rating variables was performed by χ2 and independent samples Kruskal-Wallis tests and within-group comparisons were conducted by Mann-Whitney U and Wilcoxon signed rank tests. A p-value ≤ 0.05 was considered statistically significant. The data were analyzed using SPSS software, version 22 (SPSS Inc., Chicago, IL, USA).
Results
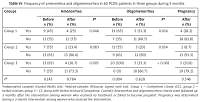
The initial sample included 90 women with PCOS, but 11 of them were excluded because they did not meet the Rotterdam criteria and 4 women’s husbands suffered from azoospermia. Then, 75 participants were randomly allocated to three groups including CC, herbal mixture, and CC with the herbal mixture, each containing 25 women. Next, 22/25 women in group 1, 23/25 women in group 2, and 24/25 women in group 3 received the allocated intervention. However, 3, 2, and 1 of them in groups 1, 2, and 3 felt no comfort for participation, respectively. During the follow-up stage, one subject in group 1 was lost to follow-up because of consuming other medications along with the treatment and one of them became pregnant. Further, two subjects in group 2 discontinued the intervention on account of deciding to initiate treatment with IUI or IVF and one of them became pregnant, and finally, two subjects in group 3 decided on IUI or IVF treatment and two of them became pregnant. Eventually, 60 women (n = 20 in each group) completed the intervention and were analyzed at the end of 3 months (Figure 1).
Figure 1
Flow diagram of polycystic ovary syndrome (PCOS) patients
Group 1 – clomiphene citrate (CC), group 2 – herbal mixture, group 3 – CC along with herbal mixture.
Before the intervention, there were no significant differences between the groups in terms of socio-demographic characteristics. The mean ± standard deviation (SD) of age in groups 1, 2, and 3 was 25.0 ±3.8, 26.2 ±4.4, and 25.7 ±4.2 years, respectively. About 15% of women in group 1 and 2 versus 5% in group 3 had a history of abortion. Furthermore, the number of cases of primary and secondary infertility was 18 (90%) and 2 (10%) in group 1, 16 (80%) and 4 (20%) in group 2, and 19 (95%) and 1 (5%) in group 3, respectively. None of the subjects were smokers (Table I).
Table I
General characteristics of the women with PCOS at baseline and after the intervention
| Variable | Group 1 (n = 20) | Group 2 (n = 20) | Group 3 (n = 20) | P-value |
|---|---|---|---|---|
| Maternal data: | ||||
| Age, mean (SD) [years] | 25.0 (3.8) | 26.2 (4.4) | 25.7 (4.2) | 0.685† |
| 20–25, n (%) | 14 (70) | 8 (40) | 12 (60) | 0.288§ |
| 26–30, n (%) | 4 (20) | 10 (50) | 5 (25) | |
| 31–35, n (%) | 2 (10) | 2 (10) | 3 (15) | |
| Marital age, mean (SD) [years] | 20.7 (3.7) | 20.1 (3.7) | 19.7 (2.9) | 0.689† |
| History of infertility, mean (SD) [years] | 3.1 (1.4) | 4.3 (4.2) | 4.2 (2.7) | 0.374† |
| History of abortion, n (%) | 3 (15) | 3 (15) | 1 (5) | 0.481§ |
| Weight, baseline, mean (SD) [kg] | 72.8 (11.7) | 76.0 (11.0) | 72.6 (11.6) | 0.597† |
| BMI, baseline, mean (SD) [kg/m2] | 27.1 (4.1) | 28.5 (3.4) | 26.9 (3.9) | 0.415† |
| BMI, after intervention, mean (SD) [kg/m2] | 26.9 (0.2) | 27.0 (0.2) | 26.8 (0.2) | 0.770Ą |
| Type of infertility, n (%): | 0.250§ | |||
| Primary | 18 (90) | 16 (80) | 19 (95) | |
| Secondary | 2 (10) | 4 (20) | 1 (5) | |
| Smoking, none, n (%) | 20 (100) | 20 (100) | 20 (100) | |
Moreover, no significant differences were observed between the groups regarding the serum levels of FSH (p = 0.626), LH (p = 0.989), LH/FSH (p = 0.676), T (p = 0.466), TT (p = 0.775), and E2 (p = 0.266) before the intervention. Conversely, a significant difference was found between the groups respecting LH (p < 0.001), LH/FSH (p < 0.001), T (p < 0.001), and TT (p = 0.018) except for E2 (p = 173) and FSH (p = 0.152) after the intervention with adjustment of baseline values. In binary comparison, the level of LH (aMD = 4.9; 95% CI: 3.7–6.2, p < 0.001) and LH/FSH (aMD = 0.9; 95% CI: 0.7–1.2, p < 0.001) in group 2 indicated a significant difference in comparison with group 1 as well. Additionally, the level of TT in group 2 and the level of T in group 3 were decreased (aMD = –0.12; 95% CI: –0.2 to –0.01, p = 0.022) and (aMD = –6.0; 95% CI: –9.7 to –2.3, p < 0.001), which were significant compared to group 1. However, the level of FSH in both groups 2 (p = 0.831) and 3 (p = 0.545), the level of LH in group 3 (p = 0.999), the level of LH/FSH in group 3 (p = 0.973), the level of T in group 2 (p = 0.204), the level of TT in group 3 (p = 0.099), and the level of E2 in both groups 2 (p = 0.995) and 3 (p = 0.332) were not significant compared to group 1. In within-group analysis, there was a significant decrease in terms of LH in group 1 (MD = –7.5; 95% CI: –9.7 to –5.2, p < 0.001), group 2 (MD = –2.4; 95% CI: –2.9 to –1.9, p < 0.001), and group 3 (MD = –7.6; 95% CI: –9.6 to –5.5, p < 0.001) after the intervention compared to the baseline. In addition, the level of LH/FSH in group 1 (MD = –2.3; 95% CI: –2.9 to –1.6, p < 0.001), group 2 (MD = –1.0; 95% CI: –1.2 to –0.8, p < 0.001), and group 3 (MD = –2.2; 95% CI: –2.8 to –1.7, p < 0.001) decreased significantly. Further, a significant decline was detected in the level of T only in group 3 (MD = –6.7; 95% CI: –9.5 to –3.9, p < 0.001), as well as the level of TT only in group 2 (MD = –0.08; 95% CI: –0.13 to –0.03, p = 0.003). However, the level of FSH in group 1 (MD = 0.9; 95% CI: 0.7–1.2, p < 0.001), group 2 (MD = 0.9; 95% CI: 0.7–1.2, p < 0.001), and group 3 (MD = 0.8; 95% CI: 0.4–1.1, p < 0.001) in addition to the level of E2 in group 1 (MD = 7.5; 95% CI: 3.5–11.4, p < 0.001), group 2 (MD = 9.9; 95% CI: 6.1–13.9, p < 0.001), and group 3 (MD = 10.8; 95% CI: 5.8–15.8, p < 0.001) significantly increased compared to the baseline. Moreover, there were no significant alterations between the groups regarding the T in groups 1 and 2, as well as TT in groups 1 and 3 (p > 0.05), the details of which are shown in Table II.
Table II
Effect of CC, herbal mixture, and CC, along with herbal mixture on FSH, LH, LH/FSH, T, TT, and E2
[i] Data are presented as mean ± SD for 20 PCOS patients in each group, FSH – follicle-stimulating hormone, LH – luteinizing hormone, T – free testosterone, TT – total testosterone, E2 – estradiol, group 1 – clomiphene citrate (CC), group 2 – herbal mixture, group 3 – CC with herbal mixture (Clomiphene: Control). 2×1The difference between group 2 and group 1 after the intervention, 3×1the difference between group 3 and group 1 after the intervention. All numbers are given as mean (SD) except for those specified as MD (95% CI) or P-value, MD (95% CI) – mean differences (95% confidence interval). P† – Paired-samples t test for within-group comparison. P0 – One-way ANOVA for between-group comparison at the baseline. P1 – Analysis of covariance for between-group comparison after the intervention adjusted for the baseline.
Table III presents the results related to the effect of CC, herbal mixture, and CC along with herbal mixture on HOMA-IR, TC, TG, LDL-C, HDL-C, VLDL-C, TSH, Free T4, and Free T3. Based on the findings, the serum levels of HOMA-IR (p = 0.188) and lipid profile including TG (p = 0.061), LDL-C (p = 0.070), HDL-C (p = 0.176), and VLDL-C (p = 0.311) were not significantly different except for TC (p = 0.031) before the intervention. However, the results showed a significant difference regarding the HOMA-IR (p = 0.017), TC (p < 0.001), TG (p < 0.001), LDL-C (p < 0.001), HDL-C (p < 0.001), and VLDL-C (p < 0.001) after the intervention with adjustment for baseline values. Conversely, there were no significant differences between the groups (p > 0.05) with regard to TSH, FT4, and FT3 before and after the intervention. In binary comparison, the level of HOMA-IR indicated a significant decrease in group 2 (aMD = –1.3; 95% CI: –2.4 to –0.2, p = 0.013) in comparison with group 1. Moreover, as regards the lipid profile, the level of TC in group 2 (aMD = –21.8; 95% CI: –31.5 to –12.1, p < 0.001) and group 3 (aMD = –18.3; 95% CI: –27.4 to –9.2, p < 0.001), the level of TG in group 2 (aMD = –29.9; 95% CI: –47.9 to –12.0, p < 0.001) and group 3 (aMD = –26.9; 95% CI: –43.8 to –9.9, p < 0.001), the level of LDL-C in group 2 (aMD = –21.2; 95% CI: –31.3 to –11.1, p < 0.001) and group 3 (aMD = –21.4; 95% CI: –31.1 to –11.7, p < 0.001), as well as the level of VLDL-C in group 2 (aMD = –5.1; 95% CI: –7.5 to –2.7, p < 0.001) and group 3 (aMD = –5.9; 95% CI: –8.3 to –3.6, p < 0.001) decreased significantly. Contrarily, the level of HDL-C in group 2 (aMD = 6.8; 95% CI: 2.9–10.7, p < 0.001) and group 3 (aMD = 10.7; 95% CI: 7.2–14.7, p < 0.001) increased significantly compared to group 1. However, there were no remarkable changes in the level of HOMA-IR in group 3 (p = 0.403) and thyroid hormones including TSH in group 2 (p = 0.973) and group 3 (p = 0.949), FT4 in group 2 (p = 0.809) and group 3 (p = 1), and finally, FT3 in group 2 (p = 0.940) and group 3 (p = 0.864) compared to group 1. In within-group analysis, a significant reduction was observed after the intervention in terms of HOMA-IR in group 2 (MD = –1.0; 95% CI: –1.7 to –0.4, p = 0.002), as well as lipid profiles such as TC in group 2 (MD = –27.6; 95% CI: –36.2 to –19.0, p < 0.001) and group 3 (MD = –22.2; 95% CI: –28.9 to –15.4, p < 0.001), TG in group 2 (MD = –50.7; 95% CI: –73.8 to –27.6, p < 0.001) and group 3 (MD = –39.4; 95% CI: –56.2 to –22.4, p < 0.001), the level of LDL-C in group 2 (MD = –25.6; 95% CI: –34.2 to –17.0, p < 0.001) and group 3 (MD = –24.9; 95% CI: –32.9 to –16.9, p < 0.001), and the level of VLDL-C in group 2 (MD = –7.3; 95% CI: –10.4 to –4.2, p < 0.001) and group 3 (MD = –7.7; 95% CI: –10.9 to –4.4, p < 0.001) compared to the baseline. However, the level of HDL-C increased significantly in both groups 2 (MD = 5.1; 95% CI: 2.6–7.7, p < 0.001) and 3 (MD = 10.4; 95% CI: 7.1–13.7, p < 0.001). Overall, there was no significant intra-group alteration regarding the HOMA-IR, TC, TG, LDL-C, and VLDL-C in group 1 (p > 0.05), as well as TSH, FT3, and FT4 in all three groups (p > 0.05).
Table III
Effects of CC, herbal mixture, and CC along with herbal mixture on HOMA-IR, TC, TG, LDL-C, HDL-C, VLDL-C, TSH, free T4, and free T3
[i] HOMA-IR – homeostatic model assessment for insulin resistance, TC – total cholesterol, TG – triglycerides, LDL-C – low-density lipoprotein cholesterol, HDL-C – high-density lipoprotein, VLDL-C – very-low-density lipoprotein cholesterol, TSH – thyroid-stimulating hormone, free T4 – free thyroxine, free T3 – free triiodothyronine, group 1 – clomiphene citrate (CC), group 2 – herbal mixture, group 3 – CC with herbal mixture (Clomiphene – Control), 2×1Difference between group 2 and group 1 after the intervention, 3×1Difference between group 3 and group 1 after the intervention. All numbers are given as mean (SD) except for those specified as MD (95% CI) or P-value, MD (95% CI) – mean differences (95% confidence interval). P† – paired-samples t test for within-group comparison, P0 – one-way ANOVA for between-group comparison at the baseline, P1 – analysis of covariance for between-group comparison after the intervention adjusted for the baseline. Data are presented as mean ± SD for 20 PCOS patients in each group.
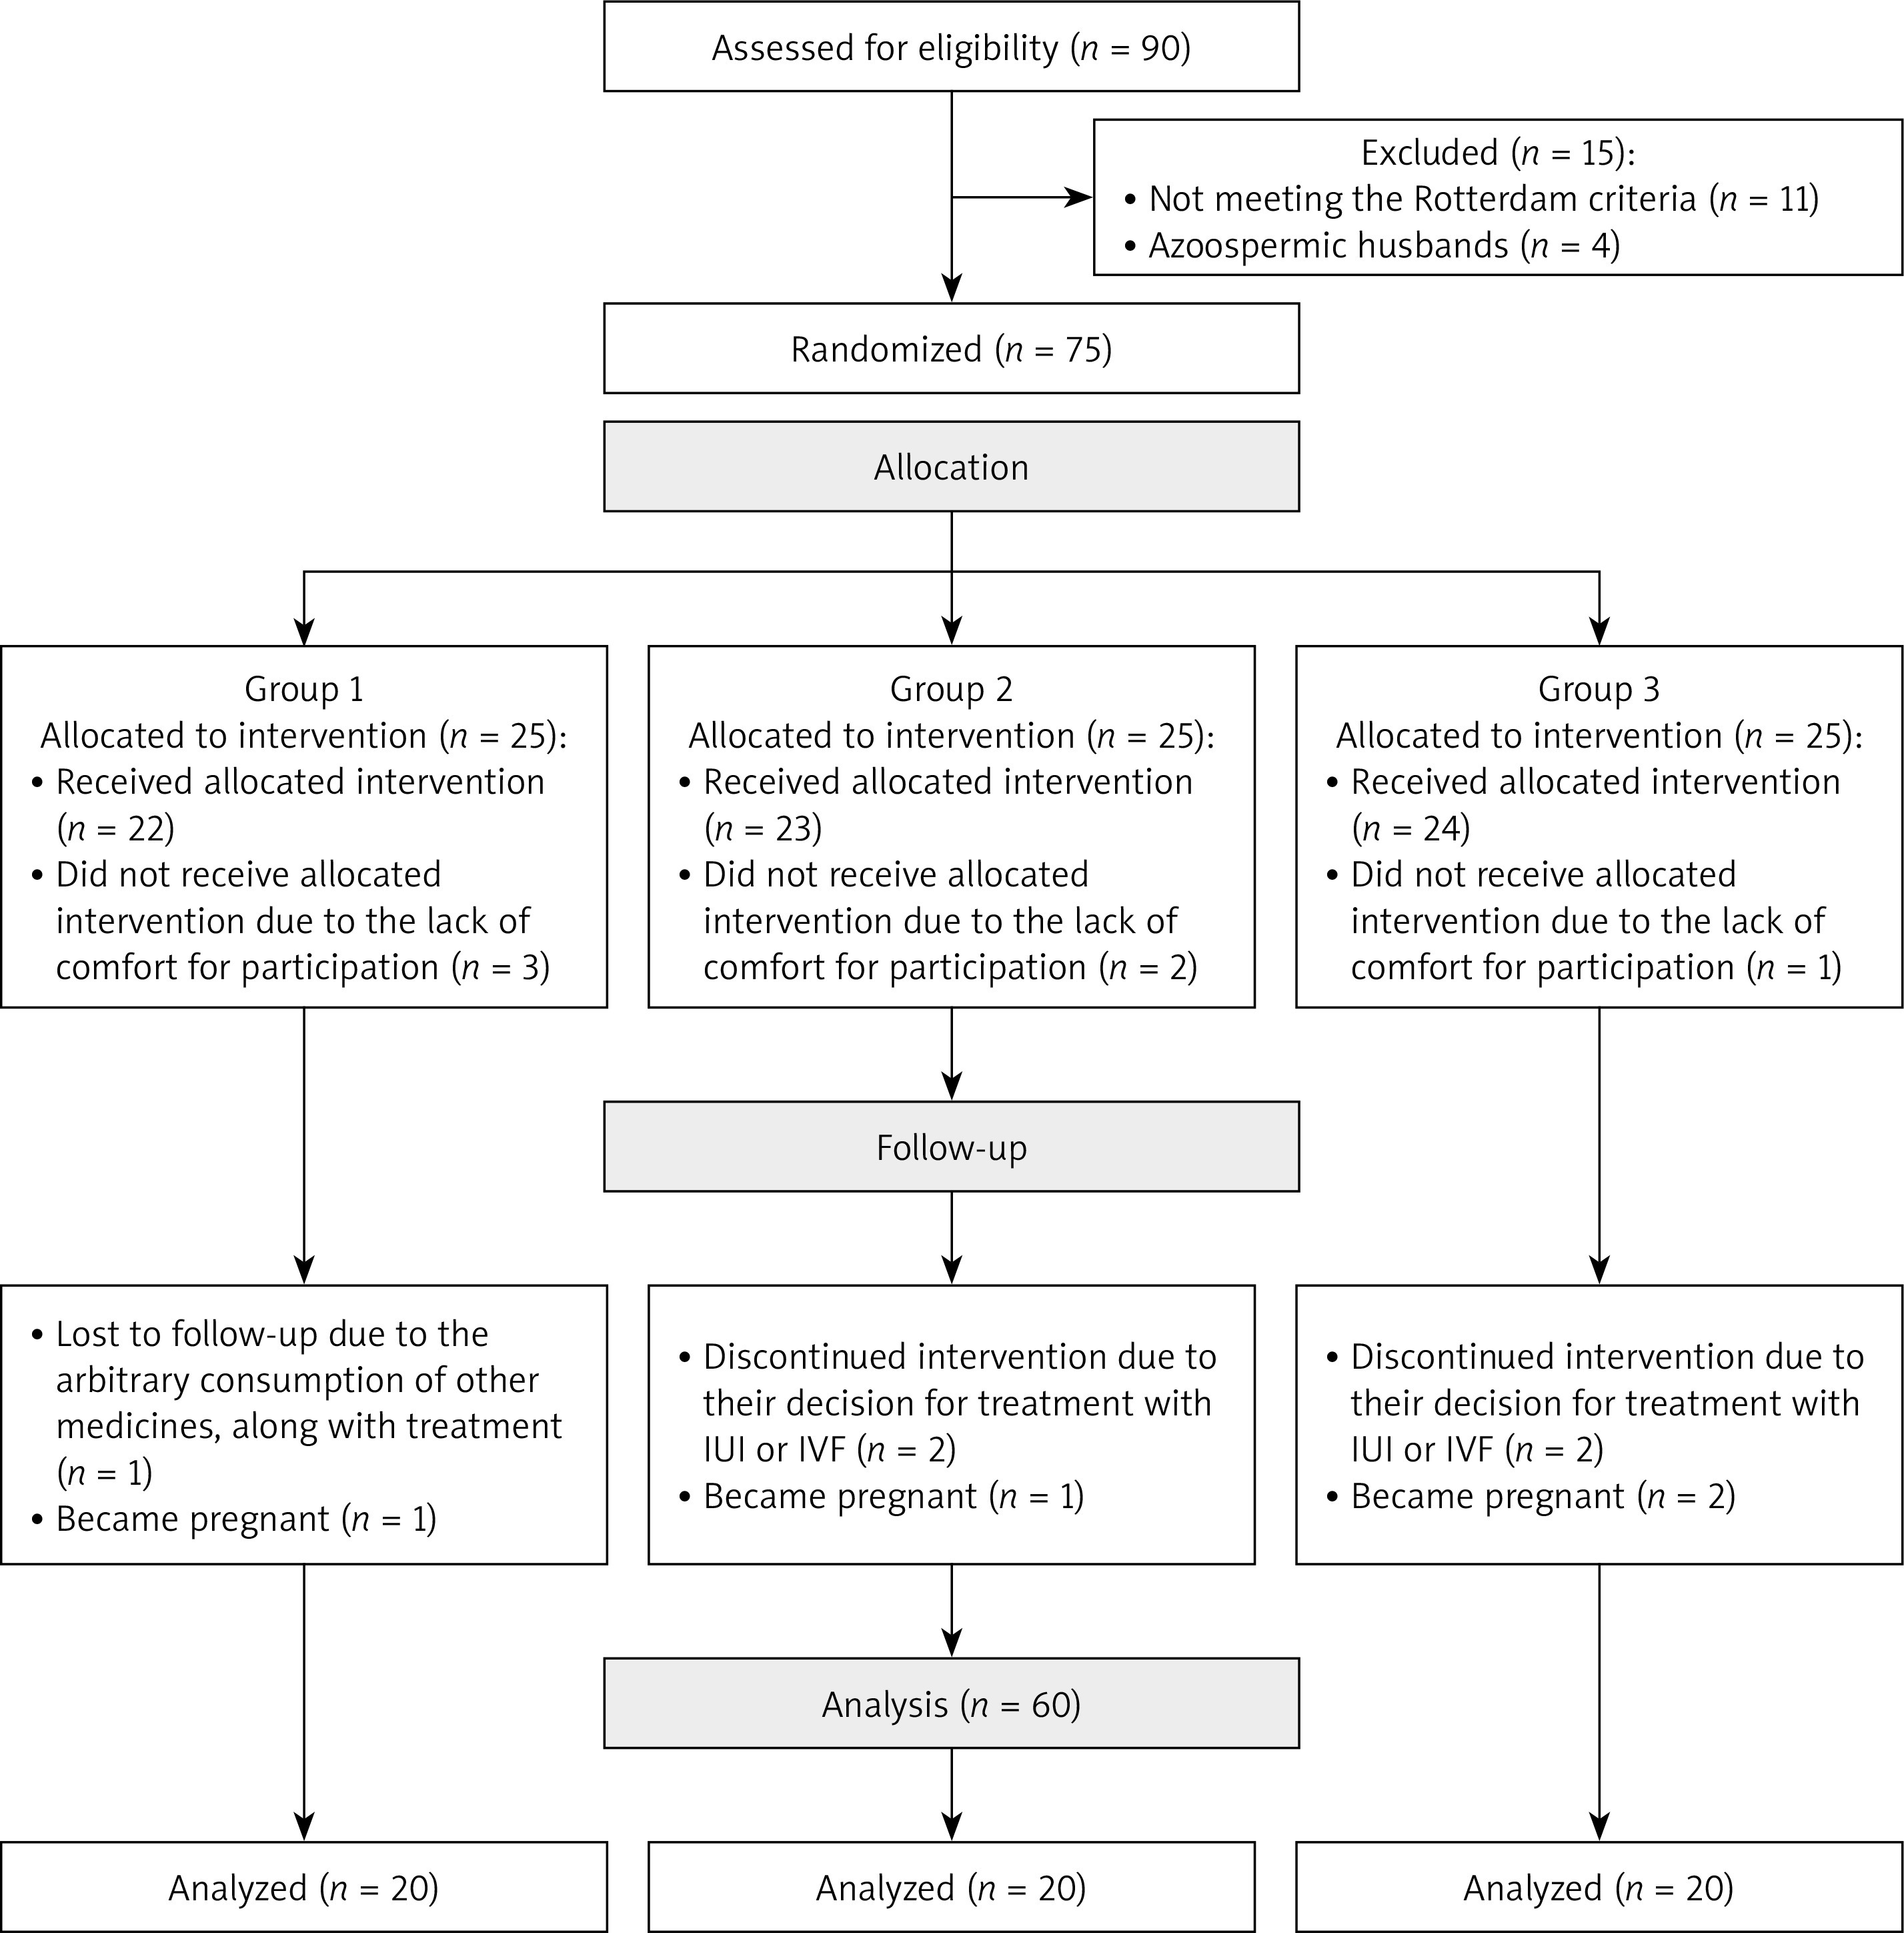
According to the obtained data regarding the frequency of acne in 60 PCOS patients before and after the intervention (Table IV), acne significantly improved after the 3-month intervention in comparison with the baseline in all three groups (p = 0.011, p = 0.008, and p < 0.001 for groups 1, 2, and 3, respectively). However, no significant difference was found between the groups before and after the intervention due to a parallel reduction among the groups (p > 0.05).
Table IV
Frequency of acne in 60 PCOS patients in three groups during 3 months
| Groups | Acne | Before, n (%) | After, n (%) | P€ |
|---|---|---|---|---|
| Group 1 (n = 20) | None | 11 (55) | 13 (65) | 0.011 |
| Mild | 3 (15) | 6 (30) | ||
| Moderate | 5 (25) | 1 (5) | ||
| Severe | 1 (5) | 0 (0) | ||
| Group 2 (n = 20) | None | 8 (40) | 12 (60) | 0.008 |
| Mild | 3 (15) | 5 (25) | ||
| Moderate | 7 (35) | 2 (10) | ||
| Severe | 2 (10) | 1 (5) | ||
| Group 3 (n = 20) | None | 9 (45) | 12 (60) | 0.001 |
| Mild | 3 (15) | 7 (35) | ||
| Moderate | 6 (30) | 1 (5) | ||
| p£ | 0.550 | 0.878 |
In the case of hirsutism, a considerable number of patients improved significantly in group 1 (p = 0.023), group 2 (p = 0.001), and group 3 (p = 0.001). Although there was no significant difference between the groups before the intervention, the difference among the groups became significant after the treatment (p < 0.001), the related data are provided in Table V.
Table V
Percentage of hirsutism in 60 PCOS patients in three groups during 3 months
| Groups | Hirsutism | Before, n (%) | After, n (%) | P€ |
|---|---|---|---|---|
| Group 1 (n = 20) | None | 4 (20) | 6 (30) | 0.023 |
| Mild | 6 (30) | 8 (40) | ||
| Moderate | 4 (20) | 2 (10) | ||
| Severe | 6 (30) | 4 (20) | ||
| Group 2 (n = 20) | None | 7 (35) | 16 (80) | 0.001 |
| Mild | 9 (45) | 4 (20) | ||
| Moderate | 1 (5) | 0 (0) | ||
| Severe | 3 (15) | 0 (0) | ||
| Group 3 (n = 20) | None | 3 (15) | 7 (35) | 0.001 |
| Mild | 6 (30) | 11 (55) | ||
| Moderate | 4 (20) | 2 (10) | ||
| Severe | 7 (35) | 0 (0) | ||
| P£ | 0.094 | 0.001 |
Table VI presents the amount of amenorrhea and oligomenorrhea in 60 PCOS patients in three groups over 3 months. In group 1, 31.3% (vs. 65% at the baseline), and in group 2, 20% (vs. 55% at the baseline) of the subjects had oligomenorrhea after the intervention (p = 0.014 and p = 0.014, respectively). In addition, 33.3% of the subjects of group 3 suffered from oligomenorrhea (vs. 100% at the baseline) after the intervention (p < 0.001). Furthermore, 25% (vs. 45% at the baseline) of the subjects in group 1 and 26.7% (vs. 65% at the baseline) of them in group 3 had amenorrhea (p = 0.46 and p = 0.005, respectively) while 13.4% (vs. 35% at the baseline) of the subjects of group 2 suffered from amenorrhea, but the difference between the groups was not significant (p = 0.083).
Table VI
Frequency of amenorrhea and oligomenorrhea in 60 PCOS patients in three groups during 3 months
| Groups | Amenorrhea | Oligomenorrhea | Pregnancy | |||||
|---|---|---|---|---|---|---|---|---|
| Before n (%) | After n (%) | P€ | Before n (%) | After n (%) | P€ | After n (%) | ||
| Group 1 | Yes | 9 (45) | 4 (25) | 0.046 | 13 (65) | 5 (31.3) | 0.014 | 4 (18.2) |
| No | 11 (55) | 12 (75) | 7 (35) | 11 (68.7) | 18 (81.8) | |||
| Group 2 | Yes | 7 (35) | 2 (13.4) | 0.083 | 11 (55) | 3 (20) | 0.014 | 2 (8.7) |
| No | 13 (65) | 13 (86.6) | 9 (45) | 12 (80) | 21 (91.3) | |||
| Group 3 | Yes | 13 (65) | 4 (26.7) | 0.005 | 20 (100) | 5 (33.3) | < 0.001 | 5 (20.8) |
| No | 7 (35) | 11 (73.3) | 0 (0) | 10 (66.7) | 19 (79.2) | |||
| P£ | 0.145 | 0.784 | 0.004 | 0.628 | 0.546 | |||
€ related-samples Wilcoxon signed rank test. Group 1 – clomiphene citrate (CC), group 2 – herbal mixture, group 3 – CC along with herbal mixture (Clomiphene: Control); Amenorrhea and oligomenorrhea criteria were followed up 3 months after the intervention among women who received no treatment or failed to become pregnant. Pregnancy was determined during a 3-month intervention among women who received the intervention.
The ultrasonography criteria for PCOS women indicated no significant variations in the number, the size of basal antral follicle count (AFC), and the volume of the ovary in all three groups on the second day of the menstruation cycle after the three-month treatment, which were 10–12, 2–12 mm, and 10 cm3, respectively. Meanwhile, sonography in the mid-cycle of the third month showed that in group 1, the antral follicles of 14/20 patients reached the ovulation stage and four of them became pregnant (18.2%). In group 2, 11/20 PCOS women showed dominant follicles and two of them got pregnant (8.7%). Finally, in group 3, 17/20 PCOS subjects had dominant follicles (18–20 mm) which resulted in five pregnancies (20.8%, one of which was a twin pregnancy).
No side effects were reported in all three study groups during the 12-week intervention, the compliance was good and the subjects consumed the prescribed supplements during the study period.
Eventually, the assessment of TPC and TFC contents proved the presence of 24.062 ±0.2 mg gallic acid/100 mg and 8.93 ±0.09 mg quercetin/100 mg in the herbal mixture.
Discussion
This study was conducted to investigate the effect of a herbal mixture, CC, and the herbal mixture along with CC on clinical and para-clinical parameters in infertile women with PCOS. According to the results, the potency of CC was much greater in reducing the serum level of LH and LH/FSH, which were measured on the 2nd day of the menstrual cycle, compared to the herbal mixture. In addition, the reduction in level of T in the group of subjects who consumed CC along with the herbal mixture was more significant in comparison with CC. However, the level of TT decreased notably in the herbal mixture group compared to CC.
In fact, hyperinsulinemia, as one of the significant features in the development of PCOS, stimulates androgen production through 3 mechanisms. First, hyperinsulinemia increases the circulation of T by reducing the concentration of serum sex hormone-binding globulin (SHBG), which is a glycoprotein that binds to T [38]. Then, hyperinsulinemia increases the synthesis of androgens by enhancing the activity of cytochrome P450c-17α in PCOS women [39]. Finally, insulin decreases the insulin-like growth factor binding protein-1 (IGFBP-1) synthesis, which results in greater availability of insulin-like growth factor in the ovary, thus boosting the androgen production via theca-interstitial and stromal cells [40]. In PCOS, the hypothalamic-pituitary-ovarian axis is implicated and the disturbance in the pulsatility of GnRH causes a relative increase of LH to FSH. Also, the abnormal feedback mechanism by ovarian estrogen is probably responsible for increasing the LH release [41].
CC is a nonsteroidal selective estrogen-receptor modulator that inhibits the estrogen receptors in the hypothalamus, as well as the negative feedback effect of the estrogen on gonadotropin release, leading to the up-regulation of the hypothalamic-pituitary-gonadal axis [42]. Further, CC, as the first-line therapy for ovulation induction, still has a high failure rate. However, CC usage for more than six cycles was found to have a high risk of ovarian cancer in these patients [43]. Therefore, in the current study, as in a previous study [44], herbal-mediated supplementation along with CC was used as complementary medicine that might reduce the treatment duration while increasing the efficacy.
Heibashy et al. reported that cinnamon extract reduced T [45]. Anti-androgenic effects of spearmint decreased the levels of LH, as well as free and TT as well [31]. Ginger plays a crucial role in the improvement of PCOS through reducing T and LH and improving ovulation [46]. Furthermore, at higher doses, ginger was found to have similar efficacy as CC but without any side effects. Moreover, it can be used as an effective and good alternative for improving PCOS by decreasing the LH and estrogen while notably increasing progesterone and FSH concentrations [47]. The findings of all the above-mentioned studies are in line with the results of the current study.
Additionally, our results clearly demonstrated that the level of HOMA-IR decreased more significantly in the group that consumed the herbal mixture in comparison with CC. Moreover, the level of lipid profile (TC, TG, LDL-C, VLDL-C) in both the herbal mixture and CC along with herbal mixture groups decreased significantly. However, the level of HDL-C increased remarkably as compared to CC.
In fact, high blood glucose induces reactive oxidative stress (ROS), which results in the derivation of superoxide [48]. As a consequence, reactive species play a key role in insulin resistance by impairing the glucose uptake and reducing the insulin secretion from pancreatic β cells [49].
Furthermore, insulin resistance inhibits hepatic lipase activity in the liver and reduces hormone-sensitive lipase in adipose tissue, leading to the release of free fatty acids and inflammatory cytokines such as interleukin 6 (IL-6), tumor necrosis factor α (TNF-α), and leptin [50].
One study claimed that cinnamon polyphenols and proanthocyanidin content have an insulin-like and hypoglycemic effect and thus induce the pancreas to release insulin [51]. The reductive effects of cinnamon on total cholesterol and FBS levels in type II diabetes patients were proven as well [52]. Additionally, it was shown that the phenolic compound of spearmint has reducing power, possesses hypoglycemic, hypocholesterolemic, and antioxidant attributes, and increases the HDL level [53]. In addition, polyphenols from ginger, including gingerols and shogaols, have antidiabetic potency [54]. Based on the results of another study, ginger possesses hypoglycemic, hypolipidemic, and hypocholesterolemic potential. In other words, the mechanism of the hypoglycemic action of ginger might be due to serotonin receptors that activate the β-cells of the pancreas in order to release insulin [55]. Polymethoxylated flavones of C. sinensis improve the insulin resistance by regulating the adipocytokines [56]. It has been shown that C. sinensis has the potential for lowering the cholesterol, TG, and LDL levels, as well as raising the HDL level [57]. Particularly, Khaki et al. used a combination of ginger and cinnamon in diabetic male rats and found that FBS and insulin levels decreased more significantly compared to the other groups, which consumed only one herb [58]. Each of these herbs has the potential for reducing insulin resistance, as well as the lipid profile, and in the present study, the same results were obtained in the mixture model as well.
Recent research has confirmed that vitamin D3 supplementation has a beneficial effect on HOMAIR and dyslipidemia [59]. Furthermore, in one of the latest studies comparing the HOMA-IR method and insulin resistance (Belfiore) index, it was concluded that insulin resistance (Belfiore) index diagnosed more cases of insulin resistance in women with PCOS compared to HOMA-IR [60].
Likewise, the analysis of clinical features demonstrated that after the 12-week intervention, the frequency of hirsutism and acne improved in all three groups. Moreover, oligomenorrhea and amenorrhea criteria improved compared to the baseline. The pregnancy rate occurred in all three groups during the 3-month intervention as well.
The reduction of sensitivity of pre-antral follicles to FSH or the enhancement of the follicular activity of LH leading to the inhibition of follicle maturation is considered as the main cause of PCOS [61]. Similarly, the excessive secretion of LH and GnRH stimulates the ovarian theca cells in order to produce androgens [62]. As a result, hyper-androgenism not only arrests the antral follicle growth but also stimulates apoptosis of its granulose cells which converts androgen to estradiol by aromatase enzyme [63]. On the other hand, the interaction of LH with insulin leads to the improper differentiation of granulosa cells and arrests the follicle growth and ovulation and causes irregular menses [64].
According to Kort et al. cinnamon improved ovulatory menses by enhancing progesterone levels in the luteal phase of PCOS women [20]. Similarly, spearmint, by reducing the level of T and having antioxidant properties, matured follicles and induced ovulation, and also improved hirsutism [32]. Additionally, Matiz et al. reported the antimicrobial activity of C. sinensis and sweet basil in treating acne [65]. Ginger not only stimulates blood circulation for the treatment of inflammation but also has good effects in relieving menstrual dysmenorrhea and irregularities [66]. Jiang et al. further showed that ginger enhanced the AFC and ovarian reserve [67]. CC stimulates ovulation and increases the fertility rate by stimulating GnRH secretion and an anti-estrogenic effect as well [68].
The results of the present study indicate that a herbal mixture such as the combination of CC with herbal mixture decreases the lipid profile. Additionally, CC regulates sex steroids while not interfering with the lipolysis effect of the herbal mixture.
One of the strong points of this study was to evaluate the effect of the herbal mixture, alone and in combination with CC compared to CC, on clinical and para-clinical parameters in infertile PCOS women. Furthermore, in previous studies, the effects of all the aforementioned herbs were investigated separately whereas in this study we measured a mixture of such herbs as a new combination that might have synergistic effects.
This study had some limitations including its small sample population, the evaluation of oxidative stress, and short duration of the study. Therefore, further studies are needed to evaluate the effects of this mixture on longer duration and variable doses of the herbal mixture at larger sample size, and prescribe a healthy diet and exercise alongside intervention. Moreover, more cellular and molecular studies are required to elucidate the underlying mechanisms of each herb or their mixture in ameliorating hormonal disturbances in PCOS.
In conclusion, the herbal mixture reduces HOMA-IR. In addition, both the herbal mixture and the combination of CC with herbal mixture reduce lipid profile, and CC regulates the levels of LH, FSH, and LH/FSH. Further, the herbal mixture and the combination of CC with herbal mixture reduce total testosterone and free testosterone, respectively, and each group improves the clinical features. The rate of pregnancy in the combination of CC with the herbal mixture was higher than that of the remaining groups. This herbal mixture could be used as a supplement in treating PCOS disorders without side effects. Considering the fact that hyperinsulinemia is one of the significant features in the development of PCOS, the use of herbal mixture alongside CC could be an appropriate complementary therapy in infertile PCOS patients.