
Abstract
The Mercury Imaging X-ray Spectrometer is a highly novel instrument that is designed to map Mercury’s elemental composition from orbit at two angular resolutions. By observing the fluorescence X-rays generated when solar-coronal X-rays and charged particles interact with the surface regolith, MIXS will be able to measure the atomic composition of the upper ∼10-20 μm of Mercury’s surface on the day-side. Through precipitating particles on the night-side, MIXS will also determine the dynamic interaction of the planet’s surface with the surrounding space environment.
MIXS is composed of two complementary elements: MIXS-C is a collimated instrument which will achieve global coverage at a similar spatial resolution to that achieved (in the northern hemisphere only – i.e. ∼ 50 – 100 km) by MESSENGER; MIXS-T is the first ever X-ray telescope to be sent to another planet and will, during periods of high solar activity (or intense precipitation of charged particles), reveal the X-ray flux from Mercury at better than 10 km resolution. The design, performance, scientific goals and operations plans of the instrument are discussed, including the initial results from commissioning in space.
1 Introduction
The Mercury Imaging X-ray Spectrometer (MIXS) is an instrument aboard the BepiColombo Mercury Planetary Orbiter (MPO; Benkhoff et al. 2010; Benkhoff et al. 2020, this issue) designed to map the elemental composition of the surface of Mercury from orbit. MIXS will provide elemental composition data for the regolith and, by inference, the protoliths from which it was derived, together with providing key evidence for deep crustal and mantle compositions via excavated materials around and within complex craters and peak-ring basins, e.g. Frank et al. (2017), Hall et al. (2020). Although MIXS is only sensitive to the first 10-20 μm of the Mercurian regolith, local mixing means that this information still provides critical compositional information about the contribution of the underlying sub-surface geology (plus a small added exogenous mineralogical/chemical component). Indeed, using a lunar analogy, the regolith composition is expected to be a good proxy for the average composition of underlying crust on the regional distance scales relevant to MIXS-C (Warren 2005), with MIXS-T able to probe the more localised contributions from individual impact features associated with, for example, complex craters and basins (Hall et al. 2020). This approach has been effectively used before for Mercury, where MESSENGER’s XRS maps show clear compositional changes across geomorphologic boundaries (such as the edges of the smooth plains units occupying the Caloris and Rachmaninoff basins) supporting the assertion that the upper regolith surface reflects the underlying bedrock (e.g. Nittler et al. 2018). Results from lunar and asteroidal X-ray fluorescence (XRF) mappers have also provided similar interpretations about planetary regional geological variation and evolution (e.g. Crawford et al. 2009; Grande et al. 2003; Narendranath et al. 2011; Okada et al. 1999; Alder et al. 1972; Nittler et al. 2001). Identifying the magmatic history of Mercury will inform about melt composition and the processes in the planetary interior (e.g., differentiation, oxygen fugacity, partial melting, mantle heterogeneity). MIXS will build on results from the extremely successful MESSENGER mission (Solomon et al. 2018) whose X-ray spectrometer (XRS; Schlemm et al. 2007; Starr et al. 2016) has revolutionised our view of the surface of Mercury. MESSENGER’s XRS consisted of a triplet of gas proportional counters, two of which were equipped with elemental filters. Parallel data analysis was used to uniquely identify the concentration of individual elements within the instrument footprint. This complex parallel data analysis was needed as the intrinsic energy resolution of the detectors was otherwise insufficient to resolve the emission lines of the principal rock-forming elements (Al, Mg and Si).
Geochemical mapping by the MESSENGER program revealed pronounced variability in the elemental composition across the surface within compositionally different provinces on Mercury (e.g., Weider et al. 2015; Nittler et al. 2018). The variable surface compositions have been ascribed largely to melting processes and mantle heterogeneity (e.g., Namur et al. 2016), but data on terrestrial magma systems (e.g., Heinonen et al. 2019; Yang Yang et al. 2019) suggest fractional crystallization and interaction between hot high-Mg magmas and pre-existing crust may be important additional factors. Exosphere processes may be important for the distribution of moderately volatile elements (e.g., Peplowski et al. 2012). XRS identified clear correlations between the surface geochemistry and major geological features on the surface of the planet. However, of particular interest is a region of elevated Mg concentration (relative to Si) in the northern hemisphere that currently cannot be definitively explained in terms of geological features on the surface (for more detail see e.g., Rothery et al. 2020 and references therein).
BepiColombo’s surface compositional data from MIXS and the Mercury Gamma ray and Neutron Spectrometer (MGNS; Mitrofanov et al. 2010, 2020) are expected to provide a versatile geochemical database on major and minor elements that will constrain the surface regolith, crustal, and mantle processes and reservoirs in new detail. Moreover, MIXS’s imaging capability will enable correlation of elemental abundance variations (and their uncertainties) with crustal mineralogy and geological structures detected by other payloads. A key set of targets will be impact structures and associated plains, peak uplifts and ejecta (e.g., Hall et al. 2020), where MIXS-T allows probing of composition changes within sub-surface stratigraphy, by spatially resolving these features on the surface (as was proposed for the Moon using the C1XS instrument - e.g., Crawford et al. 2009). Furthermore, examples from terrestrial large igneous provinces suggest that high spatial resolution data, for a range of major and minor elements that MIXS will provide, can define compositional trends that enable distinction between variations related to partial melting, fractional crystallization, mixing and degassing processes and mantle source heterogeneity (e.g., Cox et al. 1967; Weider et al. 2015). Supportive petrological laboratory experiments on compositional analogues of Mercurian rocks and regolith are pivotal for understanding Mercurian magma systems – as are X-ray absorption and fluorescence experiments that will be used to validate the data processing pipelines.
This paper is an update of an earlier report by Fraser et al. (2010), from an early stage of the design process, describing the equipment in space after the launch of BepiColombo in October 2018. It describes the unique design of MIXS, which uses a cutting-edge detector capable of directly resolving the emission lines of the major rock-forming elements. It summarises the ground calibration of the instrument as well as post-launch operations and plans for calibration after arrival at Mercury. It then goes on to identify major scientific objectives in the context of what is known about Mercury from the MESSENGER mission and describes observations that will be possible using MIXS.
MIXS works in coordination with the Solar Intensity X-ray and particle Spectrometer (SIXS; Huovelin et al. 2020, this issue) which measures the X-ray flux from the Sun as well as charged particle populations in the vicinity of the spacecraft. SIXS data are needed to fully calibrate data returned by MIXS. The flux of X-rays onto Mercury’s surface from the Sun varies in intensity and spectral form depending on the solar state. Data from real-time monitoring of the Sun by SIXS are therefore an essential part of the MIXS calibration pipeline. MIXS and SIXS share a common data processing unit and onboard software, and their operations plans are coordinated carefully to ensure the requirements of both instruments are met.
2 Instrument Description
The MIXS instrument contains two parallel instrument channels that are mounted on a common optical bench (Fig. 1a) and designed to map X-ray emission from Mercury at two angular resolutions. The narrow-field, high resolution, telescope (MIXS-T) uses a grazing incidence optic with a 1.1° field-of-view (FoV) and approximately 10 arcminute angular resolution, while the wide-field collimator (MIXS-C) uses a radially profiled collimator to define a FoV of ∼10° full width. Both channels use an imaging solid state detector in the form of a Depleted P-channel Field Effect Transistor (DEPFET) active pixel sensor, a technology which is applied for the first time in a space environment (Treis et al. 2008). Details of the instruments are summarised in Table 1.

A: The MIXS flight model (FM) optical bench in the cleanroom at the University of Leicester prior to delivery to the European Space Agency. MIXS-T measures ∼1050 mm from its optics (front left) to the back of its focal plane assembly. B: The MIXS/SIXS FM Main Electronics Box (MEB) on a vibration table at the Instituto Nacional de Técnica Aeroespacial (INTA) in Madrid during verification testing. The box is ∼250 mm along its longest edge
The MIXS/SIXS main electronics box (MEB, Fig. 1b) contains the power supply unit (PSU) and data processing unit (DPU) which handle the packing of data into telemetry and all of the command and telemetry interfaces to the spacecraft. A high-level block diagram of the instrument is shown in Fig. 2, illustrating the architecture and the interactions between these sub-systems and the various stages that signals from MIXS and SIXS go through in order to arrive in the telemetry sent from MIXS to the spacecraft. This telemetry is carried on a “SpaceWire” connection (see European Cooperation for Space Standardization standard: ECSS-E50-12A).

Block diagram of the MIXS instrument showing the major units internal to MIXS; solid black lines indicate data and signal lines. Note that the bidirectional lines into the SpaceWire interface show the telecommands from the spacecraft to the instrument and the telemetry stream back to the spacecraft
The MIXS optical bench is located on the radiator panel of the MPO spacecraft such that the optical axes of MIXS-T and MIXS-C are nominally co-aligned with the nadir-pointing axis of the spacecraft. Co-alignment knowledge from satellite assembly and integration measurements and in-orbit calibration allows X-ray signals to be localised on the planet’s surface (or to sky coordinates when off-pointing). Calibration of the MIXS field of view relative to the spacecraft attitude control system is achieved using observations of astrophysical sources after arrival at Mercury. The primary mechanical structure consists of a sandwich baseplate of high modulus, unidirectional carbon-fibre reinforced polymer (CFRP) laminates on an aluminium honeycomb core. Both the MIXS-C and MIXS-T tubes are of monocoque construction from CFRP laminates. The major mechanical design drivers were specific elastic modulus and low thermal conductivity to ensure the equipment survived launch and maintained the large thermal gradient between the optics (∼ 100 - 150 ∘C) and the detector assembly (∼ -40 ∘C). Notably, hybrid lay-ups were selected that include both high modulus unidirectional plies and woven plies; these are tailored in different regions of the components for minimum mass.
As described more fully below, when an X-ray enters the optics at the front of the telescope or collimator, it is either collimated (MIXS-C) or focused by grazing incidence reflection (MIXS-T) towards the detector, where it is absorbed and its energy converted into a number of electron-hole pairs in the semiconducting Si layer of the detector. Electric potentials set up in each pixel confine the electrons and drift them towards a readout node that is present in every pixel, where the charge is stored until being read out. The number of electrons stored in the pixel is directly proportional to the energy of the incident X-ray, so this readout scheme preserves the location and time of the X-ray’s interaction as well as its energy. By collecting a statistical sample of X-rays from Mercury, it is possible to determine the relative abundance of different elements in the surface materials (as described below) and estimate the associated uncertainties in these measured abundances.
After the X-rays have been detected, the signals are amplified and digitised via an analogue and digital electronics chain and through various stages of firmware and software that run continuously in the front-end electronics and the MIXS/SIXS DPU. Finally, the DPU packs the information into an efficient telemetry stream to return as much scientifically useful information to ground as possible. The structure and contents of the telemetry products that will be visible to end-users are described below.
The major background contributions to MIXS’s signal come from particle interactions in the sensor. These deposit charge that is indistinguishable from that which is created by X-ray interactions (Fraser et al. 2010) or cause fluorescence of the materials of which the instrument is made. These contributions come primarily from high energy solar particles, cosmic rays and electrons trapped or quasi-trapped in Mercury’s environment (e.g., Ho et al. 2016). The cosmic ray background in the MIXS detectors is lower than that of the MESSENGER XRS due to the use of an imaging optic. As the MIXS optics direct X-rays onto a smaller detector than those used in the XRS, and background particles are not concentrated by the optic, MIXS collects less background flux. Assuming the particles enter through the entrance window of either detector, the reduction in background scales with detector area, and therefore MIXS will see less than 10% of the background of XRS without any background rejection being applied. In practise, this comparison is extremely pessimistic towards MIXS performance relative to XRS because very high energy particles will enter the detectors through the instrument walls as well as the entrance window. The thickness of the MIXS detector is only 0.45 mm compared to the XRS depth ∼ 50 mm, meaning that this component of instrument background is far lower for MIXS under similar conditions.
Charged particle rejection algorithms also operate in both devices to reduce the intrinsic background. A high energy charged particle transiting the detector leads to energy deposition along the particle’s track as it interacts with the atoms in the detecting volume. In a gas detector like those used in the MESSENGER XRS, the density of the gas is low and the energy deposited lies within the range of the X-ray spectrum from the target, so successful removal of the background signal requires rise time discrimination circuitry and an anticoincidence system (which each reduce the background by ∼80% - Schlemm et al. 2007). For MIXS, the detecting medium is silicon in solid state, within which the particles deposit more energy per unit track length than in a gas detector. As the pixels in the MIXS detectors are 300 μm in width and 450 μm in thickness, the track lengths are long enough to ensure that the energy deposited lies outside the energy range expected from Mercury’s surface (e.g. Fraser et al. 2010). A simple event detection algorithm identifies X-ray interactions in which the resulting charge deposited in the detector is shared between adjacent pixels and either rejects the event or recombines the charge to determine the true energy of the X-ray depending on a configuration parameter that can be commanded during operations. An energy discriminator is then used to efficiently remove these background events on board.
During the near-Earth commissioning of the instrument, background signatures of the remaining undiscriminated cosmic ray interactions were identified, and techniques devised to further clean them from the finished data products. Currently, work is ongoing to determine whether some of this cleaning can be done onboard via a software update in order to minimise the telemetry taken up by background. MESSENGER identified electron-induced signals in the XRS and other instruments (e.g., Ho et al. 2016; Dewey et al. 2017). Electron induced background signals of this type are mitigated somewhat by the design of MIXS. The optical and detector sub-systems are physically separated from each other, causing a large reduction in the solid angle within which this kind of background is collected compared to XRS. Each instrument channel also incorporates a magnetic electron diverter as electrons which interact directly with the detector could not be distinguished from X-rays. The electrons are either mirrored in the magnetic field or deflected to hit the telescope structures. When they are absorbed there, they cause X-ray emission of a Bremsstrahlung continuum and X-ray fluorescence lines. We have controlled this mechanism as far as is practical by the choice of materials within direct view of the detector.
3 Key Components and Subsystem Design
3.1 MIXS-T Optic
The front element of the telescope is an X-ray mirror constructed from 72 square-pore microchannel plate (MCP) optics, arranged to form a conic approximation to the Wolter I imaging geometry (Wolter 1952; Aschenbach 1985), which is used extensively in X-ray astronomical telescopes (e.g., XMM-Newton, Chandra, Swift). These existing telescopes use various technologies to generate the reflecting surfaces; for deployment on an interplanetary spacecraft, all of these are too heavy and produce a focal length that is too long.
The conic approximation to the Wolter design (Willingale et al. 1998) requires two sequential optics to bring rays to a focus in the focal plane. Each optic is constructed from an array of lead-glass microchannel plates, with 20 μm square pores etched out during manufacture (Fig. 3 and e.g., Martindale 2008; Mutz et al. 2007). MIXS-T uses radially packed square pores to approximate to the cylindrically symmetric mirror shells of traditional Wolter optics. For a 1000 mm focal length, the front optic requires a spherical radius of curvature of 4000 mm. This geometry makes the reflective surfaces of the pores approximate to the hyperboloids of revolution called for in the true Wolter I design. The rear optic requires a radius of curvature of 1333 mm in order to approximate the paraboloids of revolution. In this configuration, the grazing angles of incidence of rays as they fall onto each sequential reflecting surface are equal (Fig. 3).

A: Schematic diagram of the micropore optic approximation to the Wolter I geometry. \(\theta _{i}\) is the grazing angle of incidence onto the reflecting surface (the wall of the pore). Angles and relative sizes and positions are exaggerated. B: micrograph and photograph of a MIXS-T outer ring sector; note the square pores visible in the micrograph have a 26 μm pitch and 6 μm channel wall thickness (see text)
It would be too complex and costly to manufacture these two optics as monolithic units, so each optic is segmented into smaller “sectors” (Fig. 4). The active part of the optic has an overall diameter of ∼210 mm, a focal length of 1000 mm and a FoV of ∼1.1°, creating a telescope with apparent f-number of ∼4.7. Each pair of sectors is mechanically coupled together in a unit termed a “tandem” assembly to set the correct orientation of the front and rear sectors. The full optical assembly is constructed of three rings of tandems, with each ring further subdivided into 6 radial “sextants” to minimise the cost and risk of damage during assembly (Fig. 4). The inner ring consists of 6 tandem assemblies in which the sectors are 2.2 mm thick, the middle ring has 12 tandems consisting of 1.3 mm thick sectors and the outer ring has 18 tandems of 0.9 mm thick sectors. This complex arrangement of sectors with different geometries is used in order to maximise the collecting area of the optic. The ideal length of each pore is inversely proportional to the radius of that pore from the axis of symmetry of the optic (the optical axis). The discrete stepped thickness of the optics in each ring approximates to this ideal profile.

Exploded diagram of the MIXS-T optic, showing the construction of sectors into tandems, sextants into an optic and assembled into a half-populated optic
In order to increase the reflection efficiency and thereby increase the collecting area of the optic, the channel walls were coated with a thin (10-15 nm) layer of Ir by Beneq Oy (Finland), deposited by atomic layer deposition (ALD). Initially, it was intended to coat all of the pores of the microchannel plates, but due to processing issues the MCPs in the inner (and therefore thickest) ring could not be reliably coated inside the long pores, and therefore the reflecting surfaces of the inner ring are bare glass. This leads to a reduction in the collecting area of the telescope that is most significant at high energies. It will not be possible to detect Fe-K X-rays (∼6.4 and 7.1 keV) at high resolution with MIXS-T due to this reduced area as the critical angle for X-ray reflection is too small for them to be reflected in the middle and outer rings. However, this was an extremely challenging measurement to make regardless of the processing issues described above. The loss of this measurement is, however, mitigated somewhat by observations of the Fe-L line. In the most scientifically important range of 0.7 – 2 keV, the majority of the collecting area relates to the middle and outer rings of optics and the reduction effect is only ∼10-15% in this energy range.
Figure 5-A shows an experimental exposure of the fully assembled MIXS-T optic illuminated by Al-K\(\alpha \) (1.49 keV) X-rays and a Bremsstrahlung continuum, generated in a custom-built electron impact X-ray source in a 28 m long beamline at the University of Leicester. The optic is mounted onto a 2-axis goniometric stage, with the angle of the optic relative to the axis of the beamline optimised to find the on-axis point. The image was recorded using a microchannel plate detector (Lees and Pearson 1997) providing a 93 × 93 mm sensitive area, in order to recover the point spread function (PSF) of the optical assembly (Fig. 5–A).

A: Experimentally measured point spread function from the MIXS-T flight model in response to Al-K\(\alpha \) X-rays in a long beamline at the University of Leicester before integration with the telescope. B: Image taken under the same illumination conditions after integration of the optic with the MIXS-T telescope and its DEPFET detector. C: Analysis of the radial point spread function profile. See legend and text for details of panels. D: Zoom to red box shown in panel A, such that the data are directly comparable to panel B above
The image shown in Fig. 5–B was taken under the same illumination conditions as panel A but after integration of the optic with the telescope structures and detector. This exposure was analysed by calculating the radial PSF, the intensity of the image as a function of radius from the image centroid, and fitted by a pair of King functions to represent the optical aberrations (following a method similar to Moretti et al. 2006). Figure 5-C shows the radial PSF profile as maroon data points (with error bars representing the Poisson statistics of the number of counts at each radius), the fit to the data (green dashed line), the individual contribution of each of the two King functions in purple and pink. The blue curve diamonds show the measured encircled energy function (the fraction of the energy in the PSF as a function of radius) and the solid blue line shows the encircled energy function inferred from the fit to the PSF. The encircled energy is normalised to 1 at a radius of 30 arcmin (the width of the MIXS detector) and the fact that the curve is not flat at 30 arcmin indicates that there is still significant intensity in the PSF wings at large angles, outside the field of view of the MIXS detector. The angular resolution of the optic was measured to be ∼ 9.0 arcmin full-width at half maximum (FWHM) as indicated by the red lines on the figure. This microchannel plate approximation to the Wolter I design offers the required optical performance for MIXS for less than 2 kg of allocated mass (Willingale et al. 1998; Fraser et al. 2010; Martindale et al. 2018).
3.2 MIXS-C Collimator Assembly
A microchannel plate collimator assembly, 80 mm square, is used to define a square FoV of ∼10° along a side. The collimator optic on MIXS-C is a two by two array of square pore, square packed MCPs that have been slumped to a 550 mm spherical radius of curvature (see Fig. 6). Each MCP is 1.2 mm thick, measures 40 × 40 mm and has 20 μm square cross section channels, whose walls are coated with Ir as for MIXS-T.

Exploded diagram of the MIXS-C collimator assembly including the configuration of the MIXS-C electron diverter
The slumped collimator geometry (Fig. 7) arranges all pores to point to the centre of the detector and the aspect ratio of the channels is chosen such that any ray passing directly through the channel without reflection lands within the active area of the detector. This design, more complex than a traditional planar collimator, has the advantage of producing a large grasp (the product of the field of view and the effective area) while using a much smaller detector that can be physically separated from the optical structures. The requirement to physically separate the optic and detector arises primarily from the need to minimise the cooling power required for the detector focal plane. If the detector were in close contact with optical structures that can reach over 100°C during operation, the power needed to cool the detector to below -40°C for best scientific performance would be prohibitive. A secondary benefit of this geometry is that it places the detector deep within the spacecraft cavity, providing increased radiation shielding, minimising the collecting area for high energy charged particles and minimising the solid angle for a background contamination coming from the fluorescence of the instrument aperture when it is bathed in low energy electrons (Ho et al. 2016).

Schematic design of MIXS-C showing collimator and detector and the arrangement of the micropores to fill the field of view (note electron diverter not shown). \(\theta _{coll}\) is the full cone angle defined by the pore aspect ratio (length to diameter ratio), \(\phi _{slump}\) is the change in angle of the pore axes caused by slumping to a spherical figure
Figure 8-A shows the performance of the MIXS-C collimator, measured in the same long beamline used for MIXS-T measurements above under illumination by Al-K\(\alpha \) X-rays. The data were taken after final assembly of MIXS-C, using the flight detector. The behaviour was compared to a Monte Carlo ray-tracing simulation (Fig. 8-B), showing the build-up of the image from rays that are collimated (unreflected) or reflected once, twice, or any number of times in the optic. The experimental exposure is explained well by considering only the first 3 reflection modes (0, 1 or 2 reflections). Detailed structure in the higher order reflection modes is not yet reproduced fully in the simulation, but has an insignificant effect on the scientific goals of MIXS-C. This additional structure that has been observed in rays that are reflected multiple times arises from aberrations in the optic pores and mounting misalignments at the arcminute level. As MIXS-C has an angular resolution of ∼10° and changes in reflectivity at the ∼ arcminute level are small, this does not materially affect the collecting area or imaging performance of the instrument. This model was used to predict the instrument performance during the design phase, and comparison of the performance of the collimator with the model is sufficient to prove that it meets its science requirements. Detailed refinement of the ray-tracing model in terms of higher order reflections will be completed as part of the formal calibration of MIXS after observations of astrophysical sources (described below) and will be reported elsewhere in due course.

A: Experimental exposure from testing of the MIXS-C flight model after its final assembly. Note that top right and bottom left corners are covered by baffles that are used to restrict the X-rays from the calibration sources (see text) B: Simulations by ray tracing of the intensity in the focal plane via different reflection modes in the MIXS-C optic. “No reflections” indicates that the ray passed through the optic unreflected, “one” and “two” reflections are self-explanatory, and “All rays” indicates all rays are accepted into the image
3.3 Electron Diverters
The MIXS-T electron diverter consists of an array of SmCo dipole magnets that are located along radial spokes (Fig. 9). The magnets combine to provide a toroidal field in close proximity to the diverter which is very disruptive to any electrons with energy < 50 keV which are focused or scattered through the optics. The design deliberately cancels the stray magnetic field at large distances from the diverter assembly (within the manufacturing tolerance of the strength of the individual magnets) to ensure it minimises the impact of the soft magnetic materials used within MIXS on the MPO-MAG instrument (Heyner et al. 2020, this issue).

Exploded diagram of the MIXS-T electron diverter and its magnetic configuration
The MIXS-T electron diverter assemblies were characterised to measure their residual magnetic moment at the Technical University of Braunschweig in order to confirm that the residual magnetic moment was within the specification and hence did not pose a risk to MPO-MAG measurements. The results showed that the residual dipole moment was <6 mAm2, compared to a requirement of no more than 100 mAm2.
The MIXS-C electron diverter creates a field that is more complex as it was not possible to use a toroidal field without sacrificing sensitivity of the instrument to X-rays. Hence, MIXS-C has a quadrupole field where magnets are arranged around the edge of the aperture, pointing inwards in one plane and outwards in the other plane (see Fig. 6). Electrons that enter the aperture are deflected away from the detector by the relatively strong magnetic field near the optic. Similarly to MIXS-T, the field cancels at large distances.
In early testing, measurements of the magnetic field showed a very small dipole moment (as seen for MIXS-T) but the residuals from the dipole fit at 1 m distance were large (∼400-600 nT) and indicated there was a significantly stronger residual quadrupole. As quadrupolar fields decay rapidly with distance, an extra test was performed to ensure that the impact of this extra field component would not cause unacceptable signals for MPO-MAG. The measurements were repeated with the magnetic sensors at a distance of 2 m from the diverter, showing the residual field was <2 nT in all cases. This measurement confirmed that the signal at the outboard magnetometer of MPO-MAG would be significantly less than the permitted maximum.
3.4 Focal Plane Assemblies
MIXS-T and MIXS-C are equipped with identical focal plane assemblies (FPAs). Each FPA is an L-shaped electronics box (Fig. 10), providing mechanical support for the detector, front-end electronics, optical light filter and radioactive calibration sources. The structure of the electronics box also acts as radiation shielding for the detector and electronics and provides the cooling interfaces to the spacecraft. A thermal strap on the top of the horizontal section of the assembly connects to the main radiator for cooling the electronics, and another oval-shaped thermal strap provides the interface to dedicated heat pipes, used to cool the detectors to their operating temperature by connection to a dedicated radiator for each focal plane (Fig. 10-A). The structure holding the detector is thermally decoupled from the rest of the FPA, allowing a detector operational temperature of below -40°C, within an ambient temperature of up to around 40°C.

The MIXS focal plane assembly during assembly. A: the connection to the spacecraft heat pipe for cooling the detector to its operational temperature. B: the optical blocking filter in front of the detector. C: the detector plane assembly showing the detector (centre, silver), the ceramic circuit board (blue), the supporting Ti frame and the Kapton-Cu flex circuits (right, brown). D: the rear of the detector plane assembly showing the detector cooling block (centre) and associated electronics and bond wires (note that as the detector is back-illuminated, this is the detector “front side”)
The horizontal section of the assembly contains the front-end electronics (FEE), on a conventional printed circuit board. It is mounted close to the detector assembly and connected to it through a Kapton/Cu flex-circuit and associated bond wires. The FEE provides control signals to the detector, digitises the output from the front-end application specific integrated circuits (ASICs) and thresholds the signals, performing event detection to identify photons from Mercury. The pixel positions and pulse height (a proxy for X-ray energy) of the detected photons are sent to the DPU via a serial communications channel.
The vertical section of the assembly contains a detector plane assembly (Fig. 10-C) which holds the detector and its associated ASICs (Majewski et al. 2012) which are located on a ceramic circuit board (CCB) that is mounted co-planar with the detector.
The DEPFET active pixel sensor consists of a matrix of 64 × 64 pixels, each 300 × 300 μm, creating a detector that is 19.2 mm square. When cooled to below -40°C it provides approximately Fano-limited energy resolution at the beginning of the mission (see below), degrading smoothly with the accumulation of radiation damage. The detector is sensitive to X-rays from below 0.5 to greater than 7.5 keV and is controlled by four SWITCHER-S ASICs and read out by two ASTEROID 1.5 readout ASICs (see Treis et al. 2010 and references therein).
The detector is readout in a photon-counting and energy-resolving manner using a correlated double sampling technique. A measurement is taken with the charge deposited in the pixel present. The pixel is then cleared and sampled again; the difference between measurements reveals the amount of charge stored in the pixel before the clear. The dominant source of (non-Fano) noise comes from the leakage current of the silicon substrate (Treis et al. 2010). This current leads to a given charge per unit time in the pixel due to non-photon effects and it is therefore necessary to read out the array at a high rate to minimise the charge measured in a pixel due to the leakage current (the noise due to leakage current is linearly proportional to the readout time). MIXS detectors are operated with a readout speed of 170 μs per frame, giving an electrical signal proportional to the energy of any incident photons acquired during the frame integration time plus charge due to background sources. The readout rate for the MIXS detector is extremely fast, with event processing happening in the ASICs and field programmable gate arrays (FPGAs) at the front end. The limiting part of this electronics chain is the serial link between the front-end electronics (FEE) and the data processing unit (DPU) which can cope with an event rate of 250 kHz. Above this rate, data are discarded (overwritten in the serial output buffer); such a condition is reported in the housekeeping as a “FIFO link overflow” to warn that data have been discarded. The maximum event rate is equivalent to over 40 X-ray events (pixels above threshold) per readout frame, which is significantly higher than any predicted event rate for MIXS except when the spacecraft is passing through dense particle populations in the solar wind or the magnetosphere of Mercury. During periods of such intense background it is unlikely the data could be reliably calibrated in any case, meaning data loss of this type is unlikely to be a significant science constraint. As the readout is so fast, the probability of more than one photon hitting a given pixel per readout time (pulse pileup) is also typically very low. A number of algorithms exist onboard to identify periods of intense background and prevent noisy data from entering the telemetry queue for return to Earth. These work by identifying periods where the highest energy channels have a grossly disproportionate number of events compared to the main part of the spectrum. In such a case, the threshold is adjusted to prevent saturating the telemetry queue with noisy data.
After launch, and during the cruise to Mercury, the detector accumulates radiation damage. Radiation damage is caused by two main factors; ionizing radiation (total ionizing dose, TID) and non-ionizing radiation (total non-ionizing dose, TNID). The expected TID and TNID levels for the MIXS detectors, front end electronics and the electronic components in the MEB were calculated resulting in an equivalent shielding requirement of approximately 11 mm of aluminium over 90% of the solid angle. The model predicts TID < 7krad (70 Gy) and TNID < 1.5 × 10¹⁰ 10 MeV p+ cm−2 for all components and this forms the baseline of the radiation shielding design.
For a DEPFET detector, the main damage mechanisms are the deterioration at the oxide-silicon interfaces of the MOS gates of the individual DEPFET pixel and an increased number of crystal defects, leading to an increase in leakage current. After arrival at Mercury, a number of mechanisms can be employed to mitigate the effect of this radiation damage. First, operating at as low a temperature as possible will reduce the impact of radiation damage. As the spacecraft provides cooling to MIXS detectors by a dedicated radiator, there is no mechanism internal to MIXS that enables the reduction of the detector temperature – the minimum achievable temperature will be assessed during the calibration phase after Mercury orbit insertion. Secondly, annealing of the sensors (using dedicated heaters over a period of a few hours) will reduce the leakage current if it is deemed necessary after assessing the performance of the detectors following the completion of the interplanetary cruise. Finally, because the optimum operating voltage of the sensor changes after exposure to radiation, MIXS also has onboard algorithms that allow optimisation of the gate and clear gate voltages to mitigate these effects. The correct operating point is identified by plotting the offset of the sensor as a function of the “clear gate low” voltage before and after radiation exposure. A window exists in this curve where the average offset varies approximately linearly with the voltage setting (Fig. 11). Approaching the edge of the window leads to a roll off in linearity and eventually the reversal in the gradient of the curve. To ensure safe operation of the detector, the settings must remain within the linear region of the curve. Before radiation exposure the linear region is approximately 1 V wide, but as radiation damage accumulates, this window narrows. The onboard algorithm records the “average black level” (a direct proxy for the offset of the sensor) as a function of the clear gate voltage until it detects a reversal in the gradient of the curve at each edge of the operating window. When the width of the operating window has been sufficiently well established, the “gate on” voltage is changed to adjust the width of the window to its pre-radiation value of 1 V, and the operating value of the clear gate low voltage selected to be at the centre of that window.

Measurement of the voltage optimisation window in space and on ground for MIXS-C (A) and MIXS-T (B). The differences between measurements on the ground and in space are due to the different operating temperature in the two measurements. Note that the turning point of the curve near -2 V for MIXS-C in space was not found due to safety limits being set too tightly to allow the scan to complete (this will be re-measured at the next available opportunity)
The combined implementation of these measures will ensure that the detectors have a resolution of <200 eV FWHM during the science mission. At the start of the mission the energy resolution is significantly better than this value, as expected for operation prior to radiation damage (about 140 eV; see BepiColombo commissioning phase below).
Each of the MIXS focal plane assemblies include two radioisotope calibration sources (55Fe, each measured at 370 kBq, reference date: 26th August 2013). These sources illuminate two corners of the detector (top right and bottom left when looking at the detector from the side facing the optics) and allow the performance of the sensor to be measured relative to its expected value during cruise to Mercury and during the science phase. This will enable the radiation-induced degradation of the energy resolution to be tracked. The activities of the sources at the point of procurement were chosen to provide the required count rate at end of life (after the ground phases, cruise to Mercury and 2 years of operations), i.e. after ∼5 half-lives. Each source will provide ∼1-5 counts per second during operations, meaning it is possible to get at least one reliable calibration measurement per orbit if needed.
Before delivery of the instrument to the spacecraft, a dedicated test facility was used to uniformly illuminate the detectors with X-rays of different energies. Figure 12-A shows the linearity of the MIXS detectors – the difference between the incident and measured value of the X-ray energy (precisely, the residual between measured X-ray energy and a linear fit to all measured X-ray energies). The linearity is better (i.e., less) than 2% over the majority of the MIXS energy range. Figure 12-B shows the energy resolution of the detector as a function of the energy of incident X-rays. The resulting data are compared to the fundamental limiting performance of a Si detector (the Fano limit – see for example Scholze and Procop 2009) shown in orange and fit with a curve including the total noise of the electronics chain. The additional noise from the electronics is found to be ∼7.9 electrons RMS.

Characterisation of the MIXS detectors in terms of the linearity of their energy scale as a function of energy (A) and energy resolution as a function of energy (B)
Optical baffling and filtering are required as the detector is sensitive to optical photons as well as X-rays. Because of the high optical brightness of Mercury due to its close proximity to the Sun, a distributed method of filtering was chosen to minimise the consequence of pinholes caused by e.g., micrometeoroid strikes on any one filter. An unsupported 60-80 nm Al foil is deposited onto the front surface of the optics; an optical/thermal blocking filter (produced by Luxel Corporation USA) is mounted in front of the detector including 150 nm Al on 800 nm polyimide, and finally 50 nm of Al is deposited directly onto the detector surface.
The optical blocking of the filters was checked by shining optical light onto all apertures during dedicated testing at Leicester. No increase in noise could be seen on the detector. A similar measurement was repeated during a solar simulation test at spacecraft level, where the large space simulator at the European Space Agency was used to simulate conditions that will be experienced by MIXS in space. Again, no optical leak was detected.
3.5 Electronics and Software
The MIXS electronics box (MEB) is shared with SIXS and contains the PSU, which provides power to all sub-systems, and the DPU which controls the telecommand interface to the spacecraft. The DPU also receives and processes signals from internal housekeeping sensors and the scientific instruments (Fig. 2). The DPU runs the onboard software which is split into five major sub units; the core software (which runs the instruments and handles the telemetry and telecommand interfaces), the MIXS-T and MIXS-C application software, and the SIXS-X and SIXS-P application software. These last two units are described by Huovelin et al. (2020, this issue).
MIXS-T and MIXS-C application software modes are identical but independent of one another. Each instrument has only one science mode, and all science configuration changes apply in this mode only. While the FPA can be switched on in other modes, science products are not generated unless in Science mode. The MIXS application software modes are summarised in Table 2 and the allowed mode transitions are shown in Fig. 13. Note that any MIXS mode other than Off requires that the MIXS/SIXS DPU be in Operational mode.
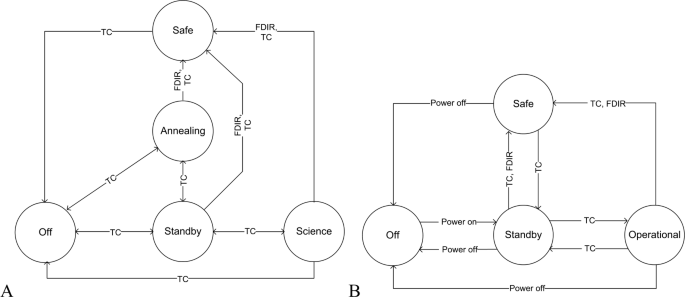
Allowed mode transitions for the MIXS application software (A) and the MIXS/SIXS data processing unit (B). “TC” indicates that the transition can be called by a dedicated telecommand, “FDIR” indicates that the transition can be called by Failure Detection Isolation and Recovery – an autonomous response to detection of a failure or contingency internal to the instrument
3.6 Resources
The measured mass of the assembled flight model (FM) instrument is 10.9 kg (excluding SIXS). This mass includes 7.3 kg for the MIXS optical bench, 2.8 kg for the MEB (shared with SIXS) and 0.8 kg for the inter-unit harness.
The primary power drawn by MIXS and SIXS was measured in various configurations on ground and in space (Table 3). Ground values were measured during test campaigns, while in space power values were measured during the Near-Earth Commissioning Phase (NECP) in December 2018. Note that values recorded in space were taken when the spacecraft temperature was somewhat lower than expected, and that the instruments were switched on in a different order - so some values reported in the fourth column differ from ground measurements. The recorded power values were as expected for the conditions encountered in space.
4 Ground Calibration Summary
Subsystem testing on the ground was performed as described above as well as dedicated calibrations that have been reported elsewhere (e.g., Majewski et al. 2014). After integration into the flight unit, MIXS ground calibration was achieved using a 28 m long X-ray beamline at the University of Leicester to validate the data taken at subassembly level. Good correlation was observed between subassembly calibration and data taken at instrument level; these results will be reported elsewhere in due course.
In order to prepare for the scientific exploitation of MIXS data, a ground reference facility is being implemented at the time of writing (Fig. 14). This uses equipment left over from the development of MIXS along with new experimental facilities such as a vacuum chamber, precision rotation stages, an electron impact X-ray source (Moxtek TUB00146-RH3) and a customised electron gun (modified Henniker Scientific ES 40C1) to set up a laboratory experiment to simulate the observations that MIXS will perform in space. The purpose of this facility is to optimise the settings of the equipment in space and validate the data-processing routines and modelling algorithms used to recover the elemental composition of the surface of Mercury. The facility will allow samples to be illuminated with both electrons and X-rays (simultaneously and independently) with any observing geometry that will be encountered by MIXS at Mercury. Samples will include pure elemental standards and mixtures thereof, and real terrestrial rocks of known composition. These samples will be in the form of polished specimens, pressed powder pellets and loose powdered material to simulate Mercury’s regolith as closely as possible. Experimental results will be analysed using two approaches: the fundamental parameters method employed by all space missions to date (Van Grieken and Markowicz 1993), and a numerical approach that offers the possibility of revealing more about the nature of the surface materials (e.g., Parviainen et al. 2011; Näränen et al. 2009). We describe these models further below. The ground reference facility will be used to help to ensure that a robust and reliable measurement of Mercury’s composition is derived from MIXS data by providing a “ground truth” verification of the data analysis methods to be used later at Mercury. Through this program of experimental work and related modelling on the properties of X-ray emission relevant to MIXS and Mercury, we have as an aim to determine absolute abundances and associated analytical uncertainties of some of the major elements during the science mapping phase of BepiColombo. However, at the time of writing the extent to which elemental ratios, as successfully used by MESSENGER XRS, or absolute abundances will be the main form of elemental data interpretation has not been determined.

Ground reference facility chamber. The key parts of the experiment are identified (the MIXS focal plane assembly, the X-ray source and the rotation stages used to setup the viewing geometry)
5 In-Space Commissioning and Calibration
In December 2018, MIXS was turned on for the first time in space during the mission’s Near-Earth Commissioning Phase (NECP). During the tests, the thermal performance of the instrument was verified, proving that all housekeeping channels were operational after launch. Notably, throughout NECP the temperature of the instrument and of the spacecraft as a whole was significantly lower than expected (though within operational limits), which may have affected some of the measurements discussed herein in minor ways (e.g. the differences between the voltage optimisation curves in Fig. 11 between space and ground and the differences in reported power consumption in Table 3).
The annealing process was exercised to ensure that the algorithms could correctly control the temperature of the detectors; this step would also outgas any condensed products that collected on the detector during the initial spacecraft outgassing phase. During this annealing test, control heaters and spacecraft heaters are used together; hence, the test has verified all parts of the detector thermal control system. Various other algorithms were exercised to ensure they were operating as expected after launch. A number of control parameters were found to require optimisation, but all of the algorithms behaved as expected.
The first time the detectors were turned on, diagnostic measurements were made of the detector offset maps and the spectrum of X-rays from the internal calibration sources (Fig. 15-A and -B). Each of these panels maps the average per-pixel amplitude measured when the instrument was set to record only the amplitudes of pixels that were found to be below the X-ray event-detection threshold. This technique returns the average noise level of each pixel and is a characteristic “fingerprint” of the detector chip (and its associated electronics) that is an extremely sensitive measure of its performance. The results are in excellent agreement with the expectations from ground test campaigns. The four pixels with greatly lower average amplitudes in the MIXS-C map (panel B) are the result of cosmic ray detections in those pixels leading to greatly increased background in these pixels and a reduced sampling of the detector offset in that pixel.

Offset maps for MIXS-T (A) and MIXS-C (B) – see text; These are as expected and closely match measurements taken during ground calibration. The histograms show the uncalibrated (C) and calibrated (D) spectra from the MIXS-T calibration sources
Figure 15 shows MIXS-T uncalibrated (C) and calibrated (D) spectra, binned together from the full duration of NECP in which MIXS-T was in Science mode (approximately 24 hours, non-continuously). The only sources visible to the detectors were the respective 55Fe calibration sources, which produce a Mn-K\(\alpha \) fluorescence peak through radioactive decay. The measured Mn-K\(\alpha \) peak is centred at 5896 eV (5895 eV expected) with an energy resolution of 138.8 eV FWHM. As specified, this resolution is close to the Fano-limited resolution of a Si detector at this energy (119 eV, Scholze and Procop 2009). The corresponding centre and resolution for MIXS-C are 5897 eV and 142.3 eV respectively. The significant peak spreading in uncalibrated data is due to the differences in gain between individual pixels; this effect disappears in calibrated data when these gains are accounted for. Figure 16 shows an overlay of the results from MIXS-T and MIXS-C. Note that MIXS-T and MIXS-C have different low-energy thresholds to remove the O K\(\alpha \) line from the MIXS-T data as a means to reduce telemetry volume.

Calibrated MIXS-T and MIXS-C spectra from NECP. The energy resolution of the four observed spectral features (Mn-K\(\alpha \) and -K\(\beta \) fluorescence peaks, secondary fluorescence of Ti in the source structure, and the Si escape peak from Mn-K\(\alpha \)) is well-matched between both detectors and is close to the Fano limit. At low energy the MIXS-C spectrum shows significantly higher counts extending to a lower energy; this is the result of a different threshold setting on the detector
Finally, the voltage optimisation procedure was tested, to verify its operation and to establish a baseline against which future measurements can be compared to assess radiation damage. Figure 11 shows the result of the MIXS-C (panel A) and MIXS-T (panel B) optimisation scans in space and on the ground. The turning points representing the ends of the safe voltage window, as discussed above, are visible on the MIXS-T scan plot; note that conservative safety limits prevented the MIXS-C scan from reaching the turning point near -2 V – this has been corrected and future scans are expected to establish the full operating window.
6 Scientific Objectives
6.1 Surface and Composition
X-ray fluorescence (XRF) spectrometry is a well-established technique for in situ identification of the elemental composition of geological materials on Earth (Van Grieken and Markowicz 1993) and has been used in space to measure the composition of the Moon, asteroids and Mercury (e.g., Alder et al. 1972; Okada et al. 1999; Grande et al. 2003; Narendranath et al. 2011; Nittler et al. 2001; Nittler et al. 2018), addressing many important scientific questions (e.g., Crawford et al. 2009). On the dayside of Mercury solar coronal X-rays strike atoms, exciting bound electrons into higher energy levels or out of the atom, leaving it in an excited state with excess energy. As the atom reconfigures itself, it loses this energy primarily by the emission of an Auger electron or by the emission of an X-ray photon (Fig. 17). MIXS will observe these fluorescent X-ray photons, while the Solar Intensity X-ray Spectrometer (SIXS, Huovelin et al. 2020) simultaneously observes the spectrum of X-rays emitted by the Sun. The results from SIXS are necessary to calibrate the fluorescent X-ray spectrum provided by MIXS because solar X-ray spectrum changes slope (hardens) and increases in intensity by orders of magnitude as the flare-state increases. In addition, the elemental composition of the solar corona varies during flares (e.g., Dennis et al. 2015). The consequence of these factors is that MIXS and SIXS need to work together in order to reveal the elemental composition of Mercury’s surface.

Schematic diagram of the production of X-rays by fluorescence of atoms on the surface of Mercury when they are illuminated by solar coronal X-rays
X-ray fluorescence emission from a planetary regolith can be modeled by using the fundamental parameters equation (FPE; Van Grieken and Markowicz 1993; Clark and Trombka 1997) and by numerically simulating the stochastic geometry of the regolith (e.g., Parviainen et al. 2011). Verification for the modelling can be obtained from laboratory experiments (e.g., Näränen et al. 2008, 2009; Weider et al. 2011). In general, FPE is based on solving the radiative transfer equation for scattering, absorption, and emission of radiation in a plane parallel medium of material with given elemental composition. A parallel beam approximation is also used, which is appropriate for most applications given the geometries involved. However, given the proximity of Mercury to the Sun and the 10.4° FOV of MIXS-C, this approximation needs to be revised as photon path-lengths in the regolith, and scattering effects, are phase-angle dependent. In the numerical modeling by Parviainen et al. (2011), X-rays are traced within a regolith geometry composed of spherical particles with given elemental composition. The numerical modeling accounts for regolith effects in X-ray fluorescence emission, resulting in a more accurate inversion of the X-ray observations for the regolith composition. We are developing an updated radiative transfer model, which combines the FPE and regolith modelling with non-parallel beam geometries. This will allow more accurate calculation of the expected photon flux on the MIXS FPAs. Combined with state-of-the-art numerical light-scattering modeling in the visible and near-infrared spectral range (e.g., Penttilä et al. 2020), the MIXS/SIXS and SIMBIO-SYS (Cremonese et al. 2020, this issue) instruments offer great promise for constraining the physical and chemical properties of the Hermean regolith.
In Fig. 18-A we show the normalized intensity for X-ray fluorescence emission by a simulated planetary regolith composed of plagioclase particles. The exciting X-rays are taken to originate from an X-ray line source at 4.5 keV with normal incidence on the regolith surface. The plagioclase particles are composed of a K-free, intermediate plagioclase with formula Na0.5Ca0.5 Si3AlO8 and density ∼2700 kgm−3. The emergence angle is counted from the outward normal vector of the surface. This figure presents the intensities for the Ca-K\(\alpha \) and Al-K\(\alpha \) lines as computed with FPE and with numerical modeling of the planetary regolith. In the latter case, three different models are assessed. First, the planetary regolith is assumed to consist of equal-sized spherical particles with radii of \(r\) = 100 μm (Case 1) or \(r\) = 250 μm (Case 2). Second, the regolith is assumed to be composed of power-law distributed spherical particles within 60 μm < \(r\) < 300 μm and with index -3, resulting in average particle size of <\(r\)> = 100 μm (Case 3). In all cases 1–3, the particle volume fraction in the regolith model is assumed to be 35% (note that the FPE model does not depend on the volume fraction – the value 35% assumed in the numerical simulations is a canonical figure assumed for “dense” regolith packing and is reasonably close to typical values of the upper millimeters of the lunar regolith). Clearly, two distinct groups of angular dependences can be recognized: whereas the two FPE dependences are convex upward, the four numerical modeling dependences are mostly convex downward. The different qualitative behavior derives from mutual shadowing among the regolith particles (e.g., Parviainen et al. 2011) that is taken into account in the numerical modeling but omitted in the FPE modeling: an X-ray emitted within a particle can always escape from the regolith along the path of the incident, exciting X-ray, whereas in other directions the emitted X-ray could be blocked by (other) particles. The shadowing effect depends on particle size and composition, as well as the element and its spectral line under consideration, as testified by the differing angular dependences for the intensity.

(A) Simulation of X-ray fluorescence emission from a planetary regolith composed of plagioclase particles for excitation X-rays incident normal to the surface, from a line source at 4.5 keV. Each curve is divided by the corresponding value at zero emergence angle. Clear differences are seen between the FPE and numerical models. For more information, see text. (B) The Ca K\(\alpha \)/Al K\(\alpha \) line ratios for the model planetary regolith (panel A and text) as a function of the emergence angle for the FPE and numerical models. The exciting X-rays from a line source at 4.5 keV are normally incident as in panel A. Each curve is divided by the corresponding value at zero emergence angle, illustrating the qualitative differences in the angular dependences. Modeling the regolith geometry is a key to accurate retrieval of elemental abundances from line ratios
Figures 18-B illustrates the regolith effect on the resulting Ca-K\(\alpha \)/Al-K\(\alpha \) line ratios, as a function of the emergence angle, for the FPE case and the three numerical models. The FPE result stands out as having the strongest dependence on the emergence angle, but the angular dependences for the three numerical cases also differ. It is clear that, in order to accurately derive the elemental abundances in the regolith particles, the geometric regolith effects need to be accounted for. This will be done by verification of the models in the MIXS ground reference facility (above) and an empirical correction to the FPE technique will be sought to enable reliable comparison between mathematically simple FPE models and the complex numerical modelling. Note that while the incident angle of the illuminating solar photons relative to the surface normal can be anywhere in the range -90° < \(i\) <90°, the emergence angle is limited to generally < 20° due to nominal nadir-pointing geometry (and the limited off-nadir angles possible) and the shallow slopes of Mercury surface features. The detailed effect of these different viewing geometries and phase angles will be studied in the coming years (e.g., Maruyama et al. 2008; Näränen et al. 2008, 2009; Weider et al. 2011).
6.2 Electron-Induced XRF in the Hermean Environment
X-ray fluorescence can also occur if the initial electron vacancy in the surface atom is generated by electron impact rather than excitation from an X-ray. Electron precipitation in “auroral” zones was predicted by Baker et al. (1987) based on Mariner 10 data, and electron-induced X-ray fluorescence resulting from this by Grande (1997). After MESSENGER’s arrival at Mercury, X-ray fluorescence from the unlit surface of the planet, and therefore presumably originating from particle precipitation, was observed by Starr et al. (2012) and mapped by Lindsay et al. (2016). This mapping showed that particle precipitation is strongly ordered by the intersection of the planetary magnetic field with the surface, with the most intense particle precipitation occurring just within the open-closed field line boundary in both the north and the south of the planet. Precipitation is symmetric north-south about the magnetic equator, and strongly asymmetric dawn-dusk about midnight. Particles appear to be energised in the magnetotail by reconnection and/or dipolarisation.
Characterisation of this phenomenon is of great interest for investigation of magnetospheric dynamics, as it allows direct remote sensing of particle interactions with the surface, which is otherwise not possible from orbit. MIXS will be able to observe X-ray fluorescence originating from particle events while its footprints are unlit. By careful comparison of MIXS and SIXS data (identifying the residual contribution of particles when the surface response to the observed SIXS spectrum is modelled), it may be possible to deconvolve solar- and particle-induced X-ray fluorescence events from the dayside of the planet, allowing global mapping and characterisation of precipitating particles. If surface composition in the zones of precipitation is well constrained, the illuminating particle spectrum can be modelled. In data observed by MESSENGER XRS, fluorescence from surface precipitation is generally weaker than that induced by X-ray illumination. Some bursts of electron precipitation produce spectra comparable to those obtained during relatively bright (M-class) solar flares, but such events are rare.
MIXS observations of magnetospheric processes will benefit greatly from joint observation with other instruments on the two BepiColombo spacecraft MPO and Mio (for details see Benkhoff et al. 2020, this issue; Murakami et al. 2020, this issue), allowing multi-point observations of particle processes in the magnetosphere, exosphere and surface. These possibilities are further discussed by Milillo et al. (2020).
6.3 Updated Science Goals Post-MESSENGER
Since the publication of Fraser et al. (2010), our understanding of Mercury, its surface and its environment has improved dramatically. The real power of the BepiColombo mission derives from its dual point observations of the environment (Millilo et al., 2020) and the comprehensive payload for surface science objectives (Rothery et al. 2020). Coordinated observations using complementary instruments and techniques will provide detailed information regarding the surface and its composition. In particular, combining information from MIXS with the infrared imaging spectrometer MERTIS (Heisinger et al. 2020, this issue), the gamma ray and neutron spectrometer (Mitrofanov et al. 2010, 2020) and the visible-infrared hyperspectral imager (Cremonese et al. 2020, this issue), as well as contextual information from visible cameras and the laser altimeter (Thomas et al. 2020, this issue) will yield a far more comprehensive understanding of surface landforms and their history than would be possible from any instrument operating in isolation. Similarly, the MIXS goals relating to precipitation of charged particles to the surface require coordinated observations from multiple instruments to provide a complete picture of the driving processes (the magnetometer – Heyner et al. 2020, this issue, SERENA – Orsini et al. 2020, this issue, MPPE – Saito et al. 2020, this issue). Coordinated observations will be facilitated by the ESA science ground segment with detailed planning taking place in the coming years. Updated as a result of findings from the MESSENGER mission, MIXS has three primary instrument objectives; to produce global elemental abundance maps, to perform spatially resolved measurements (imaging) of elemental abundances, and to investigate X-ray fluorescence driven by particle precipitation. These are summarised below and supplemented with more specific science questions that the MIXS instrument aims to address. Each objective is linked to the instrument performance metrics (see Table 4) required to enable the investigation. In the following objectives, the term “volatile” relates to those volatile species to which MIXS is sensitive (see Table 4), in each case the species involved may be different.
-
O1.
Produce global elemental abundance maps and determine key elements (Table 5) to an accuracy of 5-50% depending on concentration and the element under examination (M1, M2, M3, M4, M7, M8) associated with the following features:
-
a.
The elemental composition of Mercury’s crustal terranes, notably the broadly basaltic (but high Mg and Si, low Fe) lava regoliths comprising the various smooth plains, intermediate plains and intercrater plains.
-
b.
Exposed material excavated from depth in and around complex and peak ring craters, notably the ‘low reflectance material’ that may include carbon-rich primary crust.
-
c.
Crater floor material (for example, smooth crater floor material could be either impact melt or later lava flows)
-
d.
Volcanic landforms including faculae (most of which are interpreted as deposits from explosive eruptions)
-
e.
Fields of hollows, which are believed to be sites of non-violent present-day volatile loss.
-
f.
The high Mg/Si terranes identified by MESSENGER XRS.
-
g.
Determine the spatial distribution of volatile elements (e.g. Na, K, S) across the Mercury surface and in particular volatile enrichment in the polar regions
-
a.
-
O2.
Perform spatially resolved measurements of these elemental abundances (Table 5), achieving high spatial resolution where solar conditions permit (M1, M2, M3, M5, M6, M7, M8)
-
a.
Crater uplift and impact ejecta to identify deep crustal and mantle compositional signatures
-
b.
Impact melt composition and production
-
c.
Measure the composition of relict volcanic landforms, lavas, and associated regolith, including where infilling impact craters
-
d.
Determine whether the volatiles Na, K, S or Cl are involved in the hollow-forming process
-
e.
Investigate volatiles in the permanently shadowed regions
-
f.
Investigate space weathering of ejected material
-
a.
-
O3.
Investigate particle-induced X-ray fluorescence associated with energetic particles interacting with the surface (M1, M2, M3, M4, M5, M7, M8)
-
a.
Characterise the intensity and spectrum of the precipitating electron flux
-
b.
Characterise the intensity and spatial and temporal variation of precipitation in the cusps
-
c.
Investigate the general dayside particle precipitation signal
-
d.
Observe substorm signatures in particle precipitation events
-
e.
Characterise the open-closed field line boundaries in both north and south
-
f.
Measure the footprint of the field-aligned current system(s)
-
g.
Measure the local structure of field-aligned current system(s)
-
h.
Determine whether the solar wind directly impacts the surface under extreme solar wind driving conditions
-
i.
Characterise dawn and dusk particle precipitation phenomena and the asymmetries between them
-
j.
Determine whether particle sputtering is a source of the exosphere
-
a.
The associated performance requirements and metrics are summarised in Table 4.
In order to optimise the data returned by MIXS, work is under way to model the behaviour of the instrument and chose the correct operating settings to maximise the scientific value in the telemetry. For instance, the default configuration of MIXS-T does not telemeter the lower part of the energy spectrum in order to avoid the large data rate increase associated with telemetering the intense O-K\(\alpha \) peak at 525 eV. Nevertheless, these settings can be changed in order to investigate lower energy peaks such as Fe-L, O, and ideally C in order to observe these species in low solar states. Modification of these settings is simple operationally, with a small number of configuration commands and an FPA power cycle required to achieve the new configuration, although this will take ∼20-30 minutes (i.e. a significant proportion of an orbit) and is therefore unlikely to be a frequently used procedure.
One high priority scientific target raised by MESSENGER relates to investigations of the low reflectance material (LRM) on Mercury’s surface. These are an extreme challenge for MIXS as they call for the detection of C-K\(\alpha \) at 277 eV. This line is theoretically within MIXS’s energy window at launch (and was calibrated at detector unit level – see Majewski et al. 2014), but the optical blocking filters absorb a large fraction of the flux at such a low energy - leading to low sensitivity. Also, the emission line is close to the minimum low energy threshold of the front-end electronics and hence, should radiation damage require an increase in the threshold due to additional noise, the measurement may become impossible. Another technique that will be studied to assess this conjecture relates to modelling of the different scattering backgrounds that will be observed. This may help demonstrate whether there is a large proportion of low-Z materials in the regolith.
The feasibility of such measurements is therefore uncertain at this stage of the mission, but due to the high scientific value of the measurements, all efforts will be made to assess their feasibility in the coming years. For instance, six-monthly voltage optimisation scans are foreseen during the cruise in order to establish the rate at which the detector has been damaged by radiation. Detector annealing will be conducted as part of the near-Mercury commissioning, and may be repeated during the science mission if necessary. Laboratory studies (described above) will help to determine the feasibility of measuring C and, if necessary, optimise the instrument configuration and observing conditions needed for such a measurement campaign.
The elements potentially detectable (and in most cases mappable) by MIXS and an indication of information imparted by them are shown in Table 5.
7 Operation Plans
On arrival at Mercury, after separation of the spacecraft stack and before the beginning of the primary science mission, the instrument response of both MIXS-T and MIXS-C will be calibrated against an astronomical source of known spectral form. The telescope will be pointed to the source in an array of positions relative to the expected boresight in order to characterise the point spread function of the optic and the effective area of the instrument in each viewing geometry. The primary such calibration source is the Crab Nebula, which contains a strong astronomical X-ray source with a well-known spectrum (Toor and Seward 1974). The X-ray source is a neutron star, located at 5h 35m 31.94s right ascension and +22° 00’ 52.2” declination. In the range 0.1-100 keV its spectral form is modelled by
where \(E \) is energy in keV, \(\sigma \) is the absorption and scattering cross section and \(N_{H} = 3\times 10^{21}~\mbox{cm}^{-2}\) is the hydrogen column density between us and the Crab Nebula.
If the Crab is unavailable or impractical as a calibration source due to orbital considerations, the secondary and tertiary targets for calibration are Scorpius X-1, an extremely bright but variable neutron star binary (e.g., Bradshaw et al. 2003), and Cassiopeia A, a supernova remnant approximately 0.1 times as bright as the Crab (e.g., Becker et al. 1979). Simulated observations have been used to calculate the time required to reach a signal to noise ratio (due to Poisson statistics) of 20 up to 7 keV in the calibration exposures. The required time varies significantly from less than 1 minute for Scorpius X-1, to several days for Cassiopeia-A. The variability of Scorpius X-1 and the relative dimness of Cassiopeia A make these less ideal calibration targets. However, due to stringent observing constraints due to the instrument and the platform, the visibility of the Crab Nebula is poor after BepiColombo’s arrival at Mercury; planning and modelling is underway for optimisation of calibrations using these sources. For instance, it may be possible to use the brightness of Scorpius X-1 to determine the boresight of the telescope and collimator relative to the spacecraft attitude control system, while using the stability of the Crab Nebula to calibrate the effective area as a function of energy at a smaller number of off-axis positions. An ideal scenario would be to perform the MIXS calibration using the Crab Nebula before orbit insertion to avoid numerous off-pointings. The practicality of doing this after separation of the spacecraft but before entry into Mercury orbit is under consideration.
Operations planning for the MIXS science mission is already underway. During the primary mission (the first Earth year of operations 2025-26), MIXS science objectives (above) are addressed by nadir-pointing observations with MIXS-T and MIXS-C operating in parallel and in Science mode whenever possible. Deviations from this configuration should be minimised and we expect little or no use of alternate instrument configurations (see above). Global coverage with MIXS-C will be achieved during this mission phase. Assuming MIXS is switched on continually, complete coverage is achieved in one Mercury year because the MIXS-C swath always overlaps from one orbit to the next.
The 64 × 64 detector array, projected onto the Mercury surface at periapsis, theoretically provides a spatial resolution of < 1 km. However, in order to provide sufficient sensitivity to resolve the target elements above the noise floor, adjacent pixels will be binned together. The number of pixels that must be binned to achieve the required sensitivity, and thus the effective spatial resolution, is dependent on the number of counts per pixel. This is in turn a function of the incident X-ray flux on the surface and ultimately of solar X-ray state. The X-ray state varies rapidly and unpredictably on short timescales, but on long timescales varies along with several other indicators of solar activity on a cycle of approximately 11 years. BepiColombo’s arrival at Mercury in late 2025 occurs shortly after the predicted maximum of solar cycle 25 (e.g., Labonville et al. 2019).
Successive repeat observations of the same surface location under the same illumination conditions can be binned together, allowing for improved statistics and thus resolution of additional elemental abundances. Repeats of the same location under different illumination conditions can also be binned together when the solar state, viewing geometry and surface roughness are taken into account. MIXS-T will not achieve full global coverage during this phase as its swath does not fully overlap between ∼60°N and ∼60°S. It will continuously observe but its best data return will correlate with periods of high solar X-ray activity (and/or intense particle precipitation). As this is unpredictable, planning reactive observations is probably unrealistic as the minimum response time due to the operations planning cycle is ∼1 weeks (Montagnon et al. 2020). Instead, post hoc analyses will be prioritised, based on SIXS solar spectra, down-sampled data returned via BepiColombo’s “flexible downlink” facility (Montagnon et al. 2020), and the MIXS target list.
During the extended mission (the second Earth year of operations 2026-27), anticipating that off-nadir observations will be available, MIXS may plan to request off-pointings under a number of circumstances. Along-track off-pointing “stares” at targets of interest identified in the target set or as the result of earlier observations may be conducted, where the spacecraft rotates to keep the instrumental footprint on the same location on the surface for an extended period of a particular orbit. This would allow for measurement of the target from multiple phase angles as well as improving overall statistics for the target by increasing the total dwell time. Across-track off-pointing may also be used for gap-filling, addressing gaps resulting from earlier contingencies or power management operations, or in order to achieve global coverage with MIXS-T which otherwise will be incomplete away from the poles. MIXS will remain switched on whenever possible during any off-pointing requested by other instruments (as well as those required operationally) for carry-along observations. Any surface, exospheric or indeed astronomical target is of interest for MIXS observations.
Data analysis and potential off-pointing observations will be prioritised using the MIXS target list. This list is currently under definition, and will contain a prioritised list of surface targets of interest, with surface coordinates and shapefiles defining their extent. Useful global catalogues already exist for some target classes. For example a global catalogue of fields of hollows was published by Thomas et al. (2014a), and ‘red spots’ (now known as faculae) were similarly catalogued by Thomas et al. (2014b). Most of the latter are accepted to be deposits from explosive volcanic eruptions but some are ‘pitted ground’ of less certain origin, and we hope to characterise both types of facula. We anticipate that the target list will be a living document, updated as the BepiColombo mission develops with new MIXS observations, as well as observations from other instruments.
Prime targets of interest include complex craters such as Rachmaninoff, Raditladi and Mozart, the Caloris basin, the high magnesium region (HMR), hollows, faculae, volcanic vents and the low-reflectance material (LRM).
8 MIXS Data Archive
The MIXS data rate is highly variable due to the use of event lists for MIXS-T science data – in order to retain spatial and spectral information. The event lists contain timing information, pixel position and amplitude packed into telemetry packets; the length and rate of these packets is strongly dependent on the surface X-ray flux and thus solar X-ray irradiance of the surface materials. These lists are used to create spatially (and/or temporally) resolved spectra from the surface of Mercury via ground data processing pipelines.
The data volumes that will be generated by MIXS during science operations cannot be accurately predicted as the data rate depends on the X-ray state of the Sun, which is stochastic on short timescales. While broadly predictable on long timescales (the ∼11 year solar cycle), the X-ray state is overlaid with short timescale features such as solar flares, which contribute a large fraction of the modelled data volume. Rather than trying to construct a predictive model, we model the historical data volume that MIXS would have produced had it operated during previous solar cycles, selecting periods within these cycles when the solar X-ray activity is similar to that expected in 2026-28.
This data rate model was constructed based on historical solar X-ray irradiance data from the SEM instrument on board the GOES series of satellites (Grubb 1974). The data rate generated by MIXS-T was related to solar X-ray flux in the 0.1-0.8 nm wavelength range measured by SEM based on instrument and surface response modelling (Carpenter 2006). The MIXS-C data rate was also modelled, but contributed a much smaller volume in extreme solar situations as the event rate reported by MIXS-C is limited to a relatively low value (100 s−1 in the default configuration). Histogram data rates are slightly affected by increased solar activity as the software dynamically increases bin depths during bright flares, but this effect is very small.
Historical data can be used to estimate the annual cumulative data volumes that will be generated by MIXS. The periods between 2003-04 and 2014-15 are two, and one, full solar cycles before MIXS science operations will take place. Figure 19 shows the predicted data volumes if solar activity levels during those periods is representative of what will occur during MIXS operations.

Cumulative data requirements for MIXS modelled based on solar activity in 2003-04 and 2014-15
Due to the unpredictable nature of solar flares, along with the tendency of bright flares to cluster in time, this modelling shows that there will almost certainly be times when MIXS will overflow its packet stores due to high flare state. For an extreme example, note the steep increase in data volume around DOY300 of 2003 in Fig. 19, where approximately 100 Gb of data volume is generated within a period of around 20 days. Agreements need to be made on how to handle such periods.
MIXS data will be processed through several stages on its return to Earth and archived on ESA’s Planetary Science Archive (PSA). Table 6 summarises the processing levels of MIXS data. All science data up to the CAL step are made publicly available after a six month embargo. Derived products (DER) may take longer to reach the archive due to the complex calibration needed to create them.
At RAW, PAR and CAL levels, MIXS science products will include pixel lists from both MIXS-T and MIXS-C, and MIXS-C histograms (described below). Pixel lists are timestamped event lists of individual photon detections within the respective detectors; at RAW level these are lists of X- and Y- detector locations and amplitudes; at PAR level these are lists of X- and Y- detector locations and energies (eV); and at CAL level these are lists of surface latitudes (degrees), surface longitudes (degrees), and energies (eV). The MIXS-C pixel list is rate limited on board to 100 s−1, and any events exceeding this limit are not telemetered. The time resolution of pixel lists is configurable but typically set at 100 ms for MIXS-T and 10 s for MIXS-C. Pixel lists can autonomously be further divided in time if a maximum event rate is reached before the preset time resolution has elapsed.
MIXS-C histograms are time-binned data generated on-board from MIXS-C pixel events. At RAW level the histogram science products are as returned from the spacecraft, containing 256 bin amplitudes. At PAR level the bin amplitudes are unchanged from RAW but are additionally labelled with the matching 256 bin centres in eV. At CAL level the product is associated with geometry data specifying the footprint of the instrument during the relevant integration time. MIXS-C histogram integration time is configurable but typically set at 10 s.
MIXS science data will be published along with auxiliary geometry files specifying the instrument field of view in surface coordinates and the BepiColombo state vector in Mercury-centred coordinates at time resolutions equal to the resolutions of the relevant data.
SIXS data products (Huovelin et al. 2020, this issue) will be archived alongside MIXS products in the PSA. Links will be provided in the PDS4 labels to identify which lower level products were used to generate the MIXS archive in order to assist the scientific end user of the data.
9 Conclusions
The Mercury Imaging X-ray spectrometer is a novel instrument with diverse scientific goals, from measuring the elemental composition of Mercury’s surface to characterising the precipitating particle fluxes and identifying a possible source for the exosphere.
Experiments will be undertaken on the ground in the coming years to help validate the data analysis methods used to determine the composition of Mercury. Detailed modelling of the instrument and the scientific data it will produce will be used to inform the optimum operating conditions for the instrument.
Scientific data will be publicly available in the Planetary Science Archive.
References
I. Alder, J. Trombka, J. Gerard, P. Lowman, R. Schmadebeck, H. Blodget, E. Eller, L. Yin, R. Lamothe, P. Gorenstein, P. Bjorkholm, Science 175, 436–440 (1972)
B. Aschenbach, Rep. Prog. Phys. 48, 579 (1985)
D.N. Baker, J.E. Borovsky, J.O. Burns, G.R. Gisler, M. Zeilik, J. Geophys. Res. Space Phys. 92(A5), 4707–4712 (1987)
R.H. Becker, S.S. Holt, B.W. Smith, N.E. White, E.A. Boldt, R.F. Mushotzky, R.K. Serlemitsos, Astrophys. J. 234(234), L73–L76 (1979)
J. Benkhoff et al., Space Sci. Rev. (2020, this issue)
J. Benkhoff, J. Casteren, H. Hayakawa, M. Fujimoto, H. Laakso, M. Novara, P. Ferri, H. Middleton, R. Ziethe, Planet. Space Sci. 58, 2–20 (2010)
A. Boujibar, L.R. Nittler, N. Chabot, F.M. McCubbin, K. Righter, K.E. Vander Kaaden, T.J. McCoy LPI Contrib. No. 2047 (2018). VDVSS. https://www.hou.usra.edu/meetings/mercury2018/pdf/6112.pdf
C.F. Bradshaw, B.J. Geldzahler, E.B. Fomalont, Astrophys. J. 592, 486 (2003)
J.D. Carpenter Ph.D. thesis, University of Leicester (2006)
C. Cartier, O. Namur, L.R. Nittler, B. Charlier, Earth Planet. Sci. Lett. 534, 116108 (2020)
P.E. Clark, J.I. Trombka, J. Geophys. Res. 102, 16361–16384 (1997)
K.G. Cox, R. MacDonald, G. Hornung, Am. Mineral. 52, 1451–1474 (1967)
I.A. Crawford, K.H. Joy, B.J. Kellett, M. Grande, M. Anand, N. Bhandari, A.C. Cook, L. d’Uston, V.A. Fernandes, O. Gasnault, J. Goswami, C.J. Howe, J. Huovelin, D. Koschny, D.J. Lawrence, B.J. Maddison, S. Maurice, S. Narendranath, C. Pieters, T. Okada, D.A. Rothery, S.S. Russell, P. Sreekumar, B. Swinyard, M. Wieczorek, M. Wilding, Planet. Space Sci. 57, 725–734 (2009)
G. Cremonese et al., Space Sci. Rev. 216, 75 (2020, this issue). https://doi.org/10.1007/s11214-020-00704-8
B.W. Denevi, C.M. Ernst, L.M. Prockter, M.S. Robinson, in Mercury, the View After MESSENGER, ed. by S.C. Solomon, L.R. Nittler, B.J. Anderson (Cambridge University Press, Cambridge, 2018), p. 144
B.R. Dennis, K.J.H. Phillips, R.A. Schwartz, A.K. Tolbert, R.D. Starr, L.R. Nittler, Astrophys. J. 803, 67 (2015)
R.M. Dewey, J.A. Slavin, J.M. Raines, D.N. Baker, D.J. Lawrence, J. Geophys. Res. Space Phys. 122(12), 12170–12188 (2017)
L.G. Evans, P.N. Peplowski, F.M. McCubbin, T.J. McCoy, L.R. Nittler, M.Y. Zolotov, D.S. Ebel, D.J. Lawrence, R.D. Starr, S.Z. Weider, S.C. Solomon, Icarus 257, 417–427 (2015)
E.A. Frank, R.W.K. Potter, O. Abramov, P.B. James, R.L. Kilma, S.J. Mojzsis, L.R. Nittler, J. Geophys. Res., Planets 122, 614–632 (2017). https://doi.org/10.1002/2016JE005244
G.W. Fraser, J.D. Carpenter, D.A. Rothery, J.F. Pearson, A. Martindale, J. Huovelin, J. Treis, M. Anand, M. Anttila, M. Ashcroft, J. Benkoff, P. Bland, A. Bowyer, A. Bradley, J. Bridges, C. Brown, C. Bulloch, E.J. Bunce, U. Christensen, M. Evans, R. Fairbend, M. Feasey, F. Giannini, S. Hermann, M. Hesse, M. Hilchenbach, T. Jorden, K. Joy, M. Kaipiainen, I. Kitchingman, P. Lechner, G. Lutz, A. Malkki, K. Muinonen, J. Näränen, P. Portin, M. Prydderch, J. San Juan, E. Sclater, E. Schyns, T.J. Stevenson, L. Strüder, M. Syrjasuo, D. Talboys, P. Thomas, C. Whitford, S. Whitehead, Planet. Space Sci. 58, 79 (2010)
M. Grande, Adv. Space Res. 19(10), 1609–1614 (1997)
M. Grande, R. Browning, N. Waltham, D. Parker, S.K. Dunkin, B. Kent, B. Kellett, C.H. Perry, B. Swinyard, A. Perry, J. Feraday, C. Howe, G. Mcbride, K. Phillips, J. Huovelin, P. Muhli, P.J. Hakala, O. Vilhu, J. Laukkanen, N. Thomas, D. Hughes, H. Alleyne, M. Grady, R. Lundin, S. Barabash, D. Baker, P.E. Clark, C.D. Murray, J. Guest, I. Casanova, L.C. D’uston, S. Maurice, B. Foing, D.J. Heather, V. Fernandes, K. Muinonen, S.S. Russell, A. Christou, C. Owen, P. Charles, H. Koskinen, M. Kato, K. Sipila, S. Nenonen, M. Holmstrom, N. Bhandari, R. Elphic, D. Lawrence, Planet. Space Sci. 51, 427–433 (2003)
R.N. Grubb, The SMS/GOES Space Environment Monitor Subsystem. NOAA Technical Memorandum ERL SEL-42. Boulder, CO (1974)
G.P. Hall, A. Martindale, J.C. Bridges, L.R. Nittler, E.J. Bunce, The distribution of Peak-Ring Basins on Mercury and their correlation with the High-Mg/Si terrane, in Europlanet Science Congress 2020, online, 21 September–9 Oct 2020, EPSC2020-1103 (2020). https://doi.org/10.5194/epsc2020-1103
J.S. Heinonen, A.V. Luttinen, F.J. Spera, W.A. Bohrson, Contrib. Mineral. Petrol. 174, 87 (2019)
H. Heisinger et al., Space Sci. Rev. 216, 110 (2020, this issue). https://doi.org/10.1007/s11214-020-00732-4
D. Heyner et al., Space Sci. Rev. (2020, this issue)
G.C. Ho, R.D. Starr, S.M. Krimigis, J.D. Vandegriff, D.N. Baker, R.E. Gold, B.J. Anderson, H. Korth, D. Schriver, R.L. McNutt et al., Geophys. Res. Lett. 43, 550–555 (2016)
J. Huovelin et al., Space Sci. Rev. 216, 94 (2020, this issue). https://doi.org/10.1007/s11214-020-00717-3
F. Labonville, P. Charbonneau, A. Lemerle, Sol. Phys. 294, 82 (2019)
J.E. Lees, J.F. Pearson, Nucl. Instrum. Methods A 384, 410–424 (1997)
S.T. Lindsay, M.K. James, E.J. Bunce, S.M. Imber, H. Korth, A. Martindale, T.K. Yeoman, Planet. Space Sci. 125, 72–79 (2016)
P. Majewski, L. Andricek, A. Bähr, G. Vita, B. Gunther, K. Hermenau, M. Hilchenbach, T. Lauf, P. Lechner, G. Lutz, D. Miessner, M. Porro, J. Reiffers, R. Richter, G. Schaller, M. Schnecke, F. Schopper, H. Soltau, A. Stefanescu, J. Treis, IEEE Trans. Nucl. Sci. 59(5), 2479–2486 (2012)
P. Majewski, F. Aschauer, S. Aschauer, A. Bähr, B. Bergbauer, M. Hilchenbach, M. Krumrey, C. Laubis, T. Lauf, P. Lechner, G. Lutz, F. Scholze, H. Soltau, A. Stefanescu, L. Strüder, J. Treis, Exp. Astron. 37, 525–538 (2014). https://doi.org/10.1007/s10686-014-9374-5
A. Martindale Ph.D. thesis, University of Leicester (2008)
A. Martindale, J.F. Pearson, C.H. Feldman, G.I. Butcher, R. Willingale, R. Fairbend, E. Schyns, E.J. Bunce, in Proc. SPIE, vol. 10699 (2018). https://doi.org/10.1117/12.2314842
Y. Maruyama, K. Ogawa, T. Okada, M. Kato, Earth Planets Space 60, 293–297 (2008)
F.M. McCubbin, K.E. Vander Kaaden, P.N. Peplowski, A.S. Bell, L.R. Nittler, J.W. Boyce, L.G. Evans, L.P. Keller, S.M. Elardo, T.J. McCoy, J. Geophys. Res., Planets 122, 2053–2076 (2017)
A. Milillo, M. Fujimoto, G. Murakami et al., Investigating Mercury’s environment with the two-spacecraft BepiColombo mission. Space Sci. Rev. 216, 93 (2020)
I.G. Mitrofanov et al., Mercury gamma and neutron spectrometer MGNS for planetary orbiter of the BepiColombo mission. Planet. Space Sci. 58(1–2), 116 (2010)
I.G. Mitrofanov, A.B. Sanin, S.Y. Nikiforov, D.V. Golovin et al., Cosmic gamma-ray spectrometer with tagged charged particles of galactic cosmic rays. Nucl. Instrum. Methods Phys. Res. 953, 163148 (2020)
E. Montagnon et al., Space Sci. Rev. (2020, this issue)
A. Moretti, S. Campana, M. Capalbi, G. Chincarini, G. Cusumano, P. Giommi, V. Parola, V. Mangano, T. Mineo, M. Perri, P. Romano, G. Tagliaferri, AIP Conf. Proc. 836, 676–679 (2006)
G. Murakami et al., Space Sci. Rev. 216, 113 (2020, this issue). https://doi.org/10.1007/s11214-020-00733-3
J.L. Mutz, O. Bonnet, R. Fairbend, E. Schyns, J. Seguy, Proc. SPIE 6479, 64790F (2007)
O. Namur, M. Collinet, B. Charlier, T.L. Grove, F. Holtz, C. McCammon, Earth Planet. Sci. Lett. 439, 117–128 (2016). https://doi.org/10.1016/j.epsl.2016.01.030
J. Näränen, H. Parviainen, K. Muinonen, K. Nygård, M. Peura, J. Carpenter, Icarus 198, 408–419 (2008)
J. Näränen, J. Carpenter, H. Parviainen, K. Muinonen, G. Fraser, M. Peura, A. Kallonen, Adv. Space Res. 44, 313–322 (2009)
S. Narendranath, P.S. Athiray, P. Sreekumar, B.J. Kellett, L. Alha, C.J. Howe, K.H. Joy, M. Grande, J. Huovelin, I.A. Crawford, U. Unnikrishnan, S. Lalita, S. Subramaniam, S.Z. Weider, L.R. Nittler, O. Gasnault, D. Rothery, V.A. Fernandes, N. Bhandari, J.N. Goswami, M.A. Wieczorek, Icarus 214(1), 53–66 (2011). https://doi.org/10.1016/j.icarus.2011.04.010
L.R. Nittler, R.D. Starr, L. Lim, T.J. Mccoy, T.H. Burbine, J.I. Trombka, P. Gorenstein, S.W. Squyres, W.V. Boynton, T.P. McClanahan, J.S. Bhangoo, P.E. Clark, R. Killen, Meteorit. Planet. Sci. 36, 1673–1695 (2001)
L.R. Nittler, N.L. Chabot, T.L. Grove, P.N.P. Chapter, The chemical composition of Mercury, in Mercury: The View After MESSENGER, ed. by Solomon, Nittler, Anderson (2018). http://www.cambridge.org/9781107154452
T. Okada, M. Kato, A. Fujimura, H. Tsunemi, S. Kitamoto, Adv. Space Res. 23, 1833–1836 (1999)
S. Orsini et al., Space Sci. Rev. (2020, this issue)
H. Parviainen, J. Näränen, K. Muinonen, J. Quant. Spectrosc. Radiat. Transf. 112, 1907–1918 (2011)
A. Penttilä, T. Väisänen, J. Markkanen, J. Martikainen, T. Kohout, G. Videen, K. Muinonen, Rigorous light-scattering simulations of space-weathering effects on reflectance spectra. Icarus 345, 113727 (2020). https://doi.org/10.1016/j.icarus.2020.113727
P.N. Peplowksi, R.L. Klima, D.J. Lawrence, C.M. Ernst, B.W. Denevi, E.A. Frank, J.O. Goldsten, S.L. Murchie, L.R. Nittler, S.C. Solomon, Nat. Geosci. 9, 273 (2016)
P.N. Peplowski, D.J. Lawrence, E.A. Rhodes, A.L. Sprague, T.J. McCoy, B.W. Denevi, L.G. Evans, J.W. Head, L.R. Nittler, S.C. Solomon, K.R. Stockstill-Cahill, S.Z. Weider, J. Geophys. Res. 117(E12), E00L04 (2012)
P.N. Peplowski, L.G. Evans, K.R. Stockstill-Cahill, D.J. Lawrence, J.O. Goldsten, T.J. McCoy, L.R. Nittler, S.C. Solomon, A.L. Sprague, R.D. Starr, Icarus 228, 86–95 (2014)
D. Rothery et al., Rationale for BepiColombo studies of Mercury’s surface and composition. Space Sci. Rev. 216, 66 (2020). https://doi.org/10.1007/s11214-020-00694-7
Y. Saito et al., Space Sci. Rev. (2020, this issue)
C.E. Schlemm, R.D. Starr, G.C. Ho et al., Space Sci. Rev. 131, 393–415 (2007)
F. Scholze, M. Procop, X-Ray Spectrom. 38, 312–321 (2009)
F.D. Seward, J. Br. Interplanet. Soc. 31, 83–92 (1978)
S. Solomon, L. Nittler, B. Anderson (eds.), Mercury: The View After MESSENGER (Cambridge Planetary Science) (Cambridge University Press, Cambridge, 2018). https://doi.org/10.1017/9781316650684
R.D. Starr, D. Schriver, L.R. Nittler, S.Z. Weider, P.K. Byrne, G.C. Ho, E.A. Rhodes, C.E. Schlemm II, S.C. Solomon, P.M. Trávníček, J. Geophys. Res., Planets 117, E00L02 (2012)
R.D. Starr, C.E. Schlemm II, G.C. Ho, L.R. Nittler, R.E. Gold, S.C. Solomon, Planet. Space Sci. 122, 13–25 (2016). https://doi.org/10.1016/j.pss.2016.01.003
R.J. Thomas, D.A. Rothery, S.J. Conway, M. Anand, Icarus 229, 221 (2014a)
R.J. Thomas, D.A. Rothery, S.J. Conway, M. Anand, J. Geophys. Res., Planets 119, 2239 (2014b)
N. Thomas, H. Hussmann, T. Spohn, L.M. Lara, U. Christensen, M. Affolter, T. Bandy, T. Beck, S. Chakraborty, U. Geissbuehler, M. Gerber, K. Ghose, J. Gouman, A. HosseiniArani, K. Kuske, A. Peteut, D. Piazza, M. Rieder, A. Servonet, C. Althaus, T. Behnke, K. Gwinner, C.H. ttig, R. Kallenbach, A. Lichopoj, K. Lingenauber, H.-G.L. tzke, F.L. dicke, H. Michaelis, J. Oberst, R. Schr dter, A. Stark, G. Steinbruegge, S. del Togno, K. Wickhusen, J.M. Castro, M. Herranz, J. Rodrigo, H. Perplies, T. Weigel, S. Schulze- Walewski, S. Blum, A. Casciello, E. Rugi- Grond, W. Coppoolse, M. Rech, K. Weidlich, T. Leikert, R. Henkelmann, B. Trefzger, B. Metz, Space Sci. Rev. (2020, this issue)
J. Toor, F.D. Seward, Astron. J. 79, 995 (1974)
J. Treis, O. Hälker, L. Andricek, S. Herrmann, K. Heinzinger, T. Lauf, P. Lechner, G. Lutz, M. Mas-Hesse, M. Porro, R. Richter, J. San Juan Manrique, G. Schaller, M. Schnecke, F. Schopper, G. Segneri, H. Soltau, T. Stevenson, L. Strüder, C. Whitford, in Proc. SPIE (2008), pp. 0Z1–0Z12
J. Treis, L. Andricek, F. Aschauer, K. Heinzinger, S. Herrmann, M. Hilchenbach, T. Lauf, P. Lechner, G. Lutz, P. Majewski, M. Porro, R.H. Richter, G. Schaller, M. Schnecke, F. Schopper, H. Soltau, A. Stefanescu, L. Strüder, G. de Vita, Nucl. Instrum. Methods Sect. A 624, 540–547 (2010). https://doi.org/10.1016/j.nima.2010.03.173
R. Van Grieken, A. Markowicz, Handbook of X-Ray Spectrometry: Methods and Techniques (Dekker, New York, 1993)
K.E. Vander Kaaden, F.M. McCubbin, J. Geophys. Res., Planets 120, 195–209 (2015)
P.H. Warren, Meteorit. Planet. Sci. 40(3), 477–506 (2005)
S.Z. Weider, B.M. Swinyard, B.J. Kellett, C.J. Howe, K.H. Joy, I.A. Crawford, J. Gow, D.R. Smith, Planet. Space Sci. 59, 1393–1407 (2011)
S.Z. Weider, L.R. Nittler, R.D. Starr, T.J. McCoy, S.C. Solomon, Icarus 235, 170–186 (2014)
S.Z. Weider, L.R. Nittler, R.D. Starr, E.J. Crapster-Pregont, P.N. Peplowski, B.W. Denevi, J.W. Head, P.K. Byrne, S.A. Hauck II, D.S. Ebel, S.C. Solomon, Earth Planet. Sci. Lett. 416, 109–120 (2015). https://doi.org/10.1016/j.epsl.2015.01.023
R. Willingale, G.W. Fraser, A.N. Brunton et al., Exp. Astron. 8, 281–296 (1998)
H. Wolter, Ann. Phys. 10, 94 (1952)
A. Yang Yang, C. Wang, Y. Liang, C. Johan Lissenberg, Geochem. Geophys. Geosyst. 20, 4390–4407 (2019). https://doi.org/10.1029/2019GC008368
Acknowledgements
MIXS is dedicated to the memory of our friend and colleague, the late Professor George Fraser - the driving force behind our instrument.
The authors would like to express their deep gratitude to the technical teams in all collaborator institutes who have helped in the development and delivery of MIXS, the BepiColombo project office, the science ground segment and operational ground segment at the European Space Agency, and the industrial consortium who designed and built BepiColombo. Without their commitment and dedication our mission would have been impossible. Particular thanks go to Johannes Benkhoff, Bodo Gramkow, Carsten Scharmberg, Marc Schwetterle, Fabio Giannini, Emmanuel Rouvier, Luigi D’Arcio and Ulrich Heer for their support and good humour during difficult times. The MIXS team also thanks the UK Space Agency Project Management Board (Chaired by Prof. Alan Smith) and Rosemary Young for their support and encouragement through the difficult process of design, build, delivery and early operations.
The MIXS team has gratefully received funding from a consortium of agencies across Europe. The UK Space Agency are the lead funding agency, supported by national contributions from our amazing pan-European team and the European Space Agency. UK funding has come from, the science and technology facilities council - STFC (grant numbers: PP/E002056/1; PP/E002412/1; ST/L000776/1; ST/M002101/1; ST/M002187/1; ST/N00339X/1; ST/N000471/1; ST/P001963/1; ST/S002596/1; ST/J000213/1), the United Kingdom Space Agency - UKSA (grant numbers: ST/P000908/1; ST/T001542/1; ST/K003194/1; ST/ L000318/1; ST/M000702/1) and the European Space Agency - ESA (contract numbers: 4000118221/16/ ES/JD; RES-PSS/NR/035-B/200; 20919/07/NF/FG). Images shown in Fig. 4, Fig. 6 and Fig. 9 are adapted from drawings produced by MagnaParva Ltd. under ESA contract number 20919/07/NL/FG. EJB is supported by a Royal Society Wolfson Research Merit Award. The DEPFET X-ray detectors were contributed with the support of dedicated Max Planck Society grants by MPG and MPS as well as ESA contract number 4000108312. The Spanish contribution was funded by MEC/MINECO/MICINN grants; AYA2008-03467/ESP, AYA2011-24780, AYA2012-39362-C02-01, ESP2014-59789-P and ESP2015-65712-C5-1-R. Finnish hardware contributions were funded by Tekes (now “Business Finland”) during the era from 2004 to 2019. Research at the University of Helsinki is supported, in part, by the Academy of Finland (grant number 1325805).
This research used the ALICE and SPECTRE High Performance Computing Facilities at the University of Leicester.
Author information
Authors and Affiliations
Corresponding author
Additional information
Publisher’s Note
Springer Nature remains neutral with regard to jurisdictional claims in published maps and institutional affiliations.
The BepiColombo mission to Mercury
Edited by Johannes Benkhoff, Go Murakami and Ayako Matsuoka
Rights and permissions
Open Access This article is licensed under a Creative Commons Attribution 4.0 International License, which permits use, sharing, adaptation, distribution and reproduction in any medium or format, as long as you give appropriate credit to the original author(s) and the source, provide a link to the Creative Commons licence, and indicate if changes were made. The images or other third party material in this article are included in the article’s Creative Commons licence, unless indicated otherwise in a credit line to the material. If material is not included in the article’s Creative Commons licence and your intended use is not permitted by statutory regulation or exceeds the permitted use, you will need to obtain permission directly from the copyright holder. To view a copy of this licence, visit http://creativecommons.org/licenses/by/4.0/.
About this article

Cite this article
Bunce, E.J., Martindale, A., Lindsay, S. et al. The BepiColombo Mercury Imaging X-Ray Spectrometer: Science Goals, Instrument Performance and Operations. Space Sci Rev 216, 126 (2020). https://doi.org/10.1007/s11214-020-00750-2
Received:
Accepted:
Published:
DOI: https://doi.org/10.1007/s11214-020-00750-2