Analysis of the Variability and Future Evolution of Snowfall Trends in the Huaihe River Basin Under Climate Change
 Hengxin Dong
 Qiangyu Li
 Xiaochen Zhu
 Xinyu Zhang1
 - 1School of Applied Meteorology, Nanjing University of Information Science and Technology, Nanjing, China
- 2Zhuji Meteorological Bureau, Zhuji, China
- 3School of Geographical Sciences, Nanjing University of Information Science and Technology, Nanjing, China
Global warming changes the characteristics of regional climate and crop growth environments and affects human production and life in the long term. In this study, historical snowfall observation data from 199 conventional meteorological stations in the Huaihe River Basin were analyzed with the climate trend method, the nonparametric Mann-Kendall (M-K) test and the sliding t test to determine the variability and abrupt changes in climate trends in the Huaihe River Basin during 1951–2018. Then, the Coupled Model Intercomparison Project phase 6 datasets were used to analyze the evolutionary trend of snowfall under four climate change scenarios in 2015–2065. The results show the following: 1) Due to climate warming, both the historical data and the simulated data under different climate change scenarios show declining snowfall in the Huaihe River Basin. 2) Based on the analysis of historical data from meteorological stations, the snow events had a clear latitudinal distribution—the higher the latitude, the lower the occurrence of snow events. In contrast, as shown by the analysis results obtained under different climate change scenarios, the snow mass flux had a clear longitudinal distribution—the higher the longitude, the higher the snow mass flux. 3) In Scenario SSP370, 2050 is important because the snowfall changes from decreasing to increasing, and in 2065, the snowfall in most areas of the basin is greater than that in 2050. Furthermore, the snowfall along the southeastern coast of the basin has the greatest variability.
Introduction
Global warming and the frequent occurrences of extreme meteorological disasters and heavy snow events in the Northern Hemisphere during winter have caused large-scale traffic disruption, damage to power facilities and severe crop damage (Khattak and Knapp, 2001; Mccabe et al., 2007; Gao, 2009; Feng and Chen, 2016). Additonally, climate change alters the characteristics of the regional climate and environment and directly affects the productivity and safety of humans (Austnes et al., 2008; Johansson et al., 2011). The Huaihe River, with a total length of more than 1,000 km, is one of the seven major rivers in China and flows through the three provinces of Henan, Anhui, and Jiangsu; the occurrence and evolution trend of snowfall in the Huaihe River Basin can provide an important reference for the prevention and mitigation of local disasters.
The study of snowfall study is very important for safety and property protection, and the prediction, and modeling of the evolution of snow events are hot research fields. Previous studies on snowfall have mainly focused on the following areas: 1) the use of remote sensing images to retrieve the seasonal variability in snow cover (Pu et al., 2007; Dietz et al., 2013) and to simultaneously assess the variability in snow cover in grasslands, farmland and forests; 2) the analysis of the weather conditions during snow events and the causes and effects of snow events by investigating snowfall over large areas (Wang et al., 2009; Shi et al., 2010)—for example, Wang et al. (2008) and Gao et al. (2008) analyzed the climate characteristics, influences, and causes of heavy snowfall over large areas of South China in January 2008; 3) the investigation of the historical occurrences of snow events in an administrative region or in a mountain range—for example, Sun et al. (2010) analyzed the characteristics of snowfall variability in Northeast China during 1960–2015; 4) the exploration of the occurrence and evolution of snowfall and snow events by analyzing the records of relevant snow events based on in meteorological data (Li, 1993); and 5) the analysis of the characteristics and formation mechanism of snow events by analyzing the circulation patterns associated with snowfall (Birsan and Dumitrescu, 2014). Snowfall occurs over large areas in Central China every year and has resulted in severe traffic disruption and crop damage. However, few studies have been performed on winter snowfall in Central China, and studies on historical snow events and comprehensive analyses of snowfall evolution under climate change scenarios are lacking.
In this study, the Huaihe River Basin in Central China was selected as the study area to analyze the evolution of snowfall trends obtained from historical data and under climate change scenarios. This study finds that as more effort is made to mitigate climate change, the snowfall variability caused by climate warming gradually weakens, starting in 2050.
Data and Methods
Data
In this study, the Huaihe River, one of the seven largest rivers in China, was selected as the study area. The Huaihe River Basin is located between the Yangtze River Basin and the Yellow River Basin. It has an area of 270,000 km2. The Huaihe River is in the climate transition zone between northern and southern China and is located in the warm semihumid monsoon climate zone. The Huaihe River Basin is an important grain production region in China. The snowfall variability in the basin has a great impact on the growth of winter wheat and other crops, large-scale transportation, and power facilities. This study used snowfall data and weather phenomenon data from 199 conventional meteorological stations in the Huaihe River Basin, basin elevation data and meteorological station distribution data. Figure 1 shows the topography and meteorological station distribution in the Huaihe River Basin. In addition, the Coupled Model Intercomparison Project phase 6 (CMIP6) datasets and the WATCH Forcing Data methodology applied to ERA5 (WFDE5) reanalysis data (Cucchi et al., 2020) were used to verify the applicability of multiple models in the CMIP6 datasets. The CMIP6 data of 2015–2065 were used to analyze the snowfall evolution in different scenarios.
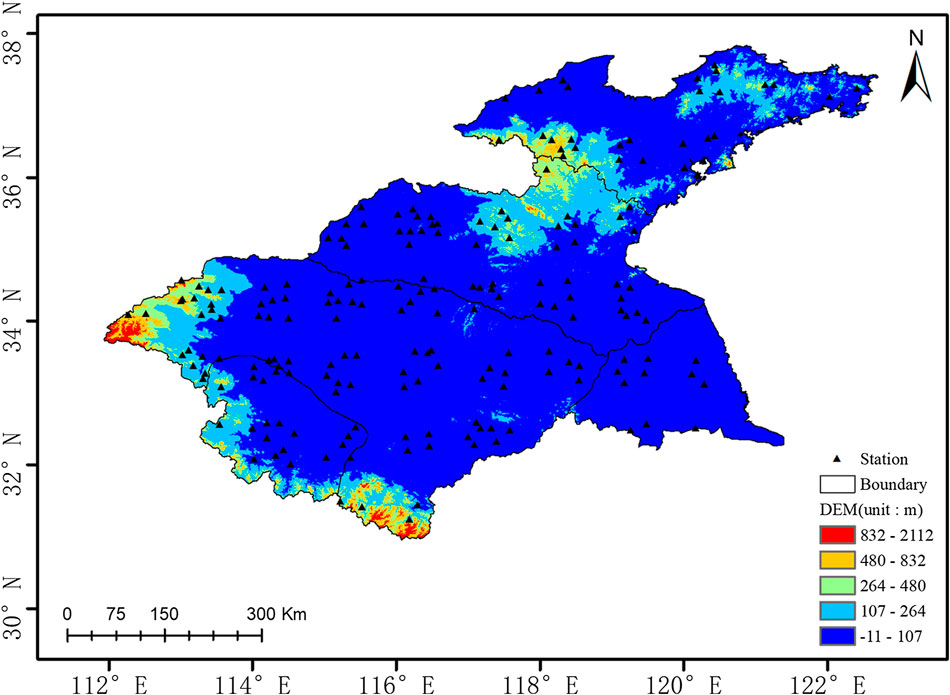
FIGURE 1. Distribution of the topography and meteorological stations in the Huaihe River Basin.
Before using the multimodel data in CMIP6 for snowfall analysis, it is necessary to evaluate the applicability of multiple models and choose suitable models to analyze snowfall evolution. In this study, the WFDE5 reanalysis data were used to evaluate the multiple models in the CMIP6 data for the years 2015–2018. WFDE5 is based on the ERA5 reanalysis data published by the European Center for Medium-Range Weather Forecasts, which provides high-accuracy global snowfall data (Cucchi et al., 2020). The CMIP data are obtained from climate change reports of the Intergovernmental Panel on Climate Change and provide important references. They have been widely used in the fields of meteorology (Priestley et al., 2020; Zhu et al., 2020), hydrology (Almazroui et al., 2020), ocean research (Grise and Davis, 2020) and others. The CMIP6 datasets included 11 models obtained under four climate change scenarios in 2015–2065 (Table 1). The ensemble member r1i1p1 was run for all models. In SSP126, the lowest radiative forcing scenario, the radiative forcing is stabilized at 2.6 W/m2, and it supports studies with an objective to control the temperature rise within 2°; in SSP245, the low-to-moderate radiative forcing scenario, the radiative forcing is stabilized at 4.5 W/m2; in SSP370, the moderate-to-high radiative forcing scenario, the radiative forcing is stabilized at 7 W/m2; and SSP585, the high radiative forcing scenario, is the only scenario that can intentionally achieve a radiative forcing of 8.5 W/m2 by the end of the present century (Zhang et al., 2019). Since different spatial data have different spatial resolutions, prior to the assessment of model quality, the spatial resolutions of all models must be bilinearly interpolated to be consistent with the spatial resolution of WFDE5, i.e., a
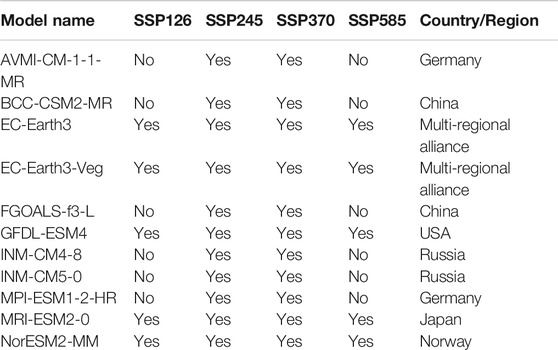
TABLE 1. Global climate models in CMIP6.
Research Methods
Snowfall Classification
The snow was classified with the 24-h snowfall standard of the China Meteorological Administration into severe snowstorms (24-h snowfall
Introduction and Verification of Model Data
Climate simulations can provide powerful information on climate change trends. However, the quality of the information needs to be assessed before application. In this study, the mean correlation coefficient, root mean square error (RMSE), and standard deviation (STD) were used to assess the climate simulation data quality. The average correlation coefficient reflects the linear correlation between the predicted value and the reference value of the model. The higher the absolute value of the correlation coefficient is, the higher the simulation quality of the model is. The optimal value of the correlation coefficient is 1. The formula is as follows (Taylor, 2001):
where x represents a grid point in the study area,
The RMSE shows the magnitude of the error between the simulated and observed values at the station. The lower the RMSE is, the closer the response pattern is to the reference value, and the optimal value of RMSE is 0. The formula is as follows (Zhang et al., 2018):
The STD response model simulates its own stability. The lower the STD is, the better the model stability is. The optimal value of the STD is 1 (relative to the reference value). The formula is as follows (Rosero et al., 2009):
Trend Analysis Method
The climate trend can well express the long-term trends of change in meteorological elements. It is the simplest and most effective method for analyzing the relationship between snowfall and time. A positive climate trend indicates that snowfall increases over time, while a negative climate trend indicates that snowfall decreases over time. The calculation formula is as follows (Guo et al., 2018):
where k is determined by the least square method,
Mann-Kendall Test for Abrupt Changes
The nonparametric Mann-Kendall (M-K) test is mainly used to test the change trends and abrupt changes of a certain factor. In the time series test, the nonparametric M-K test was first proposed by Mann and Kendall. The advantage of the M-K test is its low requirement of samples the samples do not need to follow a specific distribution pattern and can have a small number of outliers. Therefore, the M-K test is widely used in meteorology, hydrology, and other disciplines. The calculation steps are as follows (Gocic and Trajkovic, 2013):
For a time series with n sample sizes,
where
In the formula, when
Time series
If the
Sliding T-test
The sliding t test is applied to test whether there is a significant difference between the means of two subsequences in the climate factor sequence based on whether there is a significant difference in the two overall means. If the test results exceed a certain level, a sudden change is considered to have occurred.
For time series x with a sample size of n, a moment is specified as the reference point, and the samples of the two subsequences
where
Analysis of Results
Characteristics of Snowfall Distribution
Spatial Distribution Characteristics of Snowfall
A spatial distribution map of snowfall in the Huaihe River Basin can be obtained using the inverse distance weighted spatial interpolation of the annual mean snowfall over 68 years from 1951 to 2018. As shown in Figure 2, the overall annual mean snowfall in the Huaihe River Basin differs significantly from south to north and gradually increases from northeast to southwest. The snowfall is lowest in the eastern Shandong Peninsula and highest in southeastern Anhui Province. The snowfall at the provincial boundaries between Shandong Province and Henan, Anhui, and Jiangsu Provinces is approximately 3.7 mm.
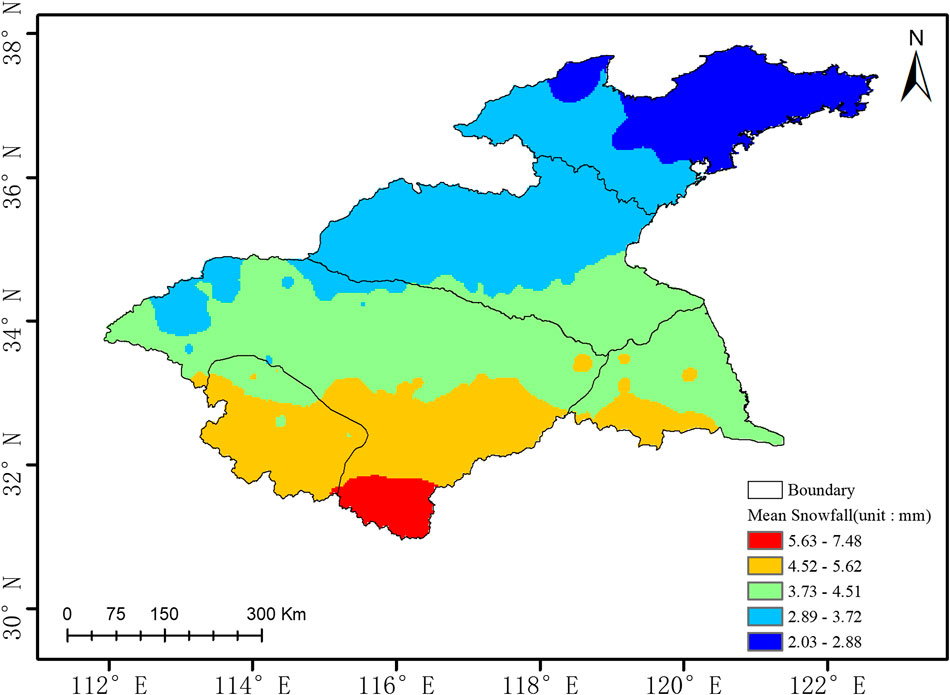
FIGURE 2. Spatial distribution of annual mean snowfall in the Huaihe River Basin.
Distribution Characteristics of the Climate-related Snowfall Trend
Using the annual mean snowfall data for the Huaihe River Basin from 1961 to 2018, we calculated the climate trend at each station. The climate distribution map was obtained using inverse distance weighted spatial interpolation (Figure 3). As shown in Figure 3, the positive changes in snowfall in the Huaihe River Basin are mainly distributed in western Shandong Province, southwestern and northwestern Jiangsu Province, central Anhui Province, and central and western Henan Province. The highest trend is 11.06
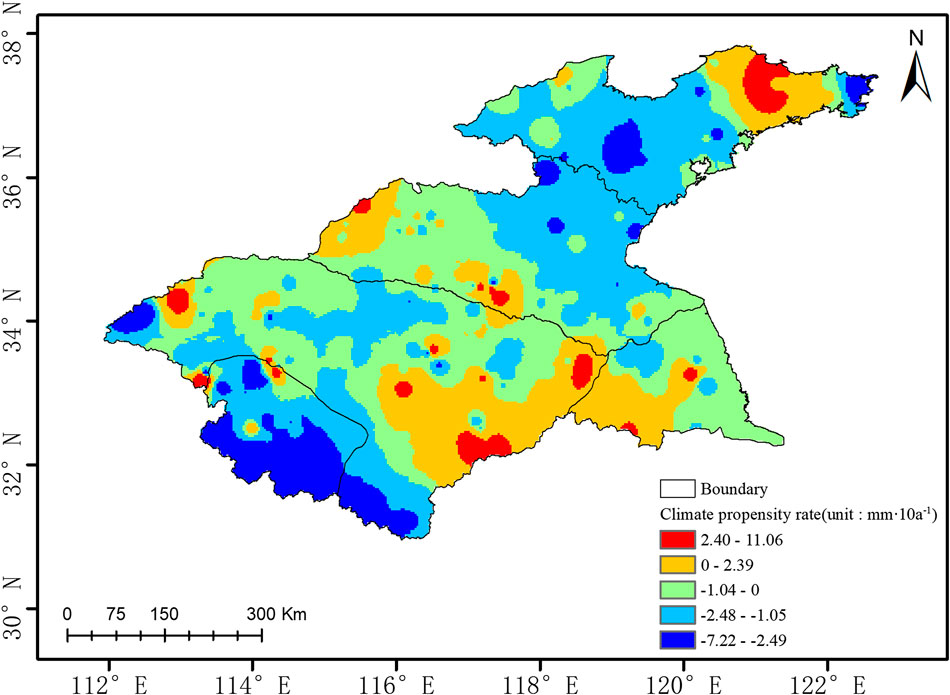
FIGURE 3. Distribution of the climate trend for snowfall in the Huaihe River Basin.
Analysis of the Snowfall Trend
The changes in the number of snow events and changes in snowfall in the Huaihe River Basin between 1952 and 2018 were statistically analyzed. Figure 4A shows that high numbers of snow events occurred in 1956, 1969, 1985, and 2012, and the corresponding snowfall reached 147.8, 242.9, 175.9, and 129.6 mm, respectively. The number of snow events is positively correlated with the annual snowfall, and the number of snow events in a year has gradually decreased with time. Figure 4B shows that high snowfall values occurred in 1993 and 1969, and the annual snowfall gradually decreased with time. Figure 4A,B show that the number of snow events and the amound of snowfall both decrease.
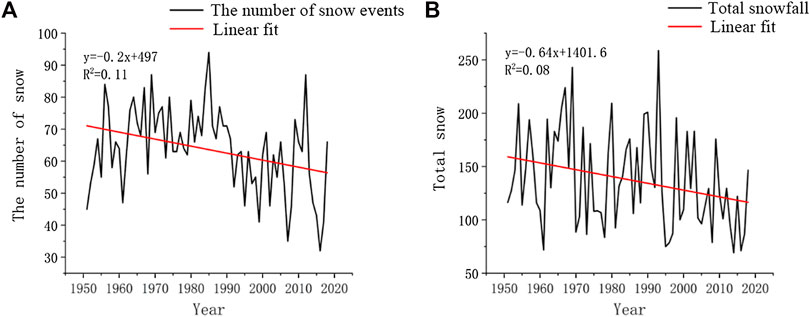
FIGURE 4. Variation curves of the number of snow events and the total snowfall in the Huaihe River Basin (A: number of snowfalls, B: total snowfall).
According to the snow classification criteria, snow events can be divided into light snow, moderate snow, heavy snow, snowstorms, heavy snowstorms, and severe snowstorms. The time dependence of the number of days with snow of each grade in the Huaihe River Basin from 1951 to 2018 was plotted, as shown in Figure 5. Figure 5A shows that large numbers of snow days occurred in 1971, 1985, and 2012, and the number of snow days in a year gently declined overall. Figure 5B shows that large numbers of days with moderate snow occurred in 1984 and 2010, and the number of days with moderate snow in a year decreased overall. Figure 5C shows that large numbers of days with heavy snow occurred in 1974 and 2000, and the decrease in the annual number of days with heavy snow was more significant than of the decrease in the number of snow days and the number of days with moderate snow. Figure 5D shows that large numbers of days with snowstorms occurred in 1954, 1964, 1985, 1987, 1989, and 1998. Figures 5E,F show that the interannual changes in the number of days with heavy snowstorms and the number of days with severe snowstorms were not significant. Overall, the number of days with light snow, moderate snow, heavy snow, snowstorms, heavy snowstorms, and severe snowstorms decreased over time. The declines in the number of days with heavy snow and the number of days with snowstorms were the most significant.
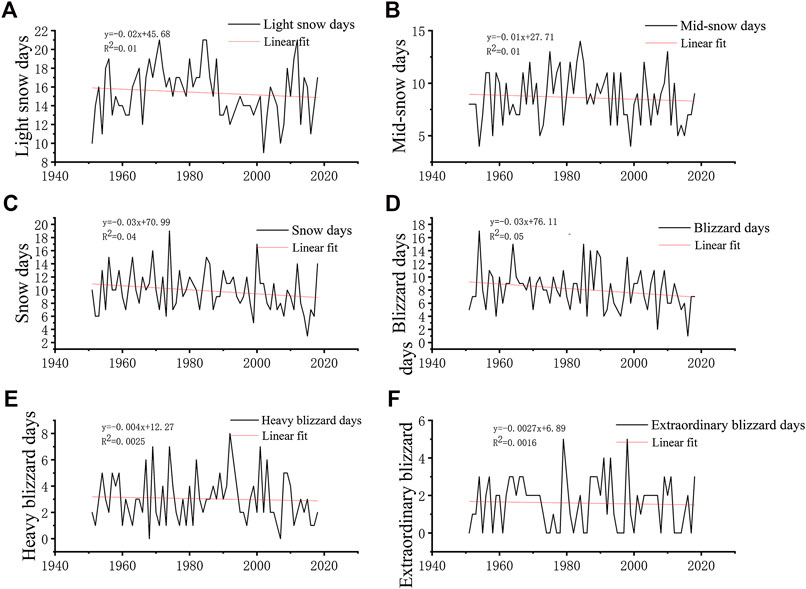
FIGURE 5. Interannual trend of days with snow of each grade in the Huaihe River Basin (A: number of days with light snow; B: number of days with moderate snow; C: number of days with heavy snow; D: number of days with snowstorms; E: number of days with heavy snowstorms; f: number of days with severe snowstorms).
Figure 6 shows the changes in the annual number of snow events, the annual average of the lowest temperature and the annual lowest of the mean temperature in the Huaihe River Basin from 1951 to 2018. The annual average temperature and the annual minimum temperature show an upward trend over time, while the number of annual snowfalls shows the opposite trend, showing a downward trend. It can be seen that there is a negative correlation between temperature and snowfall times.
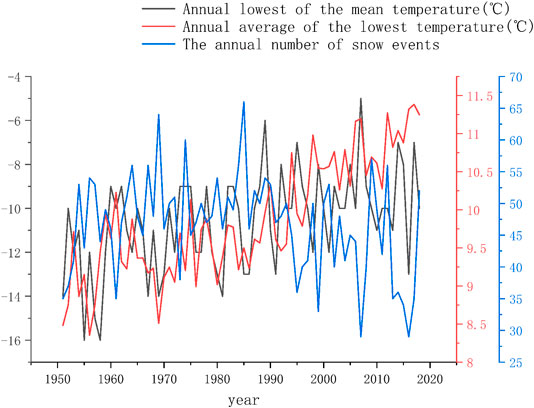
FIGURE 6. A comparative analysis of the annual number of snow events, the annual average of the lowest temperature and the annual lowest of the mean temperature.
The nonparametric M-K test and the sliding t test were used to analyze the abrupt changes in snowfall and snowfall days at weather stations in the Huaihe River Basin from 1951 to 2018, respectively, as shown in Figures 7 and 8. In the analysis of the sudden change in the number of snowfall days, Figure 7A shows a sudden change in the number of snowfall days in 1998, while the sudden change in Figure 8A occurred in the five years of 1962, 1979, 1990, 1991, and 2012. Therefore, we take the intersection of the nonparametric M-K test and the sliding t test as our final result. From 1951 to 2018, there was no obvious sudden change in the number of snowfall days. In the snowfall analysis in Figure 7B, changes occurred in 1972, 1986, and 2012, and in Figure 8B, changes occurred in 1986, 1988, and 2010. Therefore, by comparing the two analysis methods, it is found that a sudden change in snowfall occurred in 1986 and that this change in 1986 corresponded to a sudden switch from decreasing to increasing snowfall.
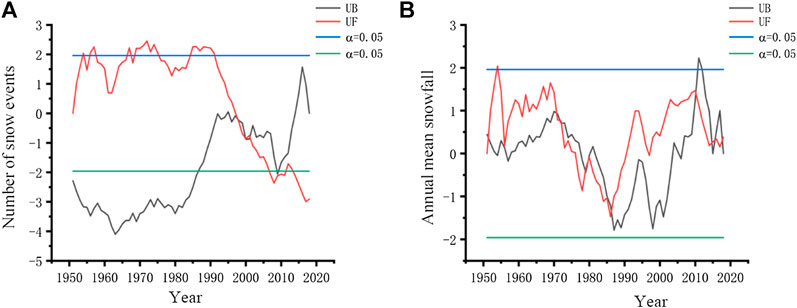
FIGURE 7. Nonparametric M-K test of snowfall days and sudden changes in snowfall in the Huaihe River Basin (a:number of snow events,b:annual mean snowfall).
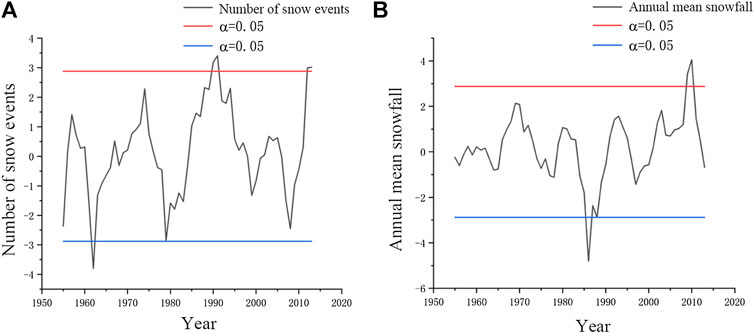
FIGURE 8. Sliding t test of snowfall days and sudden changes in snowfall in the Huaihe River Basin (a:number of snow events,b: annual mean snowfall).
Evolutional Trend of Snow Events in Climate Change Scenarios
Quality Assessment and Ensemble of Climate Change Scenarios
The quality of the CMIP6 multiscenario data was assessed using the WFDE5 climate reanalysis dataset of 2015–2018. A Taylor diagram was used to compare the quality of the data under different scenarios. It can well describe the closeness of a model (or a group of models) to the observed values (Taylor, 2001). Figure 9 shows the quality assessment results of snowfall predicted by the models under different emission scenarios. In the Taylor diagram, the higher the correlation coefficient, the closer the ratio of the STD of the model to the STD of the observed values is to 1, and the closer the RMSE is to 0. The closer the model is to the observed values, the better the simulation capability of the model. The ratios of the STD of the values simulated by models EC-Earth3 (Figure 9A), AWI-CM-1-1-MR (Figure 9B), BCC-CSM2-MR (Figure 9B), EC-Earth3-Veg Figure 9B), EC-Earth3 (Figure 9b), GFDL-ESM4 (Figure 9B), INM-CM4-8 (Figure 9B), INM-CM5-0 (Figure 9B), MPI-ESM1-2-HR (Figure 9B), INM-CM4-8 (Figure 9C), INM-CM5-0 (Figure 9C), EC-Earth3 (Figure 9D), and GFDL-ESM4 (Figure 9D) to the STD of the observed values are less than 1. This result indicates that the changes in the snowfall predicted by these models are smaller than the reference value and that the predicted results are stable. The ratio of the STD of the values simulated by the remaining models to the STD of the observed values is greater than 1. The results indicate that the changes in snowfall predicted by these models are larger than the reference value. The ratio between the RMSE of the results simulated by these models and the RMSE of the reference value shows that models EC-Earth3-Veg, FGOALS-f3-L, and NorESM2-MM have the lowest quality in the corresponding scenarios.
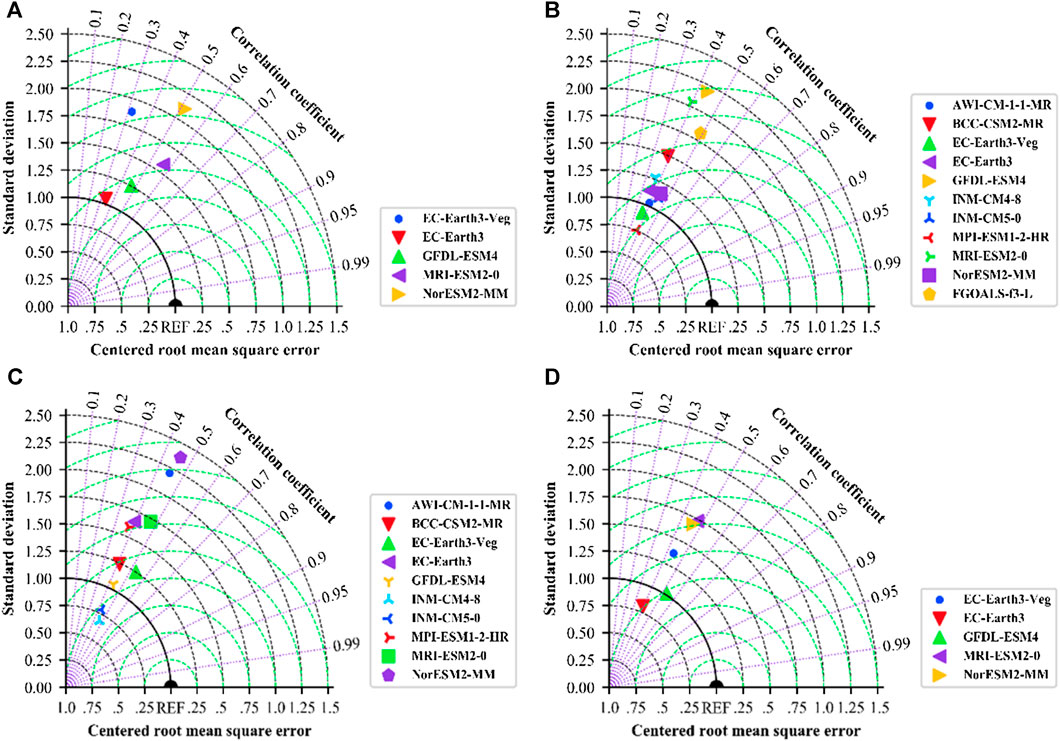
FIGURE 9. Taylor diagram of the quality assessment of snowfall under different models in each of the climate change scenarios (A: SSP126, B: SSP245, C: SSP370, D: SSP585).
Based on the above quality assessment results, in each scenario, the model with the poorest quality performance (model GFDL-ESM4 in scenario SSP126, model GFDL-ESM4 in scenario SSP245, model GFDL-ESM4 from scenario SSP370, and model EC-Earth3 in scenario SSP585) was excluded. The remaining models in each scenario are high-quality. After the model with the worst performance is excluded from each scenario, the screened models are obtained. The selected model data are grouped according to the characteristics of the corresponding scenario. In each time step and each grid point, the median snowfall is selected and called the ensemble median, which is used for subsequent simulations of the trend of snow mass flux.
Analysis of the Evolution of Snowfall Under Climate Change Scenarios
In this study, the ensemble median method was adopted to obtain the multimodel snowfall (the snowfall under the climate change scenarios is the snow mass flux), and the interannual evolution of the annual mean snowfall of 2015–2065 was plotted, as shown in Figure 10. There are certain differences between the evolution of snowfall in different climate scenarios. In the SSP126 scenario with the lowest emissions, snowfall is expected to reach 3/4 of its current value by 2060. In the SSP545 scenario with the highest emissions, the snowfall will decrease to half of its current value by 2060. In other scenarios with intermediate emissions, the predicted snowfall is similar and somewhat lower than the current value.
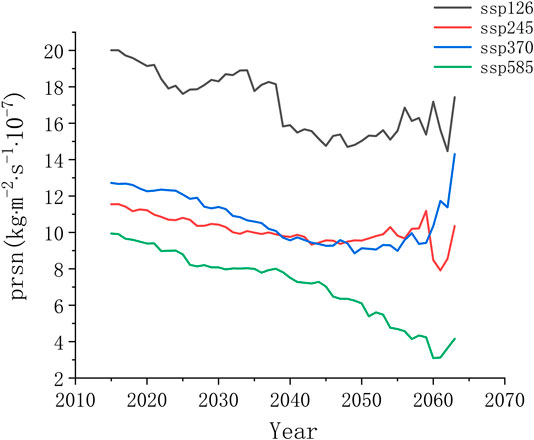
FIGURE 10. Diagram of future changes in snowfall in the Huaihe River Basin.
Through the analysis of the four climate change scenarios, the overall trends are relatively consistent. Relevant studies mostly use SSP370 as a representative model to analyze climate change (Shao et al., 2019; Butchart et al., 2020). This study also used the SSP370 model to analyze the snowfall trend of the Huaihe River Basin. As shown in Figure 10, the annual mean snowfall will change abruptly in 2050 from decreasing to rapidly increasing and will reach approximately 125% of the value in 2015 by the end of 2065.
In the study of long-term climate change, the interdecadal variability in the climate in China is correlated with the interdecadal variability in large-scale circulation patterns. Studying the variability in meteorological elements can help reveal the changes in circulation at a large scale (Nidheesh et al., 2017). Through mean filtering for interdecadal variability, the influence of low-frequency fluctuations can be eliminated. As shown in Figure 11, the changes in the future trend of snowfall are not significant in the SSP370 scenario and reach the minimum value in 2050, and the linear trend rate is
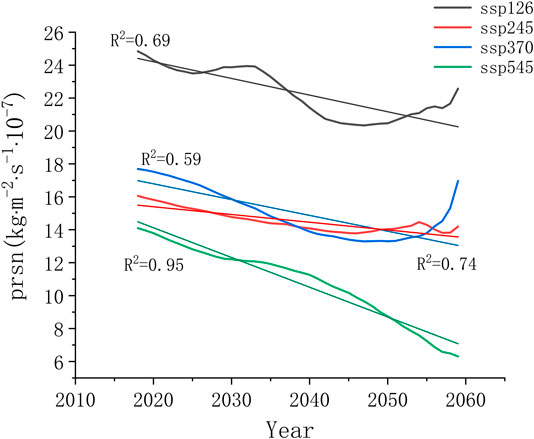
FIGURE 11. Nine-year moving average trend of annual snowfall in different scenarios.
Spatial Variability Characteristics of Snowfall in the Climate Scenarios
Through the accumulation of monthly snowfall, we can obtain the snowfall distribution map of 2015–2065 in future climate scenarios, as shown in Figure 12. The snowfall gradually increases from the coastal areas to the inland mountains and differs significantly from east to west. The cumulative snowfall is highest (reaching 6
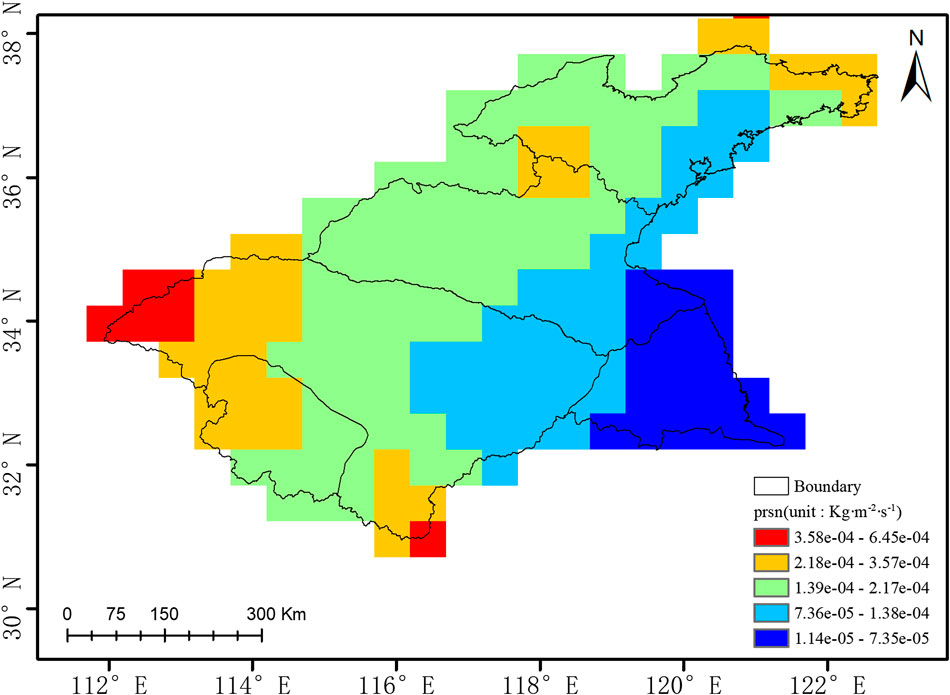
FIGURE 12. Spatial distribution of the annual mean snowfall in the Huaihe River Basin during 2015–2065.
By calculating the climate trend of annual snowfall in each grid over time, the spatial distribution of the climate trend is obtained, as shown in Figure 13. In most areas, the snowfall tendency rate is negative, and the snowfall decreases over time. In particular, snowfall declines slowly in the eastern coastal regions, whereas the snowfall trend is especially low in the western hilly areas, where snowfall declines most significantly. The rate of annual snowfall decline in most of the plains ranges from
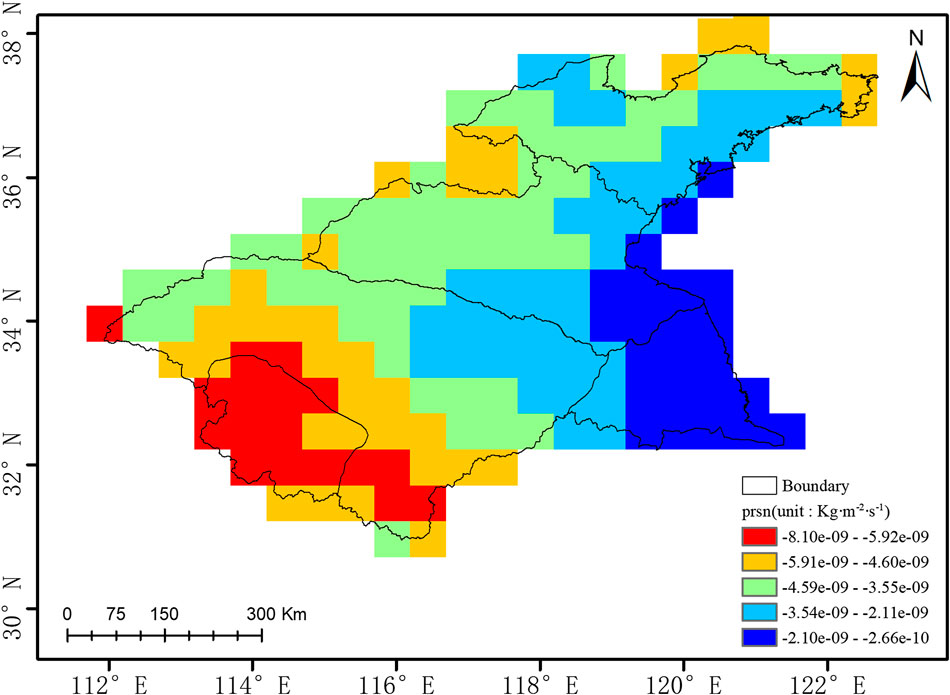
FIGURE 13. Distribution of the climate trend for snowfall in the Huaihe River Basin during 2015–2065.
Based on previous studies, the percentage change in snowfall in 2050 and 2065 relative to 2015 was calculated. Figure 14 shows the spatial distribution of the percentage change in snowfall. Figure 14A shows that by 2050, the snowfall in most areas decreases, with percentage changes of −60% to −20%. Additonally, the snowfall in the southern regions, southeastern coast regions, and northern regions decreases by more than 80%, and the snowfall in other regions decreases by approximately 40%. In contrast, snowfall increases in a small portion of the central regions. Figure 14B shows that by 2065, relative to 2015, snowfall has increased greatly (approximately 175% of that in 2015) in the central and southern regions, and the areas where the snowfall has doubled are mainly concentrated in the southeastern regions. Based on Figure 14A,B, the snowfall variability in the southeastern region is more intense than that in other regions; the snowfall in the northern region decreases significantly, reaching −50%; and the snowfall in most regions in 2065 is higher than that in 2050.
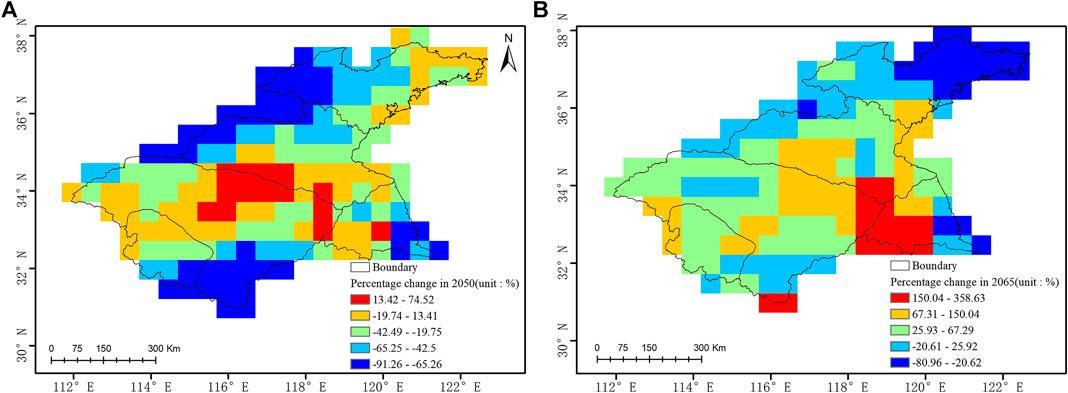
FIGURE 14. Percentage change in snowfall in the Huaihe River Basin in 2050 and 2065 relative to 2015 (A: 2050, B: 2065).
Discussion
The uncertainty in this work is mainly concentrated in the following aspects. First, the spatial resolution of WFDE5 is 0.5°. However, the spatial resolutions of different models used in the different scenarios in CMIP5 are different. The bilinear interpolation method was used to unify the spatial resolution of the above data, to match that of WFDE5, and there is uncertainty in the spatial distribution accuracy. Second, independent of whether CMIP6 or CMIP5 is selected, many assessments and comparisons of the quality of CMIP5 and CMIP6 are underway (Cucchi et al., 2020; Freund et al., 2020; Kim et al., 2020; Nie et al., 2020). Roach et al. found that compared with the previous CMIP5 models, most CMIP6 models are superior in quality in terms of characterizing the East Asian summer monsoon (EASM)-related interannual abnormal precipitation model in East China (Roach et al., 2020). The overall conclusion is that CMIP6 is better than CMIP5. Last, based on the snowfall data obtained at meteorological stations, the snowfall gradually increased from northeast to southwest, and the conclusion derived from the model data obtained under different scenarios is that the snowfall gradually increases from east to west (from coastal to inland regions). Although the two conclusions are slightly different, overall, there is less snowfall in coastal regions than in inland regions. The study found that high emissions will lead to an extreme reduction in snowfall in the basin, which is related to the reduction in snow events caused by climate warming. The underlying mechanism needs to be further investigated.
Sun et al. (2010) analyzed the characteristics of snowfall changes in Northeast China from 1960 to 2015, and found differences in the amount of snowfall in time, years in which major changes occurred, and space. In the research of this article, we not only study the historical evolution but also add the trend of snowfall in the coming decades based on climate scenario data. In snowfall research based on satellite imagery, there are numerous studies on snow cover and the changes in snow cover in middleand high-latitude areas and high-elevation areas using CMIP5 and CMIP6 data to predict snow cover in future climate scenarios (Birsan and Dumitrescu, 2014). This research method is similar to the research in this study, and the research conclusions are of great significance to regional climate change research, disaster prevention and disaster mitigation.
Conclusions
From the analysis of the climate trends based on meteorological observation data and the analysis of abrupt changes in snowfall, the total number of snow days, and the snowfall evolution in the Huaihe River Basin under climate change scenarios, the following conclusions are drawn.
As shown by the analysis of the historical snowfall data from the meteorological stations, the snowfall amount and the number of snow events in the basin decreased over time in the period 1951–2018. Based on the analyze with the nonparametric M-K test and sliding t test, 1986 was the year in which a sudden change occurred in the average annual snowfall amount, but there was no obvious sudden change in the number of snow events.
The analysis of snowfall evolution in the SSP370 scenario shows that 2050 is an important year because the snowfall amount will change from decreasing to increasing and that in 2065, the snowfall amount in most areas of the basin will be significantly larger than that in 2050. Additionally, the variability in snowfall is highest in the southeastern coastal region of the basin, indicating high instability in this region.
Under the background of climate change, snowfall will generally decrease over time. The snowfall shows a decline from 2015 to 2050 and reaches its lowest value in 2050. With continuous attention paid to climate change issues, the annual snowfall will be in the recovery stage in 2050–2065 and will rebound significantly.
Data Availability Statement
The raw data supporting the conclusions of this article will be made available by the authors, without undue reservation.
Author Contributions
HD, QL, and XZ: research conceptualization, methodology, formal analysis, and writing first draft preparation. XZ, ZZ, JS, and YH: supervision. All authors contributed to manuscript revision, read, and approved the submitted version.
Funding
The National Key R&D Program of China (2019YFB2102003), the National Natural Science Foundation of China Project (41805049 and 41971298) and Research Start-up Funds of Nanjing University of Information Science and Technology (2018r009) supported this work.
Conflict of Interest
The authors declare that the research was conducted in the absence of any commercial or financial relationships that could be construed as a potential conflict of interest.
Acknowledgments
We acknowledge the data support from the Lake-Watershed Science Data Center, National Earth System Science Data Center, National Science and Technology Infrastructure of China (http://lake.geodata.cn).
References
Almazroui, M., Saeed, F., Saeed, S., Islam, M. N., Ismail, M., Klutse, N. A. B., et al. (2020). Projected change in temperature and precipitation over Africa from CMIP6. Earth Syst. Environ. 4, 455–475. doi:10.1007/s41748-020-00161-x
Austnes, K., Kaste, Ø., Vestgarden, L. S., and Mulder, J. (2008). Manipulation of snow in small headwater catchments at Storgama, Norway: effects on leaching of total organic carbon and total organic nitrogen. AMBIO A J. Hum. Environ. 37, 38–47. doi:10.1579/0044-7447(2008)37[38:mosish]2.0.co;2
Birsan, M.-V., and Dumitrescu, A. (2014). Snow variability in Romania in connection to large‐scale atmospheric circulation. Int. J. Climatol. 34, 134–144. doi:10.1002/joc.3671
Butchart, N., Anstey, J. A., Kawatani, Y., Osprey, S. M., Richter, J. H., and Wu, T. (2020). QBO changes in CMIP6 climate projections. Geophys. Res. Lett. 47, e2019GL086903. doi:10.1029/2019gl086903
Cucchi, M., Weedon, G. P., Amici, A., Bellouin, N., Lange, S., Schmied, H. M., et al. (2020). WFDE5: bias adjusted ERA5 reanalysis data for impact studies. Earth Syst. Sci. Data Discuss. 12, 1–32. doi:10.5194/essd-12-2097-2020
Dietz, A. J., Kuenzer, C., and Conrad, C. (2013). Snow-cover variability in central Asia between 2000 and 2011 derived from improved MODIS daily snow-cover products. Int. J. Rem. Sens. 34, 3879–3902. doi:10.1080/01431161.2013.767480
Du, R., Shang, F., and Ma, N. (2019). Automatic mutation feature identification from well logging curves based on sliding t test algorithm. Cluster Comput. 22, 14193–14200. doi:10.1007/s10586-018-2267-z
Feng, Y., and Chen, H.-P. (2016). Warming over the North Pacific can intensify snow events in Northeast China. AOSL 9, 122–128. doi:10.1080/16742834.2016.1133072
Freund, M. B., Brown, J. R., Henley, B. J., Karoly, D. J., and Brown, J. N. (2020). Warming patterns affect El Niño diversity in CMIP5 and CMIP6 models. J. Clim. 33 (19), 8237–8260. doi:10.1175/JCLI-D-19-0890.1
Gao, H. (2009). China’s snow disaster in 2008, who is the principal player? Int. J. Climatol. 29, 2191–2196. doi:10.1002/joc.1859
Gao, H., Chen, L., Jia, X., Ke, Z., Han, R., Zhang, P., et al. (2008). Analysis of the severe cold surge, ice-snow and frozen disasters in south China during january 2008: Ⅱ. Possible climatic causes. Meteorol. Mon. 34, 101–106 [in Chinese, with English summary]. doi:10.1509/jimk.16.3.108
Gocic, M., and Trajkovic, S. (2013). Analysis of changes in meteorological variables using Mann-Kendall and Sen’s slope estimator statistical tests in Serbia. Global Planet. Change. 100, 172–182. doi:10.1016/j.gloplacha.2012.10.014
Grise, K. M., and Davis, S. M. (2020). Hadley cell expansion in CMIP6 models. Atmos. Chem. Phys. 20, 5249–5268. doi:10.5194/acp-20-5249-2020
Guo, B., Kong, W., Jiang, L., and Fan, Y. (2018). Analysis of spatial and temporal changes and its driving mechanism of ecological vulnerability of alpine ecosystem in Qinghai Tibet Plateau. Ecological Science. 37, 96–106. doi:10.14108/j.cnki.1008-8873.2018.03.013
Johansson, C., Pohjola, V. A., Jonasson, C., and Callaghan, T. V. (2011). Multi-decadal changes in snow characteristics in sub-Arctic Sweden. Ambio 40, 566. doi:10.1007/s13280-011-0164-2
Khattak, A. J., and Knapp, K. K. (2001). Interstate highway crash injuries during winter snow and nonsnow events. Transport. Res. Rec. 1746, 30–36. doi:10.3141/1746-05
Kim, Y.-H., Min, S.-K., Zhang, X., Sillmann, J., and Sandstad, M. (2020). Evaluation of the CMIP6 multi-model ensemble for climate extreme indices. Weather and Climate Extremes. 29, 100269. doi:10.1016/j.wace.2020.100269
Li, P. (1993). Dynamic characteristic of snow cover in western China. Acta Geograph. Sin. 48, 505–515.
Mccabe, G. J., Clark, M. P., and Hay, L. E. (2007). Rain-on-snow events in the Western United States. Bull. Am. Meteorol. Soc. 88, 319–328. doi:10.1175/bams-88-3-319
Nidheesh, A. G., Lengaigne, M., Vialard, J., Izumo, T., Unnikrishnan, A. S., and Cassou, C. (2017). Influence of ENSO on the Pacific decadal oscillation in CMIP models. Clim. Dynam. 49, 3309–3326. doi:10.1007/s00382-016-3514-8
Nie, S., Fu, S., Cao, W., and Jia, X. (2020). Comparison of monthly air and land surface temperature extremes simulated using CMIP5 and CMIP6 versions of the Beijing climate center climate model. Theor. Appl. Climatol. 140, 487–502. doi:10.1007/s00704-020-03090-x
Priestley, M. D., Ackerley, D., Catto, J. L., Hodges, K. I., Mcdonald, R. E., and Lee, R. W. (2020). An overview of the extratropical storm tracks in CMIP6 historical simulations. J. Clim. 33 (15), 6315–6343. doi:10.1175/JCLI-D-19-0928.1
Pu, Z., Xu, L., and Salomonson, V. V. (2007). MODIS/Terra observed seasonal variations of snow cover over the Tibetan Plateau. Geophys. Res. Lett. 34, 137–161. doi:10.1029/2007gl029262
Roach, L. A., Dörr, J., Holmes, C. R., Massonnet, F., Blockley, E. W., Notz, D., et al. (2020). Antarctic sea ice area in CMIP6. Geophys. Res. Lett. 47, e2019GL086729. doi:10.1029/2019gl086729
Rosero, E., Yang, Z.-L., Gulden, L. E., Niu, G.-Y., and Gochis, D. J. (2009). Evaluating enhanced hydrological representations in Noah LSM over transition zones: implications for model development. J. Hydrometeorol. 10, 600–622. doi:10.1175/2009jhm1029.1
Shao, R., Zhang, B., Su, T., Long, B., Cheng, L., Xue, Y., et al. (2019). Estimating the increase in regional evaporative water consumption as a result of vegetation restoration over the Loess Plateau, China. J. Geophys. Res. Atmos. 124, 11783–11802. doi:10.1029/2019jd031295
Shi, J. J., Tao, W.-K., Matsui, T., Cifelli, R., Hou, A., Lang, S., et al. (2010). WRF simulations of the 20–22 January 2007 snow events over eastern Canada: comparison with in situ and satellite observations. J. Appl. Meteor. Climatol. 49, 2246–2266. doi:10.1175/2010jamc2282.1
Sun, X., Sun, Z., and Luo, Y. (2010). Characteristics of snowfall from 1960 to 2005 in northeast China. J. Meteorol. Environ. 1, 1–5 [in Chinese, with English summary]. doi:10.3969/j.issn.1673-503X.2010.01.001
Taylor, K. E. (2001). Summarizing multiple aspects of model performance in a single diagram. J. Geophys. Res. 106, 7183–7192. doi:10.1029/2000jd900719
Wang, D., Liu, C., Liu, Y., Wei, F., Zhao, N., Jiang, Z., et al. (2009). A preliminary analysis of features and causes of the snow storm event over the southern areas of China in January 2008. Journal of Meteorological Research. 23, 374–384.
Wang, L., Gao, G., Zhang, Y., Sun, J., Wang, Z., Zhang, Y., et al. (2008). Analysis of the severe cold surge, ice-snow and frozen disasters in south China during january 2008: I. Climatic features and its impact. Meteorol. Mon. 34, 95–100 [in Chinese, with English summary]. doi:10.7519/j.issn.1000-0526.2008.04.012
Zhang, L., Chen, X., and Xin, X. (2019). Short commentary on CMIP6 scenario model intercomparison project (ScenarioMIP). Climate Change Research. 15, 519–525 [in Chinese, with English summary]. doi:10.12006/j.issn.1673-1719.2019.082
Keywords: climate warming, snowfall, trend change, analysis of abrupt changes, climate change scenario
Citation: Dong H, Li Q, Zhu X, Zhang X, Zhang Z, Shi J and He Y (2020) Analysis of the Variability and Future Evolution of Snowfall Trends in the Huaihe River Basin Under Climate Change. Front. Earth Sci. 8:594704. doi: 10.3389/feart.2020.594704
Received: 14 August 2020; Accepted: 22 September 2020;
Published: 28 October 2020.
Edited by:
Lei Zhang, University of Colorado Boulder, United StatesReviewed by:
Enliang Guo, Inner Mongolia Normal University, ChinaJifu Yin, University of Maryland, United States
Copyright © 2020 Zhu, Dong, Li, Zhang, Zhang, Shi and He . This is an open-access article distributed under the terms of the Creative Commons Attribution License (CC BY). The use, distribution or reproduction in other forums is permitted, provided the original author(s) and the copyright owner(s) are credited and that the original publication in this journal is cited, in accordance with accepted academic practice. No use, distribution or reproduction is permitted which does not comply with these terms.
*Correspondence: Xiaochen Zhu, xiaochen.zhu@nuist.edu.cn