Relationships Between Jianghuai Meiyu Anomaly and the Collaborative Evolution of Wave Trains in the Upper and Lower Troposphere in Mid-July of 2020
 Junyu Wang
- Key Laboratory of Meteorological Disaster, Ministry of Education(KLME)/Joint International Research Laboratory of Climate and Environment Change(ILCEC)/Collaborative Innovation Center on Forecast and Evaluation of Meteorological Disasters (CIC-FEMD), Nanjing University of Information Science & Technology, Nanjing, China
Based on the European Center for Medium-Range Weather Forecasts (ECMWF) reanalysis dataset (ERA5), the sea surface temperature (SST) and the outgoing longwave radiation data and the daily precipitation data, the relationship between the Meiyu anomaly in the Yangtze-Huaihe river basin (YHB) and the collaborative evolution of wave trains in the upper and lower troposphere in the mid-July of 2020 is analyzed. The results show that the key circulation background for the long-lasting Meiyu season in the summer of 2020 is the coexistence and collaborative evolution of the “− + −” Silk-Road (SR) wave train in the upper troposphere and the “+ − +” Pacific-Japan (PJ) wave train in the middle-lower troposphere, which is in favor of the movement toward each other of the South Asia high and the western Pacific subtropical high (WPSH), resulting in the upper-level divergence over the YHB where is the right side of the jet entrance area. The western Pacific subtropical high strengthens and extends westward, transporting abundant water vapor to the YHB supplied by the strong southwesterly warm-moist airflow from the Western Pacific and South China Sea. Meanwhile, the meridional circulation develops at the middle and high latitudes, steering the cold-dry air to move southward frequently. Cold-dry air and warm-moist air strongly interact over the YHB, leading to the long-lasting Meiyu season. The coordinative evolution of the SR and PJ wave trains not only affects the persistence and intensity of precipitation in the YHB, but also can be regarded as a precursor signal for the occurrence of persistent heavy rainfall to some extent. The wave-activity flux dispersing eastward along the upper-level jet is beneficial to the development and maintenance of the SR wave train, and the poleward dispersing wave-activity flux is related to the development and maintenance of the PJ wave train. Additionally, along with the weakening El Nino in 2019, the anomalous convection caused by the warm SST in the Western Pacific warm pool is conducive to the formation and maintenance of the PJ wave train. The abnormal convection caused by the warm SST in the Indian Ocean and the east coast of the tropical Atlantic may affect the SR wave train. These are also one of the reasons for the long Meiyu season in 2020.
Introduction
Persistent precipitation events frequently occur during Meiyu season in the YHB in the context of global warming. The Meiyu shows some specific characteristics including uneven spatial distribution of precipitation, and increased (decreased) number of strong (weak) precipitation days (Ding et al., 2020). In 2020, the Meiyu period in the YHB is quite long, with an early onset and late ending. Moreover, there are many persistent heavy precipitation events during the Meiyu period, causing floods in many places. In the abnormal Meiyu period of 2020, the abnormal atmospheric circulation pattern was stably maintained, which is the main reason for the occurrence of persistent precipitation events in the YHB.
The SR wave train is an atmospheric circulation anomaly that frequently occurs in the upper troposphere of middle latitudes in the Northern Hemisphere in summer (Lu et al., 2002; Enomoto et al., 2003; Ambrizzi et al., 1995; Sato and Takahashi, 2006). Based on the special characteristics of the meridional wind in the upper troposphere, Lu et al. (2002) discovered the SR wave train is trapped along the upper-level westerly jet stream over the North Africa and Eurasian continent. Northerlies and southerlies appear alternatively in nearly zonal direction in the upper troposphere, which leads to the staggered distribution of precipitation anomalies. Enomoto et al. (2003) proposed that three main activity centers of the SR wave train are in the western-central Asia, the Mongolian area and the Far East. Subsequently, the truth that the atmospheric wave train moves eastward along the upper-level westerly jet over Eurasian continent has been confirmed in many studies (Ding and Wang, 2005; Kosaka et al., 2009; Yasui and Watanabe, 2010; Hong and Lu, 2016). Lu and Fu (2009) believed that the SR wave train could regulate the interactions among the members of the Eurasian circulation systems and links the East Asian summer monsoon and the Indian summer monsoon. Besides, they also believed it could significantly affect the temperature and precipitation in eastern Asia. Recent studies have shown that the annual variation of the SR wave train can lead to the wave-like cold and warm anomalies on the underlying surface. The prominent summer warming in Eurasia may be related to the regional warming caused by the SR wave train (Hong et al., 2018). The daily intense precipitation appearing only at the first half of events dominantly occur in mid-to-late spring, which are also associated with the SR wave train (Shang et al., 2020).
The main pattern of summer circulation anomalies in the middle and lower troposphere is the PJ wave train (Nitta, 1987), also known as the East Asia–Pacific pattern (EAP). It can simultaneously control several critical circulation systems, such as the WPSH, the Meiyu front and the Okhotsk blocking high (Huang and Li, 1988). The positive phase of the PJ wave train corresponds to the strengthening of the westward extension of the WPSH, the deepening of the Meiyu trough and the development of the Okhotsk blocking high, while it is just the opposite for the negative phase (Lu and Huang, 1998). The Okhotsk blocking high related to the PJ wave train contributes to the stable maintenance of the low trough from Lake Baikal to Northeast China. Thus the cold-dry air could be continuously transported to the middle latitudes of East Asia, and promotes the development and maintenance of the Meiyu front (Huang, 2004; Bueh et al., 2008). The PJ wave train could affect the summer weather and climate in East Asia through modulating the intensity and position of the westerly jet, the WPSH and the SAH (Chen and Zhai, 2015; Shang et al., 2020). Several studies used the PJ index to monitor and predict the strength of the East Asian summer monsoon and the amount of summer precipitation in the Yangtze River region, and the results show that, on an inter-seasonal scale, the positive phase of the PJ index favors the summer precipitation in the Yangtze River region, while the negative phase could inhibit the summer precipitation (Huang and Yan, 1999; Chen and Zhai, 2015).
In recent years, some studies have found that the PJ wave train sometimes accompanies with the SR wave train, enhancing the anomalies of extreme weather and causing more severe disasters, especially in June and July (Wakabayashi and Kawamura, 2004; Ogasawara and Kawamura, 2007; Ogasawara and Kawamura, 2008).Thereby, the uncertainty of monitoring and forecasting the summer precipitation in the YHB by using only the PJ index is increased. The Meiyu period in 2020 is exceptionally long. The mid-July is still in the Meiyu period when the climate mean state is the summer drought period. Then, in this period do the SR and PJ wave trains have abnormal maintenances? Are there some collaborative evolutions between them? Therefore, the main purpose of the present study is to examine the relationship between the late ending of the 2020 Meiyu and the collaborative evolutions of the SR and PJ wave trains, and to preliminary investigate the formation mechanisms of the two wave trains, so as to improve understanding of the impact of atmospheric wave trains on extreme precipitation events, as well as provide a reference basis for predicting summer drought and flood in East Asia.
Data and Method
Data
The 1979–2020 ERA5 reanalysis dataset (Hersbach et al., 2020) is provided by the European Center for Medium-Range Weather Forecasts (ECMWF) including geopotential height, horizontal wind, vertical wind field, etc., with a horizontal resolution of 2.5° × 2.5°.
The sea surface temperature (SST) data (a horizontal resolution of 2° × 2°, Huang et al., 2017) in 1979–2020 and the outgoing longwave radiation (OLR) data (a horizontal resolution of 2.5° × 2.5°) in 1979–2020 are provided by the National Oceanic and Atmospheric Administration (NOAA).
Daily precipitation data in 2020 is provided by the National Meteorological Information Center and China Meteorological Administration. To ensure that the station precipitation data and the reanalysis data have the same time series, we calculate the daily precipitation by using the total precipitation from 08:00 of the day to 08:00 Beijing time of the next day.
Method
To study the propagation of the quasi-stationary Rossby wave train, the wave-activity flux (WAF) defined by Takaya and Nakamura (2001) is adopted in this study. The WAF is calculated by using Eq. 38 of Takaya and Nakamura (2001). For simplification, only the stationary part of the WAF is calculated. Because of the quasi-stationary Rossby wave train, this simplification is a reasonable approximation. The formula is as follows:
where
The criteria of the Meiyu in YHB is from the national criteria of Meiyu monitoring index (GB/T 33671-2017).
Overview of the Jianghuai Meiyu in 2020
In 2020, the Meiyu season successively starts in the YHB from south to north in the first ten days of June, and the starting date is about seven days earlier than normal years. The Meiyu season ends successively from the end of July to the beginning of August, and the date is about 15 days later than normal years. The 2020 Meiyu period lasts for more than 60 days in some regions of the YHB, which is the longest since 1961. The average Meiyu rainfall in the YHB is about 759.2 mm and even nearly 1,000 mm in some areas, which is significantly more than normal and is the highest since 1961 (Figure 1A). During the 2020 Meiyu period, the heavy rainfall occurs frequently (https://mp.weixin.qq.com/s/9-57kR3fE6uCxPUlCra25g). It is worth noting that the persistent heavy rainfall occurred from July 11 to 19 with the cumulative precipitation of 200–450 mm in Hubei Province, Anhui Province and Jiangsu Province, which caused severe floods (Figure 1B). But in the climatic mean status, the ending date of the Meiyu season in the YHB is around July 10, and in the mid-July the YHB is already in the summer hot and drought period. During the early onset period from June 9 to 17, the cumulative precipitation is about 150–350 mm (Figure omitted), which is less than that during late ending period. So this paper focuses on the persistent heavy rainfall process in mid-July. What are the reasons for the late ending date of the 2020 Meiyu season? What are the atmospheric circulation backgrounds of the persistent heavy precipitation events? Do the wave trains in the upper and lower troposphere evolve collaboratively? These questions will be analyzed in the following.
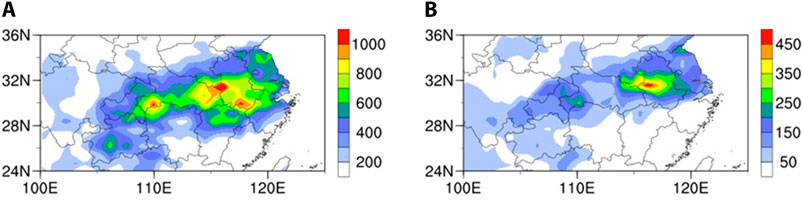
FIGURE 1. Cumulative precipitation in the YHB (A) from June 10 to July 31 and (B) in July 11–19, 2020 (unit: mm).
The Collaborative Evolution of Wave Trains in the Upper and Lower Troposphere and its Influence on the Persistent Precipitation During the Meiyu Period in the Yangtze-Huaihe River Basin
Previous studies show that the SR wave train, as a stable mode of the upper-level jet area in the Northern Hemisphere, can affect the precipitation anomaly along the East Asian coastal areas by regulating the positions of the SAH and the subtropical westerly jet (Hsu and Lin, 2007; Lu and Fu, 2009). It can be seen from Figure 2 that there is a quasi-zonal “− + −” wave train over Eurasia continent in 30°N–45°N in the mid-July of 2020, which is agreement with the SR wave train analyzed in previous studies. The three anomaly centers of geopotential height are located in Central Asia (60°E–75°E), East Asia (90°E–120°E) and the Far East (130°E–150°E), respectively. The positions of the east and west centers are in 40°N–45°N. The central center is located near 35°N, which is more southerly and favors the development of the meridional circulation at the middle and high latitudes and the maintenance of upper-level jet to the south of 40°N. The YHB is located on the right side of the entrance area of the Asian upper-level jet, so the acceleration of westerly jet would lead to stronger upper-level divergence. Except for the central center, the position of the wave train is roughly consistent with the subtropical westerly jet stream. As shown in Figure 3, the strong upper-level divergence and the significant positive velocity potential center at the middle latitudes of East Asia, and the associated upper-level divergence over the YHB are conducive to the strengthening and development of the ascending movement in the YHB.
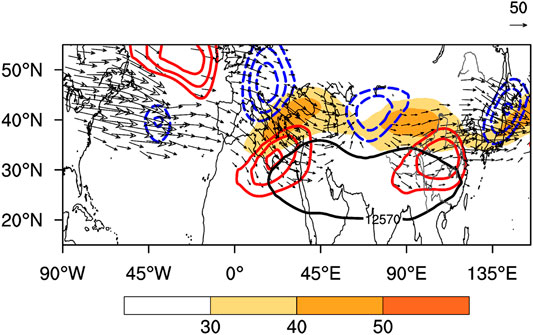
FIGURE 2. The geopotential height anomaly (contours, unit: gpm), the wave-activity flux (arrow, unit: m2 s−2) and wind velocity (shading, unit: m s−1) at 200 hPa during July 11–19, 2020. The red contour denotes the positive anomaly of geopotential height, the blue denotes the negative, and the black contour denotes of the SAH. The shaded area is the westerly jet with wind speed ≥30 m s−1.
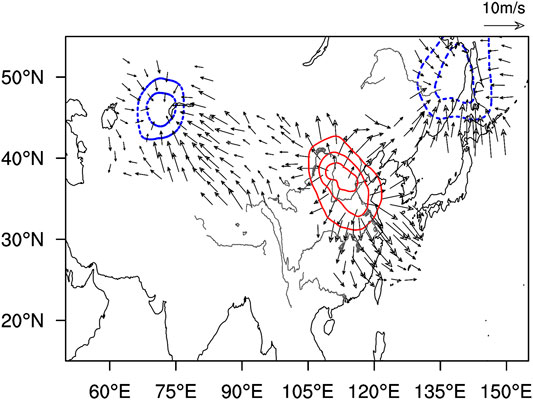
FIGURE 3. The velocity potential (contours, unit: 106 m2 s−1) and divergent wind (arrow, unit: m s−1) at 200 hPa during July 11–19, 2020. The red contour denotes the positive values, and the blue denotes the negative.
As an atmospheric waveguide in the upper troposphere at the middle and high latitudes, the Asian westerly jet stream can transmit the wave activities from upstream to downstream, allowing the maintenance of the wave train propagating along the westerly jet ( Hoskins and Ambrizzi, 1993; Ambrizzi et al., 1995; Enomoto, 2004). It can also be found from Figure 2 that significant wave-activity flux disperses eastward along with the jet from upstream, and the alternate occurrence of the wave-activity flux’s convergence and divergence promotes the maintenance and development of the positive and negative geopotential-height-anomaly centers in East Asia and the Far East, respectively. With the development of the SR wave train, the strengthening of the central center enhances the westerly wind on the north side, thereby strengthening the upper-level divergence in the YHB.
By regulating the positions and strengths of the WPSH, the Meiyu front and the Okhotsk blocking high, the PJ wave train in the middle-lower troposphere could make the precipitation concentrate in a certain area for a long time (Chen and Zhai, 2016). As shown in Figure 4, there is a meridional “+ − +” wave train along the East Asian coast in the geopotential height anomaly field at 500-hPa in mid-July 2020. The three anomaly centers are in the tropical western Pacific (20°N, 110°E), the middle latitudes of East Asia (37.5°N, 130°E) and the Okhotsk Sea region (60°N, 130°E), respectively, showing a typical PJ pattern. Under the regulation of the PJ wave train, the WPSH strengthens and extends westward, maintaining to the west of 120°E for a long time. As a result, the strong southwesterly airflow prevails over the YHB on the northwest side of the WPSH, and abundant water vapor is transported to the YHB by the southwesterly airflow. The negative anomaly of geopotential height at the middle latitudes of East Asia corresponds to the development and maintenance of the cold trough, which is conducive to the development of the meridional circulation at the middle and high latitudes and an active cold vortex. Led by the vortex, the cold air pushes southward frequently, and meets with the warm-moist air over the YHB on the north side of the WPSH. Thus, persistent heavy precipitation events occur in the YHB. In addition, the positive anomaly area in the Okhotsk Sea area corresponds to the maintenance and strengthening of the blocking high in this area, which echoes the Ural Mountain blocking high that corresponds to the positive anomaly near 60°E. Therefore, a typical Meiyu circulation pattern of two ridges and one trough occurs at the middle and high latitudes. From Figure 4, it can be found that wave-activity fluxes in 50°N–60°N are transmitted along the westerly waveguide to the downstream areas at middle and high latitudes, providing wave energy for the development of the anomaly centers at middle and high latitudes in East Asia. This wave-activity flux branches around 105°E. One branch disperses near the Okhotsk Sea, and the other disperses southeastward and converges with the poleward dispersing wave-activity flux in the middle latitude coastal areas of East Asia. Consequently, the low trough at the middle latitudes deepens. In addition, the poleward dispersing wave-activity flux can reach around 50°N and 135°E–150°E, and converges with the upstream eastward-dispersing wave-activity flux near the Okhotsk Sea, which is in favor of the development of the Okhotsk Sea blocking high and the maintenance of the “+ − +” PJ meridional wave train along the East Asian coast.
FIGURE 4. Geopotential height field (contour, unit: gpm), geopotential height anomaly field (colored, unit: gpm) and wave-activity flux (arrow, unit: m2 s−2) at 500 hPa during July 11–19, 2020.
From the above analyses, it can be concluded that the critical circulation background of the Meiyu period in mid-July 2020 is the coexistence of the PJ wave train with “+ − +” pattern in the lower troposphere and the SR wave train with the “− + −” pattern propagating along the westerly jet stream in the upper troposphere. Under such configurations of wave trains, the SAH locates more south and extends eastward, and the upper westerly jet stream on the north side of the SAH is more southerly than that of the normal years (Figure 2). Due to the acceleration of the westerly jet, strong upper-level divergence is maintained over the YHB where is on the right side of the jet entrance area (Figure 2). Meanwhile, the middle-latitude East Asian coastal regions, including the YHB at 500 hPa, are in front of the developing cold trough. The positive relative-vorticity advection strengthens the divergence of the deviation wind. Along with the upper-level divergence, the ascending motion in the YHB is enhanced. In addition, the cold-dry air brought by the northerly airflow behind the cold trough interacts with the warm moist airflow in the north of the WPSH, causing the persistent heavy precipitation events (Figure 4). That is, the coordinated effect of the wave trains in the upper and lower troposphere leads to the long-lasting Meiyu period in the YHB in 2020.
During the coexistence of the SR and PJ wave trains, the persistent precipitation process in the YHB lasts for nine days. Does the phase configuration of the wave trains evolve collaboratively during this period? What are the characteristics of the coordinated evolution? What are the characteristics of precipitation in YHB under this coordinated evolution? For these questions, three centers representing the SR wave train at 200 hPa are selected in Figure 2 according to the method of Huang (2004) and Bueh et al. (2008). The three centers are located in Central Asia (42.5°N, 70°E), East Asia (35°N, 105°E) and the Far East (42.5°N, 140°E). The geopotential height anomalies of the three centers are recorded as
Similarly, according to Figure 4 three centers at 500 hPa are selected to represent the PJ wave train, which are located in the tropical Western Pacific (20°N, 110°E), the middle latitude of East Asia (37.5°N, 130°E) and the Okhotsk Sea area (60°N, 130°E). The geopotential height anomalies of the three centers are recorded as
As shown in Figure 5, all the ISR in July 10–18 is negative, indicating that the SR wave train is basically in the negative phase. From July 10, the ISR continues to decrease and reaches the minimum on July 15. Then, the ISR rises rapidly, and it turns positive on July 19. The negative phase of the SR wave train lasts for about nine days. However, all the IPJ is positive. It increases from July 10, reaches the peak on July 14, and then decreases gradually. The results show that the changes in the ISR and IPJ are virtually opposite, with a correlation coefficient of 0.715, passing the confidence test of 0.01. In addition, the dates when ISR and IPJ reach the extreme values are roughly the same.
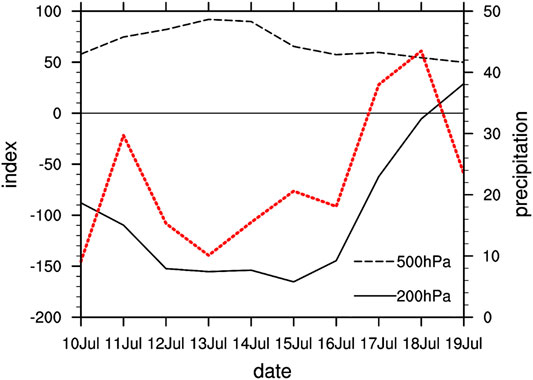
FIGURE 5. Daily variation of ISR (black solid line, unit: gpm), IPJ (black dotted line, unit: gpm) and precipitation (red dot line, unit: mm) in the YHB (28°N–34°N, 105°E–120°E) from July 10 to 19, 2020.
The further analyses of the circulation configuration on July 10 (one day before the occurrence of the persistent precipitation event), July 14–15 (when the ISR and IPJ reached the extreme values, respectively), and July 19 when the ISR turned to be positive (Figure 6) are conducted. The results show that the negative phase of the SR wave train in the middle and high latitudes at 200-hPa was yet unobvious on July 10 (Figure 6A). The geopotential height anomalies were basically negative in 40°N–50°N. The westerly jet in 100°E–120°E was more north than normal and was of a narrow range. The east ridge-point of the SAH was located near 100°E. At 500-hPa, a “+ − +” PJ wave train was formed along the East Asian coast in the meridional direction, but the negative anomaly center at middle latitudes was more north than normal, and the subtropical high was distributed in blocks.
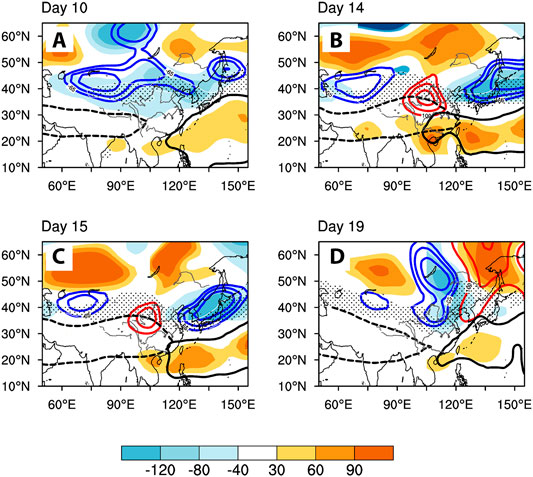
FIGURE 6. Evolution of the circulation configuration at 200 and 500 hPa on (A) July 10, (B) July 14, (C) July 15, and (D) July 19, 2020. The red contour denotes the positive geopotential height anomaly at 200 hPa; the blue denotes the negative; the shaded area denotes the anomaly of 500 hPa geopotential height (unit: gpm); the black dotted line denotes 12,570 gpm contour at 200 hPa; the black solid line denotes 5,880 gpm contour at 500 hPa; the point area denotes westerly jet with wind speed ≥30 m s−1 at 200 hPa.
On July 14 (Figure 6B), a positive anomaly center appeared near 200 hPa (35°N, 105°E), the “− + −” SR wave train became significant gradually, and the westerly jet within 100°E–120°E gradually moved southward. At 500 hPa, negative-anomaly at the middle latitude and positive-anomaly at the low latitude of PJ wave train were strengthened, and the subtropical high was in zonal belt distribution. It should be noted that the SAH and the 500 hPa subtropical high moved toward each other, and then met and overlapped over the East Asian coast. The WPSH covered the region south of the Yangtze River, but the region from north of the Yangtze River to Huaihe River was located to the north of WPSH, which was favorable for precipitation over the Huaihe River Basin.
On July 15 (Figure 6C), the circulation situation was similar to that on July 14, but the overlapping range of the SAH and WPSH over the East Asia coast was smaller than that on July 14. The WPSH retreated southeastward to be favorable for the water vapor transporting to the YHB and the strong precipitation.
On July 19 (Figure 6D), the positive anomaly center near 105°E at 200 hPa was replaced by the negative anomaly center, and the Far East was controlled by positive anomalies. The phase of the SR wave train began to adjust. Meanwhile, the negative anomaly center of the PJ wave train at middle latitudes is also weakened, but the"+ − +" phase still maintained. The subtropical high changed from the shape of a belt into block, and the SAH and WPSH moved against each other. Thus, under such circulation configurations, the persistent heavy precipitation process gradually ended. From the daily precipitation curve in Figure 5, it can be found that, corresponding to the inverse phase change of the SR wave train and the PJ wave train, the daily rainfall in the YHB had been above 10 mm almost every day since July 11. Especially, on July 17 and 18 the daily rainfall was more than 38 mm, reaching the magnitude of heavy rain. It is worth noting that the time when the persistent heavy rainfall reached the peak lagged behind the extreme time of ISR by 2–3 days, indicating that the coordinated evolution of SR and PJ wave trains could not only affect the persistence and intensity of precipitation in the YHB, but also serves as a precursor signal for the occurrence of persistent heavy rainfall to some extent (Wang et al., 2018).
It can be seen that the SR and PJ wave trains not only coexist, but also evolve collaboratively. The coordinative evolution between the “− + −” phase of the SR wave train in the upper troposphere and the “+ − +” phase of the PJ wave train in the middle and lower troposphere plays a crucial role in the movement toward each other and overlapping of the SAH and WPSH, which results in the rainfall amount in the YHB in 2020 far exceeding the longterm mean and leads to the late ending of the 2020 Meiyu season.
It’s remarkable that the intensity of PJ wave train in the middle and lower troposphere changed during the persistent heavy rainfall event, but the phase was not transformed. The phase transition time of SR wave train was 1 day ahead of the end time of heavy rainfall. It means that the coordinative evolution of the upper and lower troposphere wave trains is very important to the persistence and intensity of precipitation, but the phase transition of the SR wave train in the upper troposphere may play a more critical role.
The persistence of heavy rainfall depends on abundant water vapor supply. As shown in Figure 7, an abnormal “anticyclone–cyclone” (A–C) circulation occurred in the lower troposphere at the middle and lower latitudes along the East Asian coast in mid-July. The west boundary of the anticyclonic anomalous circulation reached 105°E, and the geopotential height field also reflected that the WPSH was stronger and more westward than normal. Abundant water vapor was transported to the YHB supplied by the strong southwesterly warm-moist airflow from the Western Pacific and South China Sea on the south of the abnormal anticyclone, leading to the abnormal positive water vapor flux in almost the whole YHB. However, the abnormal northeasterly airflow appeared in the Bay of Bengal, indicating that the water vapor of this persistent precipitation process in the YHB mainly comes from the Western Pacific and the South China Sea. It is should be noted that the YHB is not only the area with rich water vapor, but also the convergence area of abnormal water vapor flux. The reason for this phenomenon is that the cold-dry air led by the abnormal northerly airflow from middle and high latitudes in the north of the abnormal cyclone moved into the YHB and merged with the southwesterly warm-moist airflow from the lower latitudes, giving rise to the strong water vapor convergence in the YHB. Such a circulation background could provide abundant water vapor and ascending motion for the persistent heavy precipitation event.
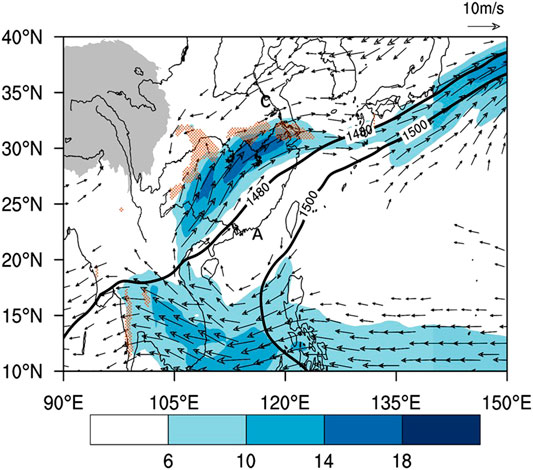
FIGURE 7. Horizontal wind field anomaly (arrow, unit: ms−1), water vapor flux anomaly (colored, unit: kg m−1 s−1 hPa−1) and water vapor flux divergence anomaly (dotted area < −1.5, unit: 10−7 kg m−2 s−1 hPa−1) at 850 hPa during July 11–19, 2020. The black contour denotes the 850 hPa isopotential, unit: gpm. The gray shading denotes Qinghai Tibet Plateau.
The vertical meridional circulation at 110°E–120°E (Figure 8) shows that the southerly wind advanced from lower latitude to about 30°N. The YHB near 28°N–34°N was in the ascending branch of the vertical meridional circulation, and especially there was significant ascending motion near 32°N. In conjunction with the water vapor convergence, such a circulation configuration favors the occurrence, development and maintenance of the persistent heavy precipitation.
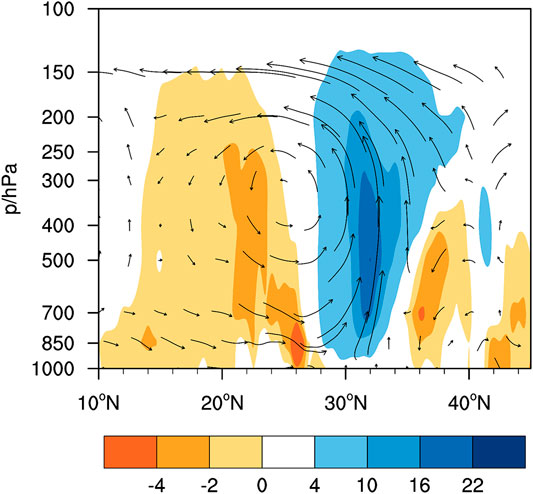
FIGURE 8. The mean vertical meridional circulation (arrow, unit: m s−1) and vertical velocity (colored, unit: −10−2 Pa s−1) at 110°E–120°E during July 11–19, 2020.
The Relationship Between the Wave Trains in the Upper and Lower Troposphere and the Sea Surface Temperature Anomaly
According to the monitoring data from the National Climate Center, since November 2019, the equatorial central and eastern Pacific has been warmer, and the Nino3.4 index has been greater than or equal to 0.5°C for five consecutive months, reaching the standard of the El Nino event. Although the El Nino was weak this time, the oceanic Rossby wave driven by the wind stress anomaly during the El Nino was beneficial to the warming of the tropical Southwest Indian Ocean. After the westward oceanic wave reached the west boundary, part of the wave would be reflected as oceanic Kelvin wave, which could deepen the thermocline and helps to warm the tropical Southeast Indian Ocean after propagating eastward along the equator and reaching the east boundary (Xie et al., 2009; Chen et al., 2019).
From Figure 9, it can be found that along with the weakening of El Nino, the SST in the Western Pacific warm pool and the Indian Ocean is uniformly warmer, and the abnormal distribution of warm SST continued until June since April 2020. Many studies have shown that in spring and summer, the warm basin mode in the tropical Indian Ocean can lead to the “Matsuno-Gill” mode response in the atmosphere (Matsuno, 1966; Gill, 1980; Yang et al., 2007; Xie et al., 2009). Additionally, the Kelvin wave propagating eastward can cause the abnormal anticyclonic circulation in the Northwest Pacific, which is conducive to the strengthening and the westward extension of the subtropical high (Wantanabe and Jin, 2002; Xie et al., 2009; Wu et al., 2009; Zhou et al., 2009), helping the maintenance of positive anomaly center at the lower latitude of PJ wave train.
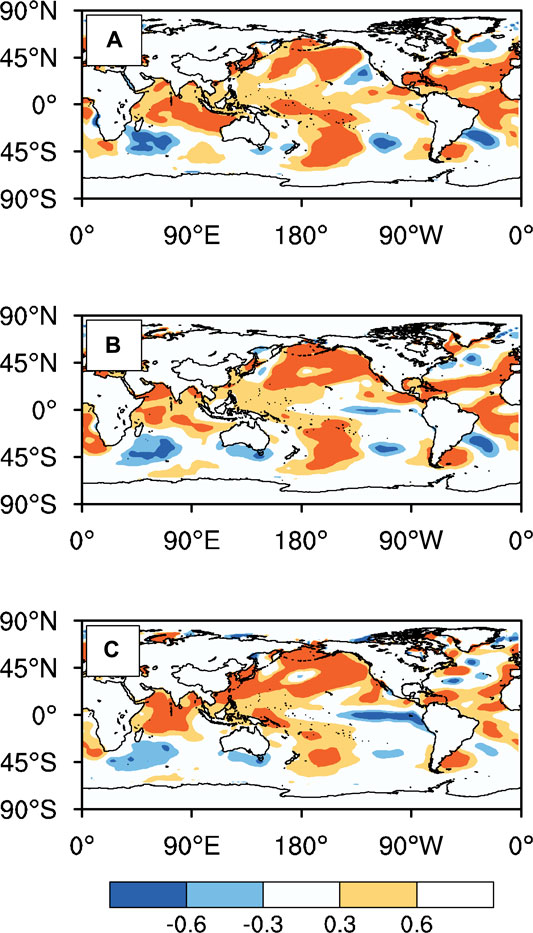
FIGURE 9. Distribution of SSTA from April to June in 2020 (shaded, unit: °C). In (A) April, (B) May, and (C) June.
The formation and maintenance of the SR and PJ wave trains are related to the external forcing of SST. Figure 10 shows that the convective anomaly from the Philippine Islands to the middle latitude regions in June is in a “− + −“meridional tripole wave train structure affected by the warm SST in the Western Pacific and the Indian Ocean. The area near the maritime continent is a negative OLR anomaly area, indicating that the active convection in the region can trigger a northward propagated Rossby wave, leading to the obvious north-south PJ wave train in the Northern Hemisphere in summer (Huang and Sun, 1994; Kosaka and Nakamura, 2010). It is significant that the positive OLR anomaly area is basically consistent with the WPSH, and the negative OLR anomaly on WPSH’s north side corresponds to the strong convection on the rain belt of the Meiyu front.
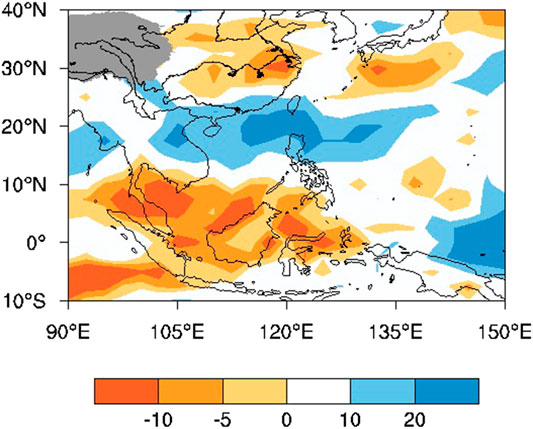
FIGURE 10. OLR anomaly during July 11–19, 2020 (shaded, unit: W m−2). The gray shading denotes Qinghai Tibet Plateau.
In addition, the warm SST in Indian Ocean can stimulate or strengthen the SR wave train through the positive feedback of diabatic heating on the atmospheric circulation (Wu et al., 2000; Enomoto et al., 2003; Lin, 2009; Ding and Wang, 2005; Kosaka et al., 2009). Therefore, although the El Nino is far less weak than those of 1997–1998 and 2015–2016, the strong response of the atmosphere to it cannot be ignored. The coordinative evolution of wave trains in the upper and lower troposphere during the Meiyu season in 2020 may be the product of atmospheric response to SST anomalous.
It is noticeable that since the winter of 2019, the SST over the tropical Atlantic has been in a warm state, especially from February to April in 2020. The abnormal convection caused by the warm SST on the east coast of the tropical Atlantic can also trigger the northward propagating Rossby wave train, which may affect the downstream SR wave train through the waveguide effect of the subtropical westerly jet (Wang et al., 2011; Wang, 2019). However, it needs to be further studied in the future.
In summary, the relationship between the Meiyu anomaly over the YHB and the collaborative evolution of wave trains in the upper and lower troposphere in the mid-July of 2020 can be illustrated by the following schematic diagram (Figure 11).
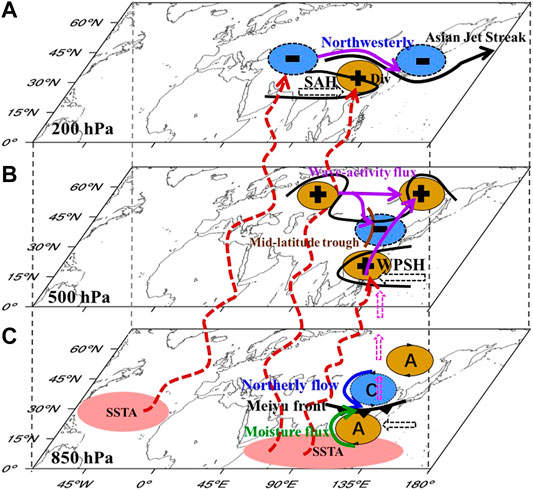
FIGURE 11. Schematic illustration of the collaborative evolution of wave trains in the upper and lower troposphere during the Meiyu season in the mid July of 2020. The symbol “–” (“+”) represents the negative (positive) geopotential height anomaly. “C” (“A”) denotes the abnormal cyclone (anticyclone). “Div” in (A) denotes divergence. The purple arrows represent wave-activity flux. The black blank dashed arrows represent the movement of the key systems. The red dashed curve arrows represent the effects of SST. The black thin and thick lines denote the SAH and Jet streak in (A), respectively. In (B), the black thin lines denote WPSH and trough/ridge at the middle and high latitudes, and the brown curve represents the trough line. In (C), the blue arrow represents the northerlies from mid and high latitudes. The black triangle curve denotes the Meiyu front. The green arrow represents the water vapor flux. The pink dotted arrows denote ascending motion.
Conclusions
Based on the ERA5 reanalysis dataset, the SST and OLR data and the daily precipitation data, the relationship between the Meiyu anomaly in the YHB and the coordinative evolution of wave trains in the upper and lower troposphere in the mid-July of 2020 is analyzed. The main conclusions are as follows.
The key circulation background for the long-lasting Meiyu season in the summer of 2020 is the coexistence of the “− + −” SR wave train in the upper troposphere and the “+ − +” PJ wave train in the middle-lower troposphere. The central center of the SR wave train is more southward than normal. The SAH locates more south and extends eastward. The upper-level westerly jet is also more southward than normal, resulting in the upper-level divergence over the YHB where is the right side of the jet entrance area. Meanwhile, under the regulation of the PJ wave train in the middle-lower troposphere, the WPSH strengthens and extends westward, and it keeps stably on the west of 120°E, resulting in abundant water vapor supply from the northwest side of the WPSH to the YHB. The development and maintenance of the cold trough at the middle latitudes of East Asia are in favor of the development of meridional circulation and an active cold vortex, steering the cold air to move southward frequently, which interacts with the warm-moist air on the north side of the WPSH in the YHB. The positive relative vorticity advection in front of the trough strengthens the divergence of deviation wind. Then, together with the upper level divergence, it strengthens the ascending motion and leads to the long-lasting Meiyu season in the YHB in 2020.
The SR and PJ wave trains not only coexist, but also evolve collaboratively. The coordinative evolution between the “− + −” phase of the SR wave train in the upper troposphere and the “+ − +” phase of the PJ wave train in the middle and lower troposphere plays a crucial role in the movement toward each other and overlapping of the SAH and WPSH, which results in the rainfall amount in the YHB in 2020 far exceeding the longterm mean and leads to the late ending of the 2020 Meiyu season. The coordinative evolution of the SR and PJ wave trains not only affects the persistence and intensity of precipitation in the YHB, but also can be regarded as a precursor signal for the occurrence of persistent heavy rainfall to some extent.
The wave-activity flux dispersing eastward along the upper-level jet is beneficial to the development and maintenance of the SR wave train, and the poleward dispersing wave-activity flux is related to the development and maintenance of the PJ wave train. Along with the weakening El Nino in 2019, abnormal anticyclonic circulation was formed in the Northwest Pacific due to the warm SST in the Western Pacific warm pool and the Indian Ocean, which is conducive to the strengthening and the westward extension of the WPSH. Simultaneously, the anomalous convection caused by the warm SST in the Western Pacific warm pool is conducive to the formation and maintenance of the PJ wave train by triggering the northward propagating Rossby wave. The abnormal convection caused by the warm SST in the Indian Ocean and the east coast of the tropical Atlantic may affect the SR wave train through the positive feedback of diabatic heating on the atmospheric circulation. These are also one of the reasons for the long Meiyu season in 2020.
Actually , the earlier onset of Meiyu contributes to the long-lasting Meiyu. Do the SR and PJ wave trains coexist during the earlier onset period of Meiyu in 2020? Is there collaborative evolution between the two wave trains? According to Czaja and Frankignoul (2002), the warm SSTA over the tropical Atlantic is beneficial to maintaining the negative phase of the Arctic Oscillation and the development of meridional circulation. Are the responses of atmosphere to SST related to the cold trough or cold vortex in association with Meiyu? These problems need to be further discussed in the future.
Data Availability Statement
The raw data supporting the conclusions of this article will be made available by the authors, without undue reservation.
Author Contributions
JW initiated the idea, designed the study, and wrote the manuscript.
Funding
This work was supported by College Student’s Platform for Innovation and Entrepreneurship Training Program of Jiangsu Province (202010300001Z).
Conflict of Interest
The authors declare that the research was conducted in the absence of any commercial or financial relationships that could be construed as a potential conflict of interest.
Acknowledgments
The ERA5 reanalysis dataset is provided by the ECMWF, from their Web site at https://cds.climate.copernicus.eu/cdsapp#!/dataset/reanalysis-era5-pressure-levels?tab=form. Daily precipitation data is provided by the National Meteorological Information Center and China Meteorological Administration.
References
Ambrizzi, T., Hoskins, B. J., and Hsu, H.-H. (1995). Rossby wave propagation and teleconnection patterns in the austral winter. J. Atmos. Sci. 52, 3661–3672. doi:10.1175/1520-0469(1995)052<3661: RWPATP>2.0.CO;210.1175/1520-0469(1995)052<3661:rwpatp>2.0.co;2. CrossRef Full Text
Bueh, C., Shi, N., Ji, L., Wei, J., and Tao, S. (2008). Features of the EAP events on the medium-range evolution process and the mid- and high-latitude Rossby wave activities during the Meiyu period. Chin. Sci. Bull. 53, 610–623. doi:10.1007/s11434-008-0005-2. CrossRef Full Text
Chen, Y., and Zhai, P. (2016). Mechanisms for concurrent low-latitude circulation anomalies responsible for persistent extreme precipitation in the Yangtze River Valley. Clim. Dynam. 47, 989–1006. doi:10.1007/s00382-015-2885-6. CrossRef Full Text
Chen, Y., and Zhai, P. (2015). Synoptic-scale precursors of the East Asia/Pacific teleconnection pattern responsible for persistent extreme precipitation in the Yangtze River Valley. Q. J. R. Meteorol. Soc. 141, 1389–1403. doi:10.1002/qj.2448. CrossRef Full Text
Chen, Z., Du, Y., Wen, Z., Wu, R., and Xie, S.-P. (2019). Evolution of south tropical Indian ocean warming and the climatic impacts following strong El Niño events. J. Clim. 32, 7329–7347. doi:10.1175/jcli-d-18-0704.1. CrossRef Full Text
Czaja, A., and Frankignoul, C. (2002). Observed impact of Atlantic SST anomalies on the north Atlantic oscillation. J. Clim. 15, 606–623. doi:10.1175/1520-0442 (2002) 015 <0606:OIOASA> 2.0.CO;210.1175/1520-0442(2002)015<0606:oioasa>2.0.co;2. CrossRef Full Text
Ding, Q., and Wang, B. (2005). Circumglobal teleconnection in the northern hemisphere summer*. J. Clim. 18, 3483–3505. doi:10.1007/s00376-010-9225-x10.1175/jcli3473.1. CrossRef Full Text
Ding, Y., Liang, P., Liu, Y., and Zhang, Y. (2020). Multiscale variability of Meiyu and its prediction: a new review. J. Geophys. Res. Atmos. 125, e2019JD031496. doi:10.1029/2019JD031496. CrossRef Full Text
Enomoto, T., Hoskins, B. J., and Matsuda, Y. (2003). The formation mechanism of the Bonin high in August. Q. J. R. Meteorol. Soc. 129, 157–178. doi:10.1256/qj.01.211. CrossRef Full Text
Enomoto, T. (2004). Interannual variability of the Bonin high associated with the propagation of Rossby waves along the Asian jet. J. Meteorol. Soc. Jpn. 82, 1019–1034. doi:10.2151/jmsj.2004.1019. CrossRef Full Text
Gill, A. E. (1980). Some simple solutions for heat-induced tropical circulation. Q. J. R. Meteorol. Soc. 106, 447–462. doi:10.1002/qj.49710644905. CrossRef Full Text
Hersbach, H., Bell, B., Berrisford, P., Hirahara, S., Horányi, A., Muñoz‐Sabater, J., et al. (2020). The ERA5 global reanalysis. Q. J. R. Meteorol. Soc. 146, 1999–2049. doi:10.1002/qj.3803. CrossRef Full Text
Hong, X., Lu, R., and Li, S. (2018). Asymmetric relationship between the meridional displacement of the Asian westerly jet and the silk road pattern. Adv. Atmos. Sci. 35, 389–396. doi:10.1007/s00376-017-6320-2. CrossRef Full Text
Hong, X., and Lu, R. (2016). The meridional displacement of the summer Asian jet, silk road pattern, and tropical SST anomalies. J. Clim. 29, 3753–3766. doi:10.1175/jcli-d-15-0541.1. CrossRef Full Text
Hoskins, B. J., and Ambrizzi, T. (1993). Rossby wave propagation on a realistic longitudinally varying flow. J. Atmos. Sci. 50, 1661–1671. doi:10.1175/1520-0469 (1993) 050<1661:rwpoar>2.0.co;210.1175/1520-0469(1993)050<1661:rwpoar>2.0.co;2. CrossRef Full Text
Hsu, H.-H., and Lin, S.-M. (2007). Asymmetry of the tripole rainfall pattern during the east Asian summer. J. Clim. 20, 4443–4458. doi:10.1175/JCLI4246.1. CrossRef Full Text
Huang, B., Thorne, P. W., Banzon, V. F., Boyer, T., Chepurin, G., Lawrimore, J. H., et al. (2017). Extended reconstructed sea surface temperature, version 5 (ERSSTv5): upgrades, validations, and intercomparisons. J. Clim., 30, 8179–8205. doi:10.1175/JCLI-D-16-0836.1. CrossRef Full Text
Huang, G. (2004). An index measuring the interannual variation of the east Asian summer monsoon-the EAP index. Adv. Atmos. Sci. 21, 41–52. doi:10.1007/bf02915679. CrossRef Full Text
Huang, G., and Yan, Z. (2004). An index measuring the interannual variation of the east Asian summer monsoon-the EAP index. Adv. Atmos. Sci. 21, 41–52. doi:10.1007/bf0291567910.1007/bf02885855. CrossRef Full Text
Huang, R, H., and Sun, F. Y. (1994). Impact of the thermal state and the convective activities in the tropical western warm pool on the summer climate anomalies in east Asia (in Chinese). Chin. J. Atmos. Sci. 18(2):141–151. doi:10.1007/BF02658170
Huang, R. H., and Li, W. J. (1988). Influence of heat source anomaly over the western tropical Pacific on the subtropical high over East Asia and its physical mechanism (in Chinese). Chin. J. Atmos. Sci. 12(s1):107–116.
Kosaka, Y., and Nakamura, H. (2010). Mechanisms of meridional teleconnection observed between a summer monsoon system and a subtropical anticyclone. Part I: the Pacific-Japan pattern. J. Clim. 23(19):5085–5108. doi:10.1175/2010JCLI3414.110.1175/2010jcli3413.1. CrossRef Full Text
Kosaka, Y., Nakamura, H., Watanabe, M., and Kimoto, M. (2009). Analysis on the dynamics of a wave-like teleconnection pattern along the summertime Asian jet based on a reanalysis dataset and climate model simulations. J. Meteorol. Soc. Jpn. 87, 561–580. doi:10.2151/jmsj.87.561. CrossRef Full Text
Lin, H. (2009). Global extratropical response to diabatic heating variability of the Asian summer monsoon. J. Atmos. Sci. 66, 2697–2713. doi:10.1175/2009JAS3008.1. CrossRef Full Text
Lu, R.-Y., Oh, J.-H., and Kim, B.-J. (2002). A teleconnection pattern in upper-level meridional wind over the north African and Eurasian continent in summer. Tellus Dyn. Meteorol. Oceanogr. 54A, 44–55. doi:10.1034/j.1600-0870. 2002.00248.x. CrossRef Full Text
Lu, R. Y., and Fu, Y. H. (2009). Summer climate variability in east Asia and the western north Pacific and its mechanisms (in Chinese). Adv. Earth Sci. 24(2):123–131. doi:10.3321/j.issn:1001-8166.2009.02.002
Lu, R. Y., and Huang, R. H. (1998). Influence of east Asia/Pacific teleconnection pattern on the interannual variations of the blocking highs over the northeastern Asia in summer (in Chinese). Chin. J. Atmos. Sci. 22, 727–734. doi:10.3878/j.issn.1006-9895.1998.05.07
Matsuno, T. (1966). Quasi-geostrophic motions in the equatorial area. J. Meteorol. Soc. Jpn. 44, 25–43. doi:10.2151/jmsj1965.44.1_25. CrossRef Full Text
Nitta, T. (1987). Convective activities in the tropical western Pacific and their impact on the northern hemisphere summer circulation. J. Meteorol. Soc. Jpn. 65, 373–390. doi:10.2151/jmsj1965.65.3_373. CrossRef Full Text
Ogasawara, T., and Kawamura, R. (2007). Combined effects of teleconnection patterns on anomalous summer weather in Japan. J. Meteorol. Soc. Jpn. 85, 11–24. doi:10.2151/jmsj.85.11. CrossRef Full Text
Ogasawara, T., and Kawamura, R. (2008). Effects of combined teleconnection patterns on the east Asian summer monsoon circulation: remote forcing from low- and high-latitude regions. J. Meteorol. Soc. Jpn. 86, 491–504. doi:10.2151/jmsj.86.49110.2151/jmsj.86.491. CrossRef Full Text
Sato, N., and Takahashi, M. (2006). Dynamical processes related to the appearance of quasi-stationary waves on the subtropical jet in the midsummer northern hemisphere. J. Clim. 19, 1531–1544. doi:10.1175/jcli3697.1. CrossRef Full Text
Shang, W., Li, S. S., Ren, X. J., and Duan, K. Q. (2020). Event-based extreme precipitation in central-eastern China: large-scale anomalies and teleconnections. Clim. Dynam. 54, 2347–2360. doi:10.1007/s00382-019-05116-1. CrossRef Full Text
Takaya, K., and Nakamura, H. (2001). A formulation of a phase-independent wave-activity flux for stationary and migratory quasigeostrophic eddies on a zonally varying basic flow. J. Atmos. Sci. 58, 608–627. doi:10.1175/1520-0469(2001) 058<0608:AFOAPI>2.0.CO;210.1175/1520-0469(2001)058<0608:afoapi>2.0.co;2. CrossRef Full Text
Wakabayashi, S., and Kawamura, R. (2004). Notes. and correspondence; extraction of major teleconnection patterns possibly associated with the anomalous summer climate in Japan. J. Meteorol. Soc. Jpn. 82, 1577–1588. doi:10.2151/jmsj.82.1577. CrossRef Full Text
Wang, C. (2019). Three-ocean interactions and climate variability: a review and perspective. Clim. Dynam. 53, 5119–5136. doi:10.1007/s00382-019-04930-x. CrossRef Full Text
Wang, L., Wang, C., and Guo, D. (2018). Evolution mechanism of synoptic-scale EAP teleconnection pattern and its relationship to summer precipitation in China. Atmos. Res. 214, 150–162. doi:10.1016/j.atmosres.2018.07.023. CrossRef Full Text
Wang, X., Wang, C., Zhou, W., Wang, D., and Song, J. (2011). Teleconnected influence of north Atlantic sea surface temperature on the El Niño onset. Clim. Dynam. 37, 663–676. doi:10.1007/s00382-010-0833-z. CrossRef Full Text
Watanabe, M., and Jin, F.-f. (2002). Role of Indian ocean warming in the development of Philippine sea anticyclone during ENSO. Geophys. Res. Lett. 29, 1478. doi:10.1029/2001gl014318. CrossRef Full Text
Wu, B., Zhou, T., and Li, T. (2009). Seasonally evolving dominant interannual variability modes of east Asian climate*. J. Clim. 22, 2992–3005. doi:10.1175/2008JCLI2710.1. CrossRef Full Text
Wu, G. X., Liu, P., Liu, Y. M., and Li, W. P. (2000). Impacts of the sea surface temperature anomaly in the Indian ocean on the subtropical anticyclone over the western Pacific-two stage thermal adaptation in the atmosphere (in Chinese). Acta Meteorol. Sin. 58, 513–522. doi:10.11676/qxxb2000.054
Xie, S.-P., Hu, K., Hafner, J., Tokinaga, H., Du, Y., Huang, G., et al. (2009). Indian ocean capacitor effect on indo-western Pacific climate during the summer following El Niño. J. Clim. 22, 730–747. doi:10.1175/2008JCLI2544.1. CrossRef Full Text
Yang, J. L., Liu, Q. Y., Xie, S. P., Liu, Z. Y., and Wu, L. X. (2007). Impact of the Indian ocean SST basin mode on the Asian summer monsoon. Geophys. Res. Lett. 34, 155–164. doi:10.1029/2006gl028571. CrossRef Full Text
Yasui, S., and Watanabe, M. (2010). Forcing processes of the summertime circumglobal teleconnection pattern in a dry AGCM. J. Clim. 23, 2093–2114. doi:10.1 175/2009jcli3323.110.1175/2009jcli3323.1. CrossRef Full Text
Zhou, T., Yu, R., Zhang, J., Drange, H., Cassou, C., Deser, C., et al. (2009). Why the western Pacific subtropical high has extended westward since the late 1970s. J. Clim. 22, 2199–2215. doi:10.1175/2008jcli2527.1. CrossRef Full Text
Keywords: Jianghuai Meiyu in 2020, Silk-Road wave train, the Pacific-Japan wave train, collaborative evolution, SST anomaly
Citation: Wang J (2020) Relationships Between Jianghuai Meiyu Anomaly and the Collaborative Evolution of Wave Trains in the Upper and Lower Troposphere in Mid-July of 2020. Front. Earth Sci. 8:597930. doi: 10.3389/feart.2020.597930
Received: 22 August 2020; Accepted: 12 October 2020;
Published: 29 October 2020.
Edited by:
Ruifen Zhan, Fudan University, ChinaReviewed by:
Ping Liang, Shanghai Meteorological Bureau, ChinaQingquan Li, China Meteorological Administration, China
Copyright © 2020 Wang. This is an open-access article distributed under the terms of the Creative Commons Attribution License (CC BY). The use, distribution or reproduction in other forums is permitted, provided the original author(s) and the copyright owner(s) are credited and that the original publication in this journal is cited, in accordance with accepted academic practice. No use, distribution or reproduction is permitted which does not comply with these terms.
*Correspondence: Junyu Wang, wangjy200029@163.com