Multidecadal Seesaw in Hadley Circulation Strength Between the Two Hemispheres Caused by the Atlantic Multidecadal Variability
 Yusen Liu
 Zhanqiu Gong1
  Cheng Sun
 Lin Wang
- 1College of Global Change and Earth System Science (GCESS), Beijing Normal University, Beijing, China
- 2Frontiers Science Center for Deep Ocean Multispheres and Earth System (FDOMES), Key Laboratory of Physical Oceanography, Institute for Advanced Ocean Studies, Ocean University of China, Qingdao, China
- 3Laboratory for Ocean Dynamics and Climate, Pilot National Laboratory for Marine Science and Technology (Qingdao), Qingdao, China
- 4Center for Monsoon System Research, Institute of Atmospheric Physics, Chinese Academy of Sciences, Beijing, China
Multidecadal variations in Hadley circulation (HC) strength have been observed during the historical period, which have significant implications for global and regional climate. However, the relationship between HC intensities in the two hemispheres remains unclear. In this study, we identify an interhemispheric seesaw in the annual HC strength at multidecadal timescales. This seesaw pattern physically corresponds to the meridional movement of the ascending branch of annual HC, leading to strengthened HC in one hemisphere and weakened HC in the other. The HC strength seesaw strongly correlates with the tropical land surface precipitation at multidecadal timescales, particularly for the monsoonal land regions. Further analyses link the HC strength seesaw to the Atlantic multidecadal variability (AMV). A suite of Atlantic Pacemaker experiments successfully reproduces the multidecadal HC strength seesaw and its relation to the AMV. The Northern Hemisphere SST warming associated with the positive AMV phase induces a northward shift of the upward branch of HC, and the Southern Hemispheric HC is strengthened in contrast to the weakened Northern Hemispheric HC. Comparisons of the North Atlantic SST forced HC changes between the coupled air–sea model and stand-alone atmospheric model suggest an important and non-negligible role of the SST footprint of AMV over the Indo-Pacific basins. The AMV and its Indo-Pacific SST footprint make a comparable contribution to the SST changes in the Northern Hemisphere, which control the movement of the HC ascending branch and thereby the interhemispheric seesaw in HC strength.
Introduction
The Hadley circulation (HC) is one of the most important atmospheric circulations and plays a dominant role in the transportation of momentum, heat, and water vapor (Trenberth and Stepaniak, 2003), which is much greater than that of the transient and stationary eddies. The HC thus is of great importance to the tropical weather and climate. The HC bridges the tropic and extratropic via transporting momentum and heat from tropics to the subtropical and higher latitudes (Diaz and Bradley, 2004), thus it is also important to the extratropical weather and climate (Lindzen, 1994; Chang, 1995; Hou, 1998). As an important large-scale circulation in the low latitude atmosphere, the variations in HC are closely linked to the global atmospheric circulation variability and also impact on the global weather and climate change. Therefore, studying the multidecadal variability in HC is significant in understanding and researching the changes in the global climate system and regional climates as well.
The long-term HC variability has received considerable attention in recent years with the abundance of observational datasets. These studies mainly focus on the horizontal scale, width and strength of the HC (Hu and Zhou, 2010). Various studies based on different observational and reanalysis datasets have consistently pointed out that the HC exhibits an obvious trend of poleward expansion at the quantified speeds (different observational datasets during 1979–2005 show a −0.5° to 3°/decade widening in the HC poleward expansion) (Hudson et al., 2006; Frierson et al., 2007; Lu et al., 2007; Seidel et al., 2008; Johanson and Fu, 2009). A couple of factors that cause the HC expansions, including anthropogenic greenhouse gas emissions, aerosols, stratospheric ozone and natural climate variabilities (Staten et al., 2018). For instance, the warm phase of Pacific Decadal Oscillation (PDO) enhances tropical warming and leads to a contraction of the HC, and vice versa. However, whether the Atlantic climate modes played a role remains elusive. In addition, other observational and modeling studies (Tao et al., 2016; Watt-Meyer et al., 2019; Grise and Davis, 2020) have indicated an asymmetrical expansion of the HC due to multiple reasons, like greenhouse gas and ozone depletion, but their impacts vary in seasons. In general, the poleward expansion of the HC in the Northern Hemisphere (NH) is larger than the Southern Hemisphere (SH) and the expansion in the summer (JJA) and autumn (SON) is faster than the spring (MAM) and winter (DJF) (Lu et al., 2007). As to the HC strength, observational datasets have shown a strengthening trend in the annual HC since the 1990s (Chen et al., 2002; Wielicki et al., 2002). It is suggested that consistent evidence has been found for intensification in the NH winter HC since 1950, but the summer HC strength appears to be no significant change (Quan et al., 2004). However, whether the HC has intensified is still under debate (Trenberth, 2002; Held and Soden, 2006; Stachnik and Schumacher, 2011). Previous observational and reanalysis studies also analyzed the changes in HC strength and suggested its pronounced decadal variability. The previous study (Zhou and Wang, 2006) has indicated that the winter NH HC strength exhibits remarkably interannual and interdecadal variability, but the summer SH HC strength exhibits decadal variations instead. However, the connection of HC strength between the NH and SH has not been fully understood and the decadal variability of HC strength in the two hemispheres is still unclear.
In addition to the HC strength and width, empirical orthogonal function analysis has been used to detect the temporal and spatial characteristics of the HC, and its variability has also received attention. The previous study (Dima and Wallace, 2003) suggested that the annual cycle of the HC consists of two components: an equatorially symmetric mode during the boreal spring and autumn, and an equatorially asymmetric component during the boreal winter and summer. A similar result also indicates that the boreal summer HC mainly includes the equatorially asymmetric mode and equatorially symmetric mode (Feng et al., 2011). The former study mainly focuses on the interdecadal variability, while the latter corresponds to the interannual variability. It has been shown that the variation of the asymmetric mode is connected to the sea surface temperature (SST) over the tropical Indian and western Pacific oceans (Ma and Li, 2008; Feng et al., 2011; Feng et al., 2013; Quan et al., 2014). The previous study (Guo et al., 2016) also demonstrates that the asymmetric mode in boreal autumn is closely linked to the Atlantic multidecadal variability (AMV). The previous findings have focused on the year-to-year variability of seasonal HC, but the decadal-scale relationship between the annual HC strength in the two hemispheres has not been fully understood. Meanwhile, many studies suggest the SSTs over the Atlantic Ocean have impacts on the Indo-Pacific SST variability (Sun et al., 2017; Xue et al., 2018), but whether these impacts contribute to the variability of HC strength remains unclear and the relative importance of the Atlantic and Indo-Pacific SSTs for the multidecadal variations in annual HC strength has not been investigated.
In this study, we investigate the interhemispheric relationship of the HC strength at multidecadal time scales and link it to the AMV using multiple datasets. And, considering the great impact of the HC on tropical precipitation, we also analyze the relationship between the HC strength seesaw and tropical rainfalls. A mechanism is then proposed to explain how the AMV influences interhemispheric seesaw in HC strength. Statistical analyses and a suite of Atlantic Pacemaker experiments are performed to identify the Indo-Pacific effects on the HC strength decadal variability associated with the AMV signal.
Data and Methods
Data and Index Definitions
Atmospheric data sets are derived from the ECMWF Atmospheric Reanalysis of the 20th Century (ERA-20C) data set (Stickler et al., 2014) and 20th century reanalysis (20CR) data (Compo et al., 2011) for the period 1900–2010. National Centers for Environmental Prediction (NCEP) data set (Kalnay et al., 1996) is for the period 1948–2014. They are used to reveal the spatial and temporal characteristics of the HC. The precipitation data from Climate Research Unit (CRU TS 4.03) (Harris, 2014) is used to investigate the relationship between HC strength and tropical rainfall in the two hemispheres for the period 1901–2010. The main results are also validated by other SST (e.g., HadSST3 and COBE-SST2) and precipitation (e.g., GPCC) observational datasets (as shown in Supplementary Material). The PDO index is derived from the Japan Meteorological Agency which is defined as the projections of monthly mean SST anomalies, that subtract globally averaged monthly mean SST anomalies, onto their first empirical orthogonal function vectors in the North Pacific (north of 20°N) for the period 1900–2010. All the analyses are based on annual means.
The AMV index is defined as the area-weighted average of SST anomalies over the North Atlantic region (0°–60°N, 80°W–0°). The SST data is derived from the Extended Reconstruction SST version 3 (ERSST v3b) data set (Smith et al., 2008) for the period 1900–2010.
The Hadley circulation is characterized by the mean meridional mass stream function (MMS), which is computed by vertically integrating the zonal mean meridional wind [v] (Holton, 1973):
where ϕ is the latitude, p is the pressure, a is the Earth radius, and g is the gravitational acceleration. The locations of poleward edges of the Hadley circulation are identified as the latitudes where MMS equals 0 kg⋅s−1.
The hemispheric HC strength index is calculated as the maximum value of the MMS in the tropics (Oort and Yienger, 1996). And the HC strength seesaw index is defined as the difference between the NH and the SH HC strength indices.
Statistical Methods
We confine our analysis to the post-1900 period for the data sets due to large uncertainties and less reliability in surface observations before 1900 (Folland et al., 2001). To better isolate and highlight the signal of decadal to multidecadal variability, we tend to remove the centennial-scale trends by using the removal of long-term linear trends in the variables for the post-1900 period, and the data are smoothed with a low-pass filter (11-year running means).
A two-tailed Student’s t-test is used to determine the statistical significance of the linear regression and correlation between two autocorrelated time series. We use the effective number of degrees of freedom (Neff), which is given by the following approximation:
where N is the sample size and
Model and Experiments
The model we employed in this study is the International Centre for Theoretical Physics AGCM (ICTPAGCM, version 41) coupled to a slab ocean thermodynamic mixed-layer model (SOM). The intermediate ICTPAGCM contains eight vertical levels with a horizontal resolution of T30 (3.75° × 3.75° grid). In the observation, the climatological annual-averaged mixed layer depth is geographically-varying, generally shallow in the tropics and deep in mid-high latitudes. Thus, in the SOM experiment in this study, we adopt a geographically-varying mixed layer depth for the slab ocean model. The mixed layer depth varies from 40 m in the tropics to 60 m in the extra-tropics and is constant throughout the whole simulation period. Mixed-layer temperature variation is derived from the net surface heat fluxes into the ocean (i.e., the sum of shortwave and longwave radiation and sensible and latent heat fluxes) (Kucharski et al., 2016; Sun et al., 2017).
In this study, the Atlantic is defined as the entire Atlantic basin (60°S–60°N, 70°W–20°E) and the other basins out of the Atlantic are called the Indo-Pacific region. We perform two experiments to investigate the Indo-Pacific contribution to the HC strength under the AMV forcing. The first experiment is referred to as ATL_VARMIX (Atlantic Pacemaker experiment), which is run with the ICTPAGCM coupled to the SOM in the Indo-Pacific region and with raw observational monthly-varying SSTs (with the linear trend of SST maintained) from the HadISST data prescribed over the Atlantic basin. A buffer zone with a spatial range of 7.5° is set for preventing the instability between the prescribed-SST regions and the slab ocean in which the SST is calculated from the weighted average of the modeled and prescribed SSTs. The weighting values are one in the prescribed-SST domain and linearly reduced to zero in the buffer zone. The ATL_VARMIX experiment considers the effects of not only Atlantic SST variability, but also the atmosphere-ocean coupling over the Indo-Pacific region. We also conduct a similar experiment but with climatological monthly SSTs prescribed in the Indo-Pacific region, referred to as ATL_VARAGCM. It is to examine the direct impacts of the Atlantic forcing on the Indo-Pacific atmospheric circulation without the atmosphere-ocean coupling.
The simulations of ATL_VARMIX and ATL_VARAGCM experiments are integrated from 1872 to 2013 and contain five ensemble members generated by restarting the model with small initial perturbations. The first 28 years of all simulations are taken as spin up, and the results from the rest of the period during 1900–2013 are analyzed.
Results
Interhemispheric Seesaw in Hadley Circulation Strength on the Decadal Scale
The time series of the hemispheric HC strength indices suggest that the HC strength in one hemisphere generally exhibits opposite phase to the other and its decadal variability can be found in both datasets but with some differences. The hemispheric HC strength index based on NCEP data (Figure 1A) exhibits significant multidecadal variability and interhemispheric connection as the correlation coefficient between the hemispheres reaches −0.80 for the period 1948–2013. The HC strength in the NH shows an increasing trend in the 1950s and 1960s with a phase shift that occurred around 1970. The HC strength in the SH exhibits an opposite trend during the same period with a phase shift that occurred around 1970, indicating that a seesaw pattern in HC strength may exist between the two hemispheres. We extend our analyzed period from 1900 to 2010 using the ERA20C dataset (Figure 1B). It shows clear decadal variability before 1950. Similarly, the HC strength in the NH is also negatively correlated (−0.70) with that in the SH using the ERA20C reanalysis data set. For the overlapping period (1948–2010), the time series of hemispheric Hadley circulation strength indices depicted by the two reanalysis data are somewhat similar, as their correlation coefficients reach 0.61 and 0.68 for the Northern Hemisphere (NH) and Southern Hemisphere (SH), respectively. Also, the lead–lag relationship (Supplementary Figure S1) from both data sets suggests that the HC strength in the two hemispheres is negatively correlated and statistically significant within a temporal lag/lead of about 5 years (lag −1 to lag 5 for the NCEP and lag −5 to lag 0 for the ERA), which are consistent with the HC strength interhemispheric seesaw.
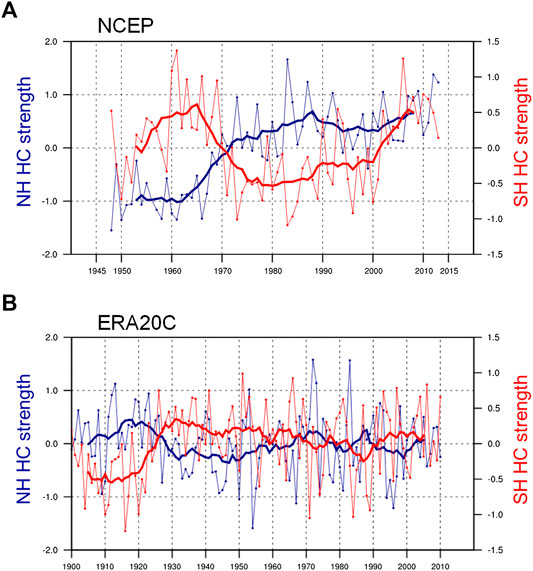
FIGURE 1. Time series of the raw data (thin lines) and 11-year running averages (decadal component) (thick lines) of the HC strength (109 kg s−1) indices in the NH (blue lines) and SH (red lines) derived from the (A) NCEP data set for 1948–2013 and from the (B) ERA20C data set for 1900–2010.
We then examine the time series using 20CR data for the period 1900–2010 (Supplementary Figure S2). It indicates that the HC strength index is also negatively correlated (−0.48) between the two hemispheres which is consistent but weaker than that in the ERA20 (−0.74) (Supplementary Figure S3), probably due to that the 20CR only assimilates surface variables (surface pressure, SSTs, and sea ice) but the upper-level observations are excluded (Stachnik and Schumacher, 2011). It must note that current reanalysis datasets depict the Hadley circulation with slight differences due to some systematic errors and inevitable data uncertainties (Mitas, 2005; Nguyen et al., 2013), which are beyond the current study. Albeit the decadal variabilities shown in those datasets are not completely the same, all of them have suggested a clear reversed relationship between the two hemispheres, indicating that the seesaw pattern in HC strength is valid and independent of datasets.
Relationship Between the Hadley Circulation Strength Seesaw and Atlantic Multidecadal Variability
Since the seesaw in HC strength between the two hemispheres is revealed by observational datasets, we define the HC seesaw index using the strength index in the NH minus the strength index in the SH. The difference between the NH and SH HC strength indicates that when the NH HC strength is relatively stronger (weaker) than the SH, the HC seesaw index turns to positive (negative). Thus, it depicts the interhemispheric seesaw in HC strength directly. In Figure 2, the time series based on NCEP and ERA20C datasets exhibit consistent multidecadal variability in HC strength seesaw index. Consistent with the above findings, the decadal variability in the HC strength seesaw index is somewhat significant and shows two turning signs in the 1960s and around 2000 in the NCEP and ERA20C data sets. For the period 1948–2010, the correlation coefficient of the strength seesaw index between the two datasets is also statistically significant and reaches 0.7, indicating that the multidecadal variations are generally in phase in different data sets. The extended time series in ERA20C suggests that the HC seesaw index turns to negative around 1925. These particular points in time highly resemble the moments when the phase changes in the AMV index in the 1920s, 1960s, and around 2000. Interestingly, the AMV index exhibits reversed phases compared to the HC strength seesaw index, indicating the potential linkage between the AMV and HC strength. Then, we calculate the simultaneous correlation between the AMV and HC strength seesaw index. The correlation coefficient in the NCEP data (−0.71) is smaller than that in the ERA20C data (−0.79), but the overall relationship is consistent and statistically significant at the 90% confidence level, suggesting that the simultaneous relationship between HC strength seesaw index and the AMV is also strong and robust. We also examined the relationship between the 20CR-based HC strength seesaw index and the AMV series (Supplementary Figure S4). It is suggested that the strength seesaw index is negatively correlated with the AMV with the correlation coefficient reaches −0.74, consistent with the aforementioned results in the ERA20C and NCEP data. In addition, we also provide the results of AMV-HC strength seesaw correlations based on the unfiltered data (r = 0.4 and r = 0.39 for the NCEP and ERA20C data sets, respectively, both are significant at the 95% confidence level), and the correlations between AMV and HC strength seesaw show qualitatively consistent results with those based on the smoothed data. Therefore, this relationship is robust and independent of datasets.
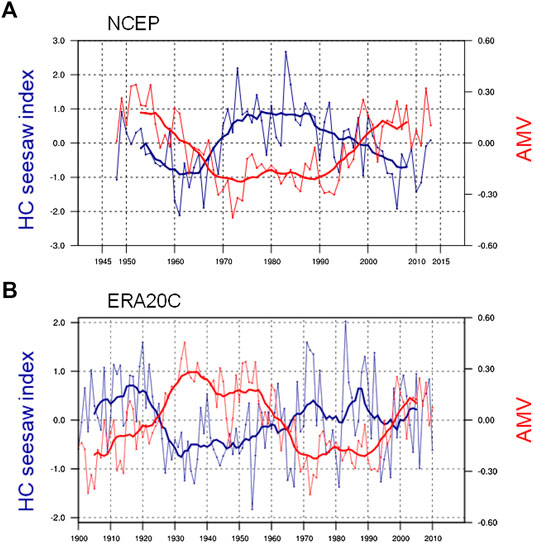
FIGURE 2. (A) Time series of the normalized HC seesaw index (NH minus SH; blue lines) and AMV index (K) (red lines) for 1948–2013. The raw data (thin lines) and the decadal component (thick lines) are derived from the NCEP data set. (B) Same as in (A), but for 1900–2010 based on the ERA20C data set.
In Figure 3A, it shows the spatial regression map between the Hadley circulation and the HC strength seesaw index in NCEP data. The Hadley circulation exhibits uniformly positive regression to the seesaw index from top to bottom of the troposphere. The most significant regressed zone is limited between 20°S and 20°N, but it is not symmetrical to the equator, consistent with the spatial distribution of the Hadley circulation suggested in the previous studies. However, the physical response of the Hadley circulation to the HC strength seesaw index varies in hemispheres. The Hadley circulation is positive (negative) in the NH (SH), corresponding to its definition (see Data and Methods). The anomalous positive response to the HC seesaw index indicates the strengthened NH HC and the weakened SH HC, referred to as the interhemispheric strength seesaw. Thus, the HC strength seesaw index defined in this study corresponds well to the spatial pattern of the interhemispheric seesaw. The regression map based on ERA20C data (Figure 3B) exhibits a consistent pattern, although the regression is relatively weak and insignificant above 200 hPa, and the equatorially asymmetric mode is not as remarkable as that in the NCEP data. In Figure 3C (NCEP) and Figure 3D (ERA20C), the Hadley circulation exhibits consistent negative regression with the AMV index, but the responses should be separately evaluated in the two hemispheres. The Hadley circulation in the SH is negatively regressed onto the AMV index, corresponding to the intensification in the SH HC under the AMV forcing. However, the negative regression over the NH indicates that the AMV has an opposite impact on the Hadley circulation, resulting in the weakening in circulation strength. Thus, we can conclude that the AMV is capable of modulating the HC strength in the two hemispheres at decadal time scales and contributes to the interhemispheric seesaw. The regression maps in the two datasets show an identical response to the AMV, although there are some discrepancies over upper-level troposphere and extra-tropics. In addition, the regression exhibits an equatorially asymmetric structure in NCEP data, but it is not significant in ERA20C data. Based on the analysis above, it indicates that the interhemispheric seesaw in Hadley circulation strength is closely related to the AMV index as well as the HC strength seesaw index, further validating the negative correlation between the seesaw index and the AMV as is shown in Figure 2.
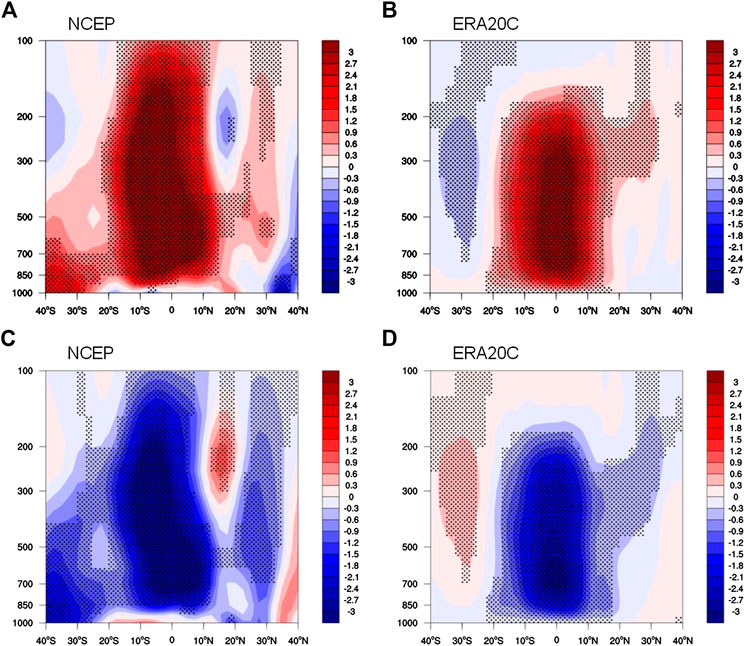
FIGURE 3. The Hadley circulation mass stream function (108 kg s−1) regressed on the normalized HC strength seesaw index derived from the (A) NCEP data set from 1948 to 2013, and (B) ERA20C data set from 1900 to 2010. The Hadley circulation mass stream function (108 kg s−1) regressed on the normalized AMV index derived from the (C) NCEP data set and (D) ERA20C data set. Dotted shading indicates the regression coefficients significant at the 95% confidence level.
Footprint of the Hadley Circulation Strength Seesaw on the Monsoon Precipitation
The Hadley circulation plays an important role in modulating the tropical precipitation through the meridional migration of its ascending branch which is associated with the intertropical convergence zone (ITCZ). We calculate the correlations between the tropical precipitation and the HC strength seesaw index using the ERA20C and NCEP for the period 1901–2010 and 1948–2013, respectively. For the ERA20C data set (Figure 4A), the correlation map exhibits a clear dipole pattern, with the positive correlations located mainly in the Southern Hemisphere, while the negative correlations located in the Northern Hemisphere, consistent with those in the NCEP reanalysis data (Figure 4B) and GPCC observational data (Supplementary Figure S5). The positive correlation is strong and significant in South America, West Africa, and Australia in the Southern Hemisphere, but the correlation changes in reverse polarity across the equator and exhibits strong negative response in the Sahel, India, Indochina Peninsula, and East Asia. Interestingly, those areas where they exhibit the most prominent responses to the HC strength seesaw largely correspond with the most active monsoon regions. Previous studies have revealed the influences of the Hadley circulation/ITCZ on the East Asian and African monsoon system (Zhou et al., 2017; Geen et al., 2018; Nicholson, 2018). The meridional movement of the ascending branch in the HC influences the global monsoon in response to the remote North Atlantic forcing, resulting in an anti-phase interhemispheric variability in monsoon strength at decadal time scales (Han et al., 2019; Xu et al., 2019), which resembles our results. Thus, it is evident that the meridional movement of the ITCZ associated with the HC ascending branch modulates the monsoon precipitation and consequently leads to the contrasting responses in the two hemispheres. Such connection can be well explained by the interhemispheric seesaw in HC strength.
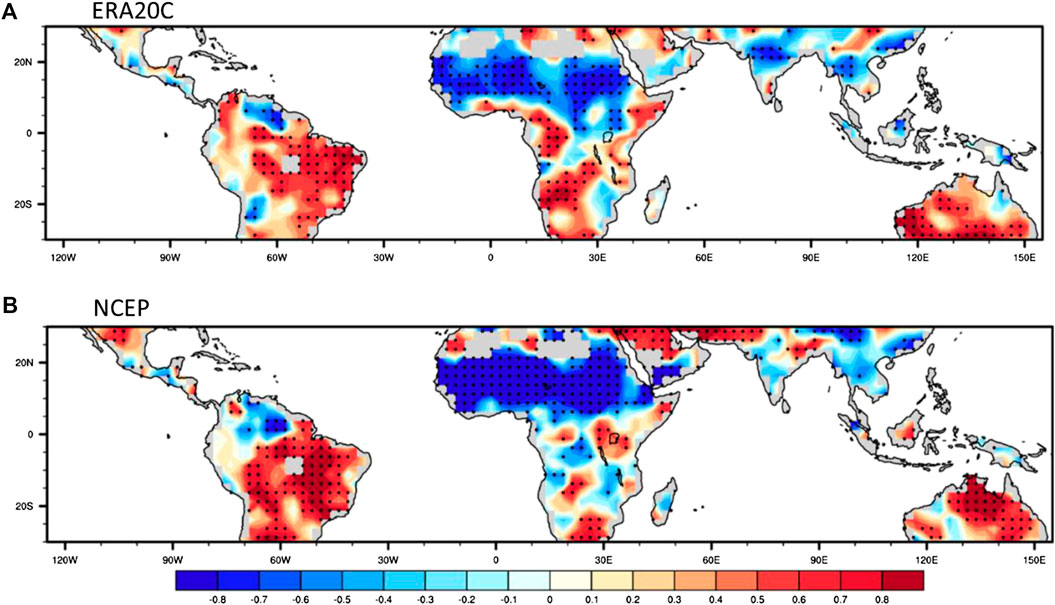
FIGURE 4. Correlation map between the decadal component of the HC strength seesaw index and the tropical precipitation (30°S–30°N). The HC strength seesaw index is derived from (A) ERA20C for the period 1901–2010 and (B) NCEP data for the period 1948–2013. The precipitation data is derived from CRU data from 1901 to 2013. The long-term linear trends were removed before the analysis. Dotted shading indicates the correlation coefficients significant at the 95% confidence level.
It is important to note that the HC strength seesaw physically corresponds with the meridional migration of the ascending branch in the HC. The positive (negative) strength seesaw index represents the Hadley circulation in the Northern (Southern) Hemisphere is stronger than the other, corresponding to the southward shift (northward shift) of the ascending branch and consequently leads to a favorable condition for producing more precipitation in the Southern (Northern) Hemisphere tropical areas. Thus, the corresponding across-equatorial winds and the meridional migration of the HC ascending branch together contribute to the increased monsoon precipitation. In this study, the HC strength seesaw plays an intermedia role in connecting the monsoon systems in the two hemispheres and it provides additional evidence for the impacts of the Hadley circulation on the tropical monsoon rainfall. The previous study (Levine et al., 2018) has noted that the AMV plays a major role in impacting the ITCZ-driven precipitation across Africa and South America. Since the location of the ITCZ is associated with the Hadley circulation ascending branch, the contrasting responses of tropical precipitation to the HC strength seesaw index in the two hemispheres may be rooted in the remote AMV signal. Thus, the physical mechanism between the interhemispheric seesaw in HC strength and AMV at decadal time scales needs further investigation.
Model Evidence for Atlantic Multidecadal Variability-Hadley Circulation Strength Connection Mechanism
The observational data suggest that the multidecadal variability in the interhemispheric HC strength seesaw is evident. The regression between the Hadley circulation and the AMV index suggests that the AMV is closely related with such strength seesaw at decadal time scales. How does the AMV influence the HC strength? In this study, we propose two possible mechanisms that may be responsible for the HC strength decadal variability: one is a direct atmospheric response to the AMV-induced North Atlantic warming simulated in ATL_VARAGCM experiment; the other is the air–sea coupling process over the Indo-Pacific basins with the remote AMV forcing included, referring to as ATL_VARMIX experiment (see Data and Methods).
In Figure 5, we first examine the simulated time series of the NH and SH HC strength index for the period 1900–2010. In the ATL_VARMIX experiment (Figure 5A), the simulated time series exhibits obvious decadal variability through the whole analyzed period, and the strength index in one hemisphere is opposite to the other, indicating an identical interhemispheric seesaw pattern in observation. Interestingly, the simulated time series before 1950 is consistent with the ERA20C dataset, which only shows decadal variability in this period with a turning sign that occurs in the 1920s. However, the simulated time series is similar to that in the NCEP dataset after 1950, which exhibits strong decadal variability with a change of sign around 1970. Overall, the time series of the HC strength indices in the two hemispheres are successfully reproduced in the ATL_VARMIX experiment, and their decadal variabilities are significant over the whole simulation period. Consistent with the observation, the correlation coefficient of the HC strength between the two hemispheres reaches −0.80 and is statistically significant at the 95% confidence level, providing model evidence for the interhemispheric strength seesaw. Furthermore, the HC strength seesaw index simulated in the ATL_VARMIX experiment is also negatively correlated (−0.82) with the AMV index, suggesting the HC strength interhemispheric seesaw and its relation to the AMV are robust consistent with the observation. For the time series in the ATL_VARAGCM, it also exhibits decadal variability, but it is far too weak, comparing to the ATL_VARMIX and observational data. The HC strength index in the two hemispheres (Figure 5B) shows a generally consistent tendency toward intensification from 1900 to 2010. The opposite trends between the NH and SH HC index are not obvious in this case, especially for the period before the 1920s. Despite these discrepancies exist between the ATL_VARMIX and ATL_VARAGCM, there are some notable features that should be highlighted. The former experiment mainly depicts the decadal variability before 2000, but the recent intensification in the SH HC strength is underestimated. However, the latter experiment successfully reproduces such a trend in the 2000s, consistent with the NCEP data. Thus, we may conclude that the air–sea coupling effect over the Indo-Pacific basins contributes to the decadal variability in HC strength seesaw significantly and may amplify the direct response of the atmosphere to the remote AMV forcing. The recent HC intensification shown in the observation and ATL_VARAGCM indicates that the direct atmospheric response to the AMV also plays a role in modulating the HC strength. The HC strength index exhibits three major changes of sign in the 1920s, 1960s, and 1990s and corresponds to the three turning signs observed in the AMV index, indicating the AMV has a profound influence on the HC strength through both direct atmospheric feedback and Indo-Pacific air–sea coupling, but the latter effect is of great significance.
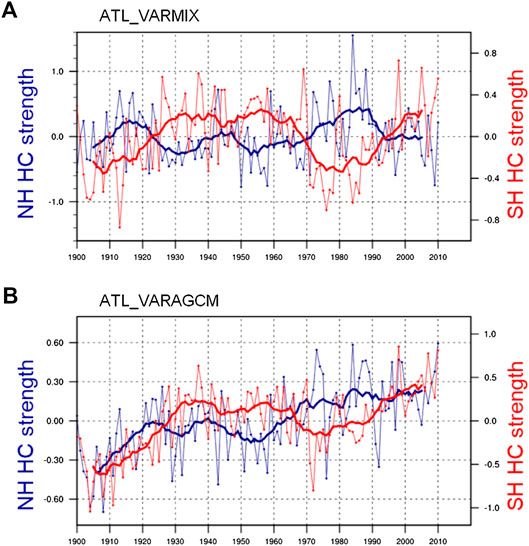
FIGURE 5. Time series of the raw (thin lines) and decadal component (thick lines) of the HC strength indices (109 kg s−1) in the NH (blue lines) and SH (red lines) from the (A) ATL_VARMIX and the (B) ATL_VARAGCM experiment for 1900–2010.
We then examine the Hadley circulation response to the AMV forcing in ATL_VARMIX and ATL_VARAGCM experiment. The regression map in ATL_VARMIX simulation (Figure 6A) suggests that the Hadley circulation is negatively regressed onto the AMV index between 15°S and 15°N, corresponding to the spatial distribution of the Hadley circulation. The simulated pattern is consistent with the observational results, but the responses over upper-level troposphere and extra-tropics are missing in the ATL_VARMIX experiment. Despite the discrepancy between observation and model simulation, the negative response is captured by the model and most significant over the tropical region. As discussed in the observation, the overall negative regression indicates an intensification in the SH HC strength and the weakening in the NH HC with respect to the remote AMV forcing. Thus, it provides model evidence for the close relationship between the interhemispheric strength seesaw and the AMV, and the non-negligible role of Indo-Pacific air–sea coupling. In Figure 6B, the regression map in ATL_VARAGCM also exhibits notable negative regression, indicating the direct atmospheric response to the AMV over the NH also plays a role in modulating the Hadley circulation but has limited contribution. Comparing with the simulated pattern in the ATL_VARMIX experiment, the Hadley circulation in the NH tropics (0°–10°N) shows little response to the AMV in ATL_VARAGCM experiment. The SH HC is significantly intensified by the AMV-related atmospheric feedback, but the NH HC strength does not change with it. Thus the seesaw pattern is missing without considering the Indo-Pacific air–sea coupling effect in response to the AMV.
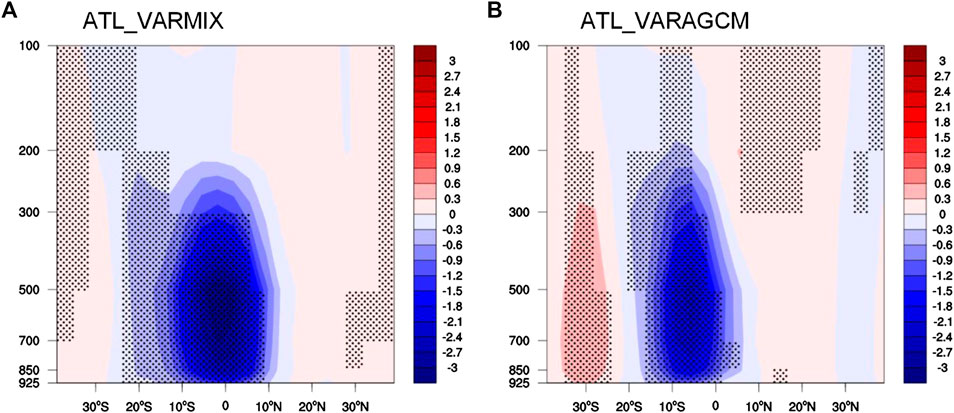
FIGURE 6. The Hadley circulation mass stream function (108 kg s−1) regressed on the normalized AMV index in the (A) ATL_VARMIX and the (B) ATL_VARAGCM for 1900–2013. Dotted shading indicates the regression coefficients significant at the 95% confidence level.
As suggested in the above discussion, the AMV index is negatively correlated with the seesaw index in HC strength, indicating the AMV could be a potential driver of the interhemispheric strength seesaw. Thus, we calculate the zonally averaged meridional wind regressed onto the AMV index to investigate the relationship between the AMV and atmospheric circulation changes. In Figures 7A,B, the critical feature of the regression map is clearly shown in the two data sets, despite some discrepancies that can be found over the middle troposphere and extra-tropics. It exhibits a consistent pattern that the lower level tropical region (20°S–20°N) is governed by anomalous cross-equatorial southerlies associated with the northward shift of the ascending branch of the HC, while the overturning northerlies over upper-level troposphere form a closed atmospheric circulation across the equator. It is suggested that the AMV can induce an anomalous anticlockwise circulation over the tropical region, and its impact on the Hadley circulation is equatorially asymmetric, resulting in intensification in the SH HC strength. In the ATL_VARMIX experiment (Figure 7C), the regression map exhibits a consistent pattern in the ERA20C data, but it has “filtered” some of the responses outside the tropics. The lower level response is weaker than the observed, but the anomalous southerlies are still significant. Although the magnitude and strength are underestimated by the model, the experiment still reveals the equatorially asymmetric circulation anomalies, considering Indo-Pacific air–sea coupling under the AMV forcing. In the ATL_VARAGCM experiment (Figure 7D), it also exhibits an anomalous anticlockwise circulation in association with the AMV, but the strength is rather weak, compared with the observation. In addition, the simulated lower level wind anomalies at the north of the equator have limited response to the AMV, corresponding to the weak anomalous anticlockwise circulation. Thus, the interhemispheric seesaw is not significant in this case. We may conclude that the anomalous anticlockwise circulation over the tropics is closely related to the AMV forcing and significantly intensifies the Hadley circulation over the Southern Hemisphere. The simulated pattern in ATL_VARMIX differs from the ATL_VARAGCM experiment in the anomalous cross-equatorial winds. The Indo-pacific air–sea coupling contributes a lot to the northward extension of the cross-equatorial winds, which leads to an intensification in the SH HC strength and the NH HC weakening. In conclusion, the interhemispheric seesaw in HC strength can be largely explained by the anomalous cross-equatorial winds induced by the Indo-Pacific air–sea coupling effects associated with the AMV forcing while the direct atmospheric feedback also plays a role.
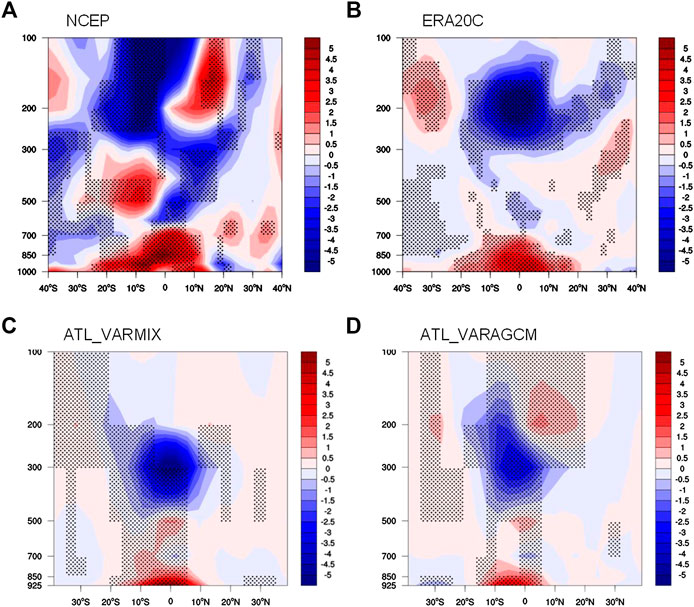
FIGURE 7. The zonal mean meridional wind (10−2 m s−1) regressed on the normalized AMV index derived from the observational datasets: (A) NCEP data set from 1948 to 2013, (B) ERA20C data set from 1900 to 2010, and experiments: (C) ATL_VARMIX, and (D) ATL_VARAGCM for the period 1900–2013. Dotted shading indicates the regression coefficients significant at the 95% confidence level.
In order to explain the formation of the anomalous cross-equatorial winds from an air–sea coupling perspective, we further analyze the footprints of the AMV on the NH SSTs. As shown in Figure 8A, the North Atlantic exhibits a uniformly warming response to the AMV signal. Previous studies (Rong and Delworth, 2007) have suggested that the AMV can influence the North Pacific climate through atmospheric teleconnection and ocean dynamics. In this study, the North Pacific SST shows a positive response to the AMV, and it is more significant over the mid-latitudes (20°N–60°N) and western North Pacific, while the eastern tropical Pacific Ocean exhibits slightly negative response. The Indian Ocean SST also shows warming response to the AMV, but it is not significant. Consistent regression patterns can be found in the HadSST3 (Supplementary Figure S6) and COBE SST (Supplementary Figure S7) data sets as well. The zonal mean SST anomalies in response to the AMV (Figure 8C) suggest consistent warming over the Northern Hemisphere, but the warming response is more intense over the mid-latitudes than the tropics. The SST anomalies with latitude over the Indo-Pacific is identical to the Northern Hemisphere, indicating the Indo-Pacific SST warming associated with the AMV can explain a large portion of the SST warming over the entire NH. In the ATL_VARMIX experiment (Figures 8B,D), the simulated regression pattern is generally consistent with the observation but discrepancies still exist. In response to the warm phase of AMV, the model shows a warming response over a large part of the North Pacific basin and negligible warming along the west coast of North America. By contrast, the SST warming along the west coast of North America is prominent in observations. These discrepancies may possibly be attributed to the role of ocean dynamics role, which is important for the SST variability over the Northeast Pacific (Chhak and Di Lorenzo, 2007; Di Lorenzo et al., 2008). Also, the model reproduces the overall warming response in the Indo-Pacific region, indicating the AMV and regional air–sea coupling together contribute to the SST warming. The zonal mean SST anomalies are also identical to the observed one, suggesting the AMV-induced warming is evident over the Northern Hemisphere. More specifically, the tropical oceans over the North Atlantic and Indo-Pacific are significantly heated through the AMV-related atmospheric and air–sea coupling processes, further inducing a northward shift of the ascending branch in the Hadley circulation. Thus, the anomalous cross-equatorial winds corresponded to the meridional movement of the ascending motions intensifies the SH HC strength and weakens the HC strength in the NH, referring to the HC strength interhemispheric seesaw. These results indicate that the AMV is a global climate mode influencing not only the Atlantic-surrounded areas but also the Pacific basin, and the Pacific multidecadal SST anomalies also play a role in the interhemispheric seesaw in the HC strength through the SST footprint of AMV over the North Pacific basin.
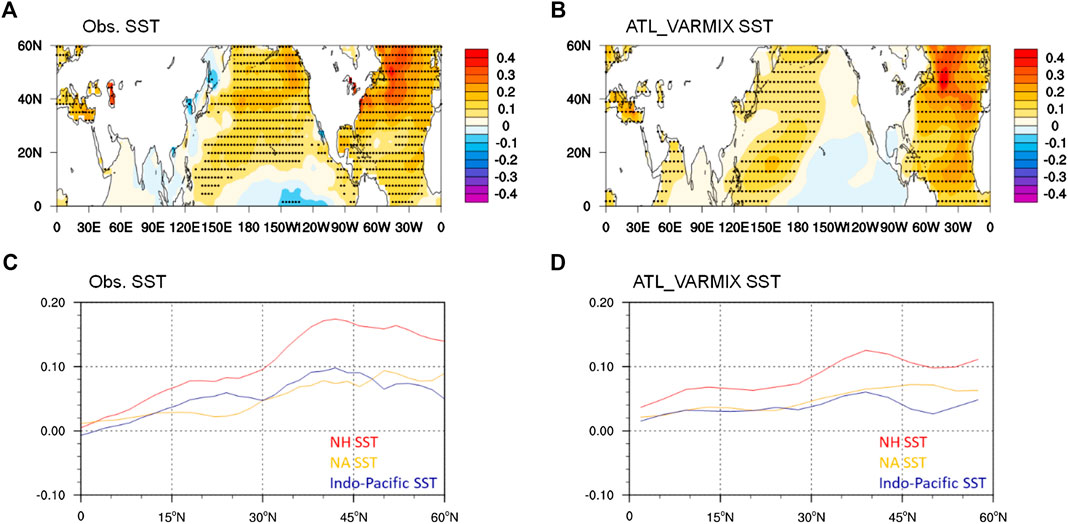
FIGURE 8. The anomalous SST (K) regressed on the normalized AMV index derived from the (A) ERSST dataset and the (B) ATL_VARMIX experiment for the period 1900–2013. The SST over the North Atlantic is prescribed with monthly-varying SSTs from the HadISST data. Dotted shading in (A) and (B) indicates the regression coefficients significant at the 95% confidence level. The zonal mean SST anomalies (K) of the Northern Hemisphere (red lines), North Atlantic (yellow lines), and Indo-Pacific (blue lines) are derived from the (C) ERSST dataset and the (D) ATL_VARMIX experiment.
On the other hand, whether the Indo-Pacific SST itself drives the anomalous Atlantic SST and the HC strength seesaw remain elusive. We then conduct a similar experiment but with monthly-varying observed SSTs from the HadISST data prescribed over the northern Indo-Pacific basin (30°E–90°W, 0°–60°N) while running the ICTPAGCM coupled to the SOM in the Atlantic and other basins, referring to the Indo-Pacific pacemaker experiment. The regression map (Supplementary Figure S8A) between the simulated SST anomalies and the AMV index is analyzed. Compared with the results from the observations (Figure 8A) and Atlantic pacemaker experiment (Figure 8B), the SST footprint of AMV over the northern Indo-Pacific basin remains, as the observed northern Indo-Pacific SST anomalies are prescribed. However, the anomalous SST responses to the observed Indo-Pacific SST forcings over the North Atlantic are rather weak, and a weak warming response is only confined to the mid-latitude North Atlantic. The North Atlantic SST response to Indo-Pacific SST forcing does not show the AMV-like basin-wide coherent pattern, indicating that the Indo-Pacific alone is not capable of reproducing the AMV signal and thus would have a limited impact on the HC interhemispheric strength seesaw. The regression pattern of the HC mass stream function on the AMV index (Supplementary Figure S8B) also supports the above conclusion that the Indo-Pacific SSTs are incapable of reproducing the interhemispheric HC strength seesaw, due to the absence of North Atlantic AMV-like SST anomalies in the Indo-Pacific Pacemaker simulations. Contrary to the observation and ATL_VARMIX experiment, the simulated HC anomaly pattern in response to the Indo-Pacific SST forcing experiment only exhibits a weakening in the strength in Northern Hemisphere and no significant response in Southern Hemisphere. The comparison between the results from observations, Atlantic and Indo-Pacific Pacemaker experiments confirms the critical role of AMV and suggests that the Indo-Pacific SST itself is not a driver of the AMV or the HC strength seesaw, but shows significant responses to the AMV and plays an intermediate role in the driving influence of the AMV on the HC strength seesaw.
Besides the AMV, the Pacific Decadal Oscillation is another important mode of decadal SST variability. The PDO is recognized as a dominant pattern of the North Pacific SST multidecadal variability which integrates a couple of modes of climate variability, influencing the weather patterns over the downstream regions (Newman et al., 2016). Therefore, we also investigate the relationship between the HC strength seesaw and the PDO. The filtered PDO series (Supplementary Figure S9) exhibits significant decadal variability with four major phase changes in the 1920s, 1940s, 1970s, and 2000s. The “warm phase” PDO is for the periods 1920–1945 and 1980–2000, while its “cool phase” lasts for about thirty years during 1945–1975. Unlike the PDO index, the HC strength seesaw index is positive before the 1920s, then turns to its negative phase till the 1960s. It is clear that the phase shifts in the PDO do not correspond with those in the HC strength seesaw. During the period 1920–1950, the opposite phase can be seen between the PDO and HC strength seesaw, whereas for the period 1950–1980, the PDO is basically in phase with the HC strength seesaw. Also, the correlation coefficient between these two time series is small and insignificant (close to zero), further indicating the relationship between them is rather too weak. Supplementary Figure S10 shows the SST anomaly pattern of the PDO. The PDO related SST anomalies show an equatorially symmetric structure centered over the eastern tropical Pacific. Therefore, the anomalous interhemispheric meridional SST gradient for the PDO SST mode is weak and thus the effects of PDO on the tropical cross-equatorial winds are consequently weak. This may be the reason for the weak relationship between the PDO and interhemispheric seesaw in HC strength.
Conclusions and Discussions
In this study, we identify the multidecadal variability in the hemispheric Hadley circulation strength using NCEP and ERA20C data. The Hadley circulation strength between the two hemispheres is significantly correlated (above −0.8) at decadal time scales. It is suggested that the intensification in one hemisphere accompanies with the weakening in the other, resulting in an interhemispheric seesaw in Hadley circulation strength. The HC strength seesaw index, which represents the relative strength in each hemisphere, is negatively correlated with the AMV index. The spatial regression exhibits a strong negative response of the Hadley circulation to the AMV and leads to the strengthened HC in one hemisphere and weakened in the other, corresponding to the interhemispheric seesaw in HC strength. It is also evident that the AMV can influence the global precipitation by modulating the decadal movement of the ascending branch of the Hadley circulation and leads to an interhemispheric dipole in tropical precipitation. A suit of Atlantic Pacemaker experiments successfully reproduces the close relation between the HC strength seesaw and the AMV, consistent with observation. The ATL_VARMIX experiment indicates that the warm phase AMV and its footprints on the Indo-Pacific SST warming lead to the northward shift of the HC ascending branch and the corresponded cross-equatorial wind anomalies. Thus, the anticlockwise circulation induced by the AMV imposes onto the Hadley circulation, resulting in the strengthened SH HC and weakened in the NH. The strength seesaw is attributed to the air–sea coupling effect over the Indo-Pacific oceans in association with the AMV-induced warming (AMV footprint), while the direct atmospheric response to the AMV plays a minor role.
The Hadley Cell is one of the most important atmospheric circulations in the world. It profoundly influences the climate over the tropics and remote regions. Our study identifies the multidecadal variation in the Hadley circulation strength interhemispheric seesaw, further connecting its impact on tropical monsoonal precipitation with the remote AMV signal. In this study, the critical features of the HC strength seesaw are well captured by the two data, but observational uncertainty still exists. For example, the lead–lag relation of the interhemispheric HC strength between the current two reanalysis data sets is not quite the same (the correlation maximizes when the NH leads the SH in the NCEP, but lags the SH in the ERA20C). In addition, the experiment’s performance is limited by the model resolution. The coarse grid in the model may not be enough to simulate the complex processes over the tropics and upper-level troposphere. Thus, a more reliable observation and advanced coupled model are needed in future works. As we have suggested a clear interhemispheric dipole in tropical precipitation associated with the HC strength seesaw, it is important to investigate their physical connections and the HC strength seesaw may be a valuable indicator for tropical monsoon prediction.
Our work mainly focuses on the interhemispheric differences in HC strength but other features of the Hadley circulation like the recent poleward expansion have also received considerable attention. Although the relationship between the PDO and HC strength seesaw is weak, previous studies have indicated an important role of the natural variability (PDO) in modulating the HC width (Grassi et al., 2012; Allen and Kovilakam, 2017; Staten et al., 2018). The role of the Atlantic decadal SST variability (AMV) in the HC expansion remains a future avenue of investigation.
Data Availability Statement
The raw data supporting the conclusions of this article will be made available by the authors, without undue reservation.
Author Contributions
CS designed the research. YL, CS, and GZ performed the data analysis, prepared all figures and led the writing of the manuscript. All the authors discussed the results and commented on the manuscript.
Conflict of Interest
The authors declare that the research was conducted in the absence of any commercial or financial relationships that could be construed as a potential conflict of interest.
Acknowledgments
We would like to thank the reviewers for their constructive comments that helped improve our manuscript. This work was jointly supported by the National Natural Science Foundation of China (41975082, 41775038, and 41790474), and National Key Research and Development Program of China (2016YFA0601801).
Supplementary Material
The Supplementary Material for this article can be found online at: https://www.frontiersin.org/articles/10.3389/feart.2020.580457/full#supplementary-material
References
Allen, R. J., and Kovilakam, M. (2017). The role of natural climate variability in recent tropical expansion. J. Clim. 30 (16), 6329–6350. doi:10.1175/jcli-d-16-0735.1.
Chang, E. K. M. (1995). The influence of Hadley circulation intensity changes on extratropical climate in an idealized model. J. Atmos. Sci. 52 (11), 2006–2024. doi:10.1175/1520-0469(1995)052<2006:tiohci>2.0.co;2
Chen, J., Carlson, B. E., and Del Genio, A. D. (2002). Evidence for strengthening of the tropical general circulation in the 1990s. Science 295 (5556), 838–841. doi:10.1126/science.1065835
Chhak, K., and Di Lorenzo, E. (2007). Decadal variations in the California Current upwelling cells. Geophys. Res. Lett. 34 (14), L14604. doi:10.1029/2007gl030203
Compo, G. P., Whitaker, J. S., Sardeshmukh, P. D., Matsui, N., Allan, R. J., Yin, X., et al. (2011). The twentieth century reanalysis project. Q. J. R. Meteorol. Soc. 137, 1–28. doi:10.1002/qj.776
Di Lorenzo, E., Schneider, N., Cobb, K. M., Franks, P. J. S., Chhak, K., Miller, A. J., et al. (2008). North Pacific Gyre Oscillation links ocean climate and ecosystem change. Geophys. Res. Lett. 35 (8), 1–6. doi:10.1029/2007gl032838
Diaz, H. F., and Bradley, R. S. (2004). “The Hadley circulation: present, past, and future,” in The Hadley circulation: present, past and future. Berlin: Springer, 1–5.
Dima, I. M., and Wallace, J. M. (2003). On the seasonality of the Hadley cell. J. Atmos. Sci. 60 (12), 1522–1527. doi:10.1175/1520-0469(2003)060<1522:otsoth>2.0.co;2
Feng, J., Li, J., and Xie, F. (2013). Long-term variation of the principal mode of boreal spring Hadley circulation linked to SST over the Indo-Pacific warm pool. J. Clim. 26 (2), 532–544. doi:10.1175/jcli-d-12-00066.1
Feng, R., Li, J., and Wang, J. (2011). Regime change of the boreal summer Hadley circulation and its connection with the tropical SST. J. Clim. 24 (15), 3867–3877. doi:10.1175/2011jcli3959.1
Folland, C. K., Rayner, N. A., Brown, S. J., Smith, T. M., Shen, S. S. P., Parker, D. E., et al. (2001). Global temperature change and its uncertainties since 1861. Geophys. Res. Lett. 28 (13), 2621–2624. doi:10.1029/2001gl012877
Frierson, D. M., Lu, J., and Chen, G. (2007). Width of the Hadley cell in simple and comprehensive general circulation models. Geophys. Res. Lett. 34 (18), 19–24. doi:10.1029/2007gl031115
Geen, R., Lambert, F. H., and Vallis, G. K. (2018). Regime change behavior during Asian monsoon onset. J. Clim. 31 (8), 3327–3348. doi:10.1175/jcli-d-17-0118.1
Grassi, B., Redaelli, G., Canziani, P. O., and Visconti, G. (2012). Effects of the PDO phase on the tropical belt width. J. Clim. 25 (9), 3282–3290. doi:10.1175/jcli-d-11-00244.1
Grise, K. M., and Davis, S. M. (2020). Hadley cell expansion in CMIP6 models. Atmos. Chem. Phys. 20 (9), 5249–5268. doi:10.5194/acp-20-5249-2020
Guo, Y.-P., Li, J.-P., and Feng, J. (2016). Climatology and interannual variability of the annual mean Hadley circulation in CMIP5 models. Adv. Clim. Change Res. 7 (1–2), 35–45. doi:10.1016/j.accre.2016.04.005
Han, T., Yu, K., Yan, H., Yan, H., Tao, S., Zhang, H., et al. (2019). The decadal variability of the global monsoon links to the north Atlantic climate since 1851. Geophys. Res. Lett. 46 (15), 9054–9063. doi:10.1029/2019gl081907
Harris, I., Jones, P. D., Osborn, T. J., and Lister, D. H. (2014). Updated high‐resolution grids of monthly climatic observations–the CRU TS3. 10 Dataset. Int. J. Climatol. 34 (33), 623–642. doi:10.1002/joc.3711
Held, I. M., and Soden, B. J. (2006). Robust responses of the hydrological cycle to global warming. J. Clim. 19 (21), 5686–5699. doi:10.1175/jcli3990.1
Holton, J. R., and Staley, D. O. (1973). An introduction to dynamic meteorology. Am. J. Phys. 41 (5), 752–754. doi:10.1119/1.1987371
Hou, A. Y. (1998). Hadley circulation as a modulator of the extratropical climate. J. Atmos. Sci. 55 (14), 2437–2457. doi:10.1175/1520-0469(1998)055<2437:hcaamo>2.0.co;2
Hu, Y., and Zhou, C. (2010). “Decadal changes in the Hadley circulation,” in Advances in geosciences: Vol. 16: Atmospheric Science (AS). Singapore: World Scientific, 61–74.
Hudson, R., Andrade, M., Follette, M., and Frolov, A. (2006). The total ozone field separated into meteorological regimes. Part II: northern Hemisphere mid-latitude total ozone trends. Atmos. Chem. Phys. Discuss. 6 (12), 6183–6209. doi:10.5194/acpd-6-6183-2006
Johanson, C. M., and Fu, Q. (2009). Hadley cell widening: model simulations versus observations. J. Clim. 22 (10), 2713–2725. doi:10.1175/2008jcli2620.1
Kalnay, E., Kanamitsu, M., Kistler, R., Collins, W., Deaven, D., Gandin, L., et al. (1996). The NCEP/NCAR 40-year reanalysis project. Bull. Am. Meteorol. Soc. 77 (3), 437–471. doi:10.1175/1520-0477(1996)077<0437:tnyrp>2.0.co;2
Kucharski, F., Parvin, A., Rodriguez-Fonseca, B., Farneti, R., Martin-Rey, M., Polo, I., et al. (2016). The teleconnection of the tropical Atlantic to Indo-Pacific sea surface temperatures on inter-annual to centennial time scales: a review of recent findings. Atmosphere 7 (2), 29. doi:10.3390/atmos7020029
Levine, A. F. Z., Frierson, D. M. W., and McPhaden, M. J. (2018). AMO forcing of multidecadal Pacific ITCZ variability. J. Clim. 31 (14), 5749–5764. doi:10.1175/jcli-d-17-0810.1
Li, J., Sun, C., and Jin, F.-F. (2013). NAO implicated as a predictor of Northern Hemisphere mean temperature multidecadal variability. Geophys. Res. Lett. 40 (20), 5497–5502. doi:10.1002/2013gl057877
Lindzen, R. S. (1994). Climate dynamics and global change. Annu. Rev. Fluid Mech. 26 (1), 353–378. doi:10.1146/annurev.fl.26.010194.002033
Lu, J., Vecchi, G. A., and Reichler, T. (2007). Expansion of the Hadley cell under global warming. Geophys. Res. Lett. 34 (6), L06805. doi:10.1029/2007gl030931
Ma, J., and Li, J. (2008). The principal modes of variability of the boreal winter Hadley cell. Geophys. Res. Lett. 35 (1), L01808. doi:10.1029/2007gl031883
Mitas, C. M. (2005). Has the Hadley cell been strengthening in recent decades? Geophys. Res. Lett. 32 (3), L03809. doi:10.1029/2004gl021765
Newman, M., Alexander, M. A., Ault, T. R., Cobb, K. M., Deser, C., Di Lorenzo, E., et al. (2016). The pacific decadal oscillation, revisited. J. Clim. 29 (12), 4399–4427. doi:10.1175/jcli-d-15-0508.1
Nguyen, H., Evans, A., Lucas, C., Smith, I., and Timbal, B. (2013). The Hadley circulation in reanalyses: climatology, variability, and change. J. Clim. 26 (10), 3357–3376. doi:10.1175/jcli-d-12-00224.1
Nicholson, S. E. (2018). The ITCZ and the seasonal cycle over equatorial Africa. Bull. Am. Meteorol. Soc. 99 (2), 337–348. doi:10.1175/bams-d-16-0287.1
Oort, A. H., and Yienger, J. J. (1996). Observed interannual variability in the Hadley circulation and its connection to ENSO. J. Clim. 9 (11), 2751–2767. doi:10.1175/1520-0442(1996)009<2751:oivith>2.0.co;2
Quan, X.-W., Diaz, H. F., and Hoerling, M. P. (2004). “Change in the tropical Hadley cell since 1950, in The Hadley circulation: present, past and future. Berlin: Springer, 85–120.
Quan, X.-W., Hoerling, M. P., Perlwitz, J., Diaz, H. F., and Xu, T. (2014). How fast are the tropics expanding? J. Clim. 27 (5), 1999–2013. doi:10.1175/jcli-d-13-00287.1
Rong, Z., and Delworth, T. L. (2007). Impact of the Atlantic multidecadal oscillation on North Pacific climate variability. Geophys. Res. Lett. 34, 24–32. doi:10.1029/2007GL031601
Seidel, D. J., Fu, Q., Randel, W. J., and Reichler, T. J. (2008). Widening of the tropical belt in a changing climate. Nat. Geosci. 1 (1), 21. doi:10.1038/ngeo.2007.38
Smith, T. M., Reynolds, R. W., Peterson, T. C., and Lawrimore, J. (2008). Improvements to NOAA’s historical merged land-ocean surface temperature analysis (1880–2006). J. Clim. 21 (10), 2283–2296. doi:10.1175/2007jcli2100.1
Stachnik, J. P., and Schumacher, C. (2011). A comparison of the Hadley circulation in modern reanalyses. J. Geophys. Res. Atmos. 116 (D22), 19–27. doi:10.1029/2011jd016677
Staten, P. W., Lu, J., Grise, K. M., Davis, S. M., and Birner, T. (2018). Re-examining tropical expansion. Nat. Clim. Change. 8 (9), 768–775. doi:10.1038/s41558-018-0246-2.
Stickler, A., Brönnimann, S., Valente, M. A., Bethke, J., Sterin, A., Jourdain, S., et al. (2014). ERA-CLIM: historical surface and upper-air data for future reanalyses. Bull. Am. Meteorol. Soc. 95 (9), 1419–1430. doi:10.1175/bams-d-13-00147.1
Sun, C., Kucharski, F., Li, J., Jin, F.-F., Kang, I.-S., and Ding, R. (2017). Western tropical Pacific multidecadal variability forced by the Atlantic multidecadal oscillation. Nat. Commun. 8 (1), 1–10. doi:10.1038/ncomms15998
Sun, C., Li, J., and Zhao, S. (2015). Remote influence of Atlantic multidecadal variability on Siberian warm season precipitation. Sci. Rep. 5, 16853. doi:10.1038/srep16853
Tao, L., Hu, Y., and Liu, J. (2016). Anthropogenic forcing on the Hadley circulation in CMIP5 simulations. Clim. Dynam. 46 (9–10), 3337–3350. doi:10.1007/s00382-015-2772-1
Trenberth, K. E. (2002). Changes in tropical clouds and radiation. Science 296 (5576), 2095. doi:10.1126/science.296.5576.2095a
Trenberth, K. E., and Stepaniak, D. P. (2003). Seamless poleward atmospheric energy transports and implications for the Hadley circulation. J. Clim. 16 (22), 3706–3722. doi:10.1175/1520-0442(2003)016<3706:spaeta>2.0.co;2
Watt-Meyer, O., Frierson, D. M. W., and Fu, Q. (2019). Hemispheric asymmetry of tropical expansion under CO2 forcing. Geophys. Res. Lett. 46 (15), 9231–9240. doi:10.1029/2019gl083695
Wielicki, B. A., Wong, T., Allan, R. P., Slingo, A., Kiehl, J. T., Soden, B. J., et al. (2002). Evidence for large decadal variability in the tropical mean radiative energy budget. Science 295 (5556), 841–844. doi:10.1126/science.1065837
Xu, H., Song, Y., Goldsmith, Y., and Lang, Y. (2019). Meridional ITCZ shifts modulate tropical/subtropical Asian monsoon rainfall. Sci. Bull. 64 (23), 1737–1739. doi:10.1016/j.scib.2019.09.025
Xue, J., Sun, C., Li, J., and Mao, J. (2018). South Atlantic forced multidecadal teleconnection to the midlatitude south Indian Ocean. Geophys. Res. Lett. 45 (16), 8480–8489. doi:10.1029/2018gl078990
Zhou, B.-T., and Wang, H.-J. (2006). Interannual and interdecadal variations of the Hadley circulation and its connection with tropical sea surface temperature. Chin. J. Geophys. 49 (5), 1147–1154. doi:10.1002/cjg2.939
Keywords: Atlantic, multidecadal variability, Hadley circulation, monsoon precipitation, Indo-Pacific air–sea coupling, interhemispheric teleconnection
Citation: Liu Y, Gong Z, Sun C, Li J and Wang L (2020) Multidecadal Seesaw in Hadley Circulation Strength Between the Two Hemispheres Caused by the Atlantic Multidecadal Variability. Front. Earth Sci. 8:580457. doi: 10.3389/feart.2020.580457
Received: 06 July 2020; Accepted: 05 October 2020;
Published: 29 October 2020.
Edited by:
Raquel Nieto, University of Vigo, SpainReviewed by:
Pedro Miguel Sousa, University of Lisbon, PortugalYipeng Guo, Nanjing Normal University, China
Copyright © 2020 Liu, Gong, Sun, Li and Wang. This is an open-access article distributed under the terms of the Creative Commons Attribution License (CC BY). The use, distribution or reproduction in other forums is permitted, provided the original author(s) and the copyright owner(s) are credited and that the original publication in this journal is cited, in accordance with accepted academic practice. No use, distribution or reproduction is permitted which does not comply with these terms.
*Correspondence: Cheng Sun, scheng@bnu.edu.cn