Article

Dual Functional Composite of Montmorillonite-Rich/Chitosan (MCC) for Decolorizing the Water Used in Joss Paper Process: Thermodynamic, Isotherm, and Kinetic Studies

by
Witsarut Muangrak
1,
Nutthavich Thouchprasitchai
1,
Yuththaphan Phongboonchoo
1,2 and
Sangobtip Pongstabodee
1,2,*
1
Department of Chemical Technology, Faculty of Science, Chulalongkorn University, 254 Phayathai Road, Pathumwan, Bangkok 10330, Thailand
2
Center of Excellence on Petrochemical and Materials Technology, Chulalongkorn University, Soi Chula 12, Phayathai Rd., Pathumwan, Bangkok 10330, Thailand
*
Author to whom correspondence should be addressed.
Appl. Sci. 2020, 10(21), 7493; https://doi.org/10.3390/app10217493
Submission received: 28 September 2020 / Revised: 22 October 2020 / Accepted: 22 October 2020 / Published: 25 October 2020
(This article belongs to the Special Issue Wastewater Treatment and Waste Remediation: Recent Advances)

Abstract

:
A hybrid montmorillonite (Mt)-rich/chitosan composite (MCC) with high adsorption performance was synthesized for the decolorization of water used in the joss paper process. The performance was reported in terms of the dye removal. The composite expressed higher performance than chitosan or Mt-rich clay, respectively. The optimum condition for complete dye removal was achieved when using at least 0.6 g of the composite over a wide pH range (3–10) and initial dye concentration (10–100 mg L−1). The composite showed good reusability without the requirement of regeneration, adsorbing the dye completely for up to eight successive cycles of adsorption (>1.33 gdye gMCC−1). Thermodynamic analyses revealed the degree of spontaneity and the endothermic adsorption process. From the isotherm studies, the Koble–Corrigan isotherm model fitted very well to the experimental data, revealing that the composite had a heterogeneous surface with various active sites to adsorb the dye molecules. This also evidenced the synergistic electrostatic attraction and hydrophobic interaction between the dye and the composite. The pseudo-second-order model best explained the kinetic rate of adsorption. From evaluation of the adsorption process using the Webber and Morris equation and Boyd model, the rate-limiting step consisted of film diffusion and intra-particle diffusion.

1. Introduction

Asians of Chinese descent, including Thai-Chinese ethnicity, always use joss papers as one of various sacrificial offerings in order to worship their deities and primogenitors. The consumption rate of joss papers in Thailand alone is over 20 ton year−1 and increasing continuously. During the production of joss papers, synthetic dyes are used to make them aesthetic, fashion, colors, and virtually modern designs. More than 20% of the dyes used in this industry are discharged to the environment, where they not only cause a deterioration in the aesthetic nature but are also an environmental problem, together with an inducement of some serious problems in the water ecosystem [1,2]. Then, light penetration is reduced due to the concealment of these dyes, causing tribulation in the photosynthetic of the aquatic plant. Most dyes are classified as a hazardous material to the health of the creatures [3]. Some of them such as azo metal complex, benzidine-based, and non azo textile dyes [3,4] are carcinogenic agents, and some are mutagenic.
As known, a large volume of water is used to produce joss paper; consequently, a huge amount of wastewater with dye contamination is valid. Several technologies have been developed to remove the dyes from the wastewater, such as chemical coagulation [5,6,7], ozonation and advanced oxidations [5,8,9], photocatalytic degradation [10], membrane filtration [7], biological treatments [5,11,12], and adsorption [12,13,14,15,16]. Even though these techniques are effective, they each still have various economic, environmental, and logistic disadvantages. For example, chemical addition is required for coagulation, resulting in the production of precipitated sludge. Ozonation accompanied with oxidations and photocatalytic degradation may produce undesired complex toxic by-products. The cost of construction and operating of membrane filtration systems is quite high. A lower performance of microbes in biological treatments is obtained when less tendance is done. Among several methods, adsorption has become a promising potential method for dye removal due to its high performance, reasonable to good economics, wide adaptability, and easy operation. Nevertheless, in current practices, the removal of dye from the process water is manually overseen, potentially exposing the employees to direct contact with the harmful dyes. Moreover, it is better that making a longer life cycle of the process water free of threats and negative influence on the quality of the joss paper products, especially the color resolution, is required for the practical conservation of water usage. It is suggested to remove the dye before re-routing the water to the process.
Most of the currently used dyes contain a hydrophobic aromatic part and a hydrophilic charged part, and so some sectors of the respective dye molecules contribute hydrophobic (e.g., van der Waals; vdW) interactions, while other sectors lean to hydrophilic (e.g., electrostatic) interactions, respectively. A novel adsorbent should take advantage of these interactions to achieve a high performance over a wide operating range of dyes and conditions. Moreover, the adsorbents should also be economical, environmentally friendly, easily accessible, and reusable. One interesting potential candidate is Mt-rich clay. The lamellar structure of clay is made up of an octahedral layer of alumina sandwiched between two tetrahedron layers of silicon dioxide. The gap between the lamellar is a gallery of some cations e.g., Na+, K+, Ca2+, and Mg2+. These cations are easily replaced by other ions and form strong active sites with an ion-exchange property. However, the clay is a good adsorbent for a charged adsorbate but not for the hydrocarbon adsorbates. Another disadvantage is that clogginess in the pipe-line system is found even though clay has a high specific surface area for adsorption. Therefore, to render a more hydrophobic property with suitable surface charge and to overcome the clogginess, an abundant natural biodegradable and biocompatible chitosan was applied to the Mt-rich clay to form an MCC adsorbent.
To simulate the water used in this research work, information of the process water contaminated with dye was supplied from a Thai joss paper factory. The dye that was used in the production of joss papers was reactive red 120 (RR120). The net dye concentration in the water was around 80 ± 20 mg L−1 at the pH 5 ± 0.5. Then, the simulated process water was carried out to investigate the decolorization performance of the MCC via batch adsorption. From the preliminary test, a higher performance of dye adsorption was achieved until the weight ratio of Mt-rich clay to chitosan was up to 0.5:1. Further adding more chitosan to the MCC, the performance of the MCC did not change significantly. Therefore, a 0.5:1 (w/w) ratio MCC was fabricated and used throughout the experiments.
Firstly, the performance of chitosan, Mt-rich clay and the MCC were compared based on their respective performance for dye removal. Then, the adsorbent with the highest performance was selected to investigate by univariate analysis in order to achieve an optimum condition for the maximum removal of dye. However, to be economically and environmentally viable, the adsorbent should be reusable without a decreased performance, and so the reusability of the adsorbent was determined. To understand the insight of adsorption, the isotherms, thermodynamic and kinetics were studied as well. Means of Fourier transform-infrared spectrometry (FT-IR), nitrogen (N2) adsorption/desorption, X-ray powder diffraction (XRD), and dynamic light scattering (DLS) on a zetasizer and water contact angle analyses were carried out to characterize the absorbent.

2. Materials and Methods

2.1. Preparation of the Adsorbents

To compare the decolorization performance of adsorbents, three types of adsorbents (chitosan, Mt-rich clay, and the MCC) were used in the first part of this work.
To synthesize the MCC adsorbent with a clay:chitosan (w/w) ratio of 0.5:1 MCC, 100 mL of pale yellow viscous chitosan solution with 20 g L−1 concentration in 2% (v/v) aqueous acetic acid was prepared firstly. Adding 1 g of Mt-rich clay (Dhebkaset Industrial Co., Ltd., Bangkok, Thailand), a black viscous suspension was obtained after stirring nimbly for 24 h. Dropping 100 mL of sodium dodecyl sulfate (SDS; Ajax Finechem Co., Ltd., Bangkok, Thailand) aqueous solution with 2% (w/v) concentration to the suspension, some small flocs were formed. To ensure the formation of composite, the suspension was stirred at a rate of 300 rpm for 24 h. Then, the MCC was filtered and washed with deionized water to remove excess SDS. The MCC was dried at 70 °C for 8 h.
The chitosan adsorbent was prepared in the same manner as above except omitting the addition of clay. The Mt-rich clay adsorbent was used as received.

2.2. Characterization of Adsorbents

FT-IR spectrometry was used to analyze the surface functional groups of the adsorbents in the wavelength range of 4000–400 cm−1. A mercury-cadmium-telluride detector was used.
The specific surface area (SBET), pore volume (VP), and average pore diameter (DP) of the adsorbents were evaluated by N2 adsorption/desorption at −196 °C. Prior to analysis, 1.0 g of the samples was placed to the sample port of micromeritics instrument (ASAP 2020) to degas at 1 mmHg pressure and 100 °C for 60 min.
A Bruker D8 Advance X-ray diffractometer with a monochromatic CuKα radiation (λ = 0.15406 nm) was used to investigate the crystalline structures of the adsorbents at a scan speed of 5° min−1, 40 kV, and 30 mA. The XRD profiles were recorded in the 2θ range from 5 to 90°. The Debye–Scherrer equation was used to determine the d-spacing of the adsorbents.
Four separate measurements per adsorbents and dye sample were done in order to evaluate the magnitude of zeta potential via DLS on a zetasizer (Model 3000 HAS, Malvern Co., Malvern, UK) instrument. It was reported in average value.
The sessile drop technique was used to measure the water contact angle under light microscopy. The adsorbent was placed on a tape. Dropping deionized water through a micro-syringe on at least five various positions of the surface of adsorbent was done. To analyze the photographic image, the image tool program was used, and the data was presented as their average value.

2.3. Adsorption Measurements

To prepare 1 L of the stock dye solution, 1 g of RR120 (R-0378 Sigma-Aldrich, molecular weight = 1469.98 g mol−1) was weighed accurately and dissolved in deionized water. To obtain the desired solution, the stock solution was then diluted. Then, 0.1 M HNO3 or 0.1 M NaOH solution was used to adjust the pH to the desired value.
A 250-mL Erlenmeyer flask, which contained 0.6 g of the respective adsorbent (clay, chitosan or MCC), together with 0.1 L of the working solution with an initial RR120 dye concentration of 100 mg L−1 at pH 5.5, was shaken for a given time (15–420 min). The dye concentration before and after adsorption was analyzed by UV-Vis at a wavelength of 512 nm. The percentage of dye removal was calculated from Equation (1):
% Removal = ( C i C f ) × 100 / C i ,
where C i and C f are the dye concentration (mg L−1) before and after adsorption, respectively.
In order to determine the optimal condition for maximum dye removal, the adsorbent that showed the highest performance at a given condition was selected for further study of the influence of different initial dye concentrations (10–300 mg L−1), pH (3–10), and adsorbent dosage (0.3–1.2 g). Moreover, the reusability of the adsorbent was investigated over 11 successive adsorption cycles. After separating the adsorbent from the water, the spent adsorbent without washing was used in the next cycle.
To gain insight into the adsorption process, three adsorption isotherm models (Langmuir, Freundlich, and Koble–Corrigan model) were used to estimate the adsorption behavior at a given temperature. To determine the nature of the adsorption process, the thermodynamic parameters were evaluated. For kinetic studies, pseudo-first-order and pseudo-second-order kinetic models were selected to study the rate of the adsorption. Finally, the rate-limiting step of the adsorption on the MCC was also determined.

3. Results and Discussion

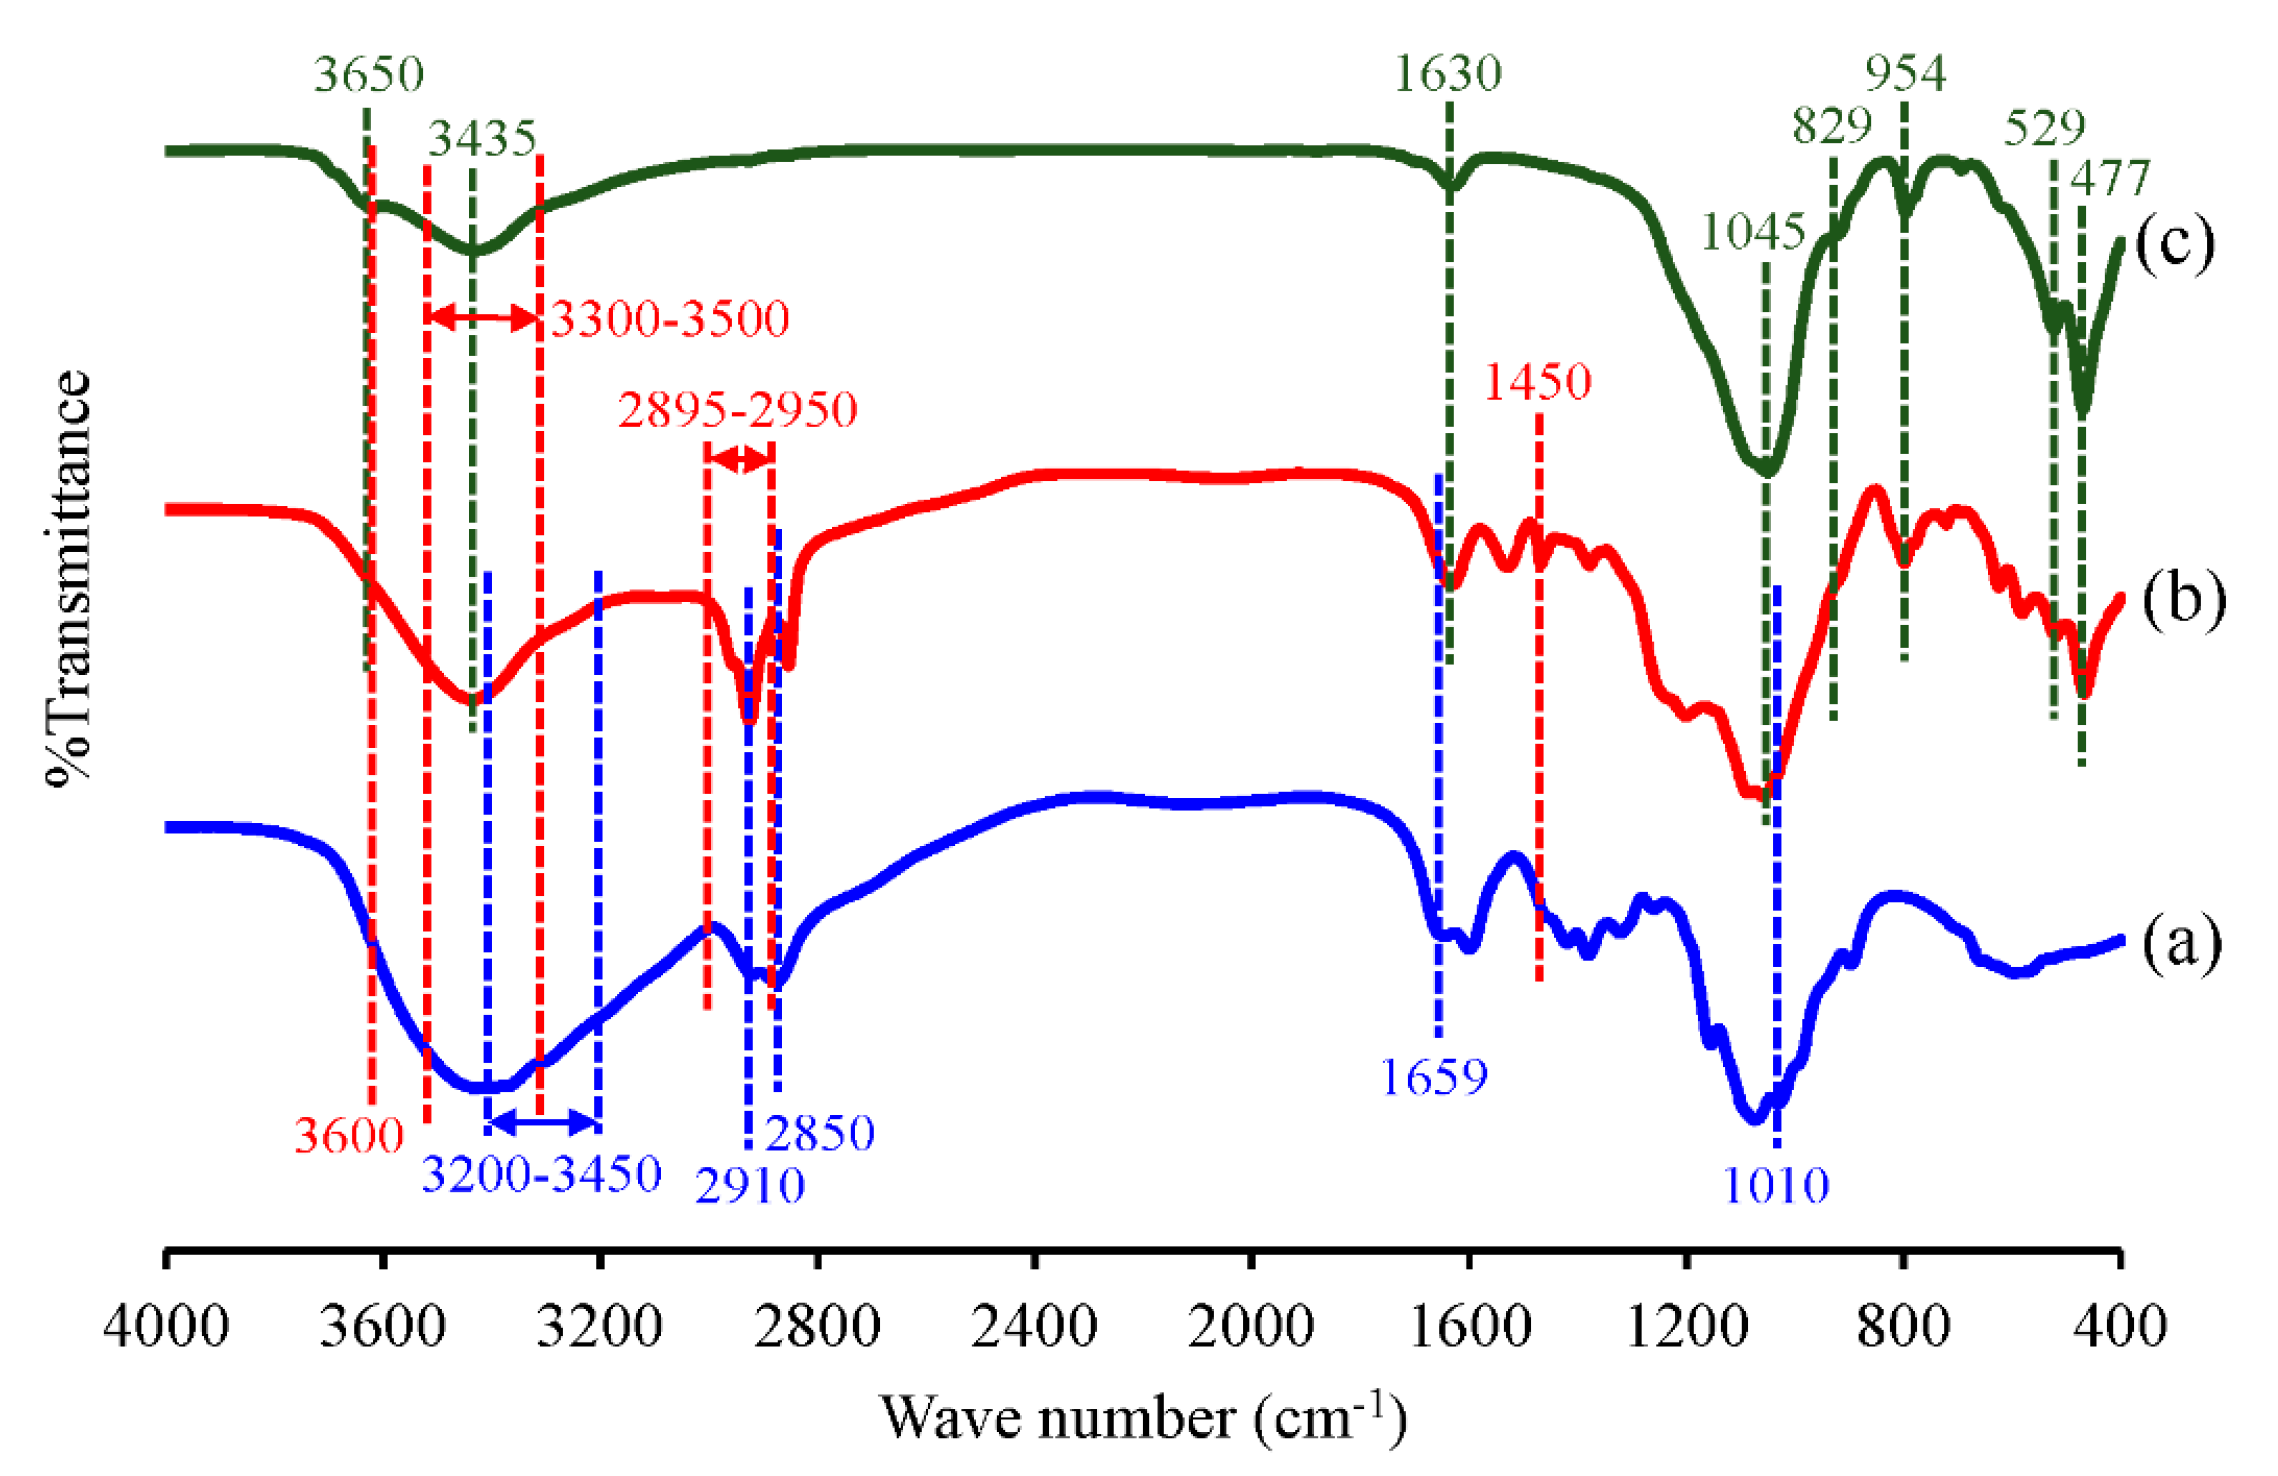
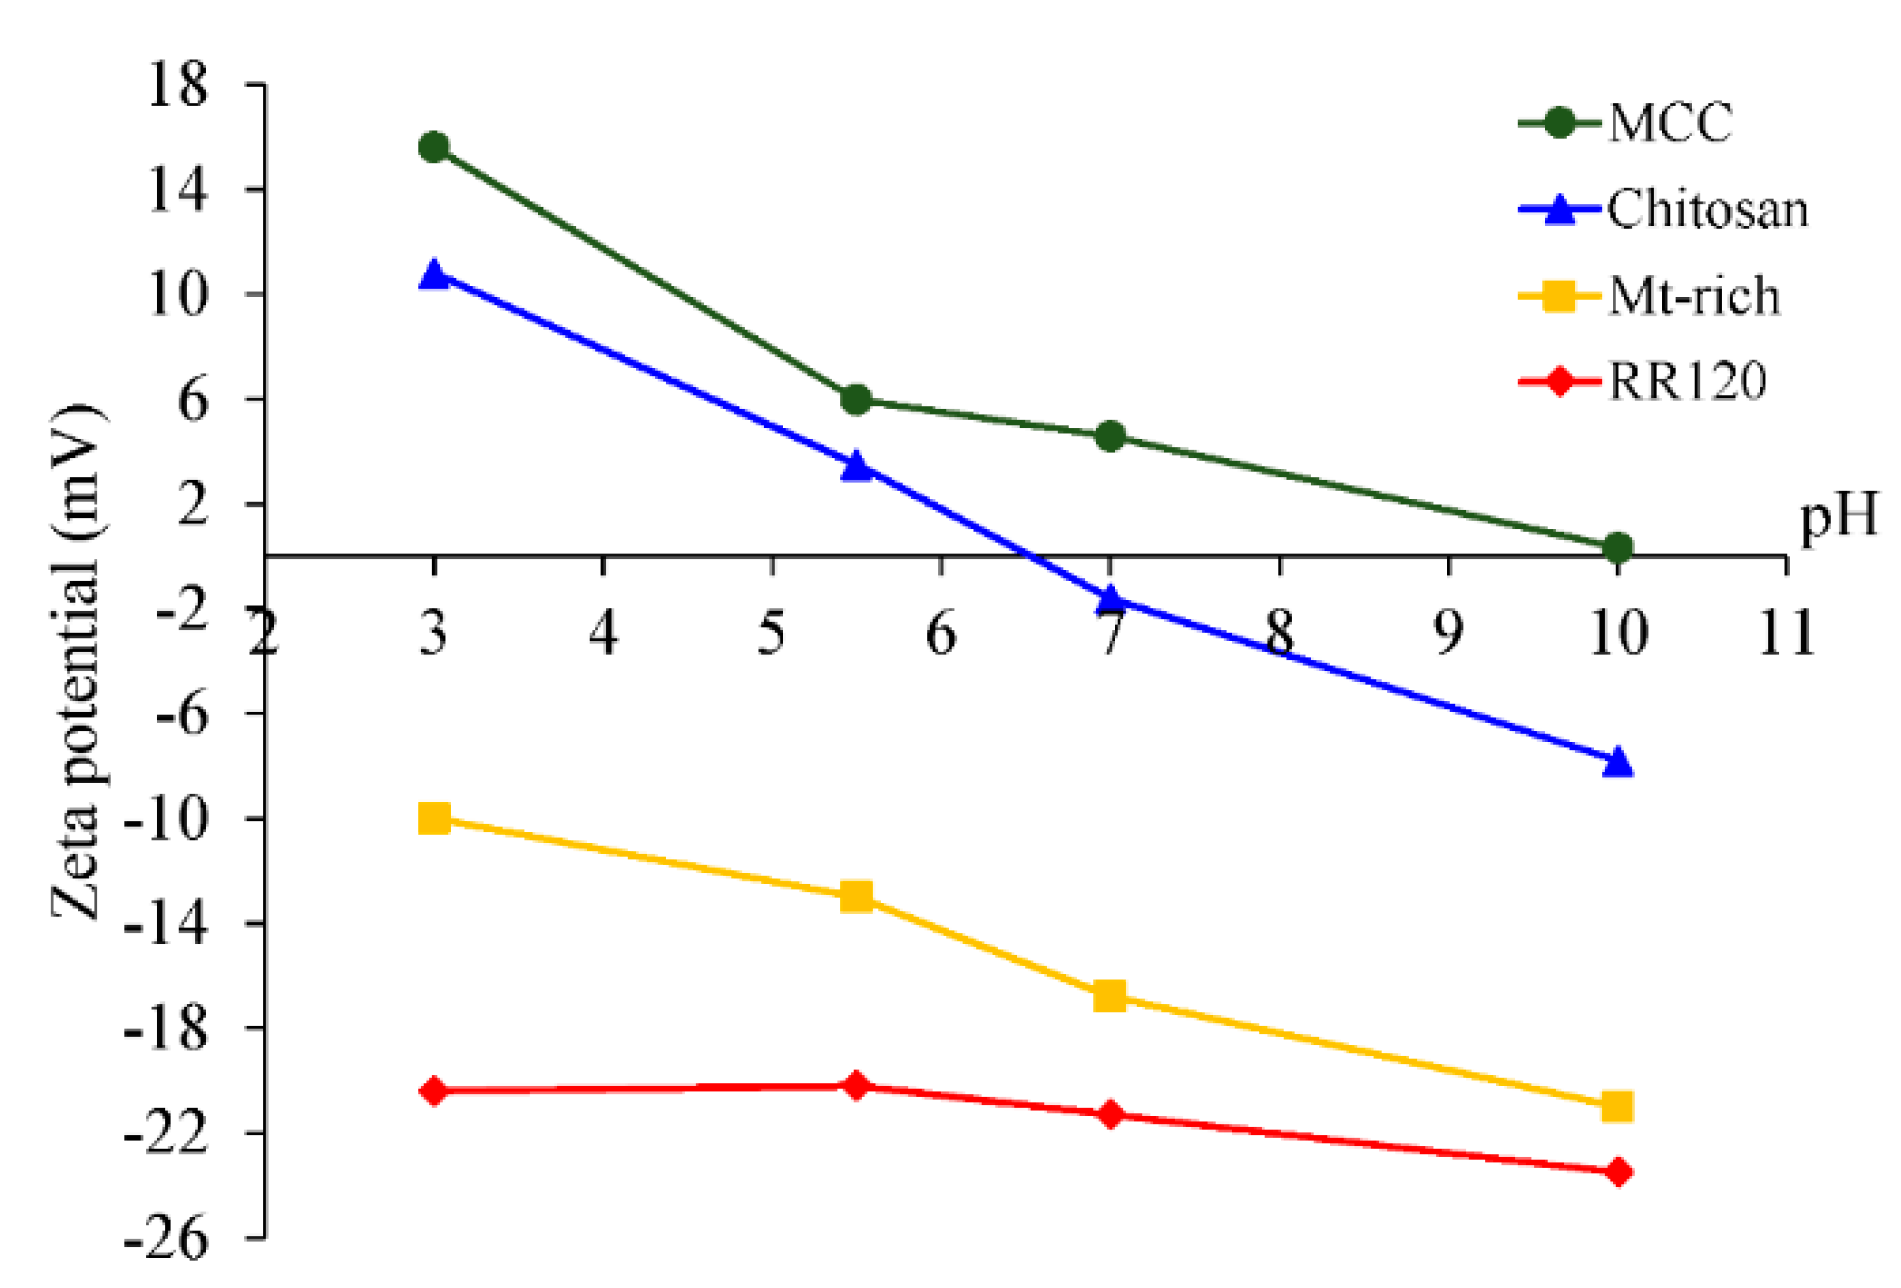
3.1. Characterization of the Adsorbent

The functional groups on the surface of the fresh chitosan, Mt-rich clay, and MCC adsorbents were evaluated by FT-IR analysis (Figure 1). For chitosan (Figure 1a), the band at a vibrational frequency range of 3200−3450 cm−1 corresponded to the overlapped band between N–H and O–H stretching bands [16]; the bands at 2910 cm−1 and 2850 cm−1 were attributed to the aliphatic C–H stretching, the bands at 1659 cm−1 and 1450 cm−1 represented the N–H bending, and that at 1010 cm−1 was ascribed to C–O stretching [17,18].
The FT-IR spectrum of the Mt-rich clay (Figure 1c) exhibited a peak at a vibrational frequency of 3650 cm−1, which was assigned to the free O–H vibration. The broad peak at 3200–3500 cm−1 (center at 3435 cm−1) was attributed to the symmetric O–H stretching of H–bonded adsorbed water molecules and the O–H stretching of the clay. The band at 1630 cm−1 corresponded to the H–O–H bending mode of adsorbed molecules of water on the clay. The bands of clay were observed at 1045 cm−1 for the Si–O out-of-plane stretching [19,20], 954 cm-1 for the Al–OH–Al bending, 829 cm−1 for the (Al,Mg)–OH stretching, 529 cm−1 for the Si–O–Al bending, and 477 cm−1 for the Si–O–Mg bending [21]. These were skeleton of clay.
The FT-IR spectrum of the MCC (Figure 1b) showed a broad peak at 3300–3600 cm−1, which was assigned to the O–H stretching vibration. The vibrational peaks at 3200–3450 cm−1, 2895–2950 cm−1, and 1659 cm−1 were attributed to N–H stretching, C–H stretching, and N–H bending vibrations, respectively. These peaks represented the main functional groups of chitosan [12]. The main functional groups of clay were found at 1045, 954, 829, 529 and 477 cm−1, respectively, as mentioned above. Thus, it was evident that the spectrum of the MCC expressed both the distinctive spectrum of chitosan and clay, and so the MCC was synthesized successfully.
The textural properties of the Mt-rich clay, chitosan, and MCC are shown in Table 1. The N2 adsorption/desorption isotherms and pore size distribution are plotted, as shown in Figure S1. The Mt-rich clay exhibited a markedly higher SBET and VP than those of chitosan (81 and 60.7-fold, respectively) or the MCC (21.4 and 18.2-fold, respectively). The SBET and VP of the MCC was much lower than the Mt-rich clay because chitosan molecules intercalated into the lamellar structure of the clay via ion exchange between NH3+ ions of chitosan and Na+ ions of clay [22,23]. Some of the chitosan covered its surface. On the other hand, it was surprising that the DP of the MCC was greater than that of chitosan (3.1-fold) or clay (1.3-fold). This possibly reflected that some chitosan intercalated into the lamellar structure of the clay, which was also supported by the XRD results (Figure 2).
The crystalline structure of the adsorbents was evaluated by XRD analysis (Figure 2). For the clay (Figure 2a), the three groups of distinguishable peaks represented the groups of Mt, quartz (Q), and kyanite (Ky). The peaks at a 2θ of 6.62°, 18.31°, 19.97°, 22.10°, 23.88°, and 25.91° represent the (001), (002), (020), (021), (111), and (−112) planes of Mt with a monoclinic structure (JCPDS Card No. 13–0135), respectively. The peaks of Q with a hexagonal structure (JCPDS Card No. 76–0823) were observed at a 2θ of 20.99°, 26.66°, 36.81°, 39.77°, 42.57°, and 45.97°. These corresponded to the planes of (100), (011,101), (110), (012,102), (200), and (021,201), respectively. The peaks at 22.65°, 24.39°, 27.90°, 29.12°, 29.82°, 30.28°, 34.89°, and 35.45° represent the (−120,020), (210), (200,111), (0–21,−211), (1–21,021), (−220,120), (012), and (030) plane of a triclinic structural Ky (JCPDS card no. 11–46). The calculated basal d-spacing at the (001) plane in clay was 14.149 Å. From the XRD pattern of the MCC (Figure 2b), the three distinguishable reflection groups with a lower intensity and a broad peak of chitosan were observed. It was noticed that the peak of Mt at the (001) plane was shifted to a lower degree of 2θ from 6.62° to 6.19°, elucidating the insertion of the biocompatible polymer into the Mt interlayers and filling the pores of clay. This resulted in the expansion of the d-spacing at the (001) plane in the MCC to 14.376 Å. Moreover, it was noticeable that a lower intensity of peak reflected a lower degree of crystallization.
To analyze the hydrophobic property of the adsorbents, the water contact angle was measured, and the results are summarized in Table 1. The magnitude of contact angle was ordered as the MCC > chitosan >> Mt-rich clay. The possible reason to explain was that the negative charges in the hydrophilic head regions of the SDS molecules interacted with the positive charges of chitosan and Mt-rich clay, while the hydrophobic tail regions of SDS headed out. Then, MCC was expressed as more hydrophobic. A higher magnitude of water contact angle represents a greater hydrophobicity. Thus, the adsorption performance of the hydrophobic part in the dye structure on the MCC is likely to be enhanced compared to the chitosan or especially the clay.
Then, to characterize the surface charges of the adsorbents and adsorbate, the zeta potential was measured by DLS. The magnitude of the zeta potential corresponds to the degree of electrostatic repulsion/attraction, and the sign of zeta potential represents the sign of the net surface charge. From the DLS results (Figure 3), the magnitude of the zeta potential decreased with increasing pH. The zeta potentials of the dye and Mt-rich clay were negative over the complete pH range of 3–10, which was due to the negative charge of the SO3 group on the structure of the RR120 dye molecule and the hydroxylated silicate sites in the clay, respectively. The MCC was positively charged over the whole pH range, but it decreased in magnitude with increasing pH to an almost zero net charge at pH 10. This decreased positive charge likely reflected the deprotonation of the protonated amino group (–NH3+) with increasing pH to form the uncharged amino group (–NH2) in chitosan and then, with further increasing the pH, the hydroxide ions (OH) were bound to the cations contained in the clay together with deprotonation of the amino group in chitosan to form –NH [24,25]. The zero point charge of the dye, clay, and MCC were not observed, whilst it was pH 6.5 for chitosan. The positive surface charges of the chitosan were present when the pH was lower than 6.5, but the negative charges were expressed when the pH was higher than 6.5. The opposite sign of surface charges between the MCC and dye encouraged their attractive forces to come close to each other, promoting the adsorption capacity. Furthermore, from the DLS results, the adsorption capacity of chitosan will likely be higher than that of clay, as shown in the following section.

3.2. Adsorption measurements

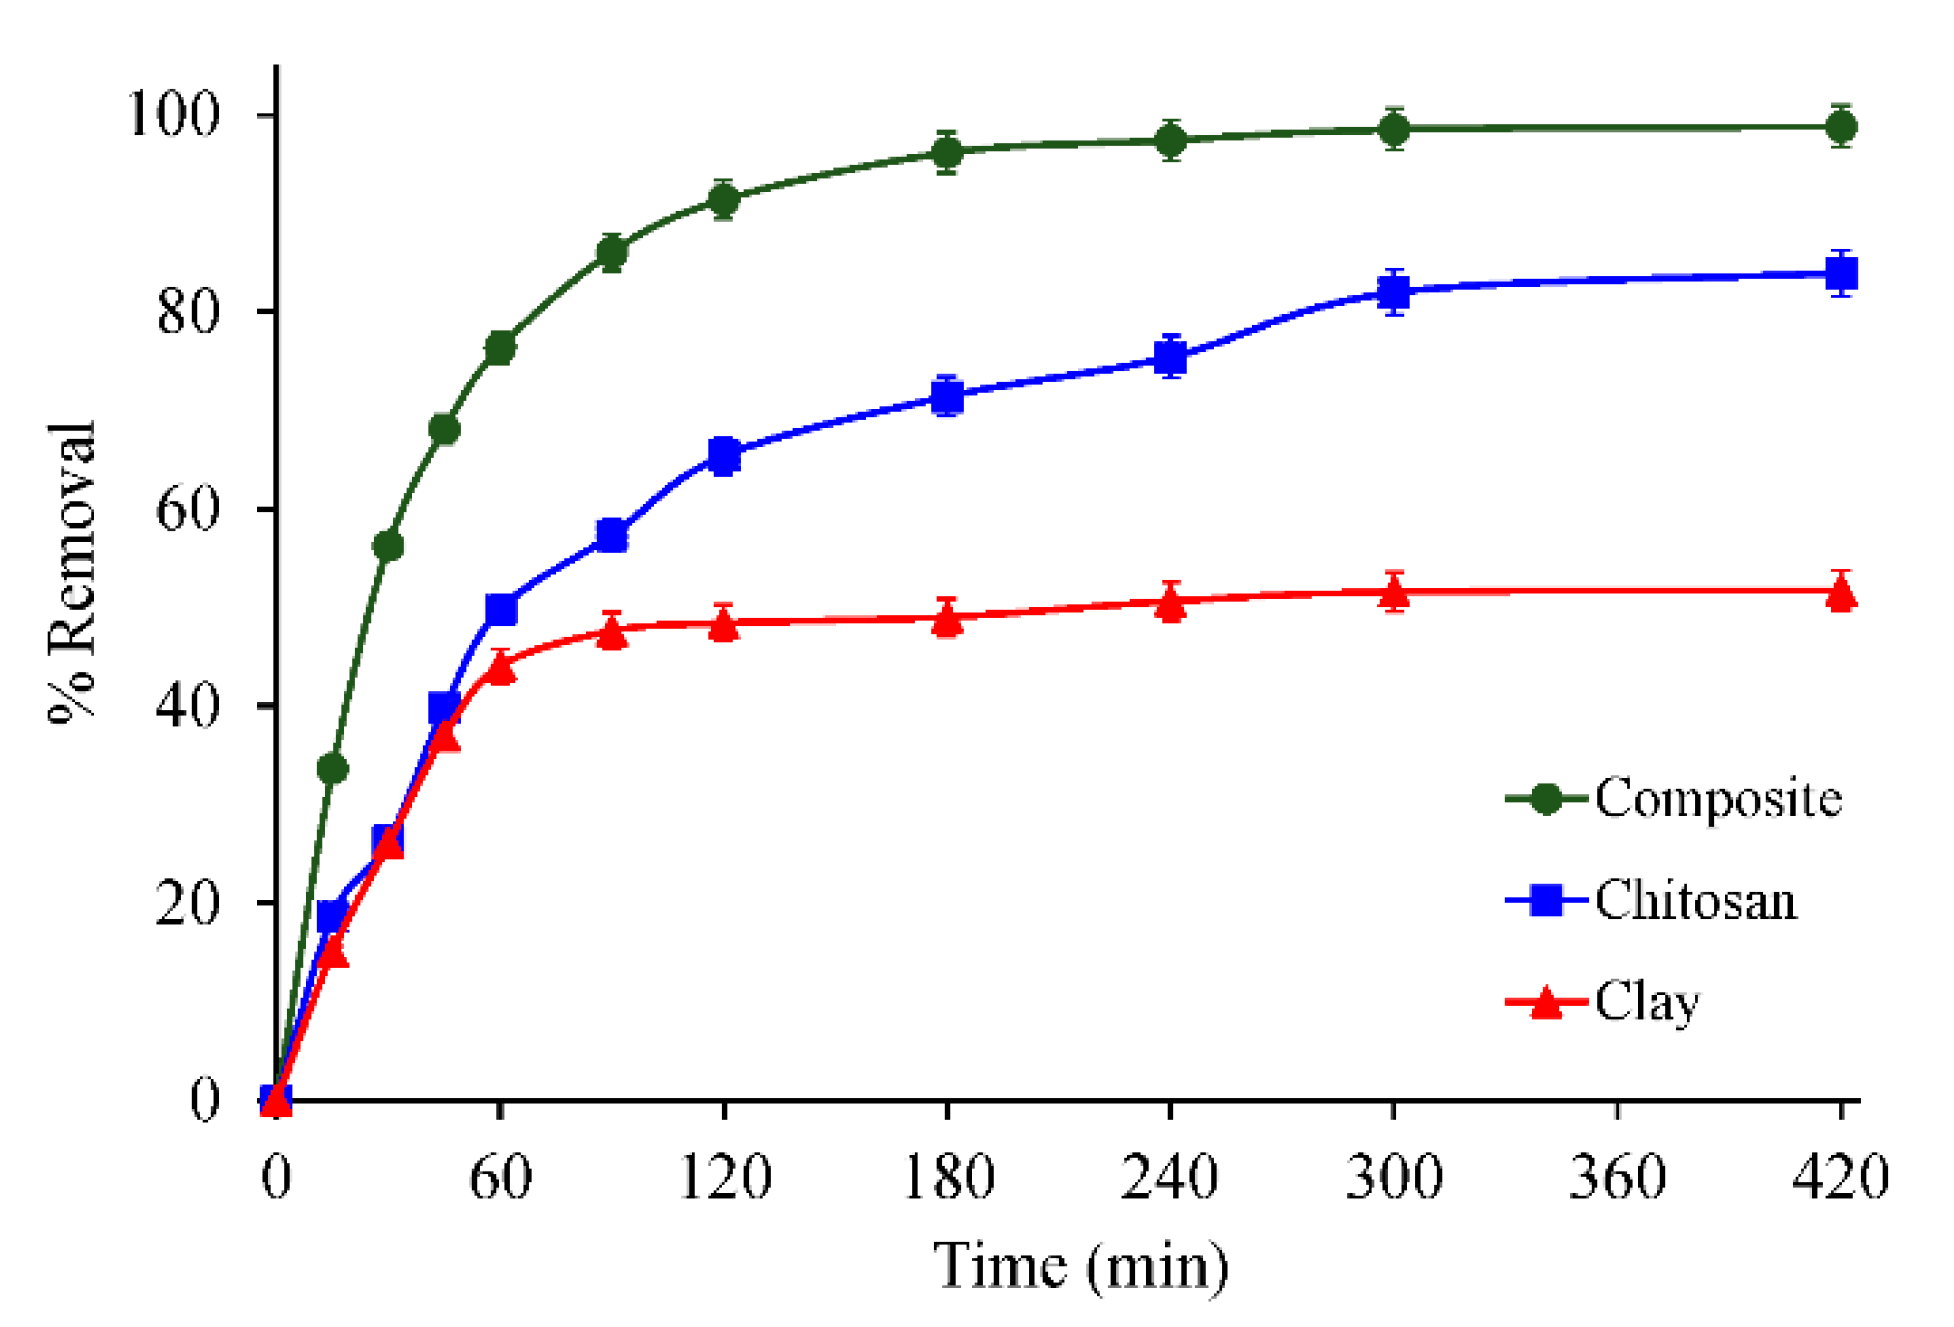
3.2.1. Types of adsorbent and contact time

The percentage of dye removal as a function of the contact time when using different types of adsorbent are shown in Figure 4. The dye removal was relatively fast in the initial 30–45 min contact time interval. Further increasing the contact time led to a decreased rate of dye removal as it gradually approached equilibrium at 240, 300, and 90 min for the MCC, chitosan, and Mt-rich clay, respectively. It can clearly be seen that the dye removal on the clay was slower and to a lower extent than on the chitosan or the MCC, respectively. From the zeta potential results at pH 5.5 (Figure 3), even though the dye and clay expressed a negative zeta potential of around −20.2 mV and −13.1 mV, respectively, the attractive force between the –SO3 groups in the dye structure and the cations in the gap gallery of the clay may overcome the repulsive force and so led to dye binding and removal from the solution.
The chitosan and MCC exhibited a positive zeta potential of about +3.2 mV and +6.0 mV, respectively, which caused the electrostatic attraction between the dye and these adsorbents. Even though the magnitude of the zeta potential of chitosan was close to that of the MCC, complete dye removal on the MCC was achieved, while only 80% dye removal was obtained on the chitosan. Since the MCC expressed more potential hydrophobic interaction sites (as mentioned above) than the chitosan or clay, this results in more hydrophobic interactions with the dye. Thus, a synergistic combination of electrostatic attraction and hydrophobic interactions results in a higher dye removal via adsorption. From this point, it can be said that the hydrophobic property of the adsorbents is one of the crucial factors in enhancing the adsorption capacity. From its superior adsorption, the MCC was chosen for further study.

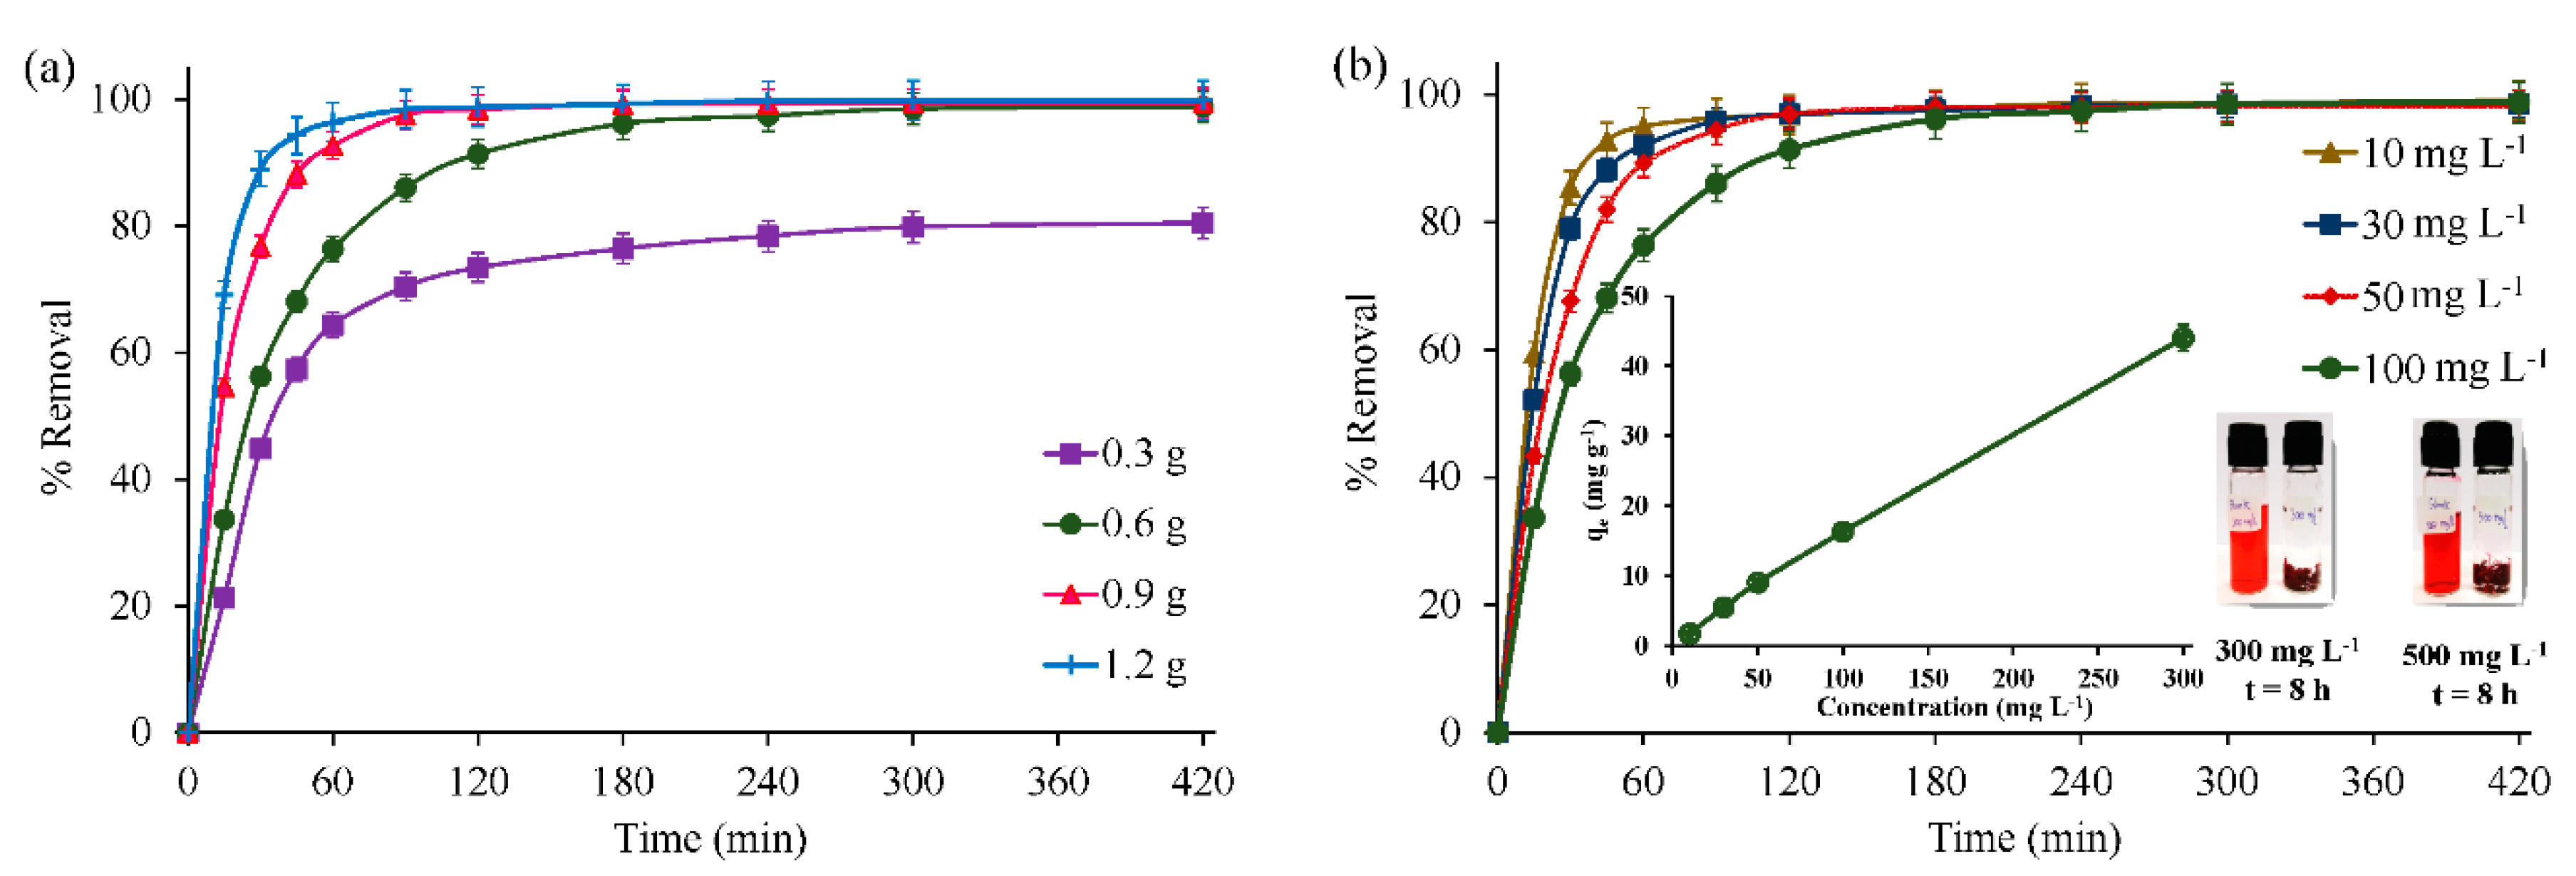
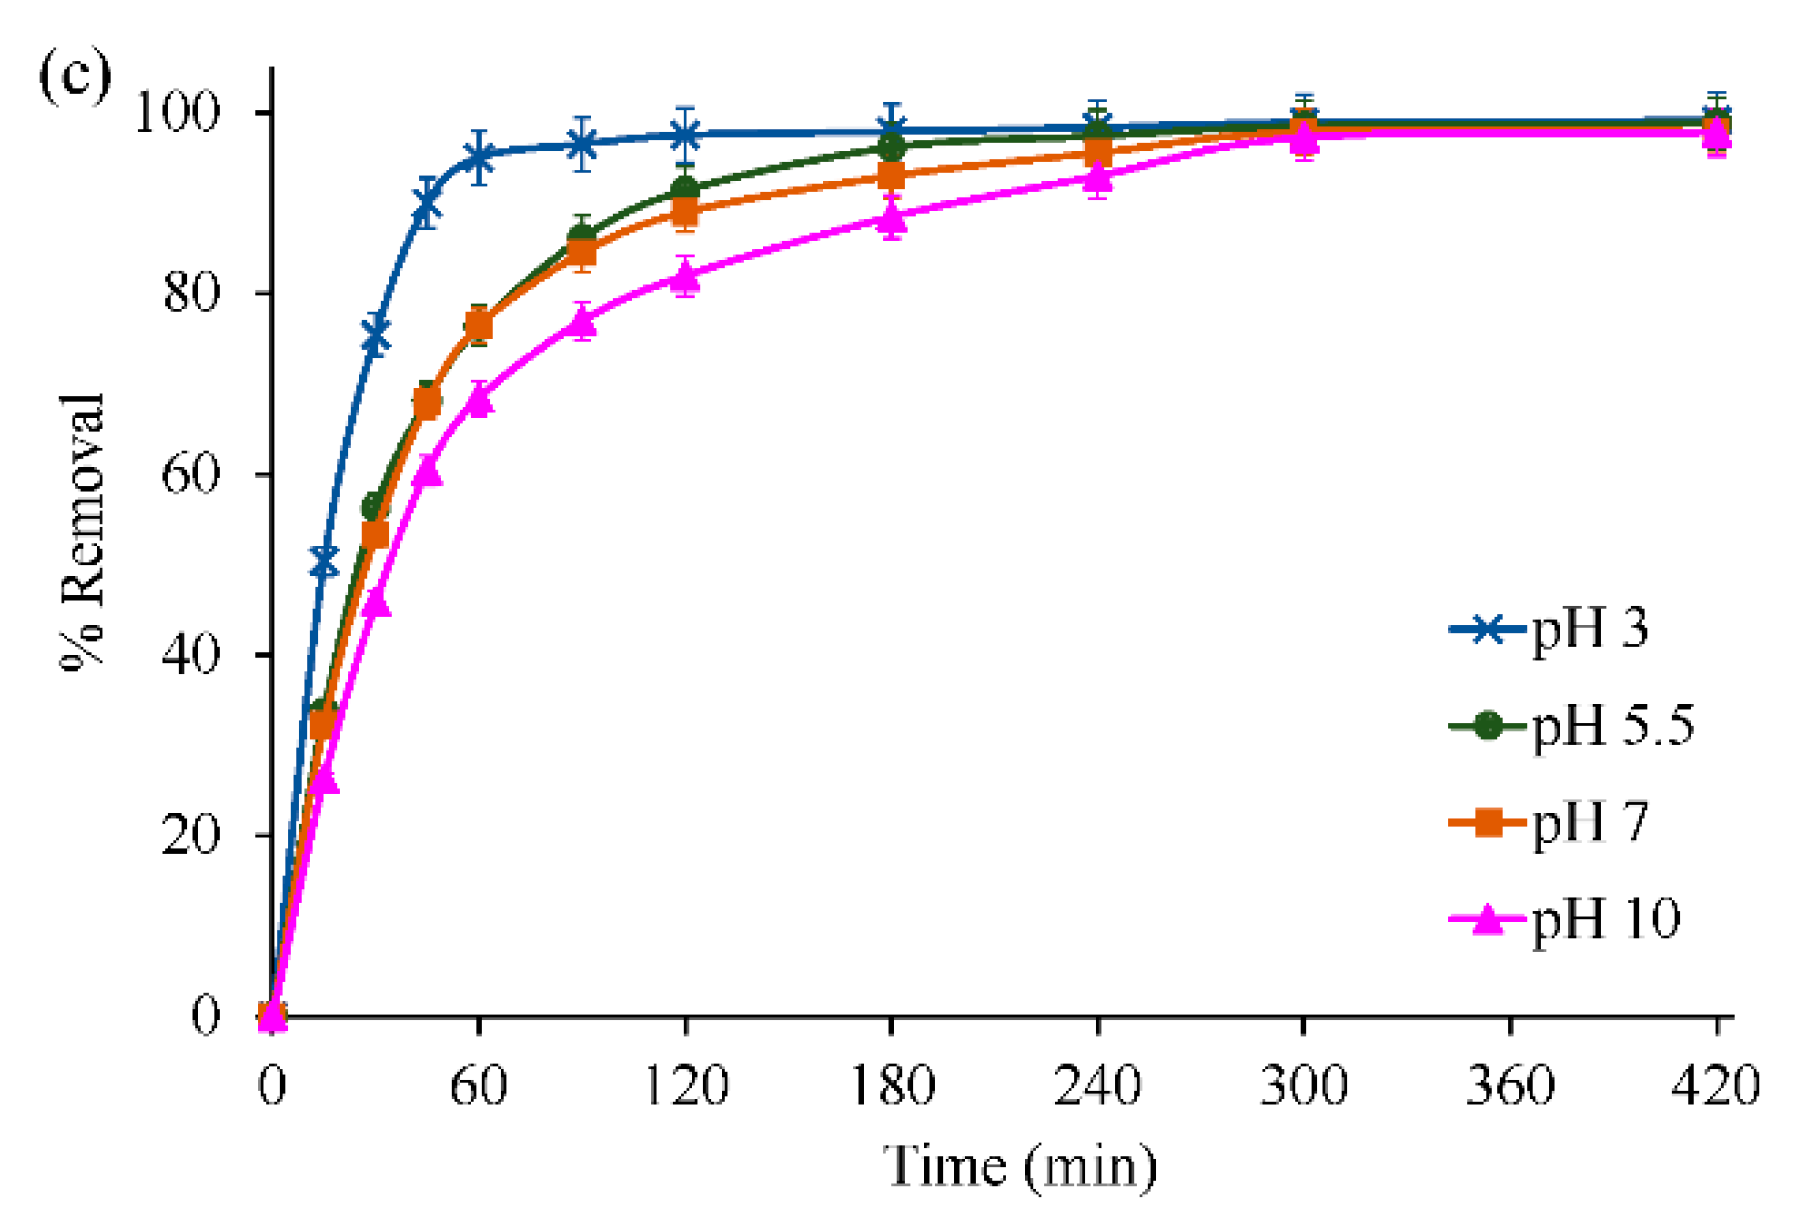
3.2.2. Optimization for Maximal Dye Removal

To achieve an optimum condition for maximal dye removal on the MCC, the influences of the MCC dosage, initial dye concentration, and initial pH were investigated in turn by univariate analysis, and the results are shown in Figure 5. Whist the effect of the temperature on the dye removal with time was shown in Figure S2.
The effect of the MCC dosage on the level of the RR120 dye removal with time is shown in Figure 5a for an initial dye concentration of 100 mg L−1 and pH 5.5. For each level of dosage, the dye removal was relatively fast in the first 60 min of contact time, and then the rate decreased gradually to approach equilibrium at a dosage level of 0.3, 0.6, 0.9, and 1.2 g, respectively. The maximum dye removal was around 80% at a dosage level of 0.3 g and a contact time of 420 min, and increasing the dosage level to 0.6–1.2 g gave 100% dye removal but decreasing contact times of 300, 120, and 90 min at 0.6, 0.9, and 1.2 g, respectively. Increasing the adsorbent dosage increased the amount of available active sites and so gave a higher removal rate. Since complete dye removal was obtained with a MCC dosage of from 0.6 g upwards, then 0.6 g was selected for further investigation.
The dye removal as a function of the contact time at different levels of initial dye concentration from 10 to 100 mg L−1 are shown in Figure 5b. Increasing the initial dye concentration leads to more contact time being required to reach equilibrium adsorption due to the limit of available active sites for dye binding. However, complete dye removal was achieved at each level of dye concentration. Further increasing the initial dye concentration to 300 mg L−1 or 500 mg L−1 required a much longer contact time (around 8 h) to completely remove the dye from the water (lower part of the right corner of Figure 5b). Normally, the full coverage of dye molecules on the active sites of the adsorbents was found when increasing the initial dye concentration. However, this was not found in this work, which infers that the adsorbents used in this work have plenty of active sites on their surface. Considering the relationship between the equilibrium adsorption capacity and initial dye concentration (middle part in Figure 5b), it showed a linear positive slope, reflecting that the capacity increased with the increasing initial dye concentration. More dye molecules transferred from the higher concentration in bulk to the lower concentration on surface of the adsorbents [26]. Consequently, more dyes occupied on the active sites of the adsorbents [27,28,29]. However, for further investigation, an initial dye concentration of 100 mg L−1 was selected.
From Figure 3, changes in the pH can change the sign of charges and their magnitude on the surface of the dyes and MCC, leading to a change in the adsorption capacity. However, it was observed from Figure 5c that the MCC achieves complete dye removal in both acidic and basic conditions but with different required contact time intervals. A shorter contact time is required at a lower pH, because the electrostatic attraction between the negative surface charges of the dye and the positive surface charges of the MCC are contributed. The amino groups (–NH2) of the MCC are protonated to (–NH3+) in the acidic solution [24], whereas they are deprotonated to the (–NH) group at a basic condition [25]. However, the net surface charge of the MCC was still positive in a basic condition, while the surface charge of the dye was negative over the entire pH range. The difference in the magnitude of the zeta potential between the dye and MCC at an acidic condition is greater, and so the dye was adsorbed on the MCC faster at a lower pH [27,30,31,32].
From these univariate analysis results above, the optimum condition for the complete dye removal was achieved when using at least 0.6 g of the MCC over a wide range of solution pH (3–10) and initial dye concentrations (10–100 mg L−1). It is of note that the MCC used in this work could adsorb the dye completely over acidic, neutral, and basic conditions, which is due to the synergistic contribution of the hydrophobic interaction and electrostatic attraction between the dye and the MCC. Table S1 shows the comparison with other relevant adsorbents.

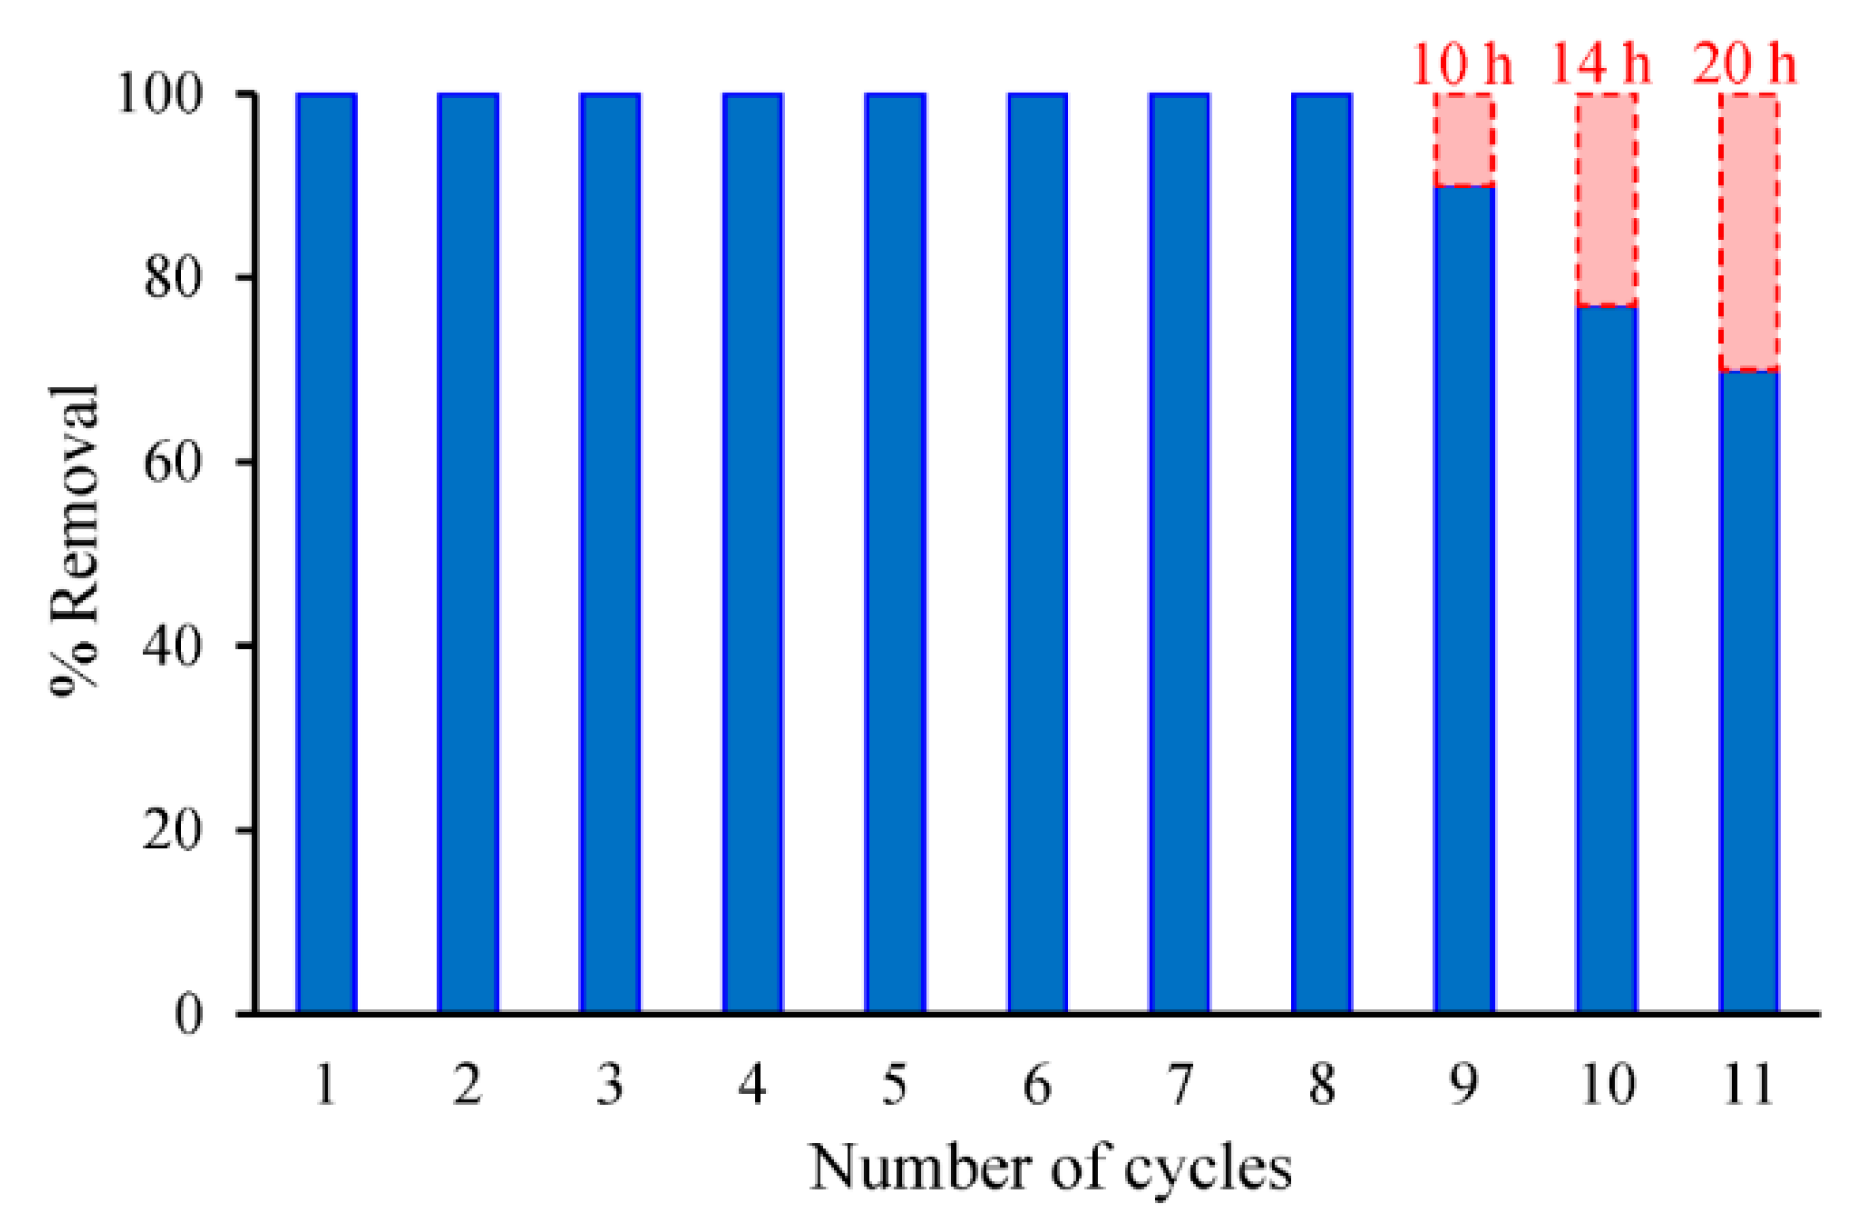
3.2.3. Reusability of the MCC

For practical application in the joss paper industry, an adsorbent would need to be reusable in order to save the cost of material and to utilize as few resources as possible. Thus, the reusability of the MCC (0.6 g) for RR120 dye removal (100 mg L−1, pH 5.5) was evaluated over 11 successive trials, each for 420 min, with the results shown in Figure 6. Complete dye removal was found up to the eighth successive adsorption cycle, where the level of dye removal obtained in 420 min decreased gradually with increasing removal cycles. However, note that complete dye removal was still obtained at 9 to 11 cycles, but just at longer times, requiring 10, 14, and 20 h for the 9th, 10th, and 11th cycle, respectively. These results confirm that the MCC is an efficient and promising adsorbent for dye removal from the water used in the joss paper process.

3.3. Thermodynamics

Three basic thermodynamic parameters, i.e., the Gibb’s free energy change (∆G°); enthalpy change (∆H°); and entropy change (∆S°), were investigated in order to understand the nature of the adsorption process on the MCC. From the thermodynamic principle, they are related as shown in Equation (2):
G° = ∆H° − T∆S°,
whereas the ∆G° is also related to the ratio of the equilibrium concentration of dye adsorbed per weight unit of adsorbent to the equilibrium concentration of dye in the solution (KC), as shown in Equation (3):
G° = −RT ln KC,
where R is the gas constant (8.314 J mol−1 K−1) and T is the absolute adsorption temperature (K).
From the graph of the natural logarithm function of KC as a function of reciprocal the absolute operating temperature (not shown here), it gave a linear trend with a coefficient of determination (R2) of 0.9977, suggesting that at least 99.77% of the variance in the dependent variable was predictable from these independent variables. The values of ∆H° and ∆S° were calculated from the slope and the intercept of the plot, respectively, and these are summarized in Table 2.
Referring to the ∆G°, the higher magnitude of ∆G° with a negative sign was obtained when increasing temperature, suggesting that the adsorption process was favored at higher temperature [26,32,33,34,35]. It also reflects to higher degree of feasibility and spontaneity. The positive sign of ∆H° indicates the heat required to the adsorption system, while the negative sign dictates the heat released to the surroundings during the adsorption process. From Table 2, the sign of ∆H° is positive, revealing that the adsorption process is endothermic in nature. When increasing the temperature, more dye molecules have more energy to move through the resistance film, leading to encouraging the capacity. For the next important thermodynamic parameter, the positive sign of ∆S° corresponds to the randomness at the interface of MCC and dye molecules during the adsorption process. It is possible to explain that the overall interaction force between them is attractive to each other, even though there is not much concurrence between them. The main material of the MCC is from earth mineral, while the dye is from synthetic. This indicates that the synergistic contribution of the hydrophobic interaction and electrostatic attraction between the dye and the MCC is one of the crucial roles to enhance the adsorption performance.

3.4. Adsorption Isotherms

The adsorption isotherms in non-linear form were evaluated by fitting the data to both of the two-parameter isotherm models (Langmuir and Freundlich) and the three-parameter isotherm model (Koble–Corrigan), as shown in Figure S3. In order to affect the bias of transforming non-linear to linear forms, non-linear regression analysis was done [36].
For the Langmuir isotherm, as shown in Equation (4), this model expressed monolayer adsorption on the homogeneous surface of the adsorbent. Each active site has the same affinities for each adsorbate molecule [16,37].
qe = q0KLCe/(1 + KLCe),
where qe is the amount of dye adsorbed per gram of MCC at equilibrium (mg g−1), q0 is the maximum monolayer adsorption capacity of the MCC (mg g−1), KL is the Langmuir constant related to the affinity of dye and the MCC (L mg−1), Ce is the equilibrium concentration of dye remaining after adsorption (mg L−1), and the separation factor (RL) is defined as RL = 1/(1 + KLCe).
For the Freundlich model shown in Equation (5), it is based on multilayer adsorption on a heterogeneous adsorbent surface with a non-uniform distribution of adsorption energy [16,37]. The stronger binding sites are occupied by the adsorbate first. A decrease in the binding strength is found during this increase in site occupation.
qe = KFCe1/n,
where KF is the Freundlich constant [(mg g−1)(L mg−1)(1/n)] related to the binding energy and 1/n is a measure of intensity of adsorption (L g−1), which indicates how favorable the adsorption process is. A value of 1/n between 0.1 and 1.0 corresponds to a favorable adsorption. All other symbols are the same as shown in the Langmuir model.
For the Koble–Corrigan isotherm shown in Equation (6), there is cooperation between the Langmuir and Freundlich isotherm models [15,38,39]. The adsorbate molecules occupy the various active sites on the heterogeneous surface of the adsorbent.
qe = (AKCCen)/(1 + BKCCen),
where AKC is the Koble–Corrigan isotherm constant (mg g−1)(L mg−1)n, BKC is the Koble–Corrigan isotherm constant (L mg−1)n, and n is the adsorption intensity. All other symbols have the same definition as the one shown in the Langmuir model.
To validate the adsorption model, the normalized standard deviation was performed. Two tools of quality (coefficient of determination, R2; and an error function, ERR (%)) were used, as shown in Equations (7) and (8) below.
R 2 = ( q t , cal q t , exp ¯ ) 2 / ( q t , exp q t , exp ¯ ) 2 ,
ERR   ( % ) = [ { [ ( q t , exp q t , cal ) / q t , exp ] 2 / ( N 1 ) } ] 0.5 × 100 ,
where qt,exp and qt,cal are the experimental adsorption capacity at time t (min) and the calculated adsorption capacity at time t from the model, q t , exp ¯ is the average experimental adsorption capacity at time t, and N is the number of experimental data.
The parameters in each isotherm, accompanied with the R2 and ERR values, are shown in Table 3. From Table 3, the RL from the Langmuir isotherm is in a range from 0 to 1, indicating that the adsorption behavior is favorable. On the other hand, the goodness of the fit to each model exhibited its value of R2 to be more than 0.97. The best fitting model should express its magnitude of R2 close to unity, describing the concurrence of the experimental data and the one calculated from the model. The magnitude of R2 from each model was ordered as Koble–Corrigan isotherm (1.000) > Langmuir isotherm (0.988) > Freundlich model (0.974), where the number in the parentheses is the value of R2 of that model. This dictated the goodness of the fit of the experimental data to the Koble–Corrigan isotherm. Moreover, another quality tool for validating a model to the experimental data is the ERR. The adequacy of the fit of the model to the experimental data should show a minimal error distribution between the experimental and calculated data. The magnitude of ERR from the Koble–Corrigan isotherm is less than that of the Langmuir isotherm by around 5.18-folder and that of the Freundlich model by about 13.31-folder. This indicated that the Koble–Corrigan isotherm model fitted very well to the experimental data with its R2 value being to unity and having a lower ERR. This revealed that the MCC likely had a heterogeneous surface with various active sites, resulting from the synergistic combination of electrostatic attractions and hydrophobic interactions. Some dye molecules were adsorbed on the active sites via electrostatic attractions, whereas some were adsorbed via hydrophobic interactions. On the surface of MCC, there is multilayer adsorption on some active sites and monolayer adsorption on some sites.

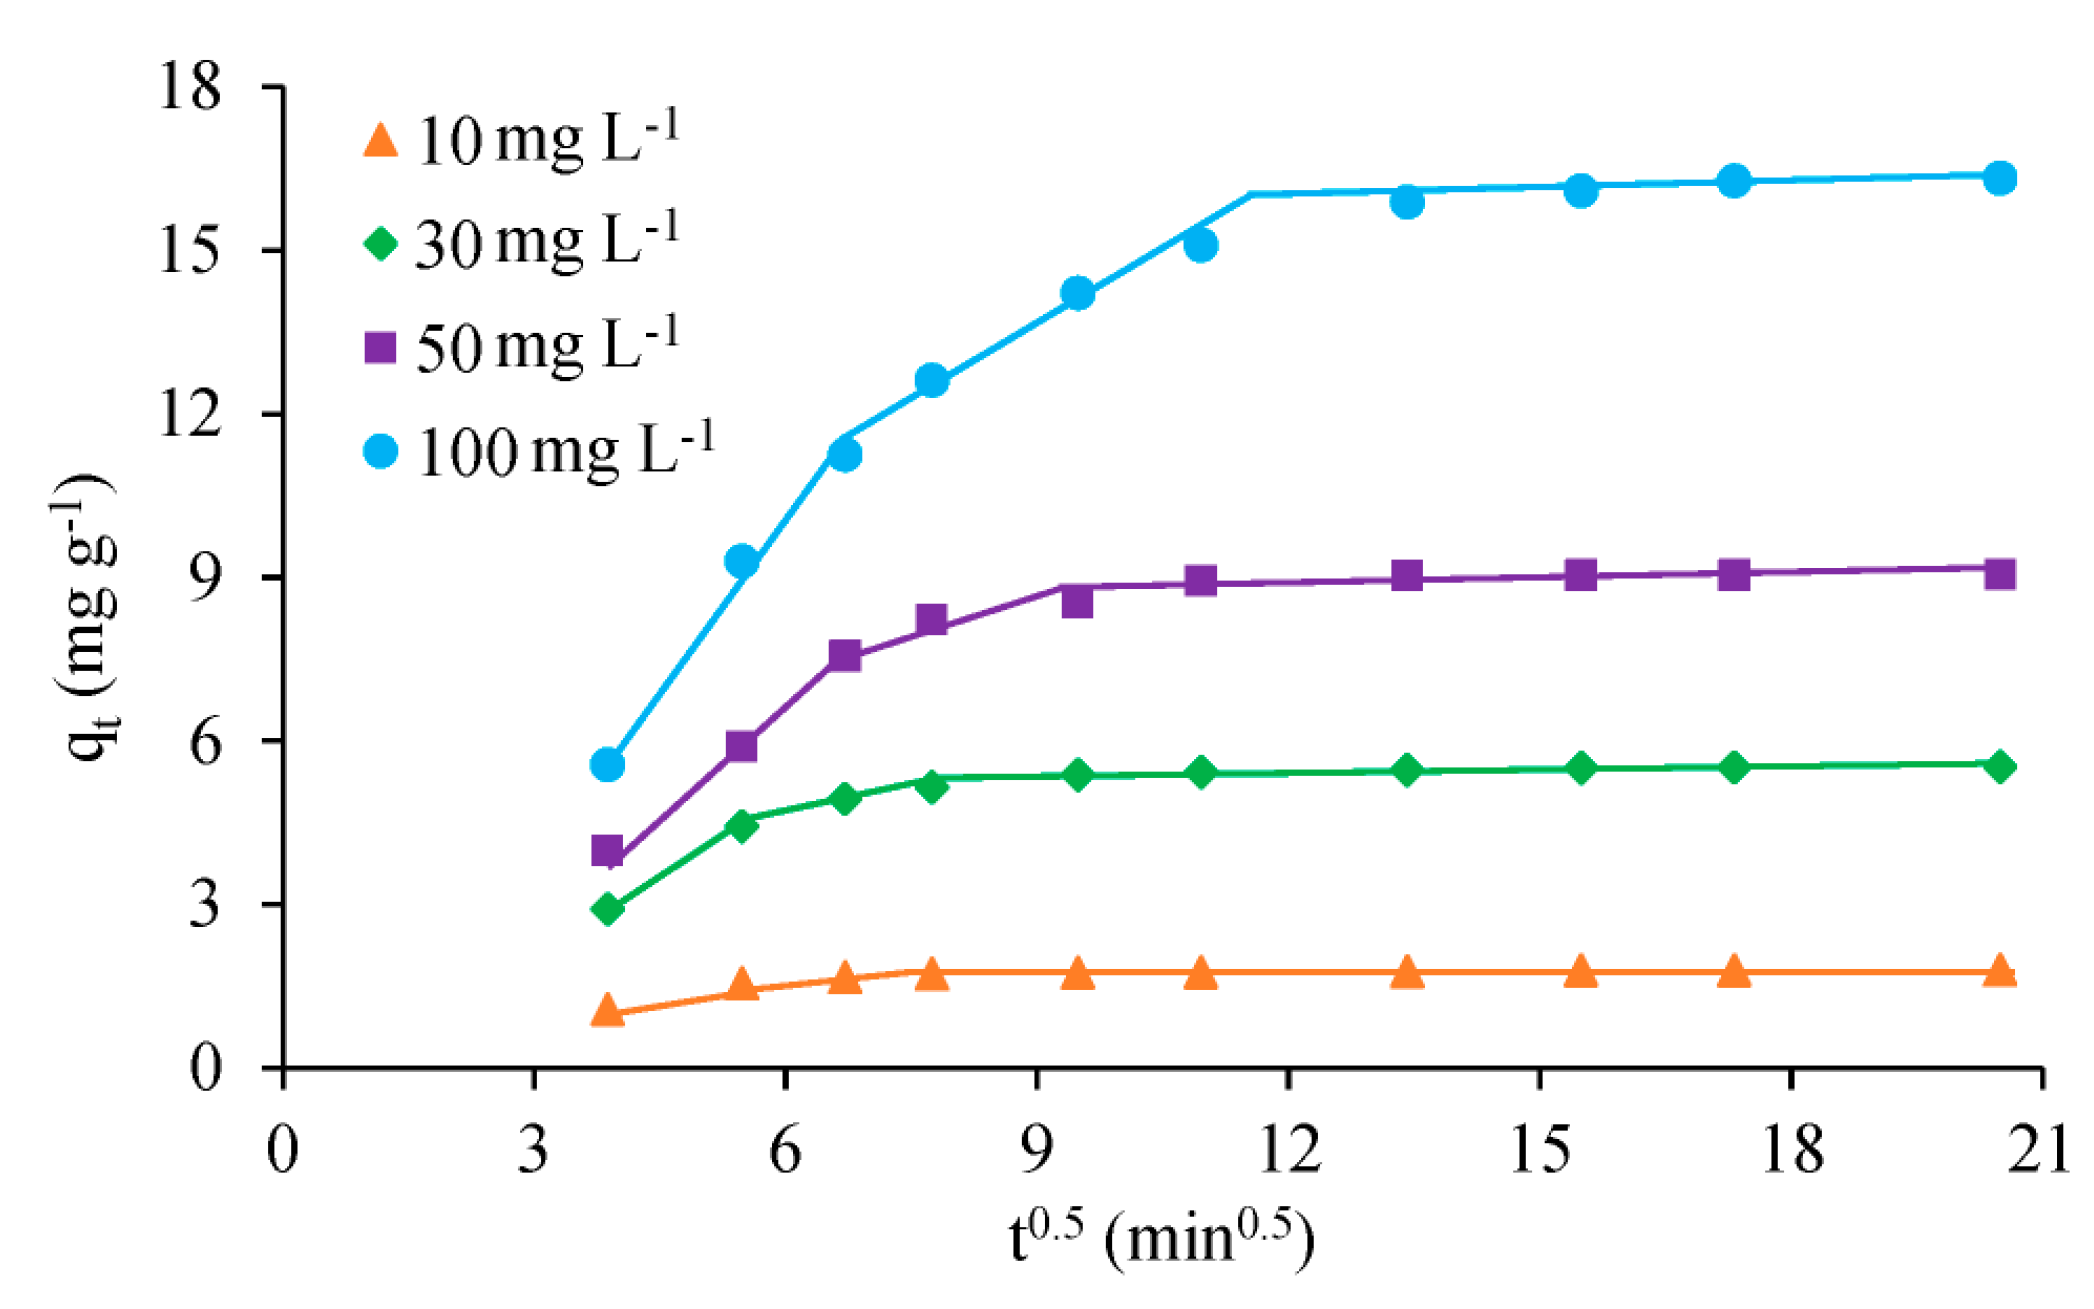
3.5. Adsorption Kinetics

To design and evaluate the adsorption system, it is necessary to estimate not only the adsorption rate but also gain an insight into the mechanism of the adsorption process. To determine the rate, two surface-reaction kinetic models were used; the pseudo-first-order and the pseudo-second-order, as shown in Equations (9) and (10), respectively:
q t = q e ( 1 e k 1 t ) ,
q t = ( q e 2 k 2 t ) / ( 1 + q e k 2 t ) ,
where qt is the experimental adsorption capacity at time t (min) and k1 and k2 are the adsorption rate constant of the pseudo-first-order (min−1) and pseudo-second-order (g mg−1 min−1), respectively. The meaning of all other symbols is the same as mentioned above.
The kinetic parameters in each model, and its validity in the form of the R2 and ERR values, are summarized in Table 4. From the R2 value, which was close to unity in both cases, both kinetic models matched the experimental data, although the pseudo-second-order model had slightly higher R2 values and the calculated equilibrium adsorption capacity (qe.cal) at different levels of initial dye concentration was closer to the experimental one, resulting in a minimal ERR. Thus, the pseudo-second-order model was more suitable to explain the kinetics of the dye adsorption on the MCC with functional groups on its surface and a gap gallery of cations.
To gain deeper insight into its mechanism, it involves the four sequential stages of the bulk diffusion, film or external diffusion, internal or intra-particle diffusion, and adsorption. One or more of these stages might be the rate-controlling step in the adsorption system.
Referring to the bulk diffusion stage, even though the dye solution was not stirred during the adsorption process, the bulk diffusion was likely to be negligible due to the high water solubility of the dye (>140 g L−1). For the film or external diffusion stage, differences in the concentration of dye between the bulk solution and the surface of the liquid film were driving forces for dye migration. The dye continued to migrate to the interior part of the pore. Finally, dyes were adsorbed on the active sites of the MCC. To interpret the experimental data from the viewpoint of this mechanism, the Weber and Morris equation [35,40,41], as expressed in Equation (11), was then used:
q t = k i t 0.5 + C ,
where ki is the rate constant at stage i (mg g−1 min0.5) and C is the film thickness. All other symbols are the same as mentioned above.
The plot of qt as a function of t0.5 (Figure 7) gave three straight lines with three different slopes. This multi-linearity did not pass through the origin. The initial linear region is attributed to the film diffusion, while the intercept corresponded to the film thickness. The second linear line describes the intra-particle diffusion stage and the final horizontal linear line describes the adsorption step. Normally, the adsorption step is assumed to be very fast, and then it is not the controlling step. From this plot, it can be said that the intra-particle diffusion plays an important role in the rate-controlling step in the process, but it is not the sole rate-determining factor due to the deviation of the curve from the origin and multi-linearity distribution with different slopes [35]. To identify the importance of film diffusion, the Boyd kinetic model, as shown in Equation (12), was then performed:
F = q t / q e = 1 ( 6 / π 2 ) exp ( B t ) ,
where F is the fraction of dye adsorbed at time t and Bt is the Boyd’s constant, which presents the mathematical function of F as shown in Equations (13) and (14):
B t = { π 0.5 [ π ( π 2 F / 3 ) ] 0.5 } 2   for   0   <   F   <   0.85 ,
B t = 0.4977 ln ( 1 F )   for   F > 0.85 .
All other symbols are the same as above. From Figure 8, it was observed that the plots were linear but did not pass through the origin, signifying that the film diffusion has a significant influence on the dye adsorption [16,32,33,34,35]. Thus, it can be said that the adsorption of dye on the MCC was controlled by both film and intra-particle diffusion [40,41].

4. Conclusions

In order to utilize the combined electrostatic attractions and hydrophobic interactions to encourage dye removal from the joss paper process water via batch adsorption, a 0.5:1 (w/w) ratio MCC was fabricated. The FT-IR analysis confirmed the MCC expressed both distinctive spectrum of chitosan and clay, while the intercalation of the chitosan into the interlayers of Mt and filling the pores of clay were evidenced by the XRD analysis and textural properties. Complete RR120 dye removal from a 100 mg L−1 solution was achieved with the MCC, but not with the chitosan or clay, which likely reflects the synergistic electrostatic attraction and hydrophobic interaction of the MCC. Increasing the MCC dosage, and so the amount of available active sites, resulted in an increased rate of dye removal, whereas increasing the dye concentration increased the time required to completely remove the dye. Complete dye removal was achieved over a wide pH range of 3–10. The MCC could be reused up to eight successive cycles of adsorption without deactivation. The adsorption process was endothermic and spontaneous, and the Koble–Corrigan model fitted very well to the RR120 adsorption on the MCC with a heterogeneous surface, while a pseudo-second-order model explained the kinetics with the rate-limiting step being both the film diffusion and intra-particle diffusion.

Supplementary Materials

The following are available online at https://www.mdpi.com/2076-3417/10/21/7493/s1, Figure S1: (a) N2 adsorption/desorption isotherms and (b) pore size distribution of the adsorbents, Figure S2: The effect of the temperature on the dye removal with time (dosage level of 0.6 g, initial dye concentration of 100 mg L−1 and pH 5.5), Figure S3: Adsorption isotherms on the MCC (dosage level of 0.6 g, pH 5.5 and adsorption temperature of 30 °C), Table S1: Comparison with other relevant adsorbents.

Author Contributions

Conceptualization and supervision, S.P.; methodology, Y.P.; formal analysis, N.T.; investigation and writing—review, W.M. All authors have read and agreed to the published version of the manuscript.

Funding

This work was financially supported by the Thailand Research Fund and HOUGHA Co., Ltd. (joss paper factory) (MSD59I0068) under the Research and Researchers for Industries (RRI), the Rachadapisek Sompote Fund for Postdoctoral Fellowship, Chulalongkorn University.

Acknowledgments

The authors acknowledge the support of the Thailand Research Fund and HOUGHA Co., Ltd. (joss paper factory) (MSD59I0068) under the Research and Researchers for Industries (RRI), the Rachadapisek Sompote Fund for Postdoctoral Fellowship, Chulalongkorn University. The authors would like to thanks Department of Chemical Technology, Department of Botany, Faculty of Science, Chulalongkorn University for equipment-support.

Conflicts of Interest

The authors declare no conflict of interest.

References

  1. Cinperi, N.C.; Ozturk, E.; Yigit, N.O.; Kilis, M. Treatment of woolen textile wastewater using membrane bioreactor, nanofiltration and reverse osmosis for reuse in production process. J. Clean. Prod. 2019, 223, 837–848. [Google Scholar] [CrossRef]
  2. Mahesh, S.; Prasad, B.; Mall, I.D.; Mishra, I.M. Electrochemical degradation of pulp and paper mill wastewater. Part 1. COD and color removal. Ind. Eng. Chem. Res. 2006, 45, 2830–2839. [Google Scholar] [CrossRef]
  3. Aksu, Z. Application of biosorption for the removal of organic pollutants: A review. Proc. Biochem. 2005, 40, 997–1026. [Google Scholar] [CrossRef]
  4. Mathur, N.; Bhatnagar, P.; Sharma, P. Review of the Mutagenicity of Textile Dye Products. Univers. J. Environ. Res. Technol. 2012, 2, 1–18. [Google Scholar]
  5. Salgot, M.; Folch, M.; Unit, S.S. Wastewater treatment and water reuse. Curr. Opin. Environ. Sci. Health 2018, 2, 64–74. [Google Scholar] [CrossRef]
  6. Irfan, M.; Butt, T.; Imtiaz, N.; Abbas, N.; Khan, R.A.; Shafique, A. The removal of COD, TSS and colour of black liquor by coagulation–flocculation process at optimized pH, settling and dosing rate. Arab. J. Chem. 2017, 10, S2307–S2318. [Google Scholar] [CrossRef] [Green Version]
  7. Zahrim, A.Y.; Hilal, N. Treatment of highly concentrated dye solution by coagulation/flocculation–sand filtration and nanofiltration. Water Resour. Ind. 2013, 3, 23–34. [Google Scholar] [CrossRef] [Green Version]
  8. de Souza Sartori, J.A.; Angolini, C.F.; Eberlin, M.N.; Aguiar, C.L. Criegee mechanism as a safe pathway of color reduction in sugarcane juice by ozonation. Food Chem. 2017, 225, 181–187. [Google Scholar] [CrossRef]
  9. Zuorro, A.; Lavecchia, R. Evaluation of UV/H2O2 advanced oxidation process (AOP) for the degradation of diazo dye Reactive Green 19 in aqueous solution. Desalin. Water Treat. 2014, 52, 1571–1577. [Google Scholar] [CrossRef]
  10. Khataee, A.R.; Kasiri, M.B. Photocatalytic degradation of organic dyes in the presence of nanostructured titanium dioxide: Influence of the chemical structure of dyes. J. Mol. Catal. A Chem. 2010, 328, 8–26. [Google Scholar] [CrossRef]
  11. Lade, H.; Kadam, A.; Paul, D.; Govindwar, S. Biodegradation and detoxification of textile azo dyes by bacterial consortium under sequential microaerophilic/aerobic processes. EXCLI J. 2015, 14, 158–174. [Google Scholar] [PubMed]
  12. Lian, L.; Guo, L.; Guo, C. Adsorption of Congo red from aqueous solutions onto Ca-bentonite. J. Hazard. Mater. 2009, 161, 126–131. [Google Scholar] [CrossRef] [PubMed]
  13. Rezk, R.A.; Galmed, A.H.; Abdelkreem, M.; Abdel Ghany, N.A.; Harith, M.A. Detachment of Cu (II) and Co (II) ions from synthetic wastewater via adsorption on Lates niloticus fish bones using LIBS and XRF. J. Adv. Res. 2018, 14, 1–9. [Google Scholar] [CrossRef] [PubMed]
  14. Dotto, G.L.; Rodrigues, F.K.; Tanabe, E.H.; Fröhlich, R.; Bertuol, D.A.; Martins, T.R.; Foletto, E.L. Development of chitosan/bentonite hybrid composite to remove hazardous anionic and cationic dyes from colored effluents. J. Environ. Chem. Eng. 2016, 4, 3230–3239. [Google Scholar] [CrossRef]
  15. Naowanat, N.; Thouchprasitchai, N.; Pongstabodee, S. Adsorption of emulsified oil from metalworking fluid on activated bleaching earth-chitosan-SDS composites: Optimization, kinetics, isotherms. J. Environ. Manag. 2016, 169, 103–115. [Google Scholar] [CrossRef]
  16. Zhang, F.; Chen, X.; Wu, F.; Ji, Y. High adsorption capability and selectivity of ZnO nanoparticles for dye removal. Colloids Surfaces A Physicochem. Eng. Asp. 2016, 509, 474–483. [Google Scholar] [CrossRef]
  17. Ainurofiq, A.; Nurcahyo, I.; Yulianto, R. Preparation, characterization and formulation of nanocomposite matrix Na-montmorillonite intercalated medium molecular weight chitosan for theophylline sustained release tablet. Int. J. Pharm. Pharm. Sci. 2014, 6, 131–137. [Google Scholar]
  18. Günister, E.; Pestreli, D.; Ünlü, C.H.; Atıcı, O.; Güngör, N. Synthesis and characterization of chitosan-MMT biocomposite systems. Carbohydr. Polym. 2007, 67, 358–365. [Google Scholar] [CrossRef]
  19. Temuujin, J.; Jadambaa, T.; Burmaa, G.; Erdenechimeg, S.; Amarsanaa, J.; MacKenzie, K.J.D. Characterization of acid activated montmorillonite clay from Tuulant (Mongolia). Ceram. Int. 2004, 30, 251–255. [Google Scholar] [CrossRef]
  20. Wang, S.F.; Shen, L.; Tong, Y.J.; Chen, L.; Phang, I.Y.; Lim, P.Q.; Liu, T.X. Biopolymer chitosan/montmorillonite nanocomposites: Preparation and characterization. Polym. Degrad. Stab. 2005, 90, 123–131. [Google Scholar] [CrossRef]
  21. Sokker, H.H.; El-Sawy, N.M.; Hassan, M.A.; El-Anadouli, B.E. Adsorption of crude oil from aqueous solution by hydrogel of chitosan based polyacrylamide prepared by radiation induced graft polymerization. J. Hazard. Mater. 2011, 190, 359–365. [Google Scholar] [CrossRef] [PubMed]
  22. Darder, M.; Colilla, M.; Ruiz-Hitzky, E. Chitosan-clay nanocomposites: Application as electrochemical sensors. Appl. Clay Sci. 2005, 28, 199–208. [Google Scholar] [CrossRef]
  23. Babel, S. Low-cost adsorbents for heavy metals uptake from contaminated water: A review. J. Hazard. Mater. 2003, 97, 219–243. [Google Scholar] [CrossRef]
  24. Ahmad, A.L.; Sumathi, S.; Hameed, B.H. Residual oil and suspended solid removal using natural adsorbents chitosan, bentonite and activated carbon: A comparative study. Chem. Eng. J. 2005, 108, 179–185. [Google Scholar] [CrossRef]
  25. Zhang, X.; Bai, R. Mechanisms and kinetics of humic acid adsorption onto chitosan-coated granules. J. Colloid Interface Sci. 2003, 264, 30–38. [Google Scholar] [CrossRef]
  26. Shavandi, M.A.; Haddadian, Z.; Ismail, M.H.S.; Abdullah, N.; Abidin, Z.Z. Removal of residual oils from palm oil mill effluent by adsorption on natural zeolite. Water Air Soil Pollut. 2012, 223, 4017–4027. [Google Scholar] [CrossRef]
  27. Hadizade, G.; Binaeian, E.; Emami, M.R.S. Preparation and characterization of hexagonal mesoporous silica/polyacrylamide nanocomposite capsule (PAM-HMS) for dye removal from aqueous solutioxns. J. Mol. Liq. 2017, 238, 499–507. [Google Scholar] [CrossRef]
  28. Samarghandi, M.R.; Al-Musawi, T.J.; Mohseni-Bandpi, A.; Zarrabi, M. Adsorption of cephalexin from aqueous solution using natural zeolite and zeolite coated with manganese oxide nanoparticles. J. Mol. Liq. 2015, 211, 431–441. [Google Scholar] [CrossRef]
  29. Kumar, P.S.; Ramalingam, S.; Senthamarai, C.; Niranjanaa, M.; Vijayalakshmi, P.; Sivanesan, S. Adsorption of dye from aqueous solution by cashew nut shell: Studies on equilibrium isotherm, kinetics and thermodynamics of interactions. Desalination 2010, 261, 52–60. [Google Scholar] [CrossRef]
  30. Qin, Q.; Ma, J.; Liu, K. Adsorption of anionic dyes on ammonium-functionalized MCM-41. J. Hazard. Mater. 2009, 162, 133–139. [Google Scholar] [CrossRef]
  31. Tunc, O.; Tanaci, H.; Aksu, Z. Potential use of cotton plant wastes for the removal of Remazol Black B reactive dye. J. Hazard. Mater. 2009, 163, 187–198. [Google Scholar] [CrossRef] [PubMed]
  32. Fujiwara, K.; Ramesh, A.; Maki, T.; Hasegawa, H.; Ueda, K. Adsorption of platinum (IV), palladium (II) and gold (III) from aqueous solutions onto L-lysine modified crosslinked chitosan resin. J. Hazard. Mater. 2007, 146, 39–50. [Google Scholar] [CrossRef] [PubMed]
  33. Debnath, S.; Ballav, N.; Maity, A.; Pillay, K. Competitive adsorption of ternary dye mixture using pine cone powder modified with β-cyclodextrin. J. Mol. Liq. 2017, 225, 679–688. [Google Scholar] [CrossRef]
  34. Jia, Z.; Li, Z.; Ni, T.; Li, S. Adsorption of low-cost absorption materials based on biomass (Cortaderia selloana flower spikes) for dye removal: Kinetics, isotherms and thermodynamic studies. J. Mol. Liq. 2017, 229, 285–292. [Google Scholar] [CrossRef]
  35. Kiruba, U.P.; Kumar, P.S.; Prabhakaran, C.; Aditya, V. Characteristics of thermodynamic, isotherm, kinetic, mechanism and design equations for the analysis of adsorption in Cd(II) ions-surface modified Eucalyptus seeds system. J. Taiwan Inst. Chem. Eng. 2014, 45, 2957–2968. [Google Scholar] [CrossRef]
  36. Kumar, K.V. Optimum sorption isotherm by linear and non-linear methods for malachite green onto lemon peel. Dyes Pigm. 2007, 74, 595–597. [Google Scholar] [CrossRef]
  37. Li, D.-P.; Zhang, Y.-R.; Zhao, X.-X.; Zhao, B.-X. Magnetic nanoparticles coated by aminoguanidine for selective adsorption of acid dyes from aqueous solution. Chem. Eng. J. 2013, 232, 425–433. [Google Scholar] [CrossRef]
  38. Hamidpour, M.; Kalbasi, M.; Afyuni, M.; Shariatmadari, H.; Furrer, G. Sorption of lead on Iranian bentonite and zeolite: Kinetics and isotherms. Environ. Earth Sci. 2010, 62, 559–568. [Google Scholar] [CrossRef]
  39. Koble, R.A.; Corrigan, T.E. Adsorption isotherms for pure hydrocarbons. Ind. Eng. Chem. 1952, 44, 383–387. [Google Scholar] [CrossRef]
  40. Olu-Owolabi, B.I.; Diagboya, P.N.; Adebowale, K.O. Evaluation of pyrene sorption-desorption on tropical soils. J. Environ. Manag. 2014, 137, 1–9. [Google Scholar] [CrossRef] [Green Version]
  41. Doğan, M.; Özdemir, Y.; Alkan, M. Adsorption kinetics and mechanism of cationic methyl violet and methylene blue dyes onto sepiolite. Dyes Pigment. 2007, 75, 701–713. [Google Scholar] [CrossRef]
Figure 1. Representative Fourier transform-infrared spectrometry (FT-IR) spectrum of (a) chitosan, (b) montmorillonite chitosan composite (MCC) and (c) montmorillonite (Mt)-rich clay.
Applsci 10 07493 g001
Figure 2. Representative XRD pattern of the (a) Mt-rich clay and (b) MCC.
Applsci 10 07493 g002
Figure 3. Zeta potential versus pH condition.
Applsci 10 07493 g003
Figure 4. Dye removal as a function of the contact time on different types of adsorbent (0.6 g adsorbent dosage, pH 5.5, 100 mg L−1 initial RR120 concentration at room temperature).
Applsci 10 07493 g004
Figure 5. Effects of the (a) MCC dosage, (b) initial dye concentration, and (c) pH of solution on the RR120 dye removal over the MCC.
Applsci 10 07493 g005aApplsci 10 07493 g005b
Figure 6. Reusability of the MCC.
Applsci 10 07493 g006
Figure 7. Intra-particle diffusion model plots for the RR120 adsorption on the MCC.
Applsci 10 07493 g007
Figure 8. Boyd’s kinetic parameters for the adsorption of RR120 on the MCC.
Applsci 10 07493 g008
Table 1. Characterization of the adsorbents.
AdsorbentsTextural PropertiesContact Angle (°)d-Spacing 1
(Å)
BET Surface Area (m2 g−1)Pore Volume (cm3 g−1)Pore Diameter (Å)
Mt-rich clay98.840.136347.9815.314.15
Chitosan1.220.000219.4376.7
MCC4.610.007560.1485.014.38
1 Calculated from (001) crystalline plane of montmorillonite.
Table 2. Thermodynamic parameters for the adsorption of RR120 on the MCC.
H°S°G° (kJ mol−1)
(kJ mol−1)(kJ mol−1 K−1)30 °C40 °C50 °C60 °C
8.24710.0301−0.87−1.19−1.45−1.79
Table 3. The isotherm parameters for the adsorption of RR120 on the MCC.
Isotherm ModelParameters
Langmuir q 0 (mg g−1)20.20
RL0.071
KL (L mg−1)1.05
R20.988
ERR (%)6.11
Freundlich1/n0.651
KF [(mg g−1)(L mg−1)(1/n)]9.84
R20.974
ERR (%)15.70
Koble-Corrigann0.992
KKC (L mg−1)1.21
R21.000
ERR (%)1.18
Table 4. Kinetic parameter for the adsorption of RR120 on the MCC.
Kinetic ModelParametersConcentration of RR120 Solution (mg L−1)
103050100
Pseudo-first-orderk1 (min−1)0.05360.0460.0410.025
q e , cal (mg g−1)1.595.099.3615.71
q e , exp (mg g−1)1.795.529.0516.32
R20.9830.9880.9950.994
ERR (%)11.737.793.473.79
Pseudo-second-orderk2 (g mg−1 min−1)0.1160.0220.0120.003
q e , cal (mg g−1)1.835.759.2816.69
q e , exp (mg g−1)1.795.529.0516.32
R20.9990.9980.9990.997
ERR (%)1.784.182.542.25
Publisher’s Note: MDPI stays neutral with regard to jurisdictional claims in published maps and institutional affiliations.

