Article

Using Elastographic Ultrasound to Assess Plantar Tissue Stiffness after Walking at Different Speeds and Durations

1
Rehabilitation Engineering Lab, Department of Kinesiology and Community Health, University of Illinois at Urbana-Champaign, Champaign, IL 61820, USA
2
Department of Creative Product Design, Asia University, Taichung 41354, Taiwan
3
Department of Biomedical Engineering, Hungkuang University, Taichung 43302, Taiwan
*
Author to whom correspondence should be addressed.
Appl. Sci. 2020, 10(21), 7498; https://doi.org/10.3390/app10217498
Submission received: 26 September 2020 / Revised: 17 October 2020 / Accepted: 22 October 2020 / Published: 25 October 2020

Abstract

:
Exercise has been demonstrated to improve health in people with diabetes. However, exercise may increase risk for foot ulcers because of increased plantar pressure during most weight-bearing physical activities. To date, there is no study investigating the effect of various walking speeds and durations (i.e., the most common form of exercise in daily living) on the plantar foot. The objective of this study was to investigate the effect of various walking intensities on plantar tissue stiffness. A 3 × 2 factorial design, including three walking speeds (1.8, 3.6 and 5.4 mph) and two durations (10 and 20 min), was tested in 12 healthy participants. B-mode and elastographic ultrasound images were measured from the first metatarsal head to quantify plantar tissue stiffness after walking. Two-way ANOVA was used to examine the results. Our results showed that the walking speed factor caused a significant main effect of planar stiffness of the superficial layers (p = 0.007 and 0.003, respectively). However, the walking duration factor did not significantly affect the plantar stiffness. There was no interaction between the speed and duration factors on plantar tissue stiffness. Regarding the walking speed effect, there was a significant difference in the plantar stiffness between 1.8 and 3.6 mph (56.8 ± 0.8% vs. 53.6 ± 0.9%, p = 0.017) under 20 min walking duration. This finding is significant because moderate-to-fast walking speed (3.6 mph) can decrease plantar stiffness compared to slow walking speed (1.8 mph). This study suggests people at risk for foot ulcers walk at a preferred or fast speed (3.6 mph) rather than walk slowly (1.8 mph).

1. Introduction

Diabetic foot ulcers (DFUs) are the most recognized complication in people with diabetes mellitus (DM). The global prevalence of DFUs was 6.3% in 2016 [1]. DFUs are correlated with an increased risk of death. Five percent of people with newly developed DFUs died within 12 months, and 42.2% of people with newly developed DFUs died within five years [2]. Prevention of DFUs is imperative in people with DM.
The American Diabetes Association (ADA) recommends that people with DM with or without peripheral neuropathy should perform moderate-intensity aerobic exercise at least 150 min/week or vigorous aerobic exercise at least 75 min/week [3]. Exercise has been demonstrated to improve glycemic control [4], maintain body weight [5] and reduce the risk of cardiovascular disease [6]. However, exercise may also increase the risk for DFUs in people with DM because of increased plantar pressure during most weight-bearing exercises [7,8,9,10]. Increased plantar pressure during weight-bearing activities has been demonstrated to be a major risk factor of DFUs [11,12,13].
People with a history of DFUs have been shown to have stiffer plantar tissue [14,15,16]. An increase in plantar stiffness is due to the effect of high blood glucose on increasing intermolecular cross-linking of structural proteins [17]. The stiffer plantar tissue may reduce the attenuating capacity of plantar tissues in response to mechanical stresses during weight-bearing activities, such as brisk walking and jogging, thus increasing risk for DFUs. In the literature, there are only a few studies investigating the effect of exercise intensities on the mechanical property of the plantar foot. Gefen et al. demonstrated that the stiffer plantar pad may increase forefoot stress by 38% and 50% at the first and second metatarsal heads, respectively [18]. Jan et al. showed that people with DM had significantly greater effective Young’s modulus and initial modulus of quasi-linear viscoelasticity compared to people without DM. They also demonstrated that the plantar pressure gradient and mechanical properties were significantly correlated [16]. Williams et al. used magnetic resonance imaging (MRI) to study plantar tissue mechanical property and demonstrated that plantar stiffness in people with DM was 2.00–3.43 times compared to people without DM [19]. However, there is no study investigating the effect of various intensities of exercise (e.g., walking at different speeds and durations (i.e., the most common form of exercise in daily living)) on the changes of mechanical property of the plantar foot in people without and with DM.
To the best of our knowledge, this is the first study investigating the effect of different walking intensities on the mechanical property of the plantar foot. The results from this study can provide a foundation to understand the effect of different weight-bearing exercises on the changes of mechanical property of plantar tissue in people at risk for foot ulcers.

2. Methods

A 3 × 2 factorial design, including three walking speeds (1.8 mph, 3.6 mph and 5.4 mph) and two durations (10 and 20 min), was used in this study [9,20]. A total of 6 walking protocols was tested in this study. The participant received the 1.8 mph protocol in the first week, the 3.6 mph protocol in the second week and the 5.4 mph protocol in the third week. The order of duration (10 and 20 min) was randomly assigned. Each protocol was separated by 7 ± 2 days.
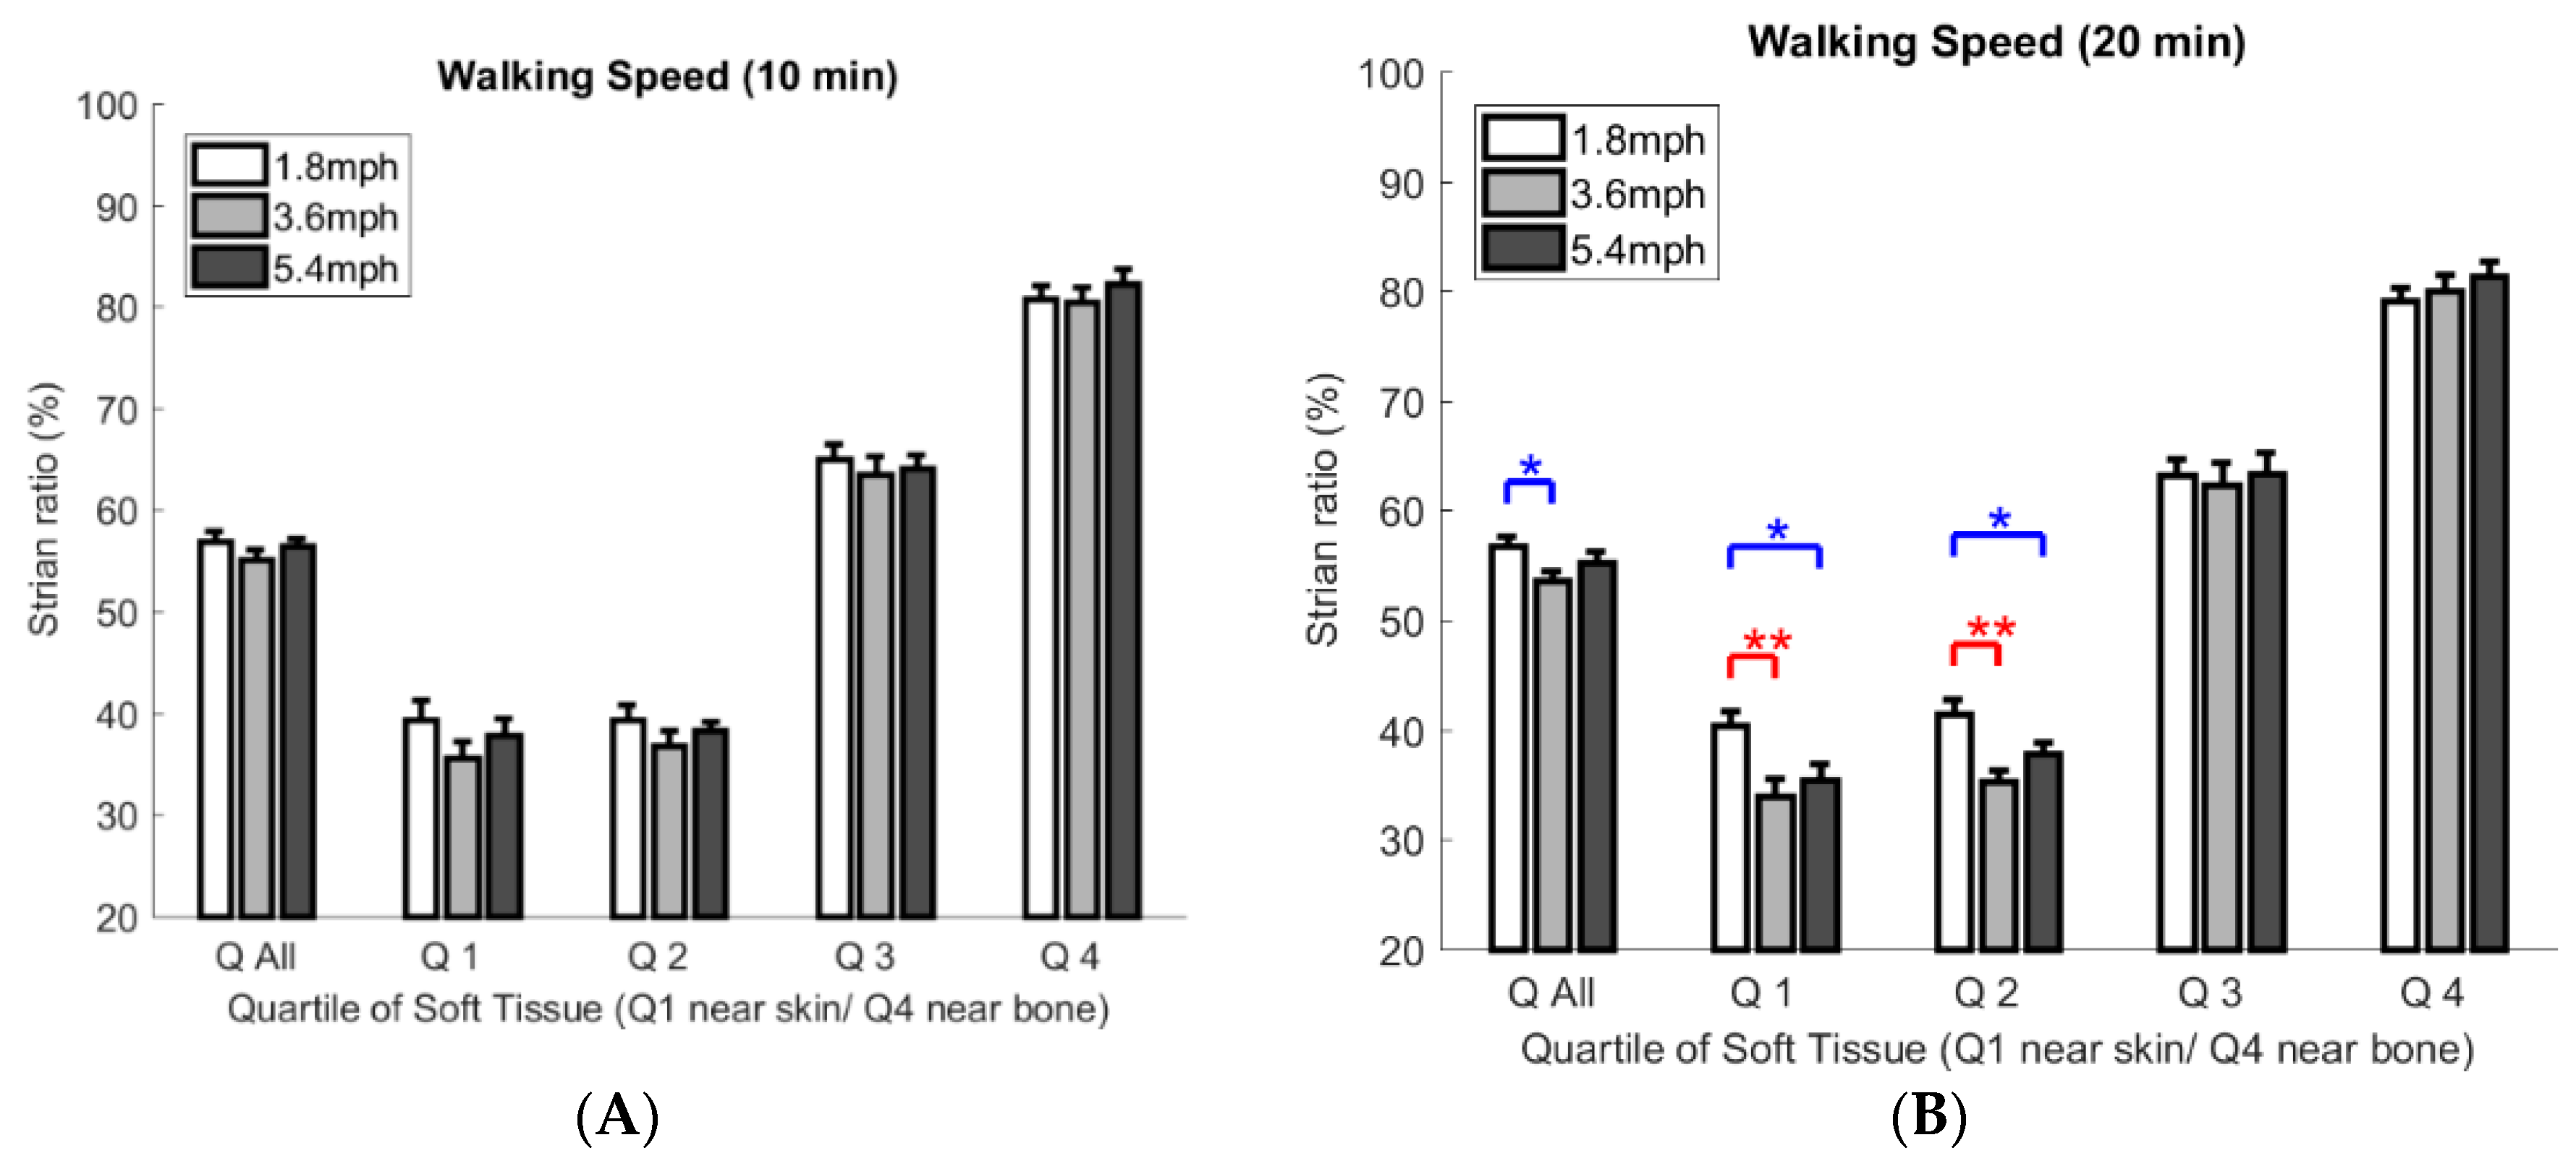
  • First walking protocol: walking at 1.8 mph for 10 and 20 min (slow walking speed);
  • Second walking protocol: walking at 3.6 mph for 10 and 20 min (moderate to fast walking speed);
  • Third walking protocol: walking at 5.4 mph for 10 and 20 min (jogging speed).

2.1. Subjects

Healthy participants between 18 and 40 years of age were recruited from students at the University of Illinois at Urbana-Champaign. The exclusion criteria included active foot ulcers, diabetes, vascular diseases, hypertension and inability to walk 20 min independently or walk at the speed of 5.4 mph independently. Each participant signed the informed consent approved by the University of Illinois at Urbana-Champaign Institutional Review Board before the screening and experimental procedures. All examinations were performed in the Rehabilitation Engineering Lab at the University of Illinois at Urbana-Champaign. The room temperature was maintained at 24 ± 2 °C.

2.2. Experimental Procedures

The research participant took off the socks and shoes and lay in the supine position for 30 min before the walking protocol to avoid the influence of previous weight-bearing activity (e.g., walking to the lab) on the plantar tissue mechanical property. Each participant’s first metatarsal head was measured using an ultrasound device in the supine position before the walking protocol. In order to capture the plantar soft tissue covering the first metatarsal head, 5 ultrasound scans were measured (Figure 1A). Then, the participant wore his/her running shoes and walked on a treadmill at a speed of 1.8 mph for either 10 or 20 min at the first visit. After a walking protocol, the participant lay down again for another 5 ultrasound measurements. All ultrasound measurements were performed by the same person. A crossover design was used to randomly assign the order of duration of walking (10 and 20 min) to the participant. The washout period was 20 min to minimize the carryover effects between two durations of walking. The participant returned to the lab for performing 3.6 mph walking for 10 and 20 min in the second visit and 5.4 mph walking for 10 and 20 min in the third visit.

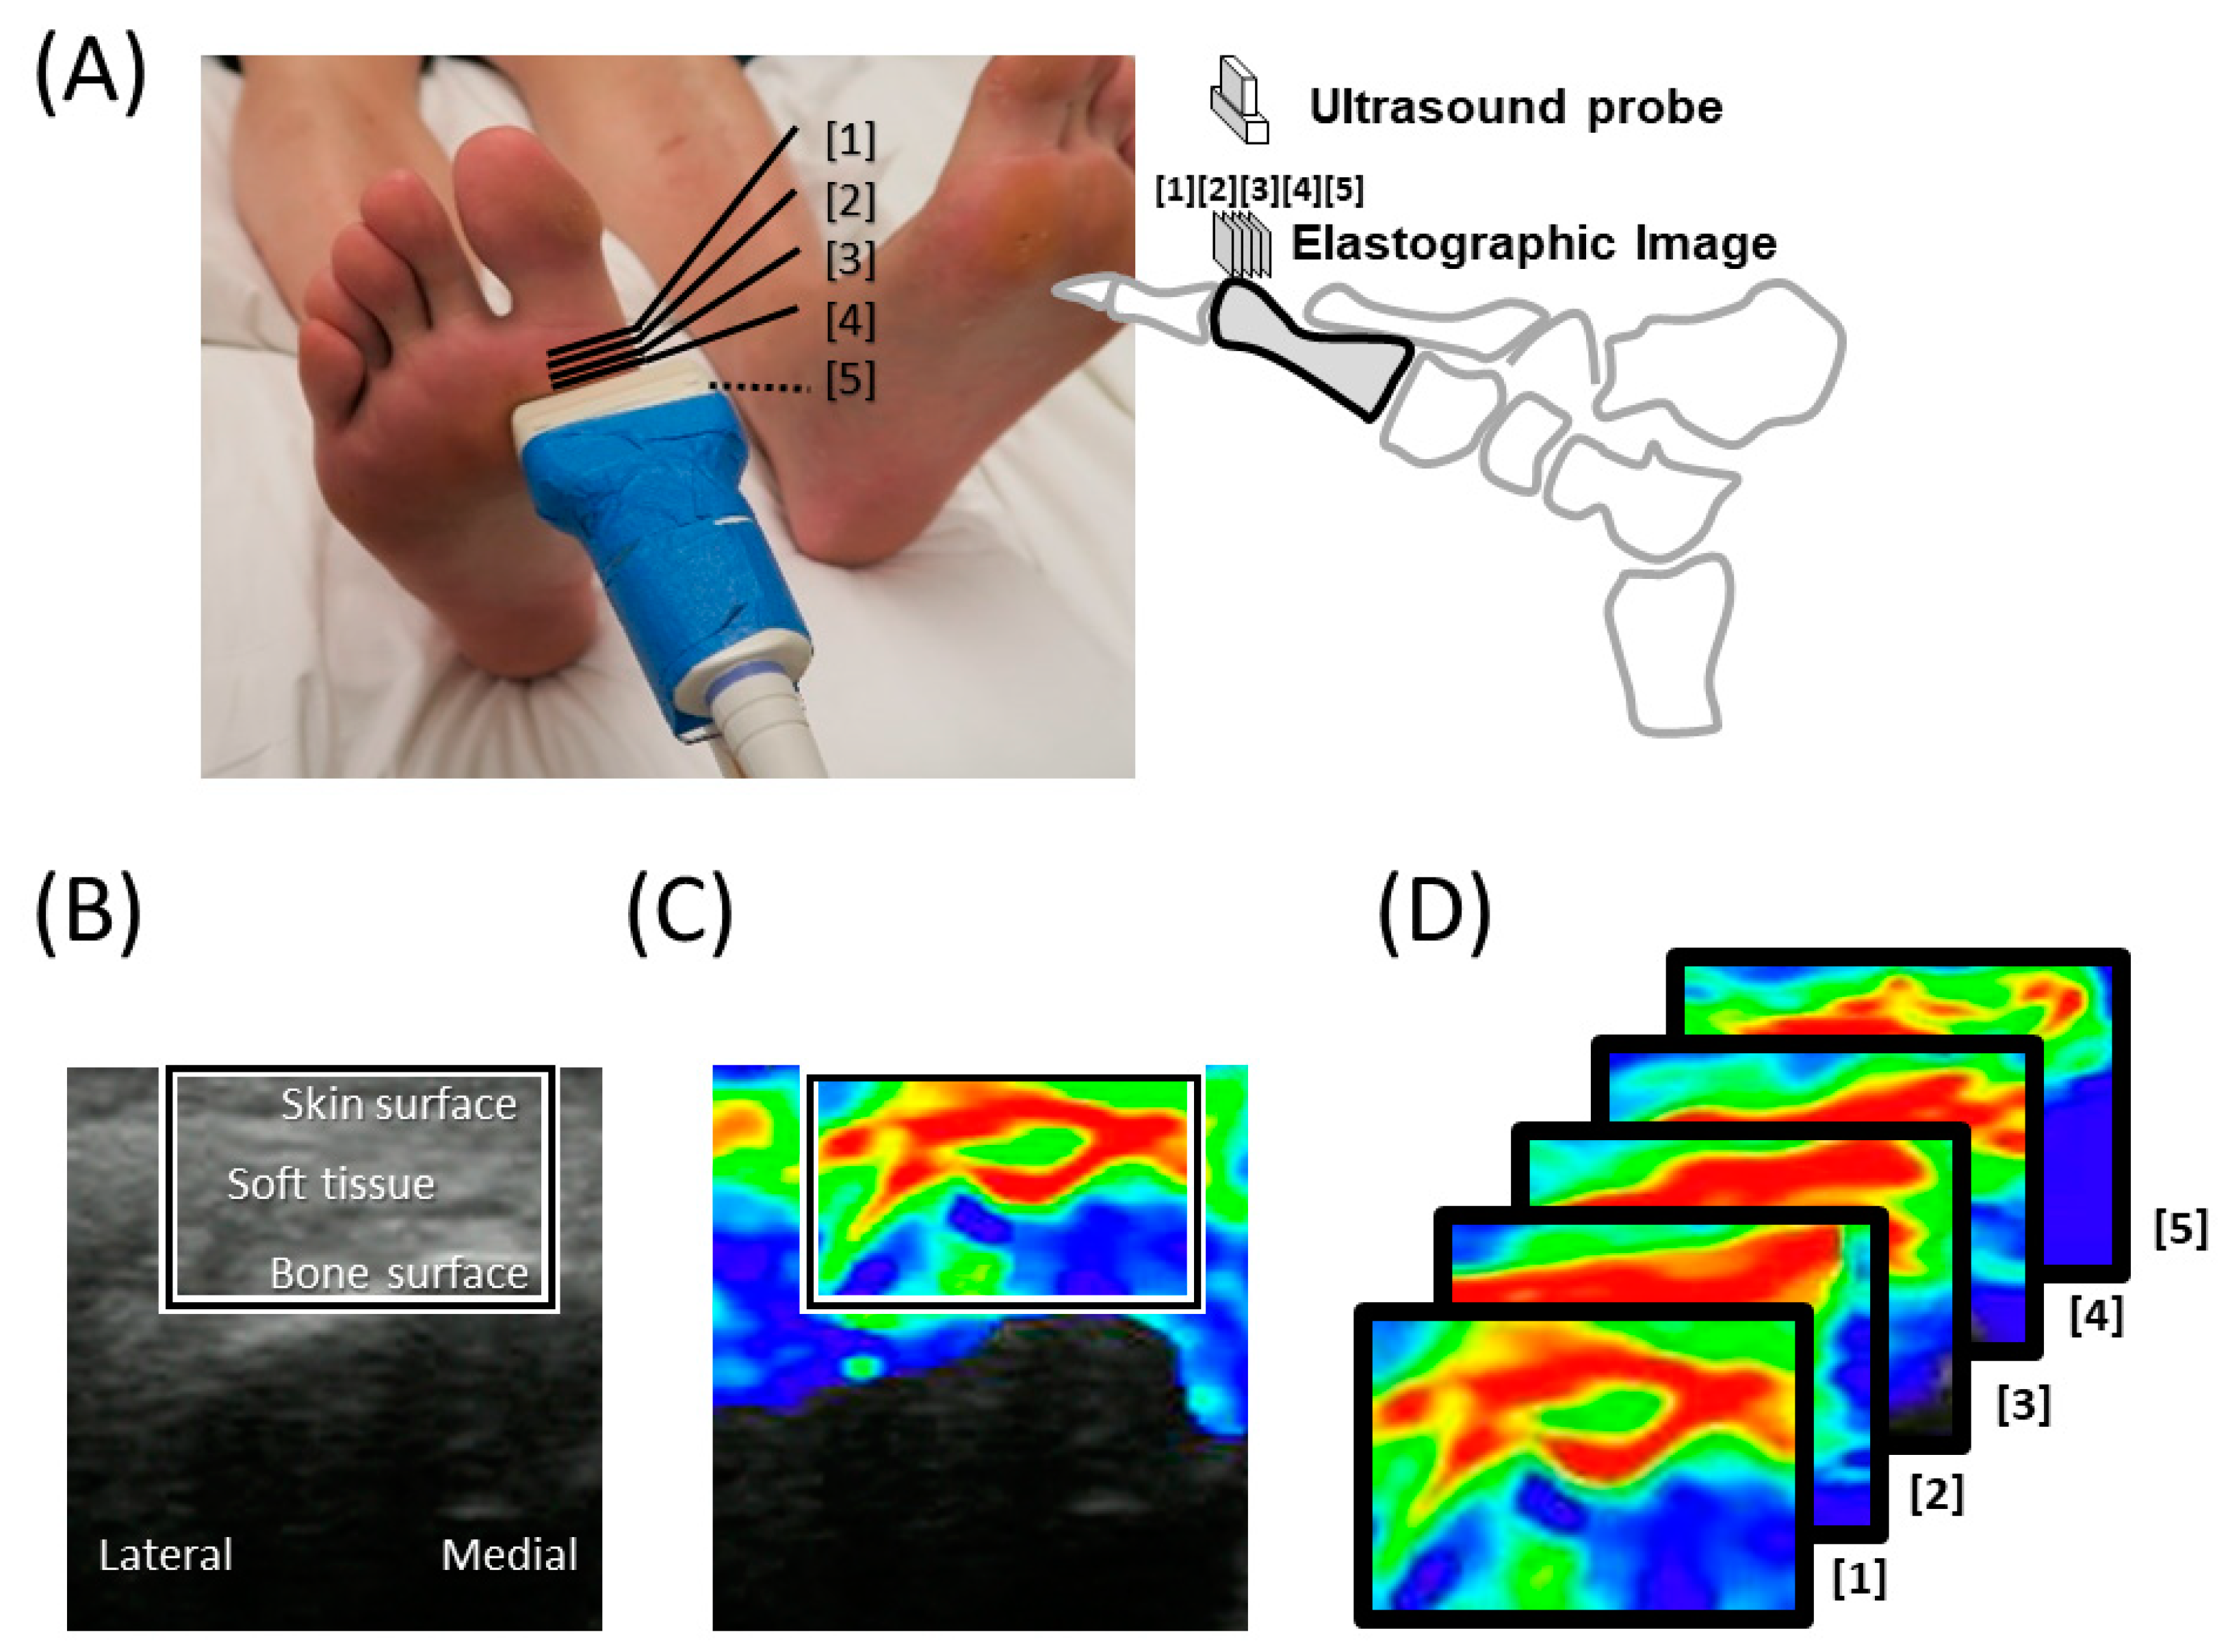
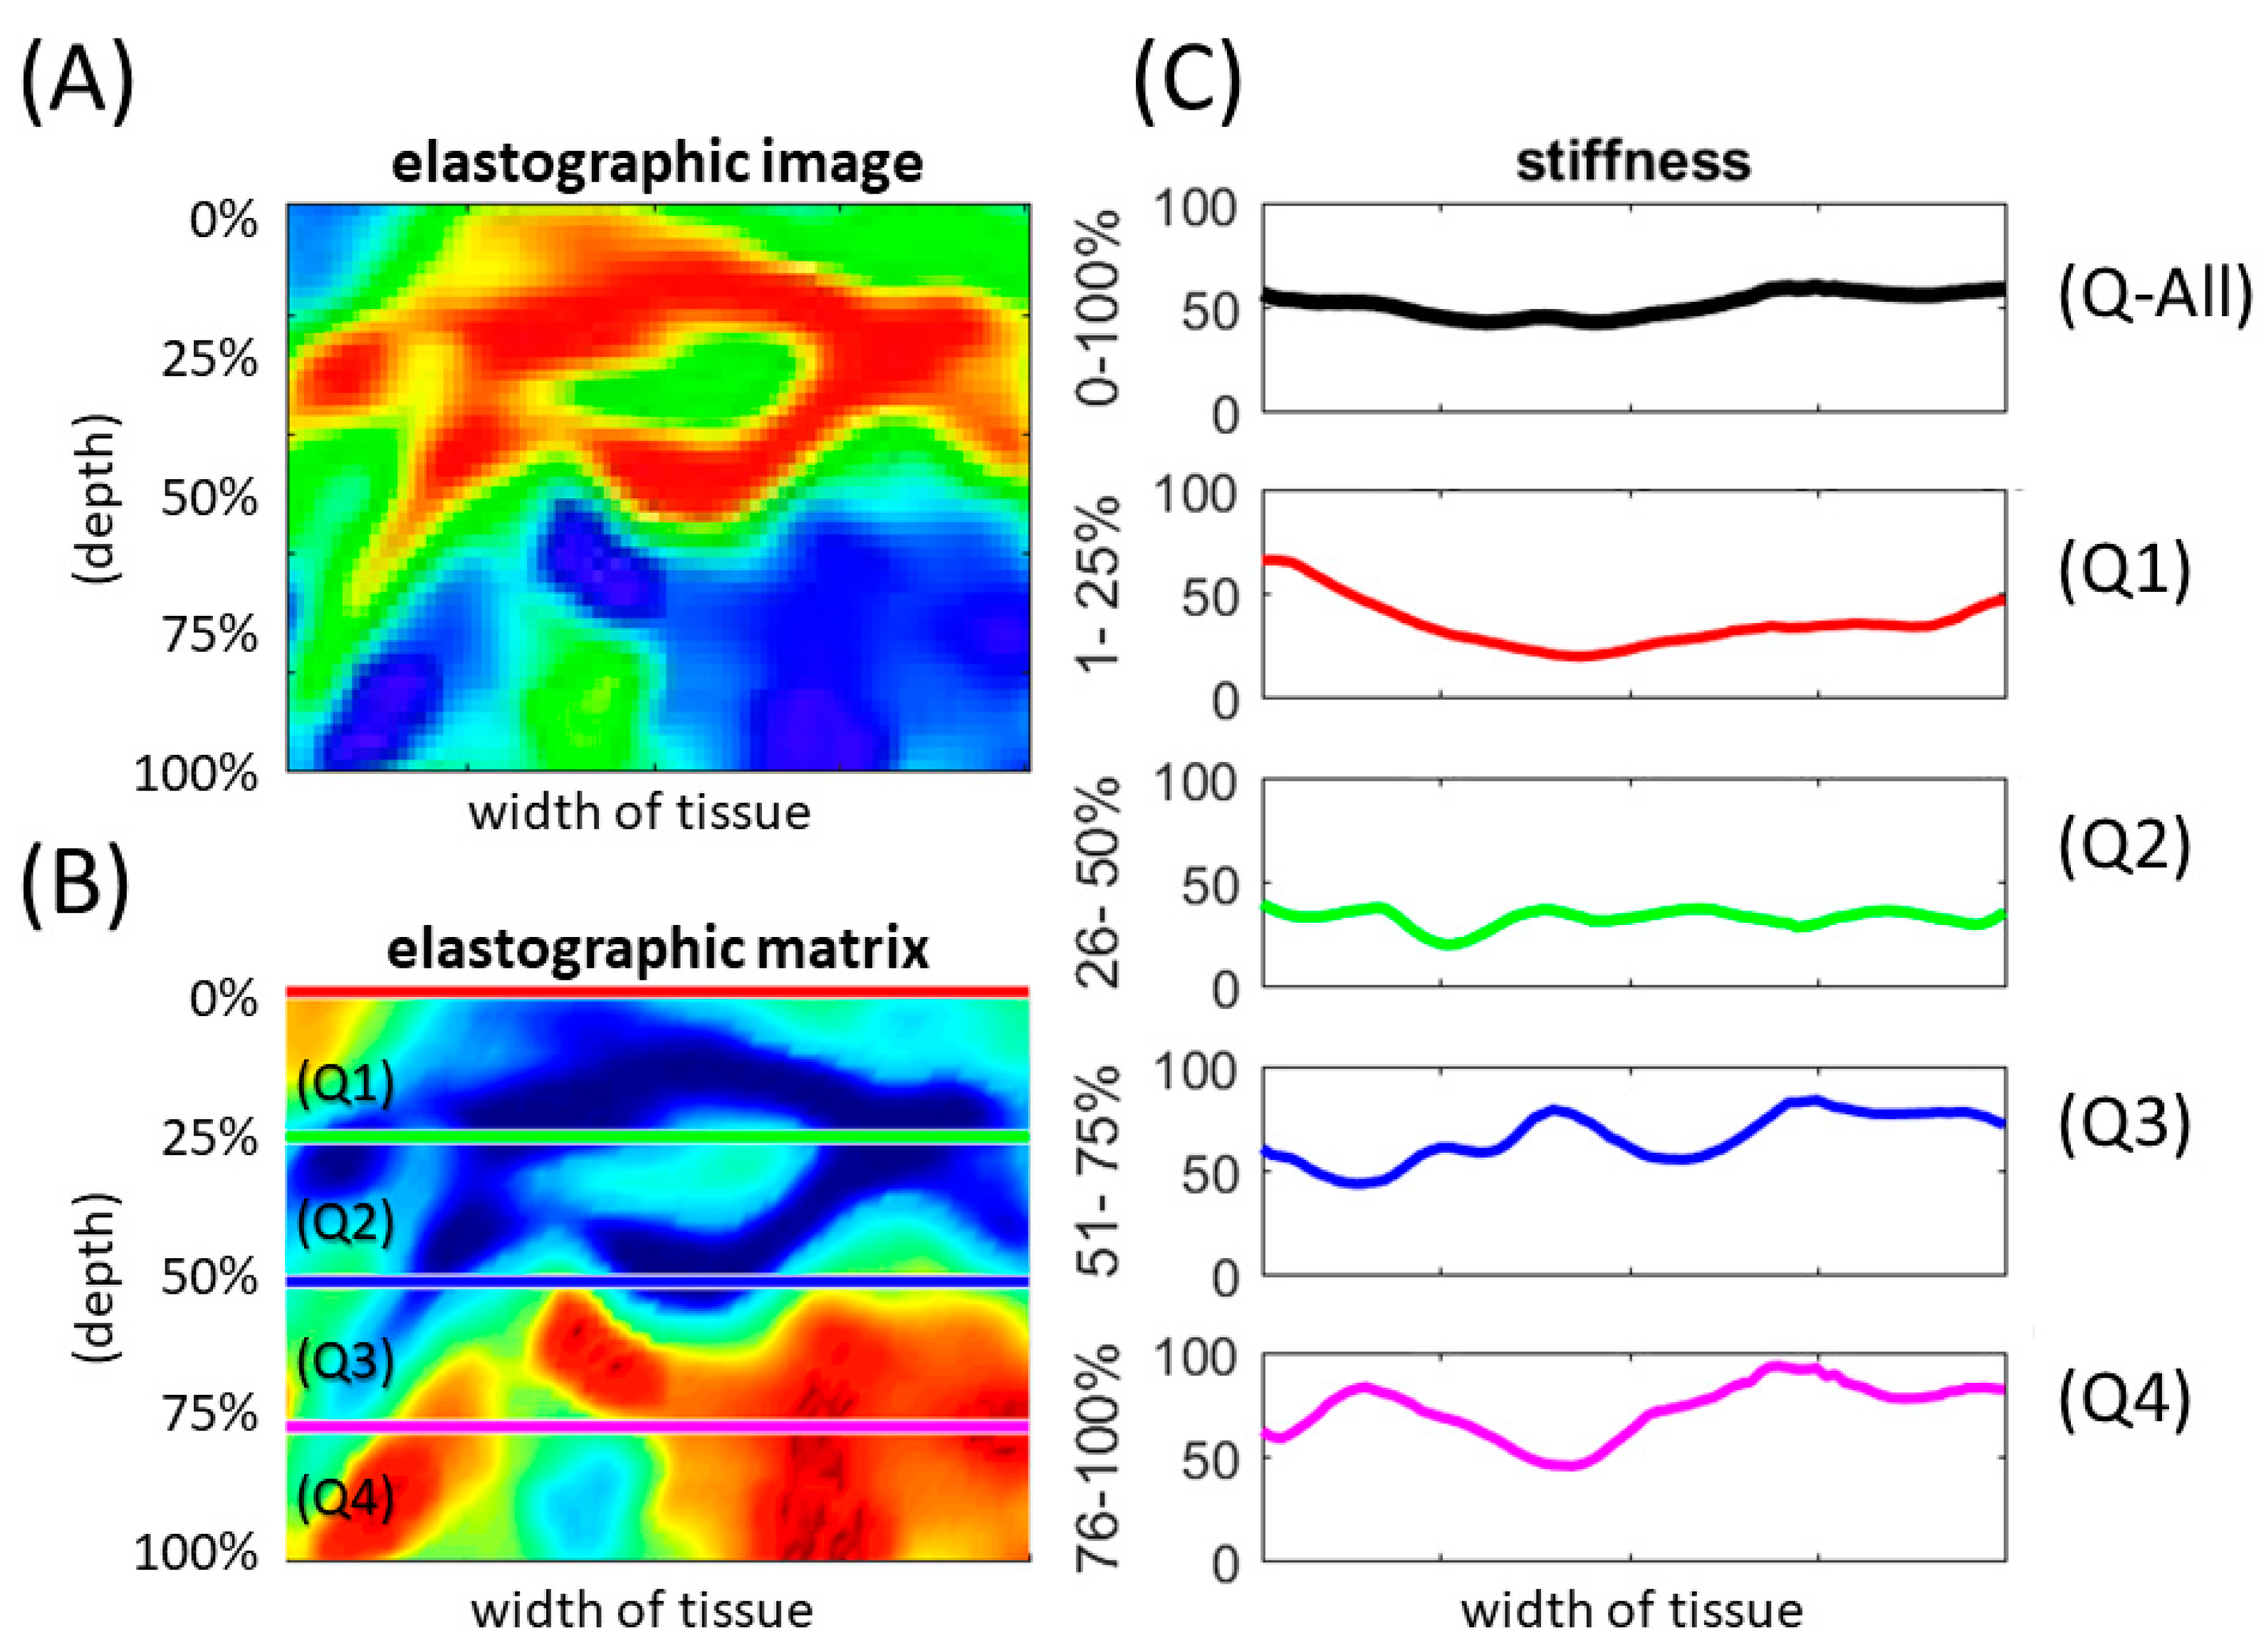
2.3. Plantar Tissue Mechanical Property

An elastographic ultrasound (Aloka Pro Sound Alpha 7, Hitachi Healthcare Americas, Twinsburg, OH, USA) with a linear array transducer (UST-5412, 5–13 MHz, Hitachi Healthcare Americas) was used to measure plantar tissue mechanical property. Elastographic images were obtained by applying cyclic compressions on the first metatarsal head [21,22]. The measurements included both B-mode and elastographic images. Elastographic images represent the tissue strain ratio [23]. The tissue strain ratios of plantar foot were then used to quantify plantar stiffness. The principle of strain elastography is based on the elastic modulus (E), defined as a ratio of stress to strain. Under similar stresses, strain in harder tissue is lower than strain in softer tissue [24]. Thus, a comparison between strains of the different soft tissues can be used to assess elasticity changes. The strain ratio represents the relative difference in tissue stiffness [25].
The stiffness of the plantar foot was calculated based on the strain ratio of the elastographic images [21,22]. First, a rectangular area was drawn on the B-mode image to define the soft tissue region between the skin and bone at the first metatarsal head (Figure 1B). Then, the corresponding elastographic image was superimposed on the B-mode image to define the soft tissue over the first metatarsal head area (Figure 1C). The 5 ultrasound scans were then used to represent soft tissue under the first metatarsal head (Figure 1D). The pixel value of the elastographic image (Figure 2A) was converted to 100 levels (Figure 2B), representing soft (level 1) to hard (level 100) [21,22]. The pixel value of the elastographic image is usually shown in the RGB format for visual inspections by clinicians. In an elastographic image obtained by elastographic ultrasound, the strain ratio is a numeric scale ranging from level 1 (red color indicating soft) to level 100 (blue color indicating hard). In this study, RGB values of elastographic images are defined as (1,0,0) as red, (0,1,0) as green and (0,0,1) as blue [26]. The color map level was converted to use blue as soft (level 1) and red as hard (level 100) (Figure 2B). The mean strain ratio of the plantar soft tissue was calculated within this rectangular area [27]. Third, the stiffness of the metatarsal head, from the skin to the bone (Q-All), was evenly divided into four layers, including the superficial layer (from the skin surface, Q1), sub-superficial layer (Q2), sub-deep layer (Q3) and deep layer (Q4) (Figure 2B).

2.4. Statistical Analysis

A 3 × 2 two-way analysis of variance (ANOVA) with repeated measures was used to compare the stiffness among the three speeds (1.8, 3.6 and 5.4 mph) and two durations (10 and 20 min) and the interaction between the speeds and durations. The two-way ANOVA can examine the effect of two main factors (the speed factor and the duration factor) on plantar stiffness and can examine the interaction between the speed and duration factors on plantar stiffness. A one-way ANOVA with Fisher’s least significant difference correction was used for pairwise comparisons of the plantar stiffness between three walking speeds (1.8, 3.6 and 5.4 mph) under each walking duration (10 and 20 min). Ultrasound images were analyzed using MATLAB R2019b (Mathworks, Inc., Natick, MA, USA). All statistical tests were performed using SPSS 26 (IBM, Somers, NY, USA) at the significance level of 0.05.

3. Results

Twelve healthy participants (five men and seven women) were recruited into this study. The demographic data were (mean ± standard deviation): age, 27.1 ± 5.8 years; height, 170.3 ± 10.0 cm; and weight, 63.5 ± 13.5 kg.
The 3 × 2 two-way ANOVA shows that the walking speed factor caused a significant main effect of planar stiffness (Q-All, p < 0.05) (Table 1). However, the walking duration factor did not significantly affect the plantar stiffness. There was no interaction between the speed and duration factors on plantar tissue stiffness (non-significant). (Table 1).
Regarding the walking speed effect, under 20 min walking duration, there was a significant difference in the plantar stiffness (Q-All) between 1.8 and 3.6 mph (56.8 ± 0.8% vs. 53.6 ± 0.9%, p = 0.017). In the superficial layer (Q1), there was a significant difference between 1.8 and 3.6 mph (40.4 ± 1.3% vs. 34.0 ± 1.5%, p = 0.003) and between 1.8 and 5.4 mph (40.4 ± 1.3% vs. 35.5 ± 1.4%, p = 0.018). In the sub-superficial layer (Q2), there was a significant difference between 1.8 and 3.6 mph (41.4 ± 1.4% vs. 35.3 ± 1.0%, p = 0.001) and between 1.8 and 5.4 mph (41.4 ± 1.4 vs. 37.9 ± 1.0%, p = 0.040) (Table 1) (Figure 3).
For the walking durations, the paired t-test showed that there was no significant pairwise difference in plantar tissue stiffness (Table 2). This is consistent with the finding from the ANOVA analysis, indicating that the walking duration factor did not significantly affect the plantar tissue stiffness.

4. Discussion

The results of this study demonstrated that the walking speeds (1.8, 3.6 and 5.4 mph) significantly affected plantar tissue stiffness and the walking durations (10 and 20 min) did not. Our results indicate that plantar tissue stiffness after walking at 3.6 mph for 20 min was significantly lower compared to walking at 1.8 mph for 20 min. This finding is significant because moderate-to-fast walking speed (3.6 mph) can decrease plantar tissue stiffness compared to slow walking speed (1.8 mph). On the other hand, slow walking speed can increase plantar tissue stiffness that may cause a higher risk of foot ulcers [28]. This study suggests people at risk for foot ulcers walk at a preferred or fast speed (3.6 mph) rather than walk slowly (1.8 mph).
Mueller and Maluf proposed the physical stress theory to provide a conceptual framework for guiding the prescription of physical activity to improve health in various physiological and pathological conditions [29]. An appropriate intensity of exercise can provide needed physical stress to maintain tissue health; when the intensity is either too low or too high, tissue injury may occur. However, there are no definitive values of the appropriate stress for various tissues. The authors indicate a need to establish thresholds for various conditions. In this study, we demonstrated that walking at 1.8 mph for 20 min resulted in higher stiffness of plantar tissue compared to walking at 3.6 mph for 20 min. This implies that walking speed at 3.6 mph is more appropriate in people at risk for foot ulcers, especially people with DM. Our finding also suggests that slow walking speed (1.8 mph for 20 min) may not be a good strategy for people at risk for foot ulcers. The increased stiffness after slow walking may increase the potential for ischemic injury [30,31].
Our previous study demonstrated that people with DM have impaired skin blood flow response to mechanical and thermal stresses [32,33]. Additionally, when exercise intensity is sufficient, microvascular function would benefit from exercise to improve blood flow function. Wu et al. demonstrated that walking speed at 3.6 mph would increase more skin blood flow compared to 1.8 mph [9]. Combined with the findings from this study, walking at 3.6 mph will have a higher increase in skin blood flow and lower stiffness of the foot compared to walking at 1.8 mph. The result of this study indirectly supports that weight-bearing exercise may not increase risk for foot ulcers because weight-bearing exercise (e.g., moderate-to-fast walking (brisk walking)) can improve skin blood flow and reduce stiffness of the plantar foot compared to slow walking (1.8 mph).
The superficial layer (near the skin surface, Q1) showed lower stiffness, and the deep layer (near the bone, Q4) showed higher stiffness after walking. Our results are consistent with previous studies [34,35,36]. Fung suggested that the viscoelasticity and strain rate effects of soft tissue are related to the structure of soft tissue [37]. For superficial pressure ulcers/injury, the causative factor is mainly friction and shear. For the deep pressure ulcers/injury, the causative factor is pressure [38]. Our results (softer superficial layer and stiffer deep layer) provide a reason for this clinical observation. Under pressure, the superficial layer has lower stiffness that can withstand pressure compared to the deep layer. This finding is supported by a previous study. Daniel et al. demonstrated that superficial soft tissue can withstand two times the prolonged loading of deep soft tissue [39].
Regarding the walking duration effect, there is no significant difference after walking 10 or 20 min. Although there is no difference, this provides evidence to walk up to 20 min because walking at various speeds for either 10 min or 20 min will not change plantar tissue stiffness. People at risk for foot ulcers may exercise up to 20 min without significantly increasing the stiffness of plantar tissue. According to the physical stress theory [26], these stresses caused by various walking durations are still within the safe threshold; therefore, plantar tissue can adapt to these stresses. This could also be explained by the interstitial fluid theory fluid flow within the plantar foot to absorb various plantar loads [40,41].
Behforootan et al. suggested that the measurement of strain, along with plantar pressure, can improve the understanding of the mechanical behavior of the plantar soft tissue [42]. Previous studies showed that faster walking speeds resulted in higher plantar pressure [43,44]. However, stiffness is an indicator of the tendency for an element to return its original shape after applied force/stress/pressure. In this study, we used the strain ratio from the elastographic ultrasound to measure plantar tissue stiffness after walking at various intensities. Our results showed that in the superficial layer and the sub-superficial layer, the plantar tissue stiffness was significantly lower after 3.6 mph compared to 1.8 mph. The results are consistent with the force-relaxation curve of biological tissues (i.e., viscoelastic materials) [45]. This could also be explained by the increase in plantar skin temperature. Wu et al. demonstrated that walking at 3.6 mph can significantly increase plantar skin blood flow compared to walking at 1.8 mph. An increase in skin blood flow is generally accompanied by an increase in skin temperature [9]. Vawter et al. demonstrated that soft tissue stiffness decreased when temperature increased [46,47]. This could partly explain a lower stiffness of plantar tissue after walking at 3.6 mph compared to 1.8 mph because of a higher increase in plantar skin blood flow during walking at 3.6 mph [9].
There are limitations to this study. The first limitation is the lack of a stress ratio validation for this elastographic ultrasound study. The strain ratio by elastographic ultrasound was used to quantify plantar tissue stiffness [23]. Naemi et al. found that the viscous and elastic model parameters of plantar foot were significantly correlated with maximum strain, indicating the need to perform indentation tests at the maximum strain similar to the strain of the plantar foot during walking [48]. The second limitation is that the boundary between plantar soft tissue and the first metatarsal head is not a flat surface. The use of a popular rectangular ROI would not be able to fully capture plantar soft tissue adjacent to the bone. Third, we used a two-way 3 × 2 factorial design to examine plantar tissue stiffness after walking at different speeds and durations. Due to the high number of comparisons in the two-way ANOVA analyses, we only compared stiffness after walking and did not add the pre-post comparison into this study that may significantly decrease the statistical power of this study. Future studies may need to examine the changes between before and after walking.

5. Conclusions

The results of this study demonstrated that the walking speed (1.8, 3.6 and 5.4 mph) significantly affected plantar tissue stiffness and the walking durations (10 and 20 min) did not. Our results indicate that plantar tissue stiffness after walking at 3.6 mph for 20 min was significantly lower compared to walking at 1.8 mph for 20 min. This study suggests people at risk for foot ulcers walk at a preferred or fast speed (3.6 mph) rather than walk slowly (1.8 mph).

Author Contributions

Conceptualization, Y.-K.J.; Data curation, F.-L.W.; Formal analysis, C.-W.L. and Y.-K.J.; Methodology, C.-W.L., F.-L.W. and Y.-K.J.; Writing—original draft, C.-W.L., F.-L.W., K.Z., B.-Y.L., R.T. and Y.-K.J.; Writing—review & editing, C.-W.L., F.-L.W., K.Z., B.-Y.L., R.T. and Y.-K.J. All authors have read and agreed to the published version of the manuscript.

Funding

This research received no external funding.

Conflicts of Interest

All authors declare no conflicts of interest.

References

  1. Zhang, P.; Lu, J.; Jing, Y.; Tang, S.; Zhu, D.; Bi, Y. Global epidemiology of diabetic foot ulceration: A systematic review and meta-analysis (dagger). Ann. Med. 2017, 49, 106–116. [Google Scholar] [CrossRef] [PubMed]
  2. Walsh, J.W.; Hoffstad, O.J.; Sullivan, M.O.; Margolis, D.J. Association of diabetic foot ulcer and death in a population-based cohort from the United Kingdom. Diabet. Med. 2016, 33, 1493–1498. [Google Scholar] [CrossRef] [PubMed]
  3. Colberg, S.R.; Sigal, R.J.; Yardley, J.E.; Riddell, M.C.; Dunstan, D.W.; Dempsey, P.C.; Horton, E.S.; Castorino, K.; Tate, D.F. Physical Activity/Exercise and Diabetes: A Position Statement of the American Diabetes Association. Diabetes Care 2016, 39, 2065–2079. [Google Scholar] [CrossRef] [PubMed] [Green Version]
  4. Boule, N.G.; Kenny, G.P.; Haddad, E.; Wells, G.A.; Sigal, R.J. Meta-analysis of the effect of structured exercise training on cardiorespiratory fitness in Type 2 diabetes mellitus. Diabetologia 2003, 46, 1071–1081. [Google Scholar] [CrossRef] [PubMed] [Green Version]
  5. Chen, L.; Pei, J.H.; Kuang, J.; Chen, H.M.; Chen, Z.; Li, Z.W.; Yang, H.Z. Effect of lifestyle intervention in patients with type 2 diabetes: A meta-analysis. Metabolism 2015, 64, 338–347. [Google Scholar] [CrossRef]
  6. Hu, F.B.; Stampfer, M.J.; Solomon, C.; Liu, S.; Colditz, G.A.; Speizer, F.E.; Willett, W.C.; Manson, J.E. Physical activity and risk for cardiovascular events in diabetic women. Ann. Intern. Med. 2001, 134, 96–105. [Google Scholar] [CrossRef]
  7. Mak, A.F.; Zhang, M.; Tam, E.W. Biomechanics of pressure ulcer in body tissues interacting with external forces during locomotion. Annu. Rev. Biomed. Eng. 2010, 12, 29–53. [Google Scholar] [CrossRef] [Green Version]
  8. Patry, J.; Belley, R.; Cote, M.; Chateau-Degat, M.L. Plantar pressures, plantar forces, and their influence on the pathogenesis of diabetic foot ulcers: A review. J. Am. Podiatr. Med. Assoc. 2013, 103, 322–332. [Google Scholar] [CrossRef]
  9. Wu, F.L.; Wang, W.T.; Liao, F.; Elliott, J.; Jain, S.; Jan, Y.K. Effects of walking speeds and durations on plantar skin blood flow responses. Microvasc. Res. 2020, 128, 103936. [Google Scholar] [CrossRef]
  10. Liao, F.Y.; An, R.P.; Pu, F.; Burns, S.; Shen, S.; Jan, Y.K. Effect of Exercise on Risk Factors of Diabetic Foot Ulcers A Systematic Review and Meta-Analysis. Am. J. Phys. Med. Rehabil. 2019, 98, 103–116. [Google Scholar] [CrossRef]
  11. Bus, S.A.; van Deursen, R.W.; Armstrong, D.G.; Lewis, J.E.; Caravaggi, C.F.; Cavanagh, P.R. Footwear and offloading interventions to prevent and heal foot ulcers and reduce plantar pressure in patients with diabetes: A systematic review. Diabetes Metab. Res. Rev. 2016, 32 (Suppl. 1), 99–118. [Google Scholar] [CrossRef] [Green Version]
  12. Sacco, I.C.; Hamamoto, A.N.; Tonicelli, L.M.; Watari, R.; Ortega, N.R.; Sartor, C.D. Abnormalities of plantar pressure distribution in early, intermediate, and late stages of diabetic neuropathy. Gait Posture 2014, 40, 570–574. [Google Scholar] [CrossRef]
  13. Lung, C.W.; Wu, F.L.; Liao, F.; Pu, F.; Fan, Y.; Jan, Y.K. Emerging technologies for the prevention and management of diabetic foot ulcers. J. Tissue Viability 2020, 29, 61–68. [Google Scholar] [CrossRef]
  14. Klaesner, J.W.; Hastings, M.K.; Zou, D.; Lewis, C.; Mueller, M.J. Plantar tissue stiffness in patients with diabetes mellitus and peripheral neuropathy. Arch. Phys. Med. Rehabil. 2002, 83, 1796–1801. [Google Scholar] [CrossRef] [PubMed]
  15. Vorlander, C.; Wolff, J.; Saalabian, S.; Lienenluke, R.H.; Wahl, R.A. Real-time ultrasound elastography--a noninvasive diagnostic procedure for evaluating dominant thyroid nodules. Langenbecks Arch. Surg 2010, 395, 865–871. [Google Scholar] [CrossRef] [PubMed]
  16. Jan, Y.K.; Lung, C.W.; Cuaderes, E.; Rong, D.; Boyce, K. Effect of viscoelastic properties of plantar soft tissues on plantar pressures at the first metatarsal head in diabetics with peripheral neuropathy. Physiol. Meas. 2013, 34, 53–66. [Google Scholar] [CrossRef]
  17. Tajaddini, A.; Scoffone, H.M.; Botek, G.; Davis, B.L. Laser-induced auto-fluorescence (LIAF) as a method for assessing skin stiffness preceding diabetic ulcer formation. J. Biomech. 2007, 40, 736–741. [Google Scholar] [CrossRef]
  18. Gefen, A. Plantar soft tissue loading under the medial metatarsals in the standing diabetic foot. Med. Eng. Phys. 2003, 25, 491–499. [Google Scholar] [CrossRef]
  19. Williams, E.D.; Stebbins, M.J.; Cavanagh, P.R.; Haynor, D.R.; Chu, B.; Fassbind, M.J.; Isvilanonda, V.; Ledoux, W.R. A preliminary study of patient-specific mechanical properties of diabetic and healthy plantar soft tissue from gated magnetic resonance imaging. Proc. Inst. Mech Eng. H 2017, 231, 625–633. [Google Scholar] [CrossRef]
  20. Bohannon, R.W.; Williams Andrews, A. Normal walking speed: A descriptive meta-analysis. Physiotherapy 2011, 97, 182–189. [Google Scholar] [CrossRef]
  21. Wasadikar, A.P.; Jadhav, M.B.; Rote-Kaginalkar, V.J.; Wasadikar, P.P.; Jha, P.S. Differentiation of Solid Breast Masses into Benign and Malignant by Using Gray Scale Ultrasonography and Strain Elastography. J. Med. Sci. Clin. Res. 2017, 5, 31456–31463. [Google Scholar] [CrossRef]
  22. Tohno, E.; Umemoto, T.; Sasaki, K.; Morishima, I.; Ueno, E. Effect of adding screening ultrasonography to screening mammography on patient recall and cancer detection rates: A retrospective study in Japan. Eur. J. Radiol. 2013, 82, 1227–1230. [Google Scholar] [CrossRef] [PubMed]
  23. Wojtaszek-Nowicka, M.; Slowinska-Klencka, D.; Sporny, S.; Popowicz, B.; Kuzdak, K.; Pomorski, L.; Kaczka, K.; Sopinski, J.; Klencki, M. The efficiency of elastography in the diagnostics of follicular lesions and nodules with an unequivocal FNA result. Endokrynol. Pol. 2017, 68, 610–622. [Google Scholar] [CrossRef] [PubMed] [Green Version]
  24. Ophir, J.; Alam, S.K.; Garra, B.S.; Kallel, F.; Konofagou, E.E.; Krouskop, T.; Merritt, C.R.; Righetti, R.; Souchon, R.; Srinivasan, S.; et al. Elastography: Imaging the elastic properties of soft tissues with ultrasound. J. Med. Ultrason. 2002, 29, 155. [Google Scholar] [CrossRef]
  25. Havre, R.F.; Waage, J.E.R.; Mulabecirovic, A.; Gilja, O.H.; Nesje, L.B. Strain ratio as a quantification tool in strain imaging. Appl. Sci. 2018, 8, 1273. [Google Scholar] [CrossRef] [Green Version]
  26. Aznaveh, M.M.; Mirzaei, H.; Roshan, E.; Saraee, M. A new color based method for skin detection using RGB vector space. In Proceedings of the 2008 Conference on Human System Interactions, Krakow, Poland, 25–27 May 2008; pp. 932–935. [Google Scholar]
  27. Jan, Y.K.; Hou, X.; He, X.; Guo, C.; Jain, S.; Bleakney, A. Using elastographic ultrasound to assess the effect of cupping size of cupping therapy on stiffness of triceps muscle. Am. J. Phys. Med. Rehabil. 2020. [Google Scholar] [CrossRef]
  28. Sun, J.H.; Cheng, B.K.; Zheng, Y.P.; Huang, Y.P.; Leung, J.Y.; Cheing, G.L. Changes in the thickness and stiffness of plantar soft tissues in people with diabetic peripheral neuropathy. Arch. Phys. Med. Rehabil. 2011, 92, 1484–1489. [Google Scholar] [CrossRef]
  29. Mueller, M.J.; Maluf, K.S. Tissue adaptation to physical stress: A proposed “Physical Stress Theory” to guide physical therapist practice, education, and research. Phys. Ther. 2002, 82, 383–403. [Google Scholar] [CrossRef]
  30. Deprez, J.F.; Brusseau, E.; Fromageau, J.; Cloutier, G.; Basset, O. On the potential of ultrasound elastography for pressure ulcer early detection. Med. Phys. 2011, 38, 1943–1950. [Google Scholar] [CrossRef] [Green Version]
  31. Shoham, N.; Gefen, A. Deformations, mechanical strains and stresses across the different hierarchical scales in weight-bearing soft tissues. J. Tissue Viability 2012, 21, 39–46. [Google Scholar] [CrossRef]
  32. Jan, Y.K.; Liao, F.Y.; Cheing, G.L.Y.; Pu, F.; Ren, W.Y.; Choi, H.M.C. Differences in skin blood flow oscillations between the plantar and dorsal foot in people with diabetes mellitus and peripheral neuropathy. Microvasc. Res. 2019, 122, 45–51. [Google Scholar] [CrossRef]
  33. Jan, Y.K.; Shen, S.; Foreman, R.D.; Ennis, W.J. Skin blood flow response to locally applied mechanical and thermal stresses in the diabetic foot. Microvasc. Res. 2013, 89, 40–46. [Google Scholar] [CrossRef] [PubMed]
  34. Gennisson, J.L.; Baldeweck, T.; Tanter, M.; Catheline, S.; Fink, M.; Sandrin, L.; Cornillon, C.; Querleux, B. Assessment of elastic parameters of human skin using dynamic elastography. IEEE Trans. Ultrason. Ferroelectr. Freq. Control. 2004, 51, 980–989. [Google Scholar] [CrossRef]
  35. Kennedy, B.F.; Hillman, T.R.; McLaughlin, R.A.; Quirk, B.C.; Sampson, D.D. In vivo dynamic optical coherence elastography using a ring actuator. Opt. Express 2009, 17, 21762–21772. [Google Scholar] [CrossRef] [PubMed]
  36. Li, C.; Guan, G.; Reif, R.; Huang, Z.; Wang, R.K. Determining elastic properties of skin by measuring surface waves from an impulse mechanical stimulus using phase-sensitive optical coherence tomography. J. R. Soc. Interface 2012, 9, 831–841. [Google Scholar] [CrossRef]
  37. Fung, Y.C. Structure and stress-strain relationship of soft-tissues. Am. Zool. 1984, 24, 13–22. [Google Scholar] [CrossRef] [Green Version]
  38. Kottner, J.; Balzer, K.; Dassen, T.; Heinze, S. Pressure ulcers: A critical review of definitions and classifications. Ostomy Wound Manag. 2009, 55, 22–29. [Google Scholar]
  39. Daniel, R.K.; Priest, D.L.; Wheatley, D.C. Etiologic factors in pressure sores: An experimental model. Arch. Phys. Med. Rehabil. 1981, 62, 492–498. [Google Scholar]
  40. Federico, S.; Herzog, W. On the anisotropy and inhomogeneity of permeability in articular cartilage. Biomech. Model. Mechanobiol. 2008, 7, 367–378. [Google Scholar] [CrossRef]
  41. Schafer, G.; Dobos, G.; Lunnemann, L.; Blume-Peytavi, U.; Fischer, T.; Kottner, J. Using ultrasound elastography to monitor human soft tissue behaviour during prolonged loading: A clinical explorative study. J. Tissue Viability 2015, 24, 165–172. [Google Scholar] [CrossRef]
  42. Behforootan, S.; Chatzistergos, P.E.; Chockalingam, N.; Naemi, R. A Simulation of the Viscoelastic Behaviour of Heel Pad During Weight-Bearing Activities of Daily Living. Ann. Biomed. Eng. 2017, 45, 2750–2761. [Google Scholar] [CrossRef] [PubMed]
  43. Koo, S.; Park, M.S.; Chung, C.Y.; Yoon, J.S.; Park, C.; Lee, K.M. Effects of walking speed and slope on pedobarographic findings in young healthy adults. PLoS ONE 2019, 14, e0220073. [Google Scholar] [CrossRef]
  44. Rosenbaum, D.; Hautmann, S.; Gold, M.; Claes, L. Effects of walking speed on plantar pressure patterns and hindfoot angular motion. Gait Posture 1994, 2, 191–197. [Google Scholar] [CrossRef]
  45. Negishi, T.; Ito, K.; Kamono, A.; Lee, T.; Ogihara, N. Strain-rate dependence of viscous properties of the plantar soft tissue identified by a spherical indentation test. J. Mech. Behav. Biomed. Mater. 2019, 102, 103470. [Google Scholar] [CrossRef] [PubMed]
  46. Vawter, D.L.; Fung, Y.C.; West, J.B. Elasticity of excised dog lung parenchyma. J. Appl. Physiol. Respir. Env. Exerc. Physiol. 1978, 45, 261–269. [Google Scholar] [CrossRef]
  47. Behforootan, S.; Chatzistergos, P.E.; Chockalingam, N.; Healy, A.; Naemi, R. Localized pressure stimulation using turf-like structures can improve skin perfusion in the foot. Microcirculation 2019, 26, e12543. [Google Scholar] [CrossRef] [PubMed]
  48. Naemi, R.; Chatzistergos, P.E.; Chockalingam, N. A mathematical method for quantifying in vivo mechanical behaviour of heel pad under dynamic load. Med. Biol. Eng. Comput. 2016, 54, 341–350. [Google Scholar] [CrossRef]
Figure 1. B-mode and elastographic ultrasound images of the plantar tissue of the first metatarsal head. (A) The ultrasound probe is placed over the first metatarsal head. Five measurements are taken for each condition. (B) The rectangular area is placed on the B-mode ultrasound image to define the region of interest (ROI) of the soft tissue over the first metatarsal head. (C) The same rectangular area is superimposed on the corresponding elastographic ultrasound image to acquire strain ratios of the ROI. (D) The elastographic images of five measurements are then used to calculate the plantar tissue stiffness of the first metatarsal head.
Applsci 10 07498 g001
Figure 2. The elastographic image and its quantification process of an elastographic scan of the plantar foot. (A) The elastographic image shows the stiffness of scanned plantar soft tissue ranging from 1 (red color, soft) to 100 (blue color, hard). (B) The stiffness level was converted to use blue color as soft and red color as hard. (C) The mean stiffness of the plantar tissue is calculated from the average 4 sub-layers of 5 elastographic images shown in Figure 1.
Applsci 10 07498 g002
Figure 3. Comparisons of the effect of walking speeds (1.8, 3.6 and 5.4 mph) on the plantar tissue stiffness of the first metatarsal head at two walking durations (A) 10 min walking duration and (B) 20 min walking duration). There is a significant difference in the plantar stiffness (Q-All) between 1.8 and 3.6 mph (56.8 ± 0.8% vs. 53.6 ± 0.9%, p = 0.017). In the superficial layer (Q1), there is a significant difference between 1.8 and 3.6 mph (40.4 ± 1.3% vs. 34.0 ± 1.5%, p = 0.003) and between 1.8 and 5.4 mph (40.4 ± 1.3% vs. 35.5 ± 1.4%, p = 0.018). In the sub-superficial layer (Q2), there is a significant difference between 1.8 and 3.6 mph (41.4 ± 1.4% vs. 35.3 ± 1.0%, p = 0.001) and between 1.8 and 5.4 mph (41.4 ± 1.4% vs. 37.9 ± 1.0%, p = 0.040). Data are shown as mean ± standard errors. *, a significant difference (p < 0.05). **, a significant difference (p < 0.01).
Applsci 10 07498 g003
Table 1. Effect of walking speeds on plantar tissue stiffness (Q-All) and evenly divided four layers (from superficial (skin) to deep (bone), Q1, Q2, Q3 and Q4).
DurationLevelSpeedOne-WayFisher’s LSD
ANOVAPost Hoc
1.8 mph (Mean ± SE)3.6 mph (Mean ± SE)5.4 mph (Mean ± SE)p Value1.8 mph vs1.8 mph vs3.6 mph vs
3.6 mph5.4 mph5.4 mph
10 minQ-All56.9 ± 1.055.1 ± 1.056.4 ± 0.80.3630.1700.6960.321
Q139.4 ± 1.835.6 ± 1.637.9 ± 1.60.2930.1230.5560.331
Q239.4 ± 1.436.8 ± 1.438.3 ± 0.90.3740.1650.5420.428
Q365.1 ± 1.363.5 ± 1.864.2 ± 1.20.7410.4440.6630.740
Q480.8 ± 1.380.5 ± 1.482.3 ± 1.40.6030.8640.4420.349
20 minQ-All56.8 ± 0.853.6 ± 0.955.3 ± 1.00.0570.017 *0.2510.191
Q140.4 ± 1.334.0 ± 1.535.5 ±1.40.007 **0.003 **0.018 *0.449
Q241.4 ± 1.435.3 ± 1.037.9 ± 1.00.003 **0.001 **0.0400.113
Q363.2 ± 1.462.3 ± 2.163.4 ± 1.80.9010.7320.9310.668
Q479.2 ± 1.480.0 ± 1.581.4 ± 1.20.4670.6840.2290.420
Note: The plantar tissue stiffness (Q-All) under the first metatarsal head consisting of four layers, including the outer layer (Q1, near skin surface), sub-outer layer (Q2), sub-inner layer (Q3) and inner layer (Q4, near bone surface); *, p < 0.05; **, p < 0.001.
Table 2. Effect of walking duration on the soft tissue stiffness of the foot (Q-All) and four sublayers (from superficial (skin) to deep (bone), Q1, Q2, Q3 and Q4).
DurationPaired t-Test
SpeedLayer10 min (Mean ± SE)20 min (Mean ± SE)p Value
1.8 mphQ-All56.9 ± 1.056.8 ± 0.80.874
Q139.4 ± 1.840.4 ± 1.30.283
Q239.4 ± 1.441.4 ± 1.40.149
Q365.1 ± 1.363.2 ± 1.40.191
Q480.8 ± 1.379.2 ± 1.00.139
3.6 mphQ-All55.1 ± 1.053.6 ± 0.90.053
Q135.6 ± 1.634.0 ± 1.50.153
Q236.8 ± 1.435.3 ± 1.00.336
Q363.5 ± 1.862.3 ± 2.10.326
Q480.5 ± 1.480.0 ± 1.50.548
5.4 mphQ-All56.4 ± 0.855.3 ± 1.00.356
Q137.9 ± 1.635.5 ± 1.40.051
Q238.3 ± 0.937.9 ± 1.00.814
Q364.2 ± 1.263.4 ± 1.80.699
Q482.3 ± 1.481.4 ± 1.20.585
Note: The plantar soft tissue (Q-All) under the first metatarsal head consisting of four layers, including the outer layer (Q1, near skin surface), sub-outer layer (Q2), sub-inner layer (Q3) and inner layer (Q4, near bone surface).
Publisher’s Note: MDPI stays neutral with regard to jurisdictional claims in published maps and institutional affiliations.

