Article

Abundance Tracking by Long-Read Nanopore Sequencing of Complex Microbial Communities in Samples from 20 Different Biogas/Wastewater Plants

by
Christian Brandt
1,2,*,
Erik Bongcam-Rudloff
2 and
Bettina Müller
1
1
Department Molecular Sciences, Swedish University of Agricultural Sciences, 750 07 Uppsala, Sweden
2
Department Animal Breeding and Genetics, Bioinformatics Section, Swedish University of Agricultural Sciences, 750 07 Uppsala, Sweden
*
Author to whom correspondence should be addressed.
Appl. Sci. 2020, 10(21), 7518; https://doi.org/10.3390/app10217518
Submission received: 2 October 2020 / Revised: 19 October 2020 / Accepted: 23 October 2020 / Published: 26 October 2020
(This article belongs to the Special Issue Microbiological Surveillance of Biogas and Sewage Treatment Plants)

Abstract

:
Anaerobic digestion (AD) has long been critical technology for green energy, but the majority of the microorganisms involved are unknown and are currently not cultivable, which makes abundance tracking difficult. Developments in nanopore long-read sequencing make it a promising approach for monitoring microbial communities via metagenomic sequencing. For reliable monitoring of AD via long reads, we established a robust protocol for obtaining less fragmented, high-quality DNA, while preserving bacteria and archaea composition, for a broad range of different biogas reactors. Samples from 20 different biogas/wastewater reactors were investigated, and a median of 20.5 Gb sequencing data per nanopore flow cell was retrieved for each reactor using the developed DNA isolation protocol. The nanopore sequencing data were compared against Illumina sequencing data while using different taxonomic indices for read classifications. The Genome Taxonomy Database (GTDB) index allowed sufficient characterisation of the abundance of bacteria and archaea in biogas reactors with a dramatic improvement (1.8- to 13-fold increase) in taxonomic classification compared to the RefSeq index. Both technologies performed similarly in taxonomic read classification with a slight advantage for Illumina in regard to the total proportion of classified reads. However, nanopore sequencing data revealed a higher genus richness after classification. Metagenomic read classification via nanopore provides a promising approach to monitor the abundance of taxa present in a microbial AD community as an alternative to 16S ribosomal RNA studies or Illumina Sequencing.

1. Introduction

Anaerobic digestion (AD) has been a key technology in Europe and worldwide for many decades and is vital for a full transition from a fossil fuel-based economy to a sustainable bio-economy. During AD, various metabolic and functional bottlenecks that affect process stability and efficiency can occur. Process efficiency depends on the composition and activity of the microbial community. Therefore much effort has been devoted to understanding how the microbial community correlates with process parameters and performance [1,2]. In AD, many microorganisms form complex consortia to link and combine metabolic activities, and each member has different requirements for nutrients and physical conditions. However, the majority of the microorganisms involved are unknown [3], as isolation and characterisation of these microorganisms are time-consuming, and many are currently not cultivable. Moreover, the metabolism of pure cultures often differs from that of a microbial consortium. Thus, the function and importance of many AD microorganisms to convert organic material have not yet been fully explored.
Meta-barcoding via 16S ribosomal RNA (rRNA) gene amplicon sequencing is widely used for the analysis of the composition, structure, and dynamics of microbial assemblages [4,5]. However, this approach has two main drawbacks: (1) the experimental set-up does not allow prompt monitoring, and (2) inherent PCR amplification bias (e.g., primer mismatches, different gene copy number, sequence- and primer-dependent polymerase efficiency, choice of hypervariable region) [6,7,8,9] reduces the accuracy, as read abundance does not correlate with species abundance [10,11]. An alternative approach to circumvent the latter is to sequence the entire microbial DNA (metagenomics). Classifying the reads obtained from metagenomic sequencing gives insights into bacterial diversity and abundance. Metagenomics is usually performed via high-throughput sequencing (e.g., Illumina) [12]. However, long-read sequencing (e.g., nanopore sequencing) may provide a more accurate alternative, since the ratio of correctly classified reads to all reads is as high or even higher as using Illumina sequencing [13]. Although long reads are less accurate, they may allow better overall taxonomic classification due to the higher information content per read [14,15]. This higher information richness per read is particularly useful as multiple genes can be present within one read for functional assessments. Another crucial advantage is that the organism proportion in a sample is preserved during sequencing and reflected in the sequencing yield [16].
However, long-read sequencing of metagenomic samples has two particularly important bottlenecks: (i) it requires less-fragmented, high-quality DNA while preserving bacterial composition, and (ii) choice of index database has a significant influence on read classification performance. Several isolation protocols based on chemical cell lysis have been developed for pure cultures or filtered bacteria (e.g., water samples). For microbiota, as found in biogas reactors, these protocols are usually not applicable because chemical cell lysis is not equally effective for all bacteria due to very diverse cell wall structures. Mechanical approaches such as bead beating allow, in combination with chemical lysis, more uniform cell disruption, especially of Gram-positive bacteria [17], which are very abundant in AD processes [5,18]. However, the high shearing forces significantly reduce the length of the DNA fragments. Moreover, AD reactor samples may contain various particles/sediments, inhibitory components, cell debris, and partly digested DNA that further reduce the final quality and length of the recovered DNA and can significantly affect the sequencing performance.
Here, we present a DNA isolation protocol adjusted to the properties of digestate from AD processes that result in high-quality DNA suitable for nanopore sequencing. Operational parameters such as feedstock and temperature strongly affect the microbial composition and physicochemical properties of the digestate. Therefore, the protocol was tested on digestate samples retrieved from 20 different methanogenic AD processes. We compared extracted DNA to sequence performance and analysed the taxonomic affiliation and abundance in all 20 reactors directly via read classification using different databases and compared the results to the Illumina sequencing data.

2. Materials and Methods

The practical procedure of metagenomic DNA sequencing is covered by two protocols (DNA Extraction and Library Preparation): the “Long-read DNA preparation for Metagenomic samples” protocol described and developed here (available at protocols.io [19]) and the “One-pot Library preparation” published by Josh Quick [20] for the LSK-108 Kit, or the nanopore protocol for the LSK-109 Kit, with some slight modifications. We increased the incubation times for the DNA repair and end preparation with the LSK-109 Kit to 20 min each in order to improve the overall sequencing performance.

2.1. DNA Extraction

We developed a DNA isolation protocol for complex metagenomic samples for biogas or wastewater treatment plants that is a modified and extended version of the FastDNA Spin Kit for Soil (MP Biomedicals, Solon, OH, USA). This protocol, called “Long-read DNA preparation for Metagenomic samples”, is stored in detail as a step-by-step protocol for better experimental reproducibility at protocols.io [19]. DNA isolation was performed and tested on fresh or frozen substrate/sludge samples. DNA extraction was performed according to the manufacturer’s protocol, with various exceptions and additions to improve DNA fragment length while maintaining high yield and high enough purity to avoid interferences with the nanopores inside each sequencing flow cell.
In brief, 400 µL sample (substrate or sludge) were initially centrifuged for 5 min at 20,000× g. The supernatant was removed, and the sludge/substrate was re-suspended in nuclease-free water. This step was included before DNA isolation to remove short DNA fragments from dead cells to better utilise the matrix’s binding capacity. Lysing Matrix E (FastDNA Spin Kit for Soil) was added to the samples, and a MP Biomedicals FastPrep-24 Classic Instrument (Thermo Fischer Scientific, Karlsruhe, Germany) was used for homogenisation at 20 s and 6 m/s. The samples were placed immediately on ice afterwards. Increased shearing time (e.g., 2 × 20 s) led to decreased DNA fragment length, while not visibly improving the total yield on an agarose gel. Reduced shearing force (e.g., 4 or 5 m/s) led to decreased yield, with no or minor fragment length improvements (decreased yield could also indicate incomplete DNA extraction). DNA yield was judged on the basis of electrophoresis results in order to favour high yield in longer DNA fragment ranges and measurement of double-stranded DNA (dsDNA) via Qubit.
Before proceeding with protein precipitation, we added a 5 min RNase incubation step. Furthermore, we tested two different washing solutions for the washing steps: “HA-wash solution” (see [19]) and SEWS-M (FastDNA Spin Kit for Soil). Introducing the additional HA-wash solution step improved the overall DNA fragment length and total yield. More washing steps significantly reduced the total yield. After DNA retrieval, a subsequent “pre-cleaning” step was added using magnetic beads (either AMPure or Highprep beads) to further reduce short fragments and possible impurities from the biogas or wastewater samples before library preparation. Samples were temporarily stored at 4 °C before library preparation (freezing of isolated DNA was omitted as it causes DNA shearing).

2.2. Library Preparation

Library preparation with the LSK-108 Kit was performed according to the protocol [20]. This is a modified version of the standard nanopore library preparation by ligation for the LSK-108 Kit, which served here as an additional reduction in DNA shearing in comparison with the default protocol for library preparation. Library preparation with the SQK-LSK109 Kit was carried out according to the “Genomic DNA by Ligation (SQK-LSK109)” protocol from community.nanoporetech.com. We increased the incubation times for “DNA repair” and “end prep” to 20 min each. We used 1.2–1.4 µg of input DNA for library preparation, assuming an average DNA length of 5000 bp for the DNA fragments after bead beating. Higher DNA amounts led to a decrease in pore activity and a decrease in total yield.

2.3. Sequencing

All samples were sequenced using a MinION Sequencer for 72 h or until no sequencing activity was observed, using either an R.4.9.1 or R.4.9 flow cell (FLO-MIN106) for each sample. We used the MinKNOW software with active channel selection enabled and basecalling deactivated. We performed a “flow cell-refuel” step after approximately 18-20 h of runtime by adding 75 µL of a 1:1 water-SQB-Buffer (SQB = Sequencing Buffer) mixture to the flow cell via the SpotON port. SQB-Buffer is part of the Oxford-Nanopore SQK-LSK109 Kit. Illumina sequencing was performed on a NovaSeq6000 Sequencer (NovaSeq Control Software 1.6.0/RTA v3.4.4) in a 2 × 151 set-up using precisely the same DNA material as was used for nanopore sequencing. Library preparation (350 bp option) was performed via Illumina TruSeq PCR-free.
Information on data availability can be found in the Appendix A.

2.4. Bioinformatic Tools

Basecalling was performed using the GPU (graphics processing unit) accelerated guppy basecaller with the high accuracy model and adapter trimming (available at https://nanoporetech.com). Read quality was analysed using nanoplot v1.0.0 (https://github.com/wdecoster/NanoPlot). Taxonomic classification of each read was performed using centrifuge v1.0.4 [21] with the National Center for Biotechnology Information (NCBI) RefSeq index from (https://ccb.jhu.edu/software/centrifuge/), the Genome Taxonomy Database (GTDB) index from https://monash.figshare.com/articles/GTDB_r89_54k/8956970 [22], and an index from 24,706 bacterial and archaeal representative species [23]. The centrifuge output was filtered by only including read classifications that met the centrifuge score of at least 250 and length of at least 150 bp for nanopore. The kmer size was set to 16 for nanopore, and 22 (default) for Illumina reads. The results were converted via “centrifuge-kreport” and plotted via R using ggballoonplot (ggpubr) to compare abundance across biogas reactors.

3. Results

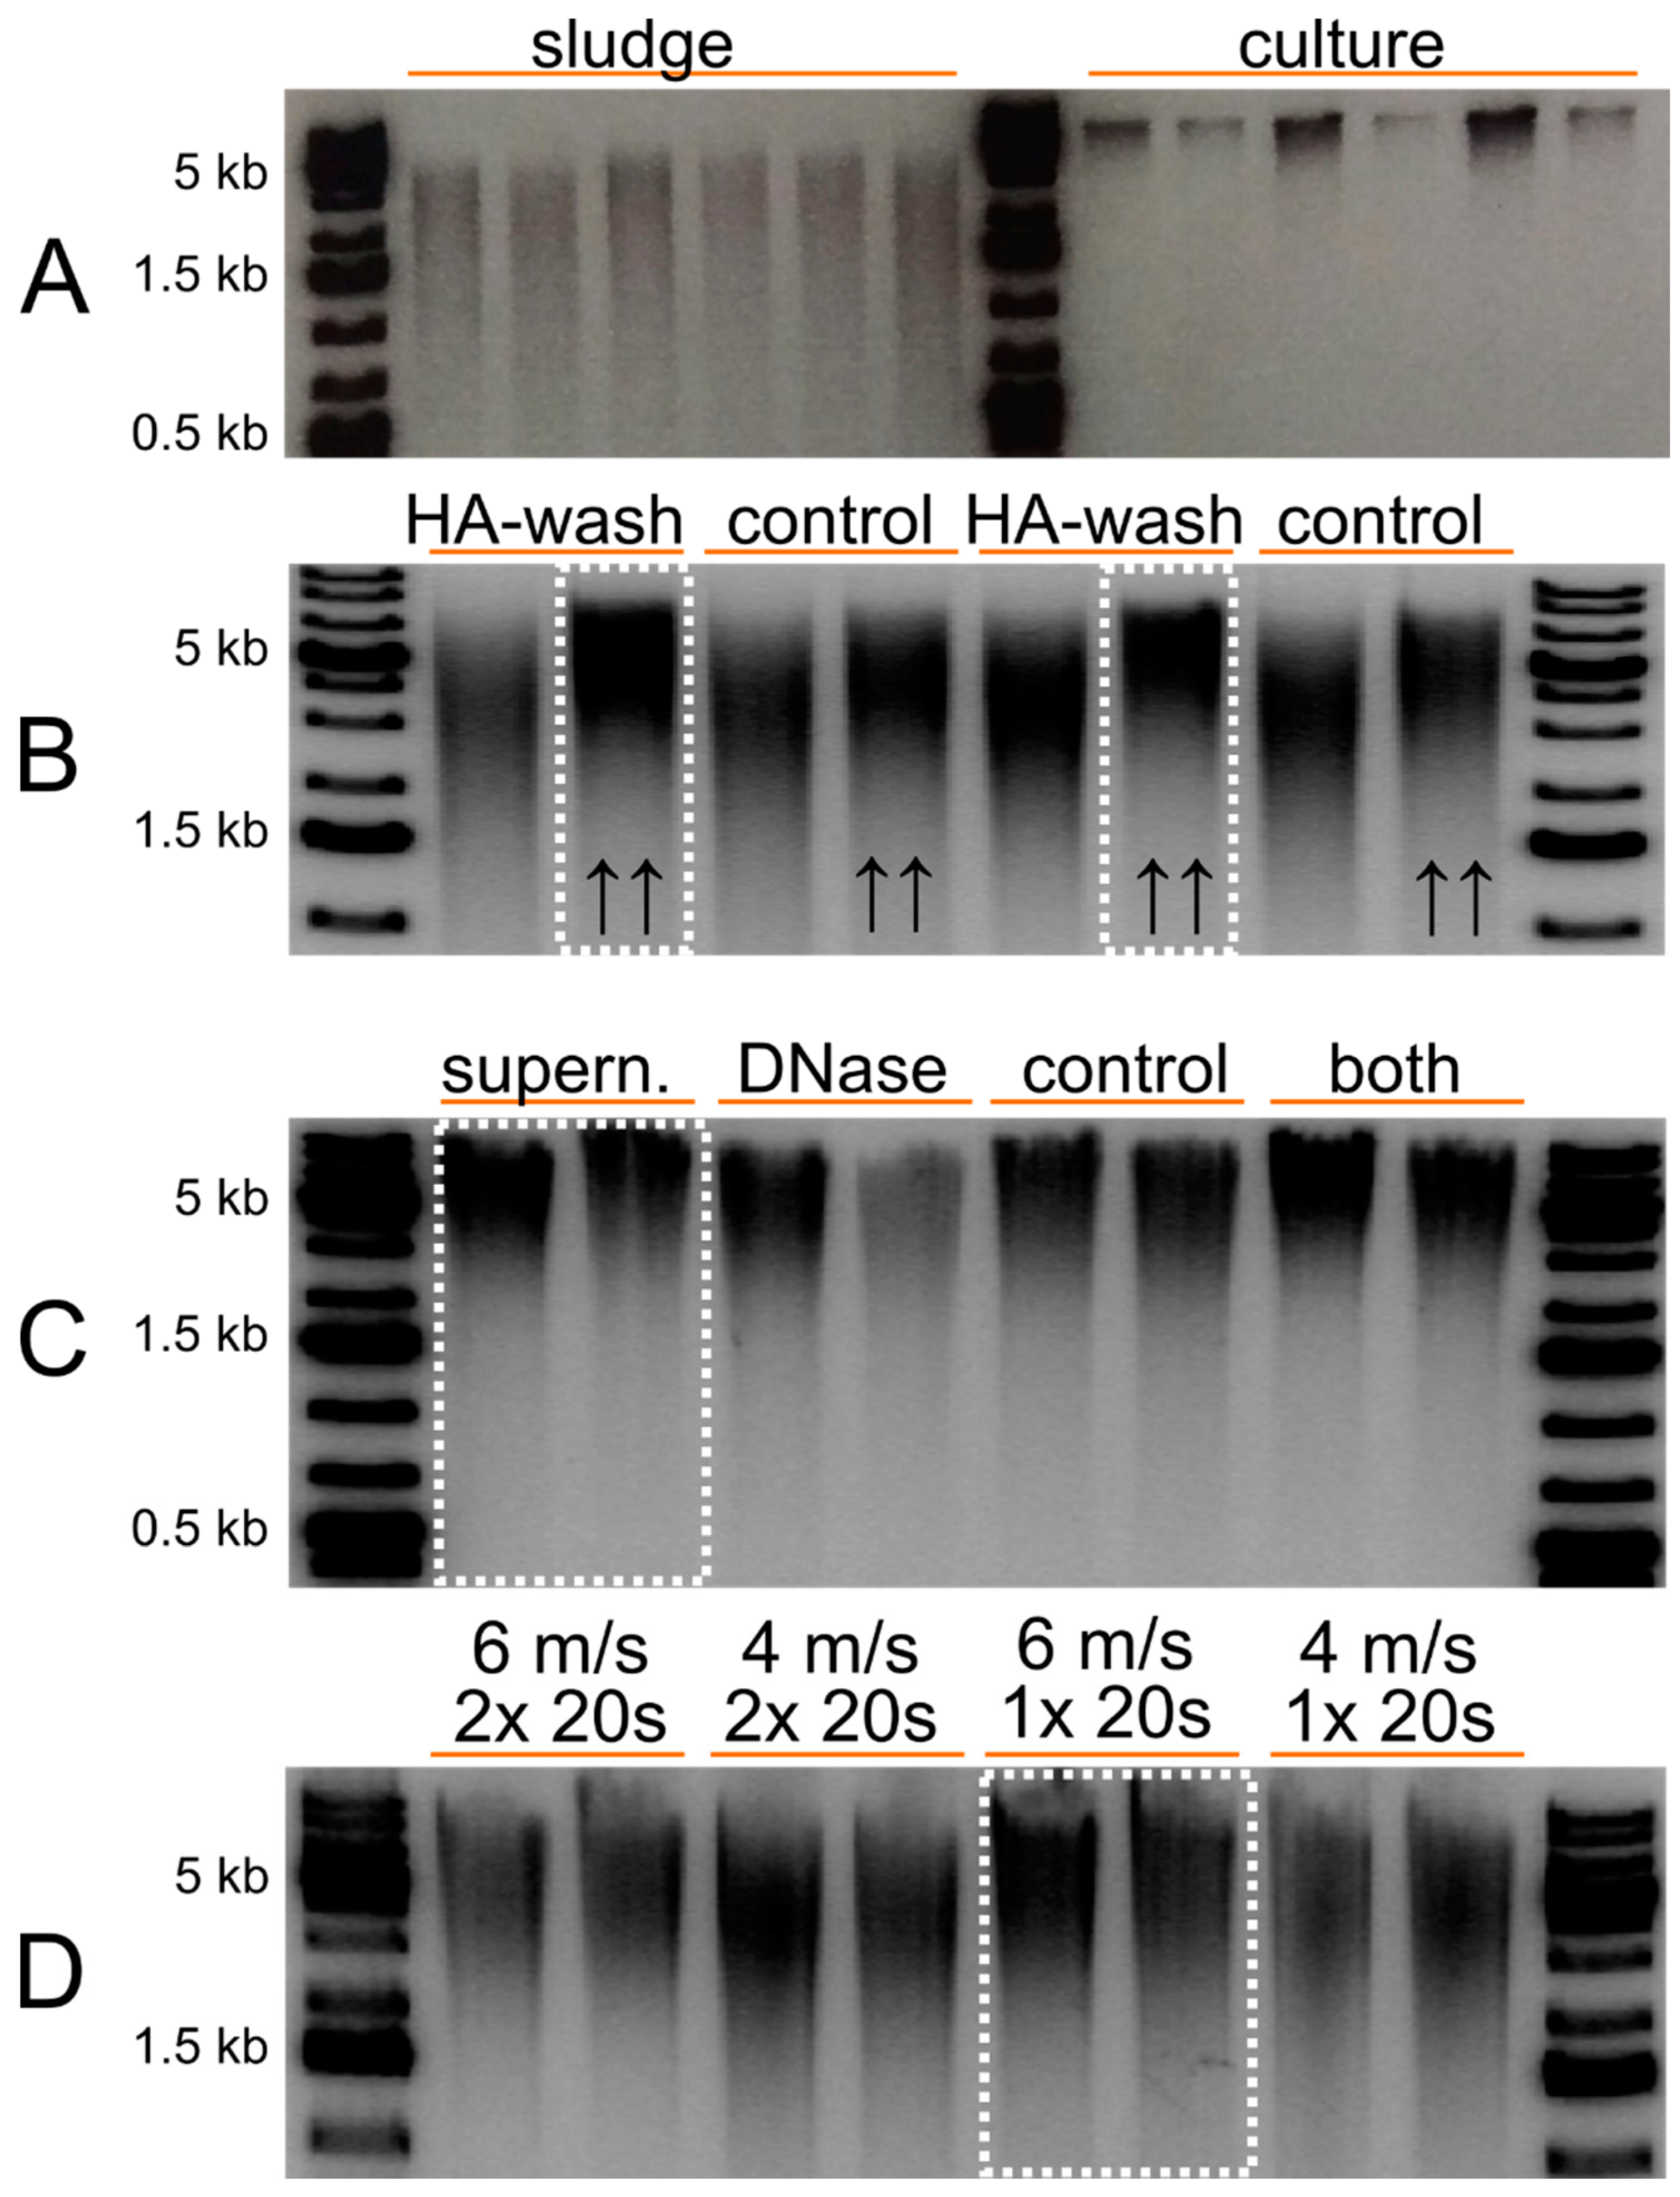
3.1. Digestate Samples and DNA Isolation

We isolated DNA from digestates retrieved from 17 biogas plants, 2 wastewater treatment plants (WWTP), and 1 laboratory-scale reactor, all located in either Sweden (SW) or Germany (GER). These AD processes were chosen as they use conventional feedstocks/substrates such as organic household waste, slaughterhouse waste, manure, sewage sludge, and agricultural products (Table 1). Thirteen operate under mesophilic temperature (37–42 °C), three under hyper-mesophilic temperature (44 °C), and four under thermophilic temperature (48–52 °C) (Table 1). The digestate samples, hereafter referred to simply as samples, were taken directly from the methanogenic reactors without any further storage. All German and one Swedish sludge sample(s) were pre-frozen for transportation.
The DNA isolation protocol described in this work was pre-tested and optimised on sample 01-SW before being applied to the other 19 reactor samples. Sample 01-SW was from a laboratory-scale reactor mimicking the operation of a large-scale biogas plant. The protocol was optimised for the largest possible DNA fragment length and high DNA purity for optimal nanopore activity and sequencing yield. The full protocol, with each step described in detail, is made available online at protocols.io [19]. The protocol includes all necessary and optimised steps to improve DNA yield and length, with brief explanations. The most significant improvements in overall DNA yield and length are shown in Figure 1. Each DNA isolation was performed in duplicate, and the average concentrations are summarised in Table 1. The concentration differences between the duplicates were less than 50 ng/µL in all cases. An average of around 350 ng/µL dsDNA could be retrieved via this protocol across all reactor samples.
In brief, we first compared the reactor sample with controlled-growth culture samples using the DNA isolation kit from the FastDNA Spin Kit for Soil (MP Biomedicals) according to the manufacturer. As expected, we observed more digested DNA in the sludge samples, with significantly lower DNA length to yield ratio than in the cultures (Figure 1A). To improve overall DNA yield and fragment length, we modified the washing steps and the total amount of sludge sample used. The DNA yield could be slightly increased by increasing the amount of sludge used. Performing an additional humic acid (HA) washing step improved the yield and reduced the number of smaller DNA fragments. Both steps combined yielded the best overall results (Figure 1B). More additional washing steps with the default buffer did not improve the results further (data not shown).
The reactor samples contained large amounts of degraded DNA due to the high biological activity in AD. These small fragments negatively impact the overall sequencing performance and the total sequencing yield. Centrifugation of the samples and replacing the supernatant with distilled water significantly reduced the amount of degraded DNA (Figure 1C). DNase treatment and inactivation before DNA isolation reduced the DNA smear, but in one case also reduced the overall yield during DNA isolation (sample lane 4 in Figure 1C). Thus, DNase treatment seems unsuitable for achieving a stable and reproducible protocol in this case.
Another influencing factor was the bead beating settings. We achieved the best results using a force of 6 m/s once for 20 s with a FastPrep-24 Classic Instrument (MP Biomedicals) (Figure 1D). We strongly recommend re-evaluating the force if another device is used for performing beat beating. To remove small DNA fragments (<1000 bp) produced during bead beating, we cleaned up the DNA sample using magnetic beads (0.35:1 ratio of beads to sample). This solid-phase reversible immobilisation binds DNA fragments by size in favour of long fragments if the bead-to-sample ratio is reduced, similar to PCR clean up protocols. This step also removed other impurities that may remain after DNA isolation.

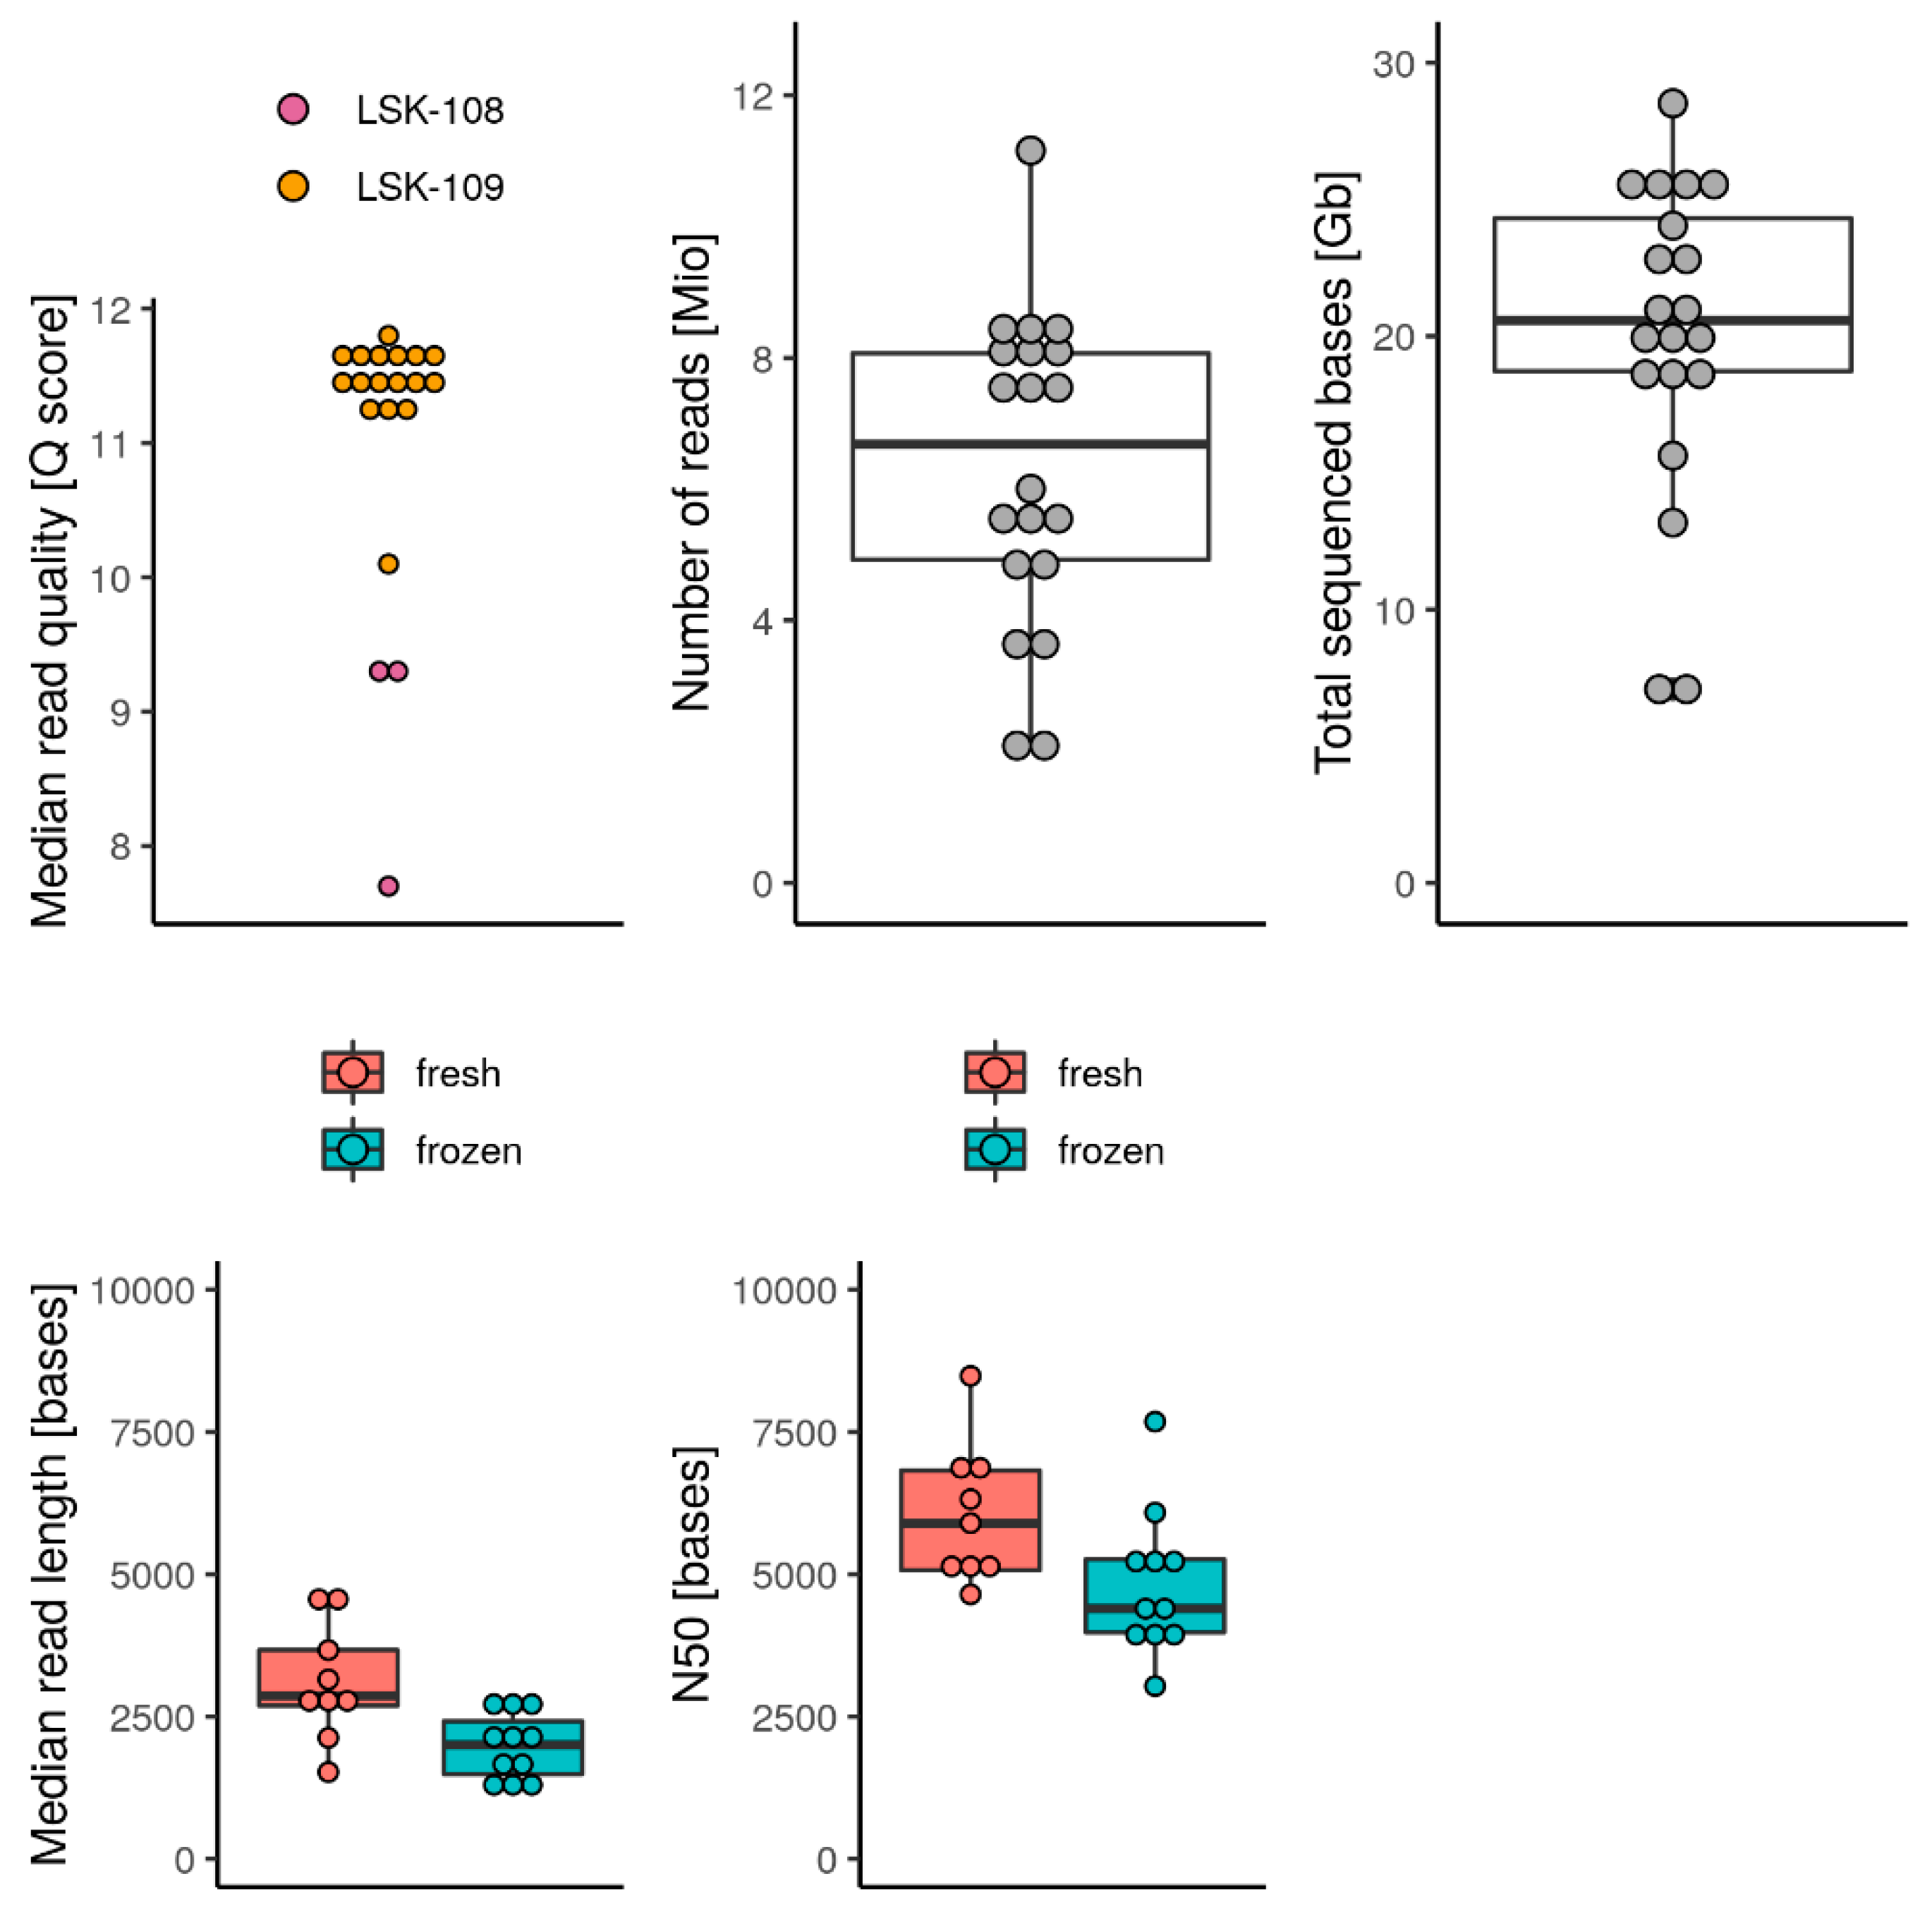
3.2. Sequencing Yield and Quality of Metagenomic DNA

The optimised DNA isolation protocol [19] was applied to all 20 digestate samples (Table 1) using a MinION device (Oxford Nanopore Technologies, Oxford, UK) with a single flow cell for each DNA sample. We initially used the LSK-108 Kit but changed later to the LSK-109 Kit as we observed better sequencing performance. Figure 2 summarises the sequencing results and the quality scores obtained.
We observed a slight decrease in N50 and median read length for pre-frozen samples compared with fresh samples. Sequencing runs via LSK-108 Kits were also performed using flow cells stored for 2 months or longer, which is likely the main reason for the decrease in median Q-score. We did not observe a Q-score reduction of pre-frozen samples on the basis of sample age. Total sequencing yield varied between 18.2 and 28.5 Gb for most samples and, across all samples, we achieved an average of 20.5 Gb. Total sequencing yield was below 10 Gb for only 2 of the 20 samples (03-SW and 04-SW). An average of 6.3 Mio reads per sample could be retrieved while two samples (03-SW and 04-SW) had only 2.1 and 2.0 Mio reads.
The genus-level richness can be approximately reached with a sequencing depth of at least 1 million reads per sample while using centrifuge [24]. Thus, the DNA isolation protocol presented here yields sufficient DNA from an “amount of reads” perspective for nanopore sequencing and an adequate number of long reads in all cases tested. For direct comparison between nanopore and Illumina, we generated an average of 23.5 Mio Illumina reads (corresponds to an average of 7 Gb per sample) using the same DNA sample. Illumina had, on average, 3.7 times more reads per sample but 2.9 times less sequencing yield in Gb (7.1 Gb to 20.5 Gb).

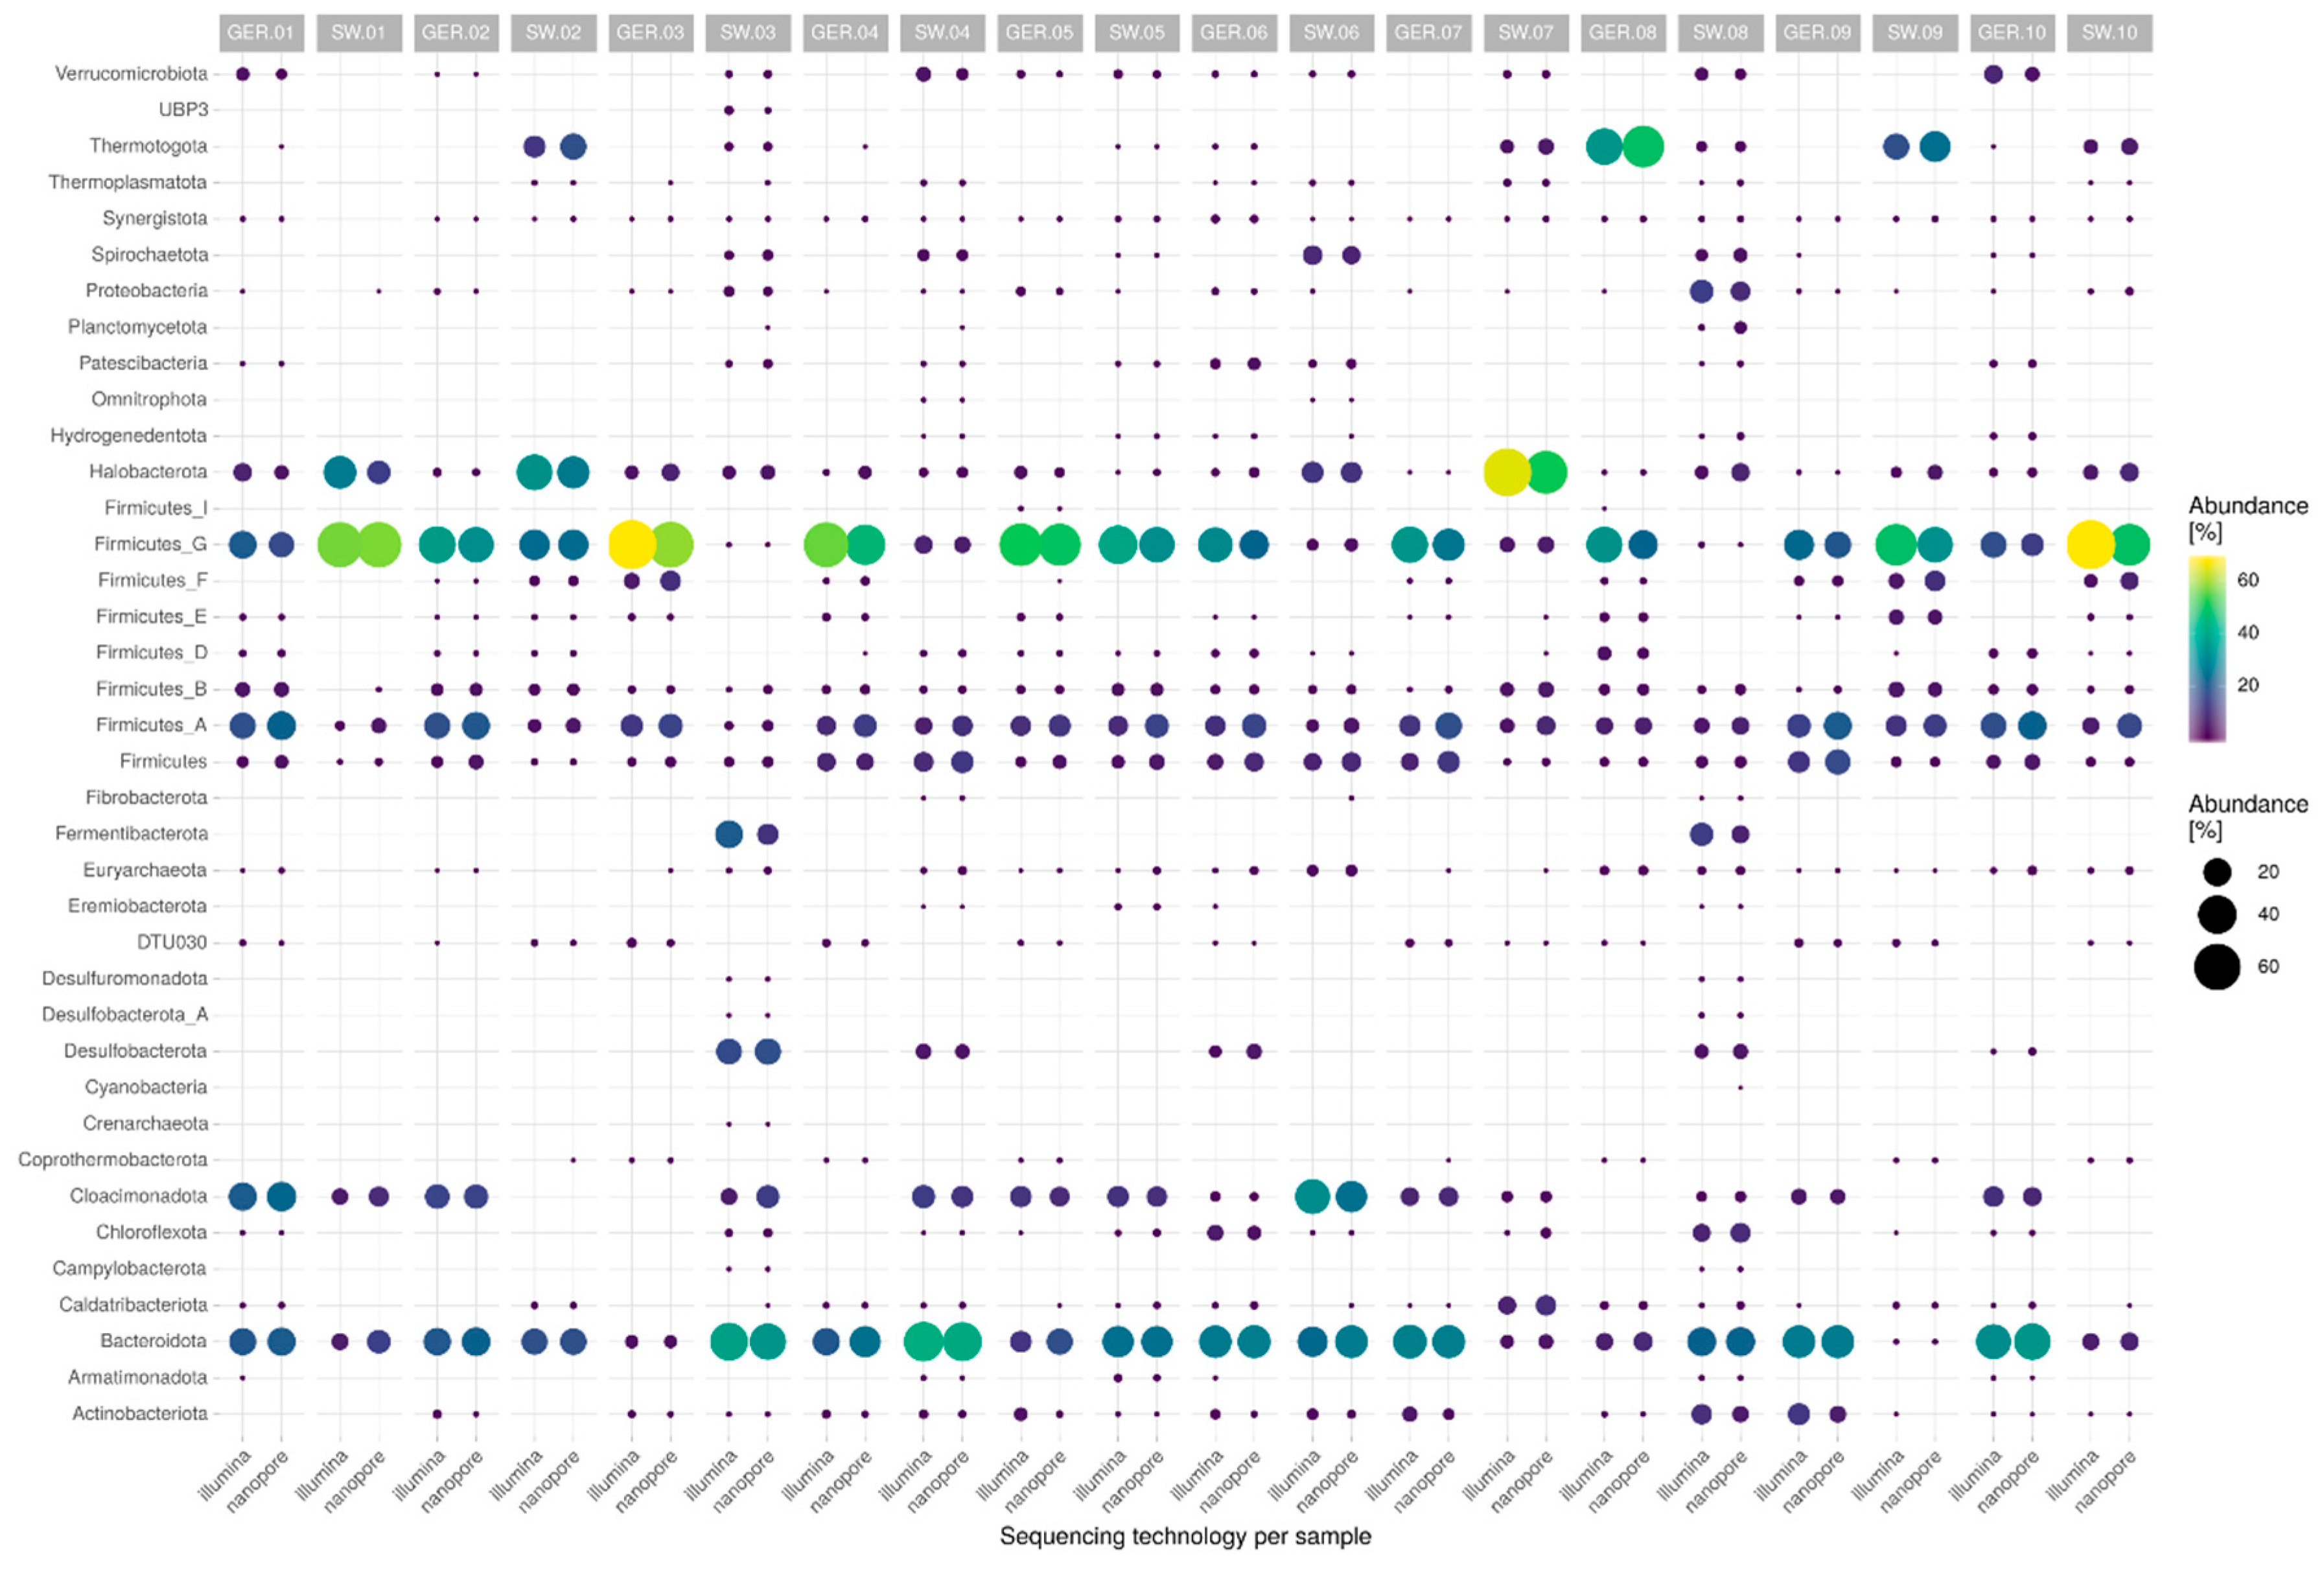
3.3. Abundance Estimation and Taxonomic Read Classification

Classifying as many reads as possible is essential to achieve the best characterisation and abundance estimates for the microbial community. To this end, we used the Centrifuge software for the taxonomic classification because it allows for smaller sub-sequence size matches (kmers) to consider the higher error profile of long reads [21]. We also applied three different taxonomic indices: the default NCBI RefSeq supplied by the centrifuge developer (https://ccb.jhu.edu/software/centrifuge/manual.shtml; 3.3 k compressed references), the GTDB index (GTDB version r89, de-replicated to 54 k genomes) from Méric et al. [22], and a GTDB index based on 24.7 k bacterial and archaeal representative species from Parks et al. [23]. Figure 3 gives an overview of the proportion of reads classified for each taxonomic index at phylum, genus, and species level.
In all cases, we achieved a dramatic increase (range of 1.8- to 13-fold) in the proportion of classified reads when using the GTDB index rather than the RefSeq index. In particular, improvements were obtained for samples 05-GER, 04-SW, 04-GER, and 03-GER (11.5- to 13.2-fold increase in classified reads). We did not observe any noticeable decrease in classified reads when comparing phylum to genus or species level. The average proportion of classified reads was 8.8% of all reads on the genus taxon using the RefSeq database and 42.11% using the “GTDB-Méric” index. These results correspond to a median 4.8-fold increase in classified reads across all samples. For the reactors with a 10-fold or higher increase, we are able to have a more meaningful observation of the actual bacterial/archaeal composition. A slightly higher proportion of classified Illumina reads could be observed in most samples compared to nanopore reads. On the basis of these results, we subjected all samples to further abundance analysis based on the “GTDB-Méric” index, with abundance calculated on the basis of the proportion of classified taxonomic reads in all classified reads. The results obtained at the phylum taxon are shown in Figure 4 and the results at the genus taxon in Figure S1.
In general, we identified a wide range of different phyla via GTDB, especially for Firmicutes, due to more species clusters—which includes meta-assembled genomes—with corrected taxonomic lineages. This increased taxonomic granularity at phylum taxon provided better resolution, especially for Firmicutes, thus improving tracking of changes. As the case for biogas processes, Bacteroidota (NCBI: Bacteroidetes) and Firmicutes_G and A (NCBI: Firmicutes) were the dominant phyla in most samples [25]. Thermotogota, a phylum frequently found in systems operating at higher temperatures [25], was highly abundant in three of the four thermophilic reactors (02-SW, 09-SW, and 08-GER). Euryarchaeota, including methanogens, represented less than 10% of the total classified reads, as frequently described previously for biogas processes [25].
Both sequencing methods were additionally compared against each other on the basis of their taxonomic genus classifications (see Figure S1). In summary, Illumina identified 999 genus taxons, while nanopore identified 1183 genus taxons across all 20 samples. They both agreed on 945 taxons with an average abundance difference of 0.56% (median 0.15%). Disagreements (only one method identified a particular genus taxon in a sample) had an abundance of 0.49% or less for Illumina and 0.77% or less for nanopore only hits. The higher genus taxon assignments for nanopore reads might be attributed to the longer reads and the on average 2.9 times higher sequencing yield, even though the total amount of reads was on average 3.7 times less than Illumina reads.

4. Discussion

The overarching goal of this study was to develop a DNA purification protocol for evaluating whether classified reads obtained by a single nanopore sequencing run, as an alternative to 16S rRNA studies or Illumina sequencing, sufficiently characterise microbial community abundance in AD reactors. We evaluated and adjusted all the steps necessary, from DNA extraction to abundance estimation, and compared the results to Illumina sequencing.

4.1. DNA Isolation and Sequencing

The protocol devised was able to produce a sufficient amount and purity of DNA for nanopore sequencing. The intended use of the protocol is to estimate the microbial abundance of any given AD process, enabling conclusions or correlations between microorganisms and reactor stability and process efficiency to be identified. Therefore, consistent DNA isolation and retrieval were favoured, which is usually achieved by mechanical shearing. The presence of matter, sediments, solids, and other particles in samples from AD reactors may affect the overall shearing force during bead beating. The resulting variation in total DNA fragment length may impact total yield during sequencing. Using a simple chemical approach for “matter absent” cultures (e.g., cultured in LB-media) could be more favourable if the aim is to obtain longer DNA fragments for a particular species of interest.
We observed that sequencing runs were heavily negatively impacted if many tiny fragments were present and sequenced. They negatively impacted library preparation and the subsequent sequencing run. We, therefore, introduced a magnetic bead-based purification step directly after DNA isolation in order to remove these tiny DNA fragments similar to PCR clean up steps. Due to the already small size of DNA fragments in general (read median ≈ 2500 bp), we did not consider other solutions to remove short DNA fragments, such as the Short Read Eliminator Kit (Circulomics) or Fire Monkey Kit (RevoluGen).

4.2. Database Choice and Abundance Estimation

We applied the metagenomic approach to samples from 20 different reactors in order to estimate the classification performance for different AD types. In general, the phylum-level estimates obtained in this work are in line with findings in 16S rRNA studies and MAG (metagenome-assembled genomes) studies pointing to Firmicutes and Bacteroidetes as the main phyla for most AD processes [5,18,25]. They are also in line with Campanaro et al., who identified 790 Firmicutes MAGs among 1600 public available MAGs from ADs [3]. Sun et al. identified mainly Bacteroidetes (17–70%), followed by Firmicutes (5–10%), in five samples from WWTP [26]. The main drawback of 16S rRNA studies is the lack of information on how much of the population might be missing after the targeted PCR amplification, as primers are biased against certain taxons. Therefore, it is difficult to compare the performance of 16S rRNA with that of a metagenomic approach outside standard microbial community samples in a meaningful way.
While we observed varying performance during sequencing, we were able to use all runs to classify from 25% to 66% of all reads using the GTDB database from Méric et al. [22]. The RefSeq index, on the other hand, did not yield a sufficient amount of taxonomic classification for most samples and is therefore not suitable for abundance tracking in AD. This is mainly attributed to the fact that RefSeq is a smaller database in general and does not include meta-assembled genomes. Still, most organisms in ADs are difficult to cultivate outside of a microbial community for characterisation via whole-genome sequencing. The additional species clusters of GTDB improved the overall resolution, particularly for Firmicutes. In general, indices based on a large number of phylogenetically coherent taxonomic species definitions significantly increase the number of classified reads [22]. Publicly available indices are becoming increasingly important for metagenomic research. De-replication of such an enormous amount of genomes is time-consuming and challenging to compute without access to computation clusters or cloud computing.
Eukaryotic cells from, e.g., fungi and plants are not included in GTDB and possibly represent part of the unclassified number of reads. Inclusion of eukaryotic cells, including anaerobic fungi [27], in taxonomic read classification remains challenging, mainly due to the large genome size and the resulting index size. DNA remains of cells (e.g., plants) could be expected within AD reactor samples due to the organic substrate used. Moreover, phage DNA or plasmid DNA would not be classified in most cases [28]. We suspect that there are also other currently unknown bacteria or archaea hidden within the unclassified reads.
Some limitations of the study must be noted. We observed false-positive hits with less than 0.1% abundance for closely related species while validating the centrifuge parameters for taxonomic read classification on datasets of Zymoclean mock communities (GridION data from https://lomanlab.github.io/mockcommunity/). The higher read error rate probably contributed to false-positive hits. A plausible explanation is that higher error rates could introduce erroneous kmers that are more similar to another species of the same genus. In any case, we included a taxon only if the relative abundance for a given taxon amounted to more than 0.1% of all classified reads in order to mitigate false-positive results. Moreover, centrifuge was not explicitly developed for long reads. It may work better with Illumina reads than with nanopore reads due to the higher read error rate which, however, has been decreasing steadily.

5. Conclusions

Nanopore sequencing using the pocket-sized MinION device provides relatively cheap and readily available access to sequencing. Typical issues such as raw-read error rates have been improved in recent years. Our results demonstrated that “shallow sequenced” metagenomics is possible by maximising the extraction of taxonomic information via more suitable indices that allow abundance estimations. Sequencing at lower depth thus enables much cheaper comparison of multiple metagenomic samples. Metagenomes with many uncultivable microorganisms are especially appropriate for long-read sequencing technologies because these reads can achieve better completeness of a given genome. This facilitates recovery of complete microbial genomes, which is of high interest if the metagenome remains mainly unclassified when using indices such as GTDB. Applying other indices or methods (developed in the future) to identify eukaryotes would enable abundance tracking closer to the reality of any given microbial community. Further improvements in raw read quality in nanopore sequencing would provide more reliable species identification at lower abundances and could facility reactor monitoring with even fewer data.
The method requires a minimum of technical equipment and technician training and enables community monitoring across different time frames or process parameter changes. It may also reveal whether the number of unclassified reads increases or decreases under certain conditions, indicating whether the currently classified population size is increasing or decreasing. In the case of a decreasing classified population, another currently unclassified, but important, organism might be present.
The main differences in read classification between Illumina and nanopore sequencing were observed in shallow abundant organisms. In these cases, a greater depth of sequencing makes sense for a precise examination of these organisms in both cases. However, the chosen taxonomic index remains the most crucial influencing factor.
Nanopore sequencing provides a promising approach to establish a potential real-time correlation between the microbial community and the reactor stability/process efficiency. At the same time, it is possible to assess the functional potential of the samples. The use of automated and biogas reactor-specific monitoring tools, e.g., via machine learning, could help to predict upcoming inefficiency and disturbances.

Supplementary Materials

The following are available online at https://www.mdpi.com/2076-3417/10/21/7518/s1, Figure S1: Summary of abundance for samples from all 20 reactors, calculated on the basis of all classified reads for nanopore and Illumina sequencing (genus taxon).

Author Contributions

Conceptualization, C.B.; methodology, C.B.; software, C.B. and E.B.-R.; validation, C.B. and B.M.; formal analysis, C.B.; investigation, C.B.; resources, C.B., E.B.-R., and B.M.; data curation, C.B.; writing—original draft preparation, C.B.; writing—review and editing, C.B., E.B.-R., and B.M.; visualization, C.B.; supervision, C.B.; project administration, B.M.; funding acquisition, C.B. All authors have read and agreed to the published version of the manuscript.

Funding

This study was funded by the Deutsche Forschungsgemeinschaft (DFG, German Research Foundation) BR 5692/1-1 and BR 5692/1-2. The material is based upon work supported by Google Cloud. B.M. was supported by FORMAS, grant number 942-2015-1008. The funder had no role in study design, data collection and analysis, decision to publish, or preparation of the manuscript.

Acknowledgments

We are grateful to Michael Lebuhn, Anna Schnürer, and Sabine Kleinsteuber for providing us with the reactor samples for this work.

Conflicts of Interest

The authors declare no conflict of interest.

Appendix A

The DNA isolation protocol is accessible via dx.doi.org/10.17504/protocols.io.5feg3je.
All the nanopore and Illumina reads are available on ENA (European Nucleotide Archive) under project number PRJEB34573.

References

  1. Campanaro, S.; Treu, L.; Kougias, P.G.; Luo, G.; Angelidaki, I. Metagenomic binning reveals the functional roles of core abundant microorganisms in twelve full-scale biogas plants. Water Res. 2018, 140, 123–134. [Google Scholar] [CrossRef] [PubMed]
  2. Ziganshin, A.M.; Ziganshina, E.E.; Kleinsteuber, S.; Nikolausz, M. Comparative Analysis of Methanogenic Communities in Different Laboratory-Scale Anaerobic Digesters. Archaea 2016, 2016, 3401272. [Google Scholar] [CrossRef] [PubMed]
  3. Campanaro, S.; Treu, L.; Rodriguez-R, L.M.; Kovalovszki, A.; Ziels, R.M.; Maus, I.; Zhu, X.; Kougias, P.G.; Basile, A.; Luo, G.; et al. The anaerobic digestion microbiome: A collection of 1600 metagenome-assembled genomes shows high species diversity related to methane production. bioRxiv 2019, 680553. [Google Scholar] [CrossRef]
  4. Krause, L.; Diaz, N.N.; Edwards, R.A.; Gartemann, K.-H.; Krömeke, H.; Neuweger, H.; Pühler, A.; Runte, K.J.; Schlüter, A.; Stoye, J.; et al. Taxonomic composition and gene content of a methane-producing microbial community isolated from a biogas reactor. J. Biotechnol. 2008, 136, 91–101. [Google Scholar] [CrossRef]
  5. Stolze, Y.; Bremges, A.; Rumming, M.; Henke, C.; Maus, I.; Pühler, A.; Sczyrba, A.; Schlüter, A. Identification and genome reconstruction of abundant distinct taxa in microbiomes from one thermophilic and three mesophilic production-scale biogas plants. Biotechnol. Biofuels 2016, 9, 156. [Google Scholar] [CrossRef] [Green Version]
  6. Klindworth, A.; Pruesse, E.; Schweer, T.; Peplies, J.; Quast, C.; Horn, M.; Glöckner, F.O. Evaluation of general 16S ribosomal RNA gene PCR primers for classical and next-generation sequencing-based diversity studies. Nucleic Acids Res. 2013, 41, e1. [Google Scholar] [CrossRef]
  7. Suzuki, M.T.; Giovannoni, S.J. Bias caused by template annealing in the amplification of mixtures of 16S rRNA genes by PCR. Appl. Environ. Microbiol. 1996, 62, 625–630. [Google Scholar] [CrossRef] [Green Version]
  8. Acinas, S.G.; Sarma-Rupavtarm, R.; Klepac-Ceraj, V.; Polz, M.F. PCR-induced sequence artifacts and bias: Insights from comparison of two 16S rRNA clone libraries constructed from the same sample. Appl. Environ. Microbiol. 2005, 71, 8966–8969. [Google Scholar] [CrossRef] [Green Version]
  9. Teng, F.; Darveekaran Nair, S.S.; Zhu, P.; Li, S.; Huang, S.; Li, X.; Xu, J.; Yang, F. Impact of DNA extraction method and targeted 16S-rRNA hypervariable region on oral microbiota profiling. Sci. Rep. 2018, 8. [Google Scholar] [CrossRef]
  10. Louca, S.; Doebeli, M.; Parfrey, L.W. Correcting for 16S rRNA gene copy numbers in microbiome surveys remains an unsolved problem. Microbiome 2018, 6. [Google Scholar] [CrossRef]
  11. Krehenwinkel, H.; Wolf, M.; Lim, J.Y.; Rominger, A.J.; Simison, W.B.; Gillespie, R.G. Estimating and mitigating amplification bias in qualitative and quantitative arthropod metabarcoding. Sci. Rep. 2017, 7, 17668. [Google Scholar] [CrossRef] [PubMed] [Green Version]
  12. Quince, C.; Walker, A.W.; Simpson, J.T.; Loman, N.J.; Segata, N. Shotgun metagenomics, from sampling to analysis. Nat. Biotechnol. 2017, 35, 833–844. [Google Scholar] [CrossRef] [PubMed] [Green Version]
  13. Pearman, W.S.; Freed, N.E.; Silander, O.K. The advantages and disadvantages of short- and long-read metagenomics to infer bacterial and eukaryotic community composition. bioRxiv 2019, 650788. [Google Scholar] [CrossRef] [Green Version]
  14. Sanderson, N.D.; Street, T.L.; Foster, D.; Swann, J.; Atkins, B.L.; Brent, A.J.; McNally, M.A.; Oakley, S.; Taylor, A.; Peto, T.E.A.; et al. Real-time analysis of nanopore-based metagenomic sequencing from infected orthopaedic devices. BMC Genom. 2018, 19, 714. [Google Scholar] [CrossRef] [Green Version]
  15. Somerville, V.; Lutz, S.; Schmid, M.; Frei, D.; Moser, A.; Irmler, S.; Frey, J.E.; Ahrens, C.H. Long read-based de novo assembly of low complex metagenome samples results in finished genomes and reveals insights into strain diversity and an active phage system. bioRxiv 2018, 476747. [Google Scholar] [CrossRef] [Green Version]
  16. Nicholls, S.M.; Quick, J.C.; Tang, S.; Loman, N.J. Ultra-deep, long-read nanopore sequencing of mock microbial community standards. Gigascience 2019, 8. [Google Scholar] [CrossRef]
  17. De Boer, R.; Peters, R.; Gierveld, S.; Schuurman, T.; Kooistra-Smid, M.; Savelkoul, P. Improved detection of microbial DNA after bead-beating before DNA isolation. J. Microbiol. Methods 2010, 80, 209–211. [Google Scholar] [CrossRef]
  18. Güllert, S.; Fischer, M.A.; Turaev, D.; Noebauer, B.; Ilmberger, N.; Wemheuer, B.; Alawi, M.; Rattei, T.; Daniel, R.; Schmitz, R.A.; et al. Deep metagenome and metatranscriptome analyses of microbial communities affiliated with an industrial biogas fermenter, a cow rumen, and elephant feces reveal major differences in carbohydrate hydrolysis strategies. Biotechnol. Biofuels 2016, 9, 121. [Google Scholar] [CrossRef] [Green Version]
  19. Brandt, C. Long-read DNA Preparation for Metagenomic Samples. ProtocolsIo 2019. [Google Scholar] [CrossRef]
  20. Quick, J. One-pot Ligation Protocol for Oxford Nanopore Libraries. ProtocolsIo 2018. [Google Scholar] [CrossRef]
  21. Kim, D.; Song, L.; Breitwieser, F.P.; Salzberg, S.L. Centrifuge: Rapid and sensitive classification of metagenomic sequences. Genome Res. 2016, 26, 1721–1729. [Google Scholar] [CrossRef] [PubMed] [Green Version]
  22. Méric, G.; Wick, R.R.; Watts, S.C.; Holt, K.E.; Inouye, M. Correcting index databases improves metagenomic studies. bioRxiv 2019, 712166. [Google Scholar] [CrossRef]
  23. Parks, D.H.; Chuvochina, M.; Chaumeil, P.-A.; Rinke, C.; Mussig, A.J.; Hugenholtz, P. Selection of representative genomes for 24,706 bacterial and archaeal species clusters provide a complete genome-based taxonomy. bioRxiv 2019, 771964. [Google Scholar] [CrossRef] [Green Version]
  24. Gweon, H.S.; Shaw, L.P.; Swann, J.; De Maio, N.; AbuOun, M.; Niehus, R.; Hubbard, A.T.M.; Bowes, M.J.; Bailey, M.J.; Peto, T.E.A.; et al. The impact of sequencing depth on the inferred taxonomic composition and AMR gene content of metagenomic samples. Environ. Microbiome 2019, 14, 7. [Google Scholar] [CrossRef] [Green Version]
  25. Westerholm, M.; Schnürer, A. Microbial Responses to Different Operating Practices for Biogas Production Systems. Anaerob. Dig. 2019. [Google Scholar] [CrossRef] [Green Version]
  26. Sun, L.; Liu, T.; Müller, B.; Schnürer, A. The microbial community structure in industrial biogas plants influences the degradation rate of straw and cellulose in batch tests. Biotechnol. Biofuels 2016, 9, 128. [Google Scholar] [CrossRef] [Green Version]
  27. Kazda, M.; Langer, S.; Bengelsdorf, F.R. Fungi open new possibilities for anaerobic fermentation of organic residues. Energy Sustain. Soc. 2014, 4, 6. [Google Scholar] [CrossRef]
  28. Stalder, T.; Press, M.O.; Sullivan, S.; Liachko, I.; Top, E.M. Linking the resistome and plasmidome to the microbiome. ISME J. 2019, 13, 2437–2446. [Google Scholar] [CrossRef] [Green Version]
Figure 1. Effect on DNA quality of different steps during isolation. White boxes indicate the chosen approach for the DNA isolation protocol. (A) Default manufacturer’s protocol applied to (left) sludge and (right) controlled growth cultures. (B) DNA yield/length after the introduction of a humic acid removal wash (HA-wash) step. Arrows indicate the use of 0.4 mL sludge instead of 0.2 mL. (C) Pre-preparation of sludge and effect on DNA yield/length. (supern.: supernatant removed and replaced with water; DNase: sample pretreated with DNase; control: no pre-preparation; both: supernatant replaced with water and incubated with DNase). (D) Impact of different bead beating settings on DNA yield/fragment length.
Applsci 10 07518 g001
Figure 2. Summary of all 20 sequence runs of biogas reactor samples using the MinION device. Different colours indicate properties that influenced quality parameters.
Applsci 10 07518 g002
Figure 3. Proportion of taxonomically classified reads of each reactor sample at phylum, genus, and species levels after filtering. The four columns for each reactor represent different read classification approaches. The first bar represents Illumina reads using the Genome Taxonomy Database (GTDB)-Méric index for direct comparison against nanopore sequencing.
Applsci 10 07518 g003
Figure 4. Summary of abundance for samples from all 20 reactors, calculated on the basis of all classified reads for nanopore and Illumina sequencing. Only phyla with at least 0.1% abundance are shown (circles). The size and colour of each circle correspond to the abundance of each phylum in each reactor. Taxonomic names are based on GTDB version r89 (https://gtdb.ecogenomic.org), which includes “placeholder” names such as Firmicutes_A. DTU030 corresponds to the National Center for Biotechnology Information (NCBI) phylum Firmicutes. UBP3 corresponds to “bacteria” classification via NCBI. The reactor samples are described in detail in Table 1.
Applsci 10 07518 g004
Table 1. Main substrate and temperature conditions in the 20 anaerobic digestion processes analysed in this work. The concentration of double-stranded DNA (dsDNA) after the DNA isolation and prior library preparation is also given as an average.
Sample IDSubstrateOperationStatusc(dsDNA) (ng/µL)
Organic Household WasteSlaughter-House WasteManureSewage SludgeGreen +-Based
Sweden01-SW #o MesophilicFresh250
02-SWoo ThermophilicFresh450
03-SW o MesophilicFresh200
04-SW o MesophilicFresh366
05-SW oMesophilicFrozen362
06-SW oMesophilicFresh748
07-SWoo MesophilicFresh436
08-SW o MesophilicFresh454
09-SWoo ThermophilicFresh418
10-SW o MesophilicFresh228
Germany01-GER oMesophilicFrozen533
02-GER o oHyper-mesophilicFrozen282
03-GER o oHyper-mesophilicFrozen410
04-GER o oThermophilicFrozen594
05-GER o oHyper-mesophilicFrozen190
06-GER o oMesophilicFrozen242
07-GER * o oMesophilicFrozen106
08-GERo oThermophilicFrozen64
09-GER * o oMesophilicFrozen260
10-GER o oMesophilicFrozen320
# Laboratory-scale reactor. + Mainly crop residues, grass, and/or silages. * Digestate samples retrieved from reactors operated in parallel at the same biogas plant.
Publisher’s Note: MDPI stays neutral with regard to jurisdictional claims in published maps and institutional affiliations.

