Isotherms, Kinetics, and Thermodynamics of NH4+ Adsorption in Raw Liquid Manure by Using Natural Chabazite Zeolite-Rich Tuff


 , , and
Abstract
:1. Introduction
2. Materials and Methods
2.1. Materials
2.2. Analytical Techniques
2.3. Experimental Design
2.3.1. Isotherms
2.3.2. Kinetics
2.4. Equilibrium Isotherms Modelling
2.4.1. Harkins-Jura Isotherm
2.4.2. Freundlich Isotherm
2.4.3. Langmuir Isotherm
2.5. Kinetic Models
2.5.1. Pseudo-First-Order
2.5.2. Pseudo-Second-Order
2.5.3. Intra-Particle Diffusion
2.5.4. Elovich Kinetic Model
2.6. Thermodynamic Calculations
3. Results and Discussions
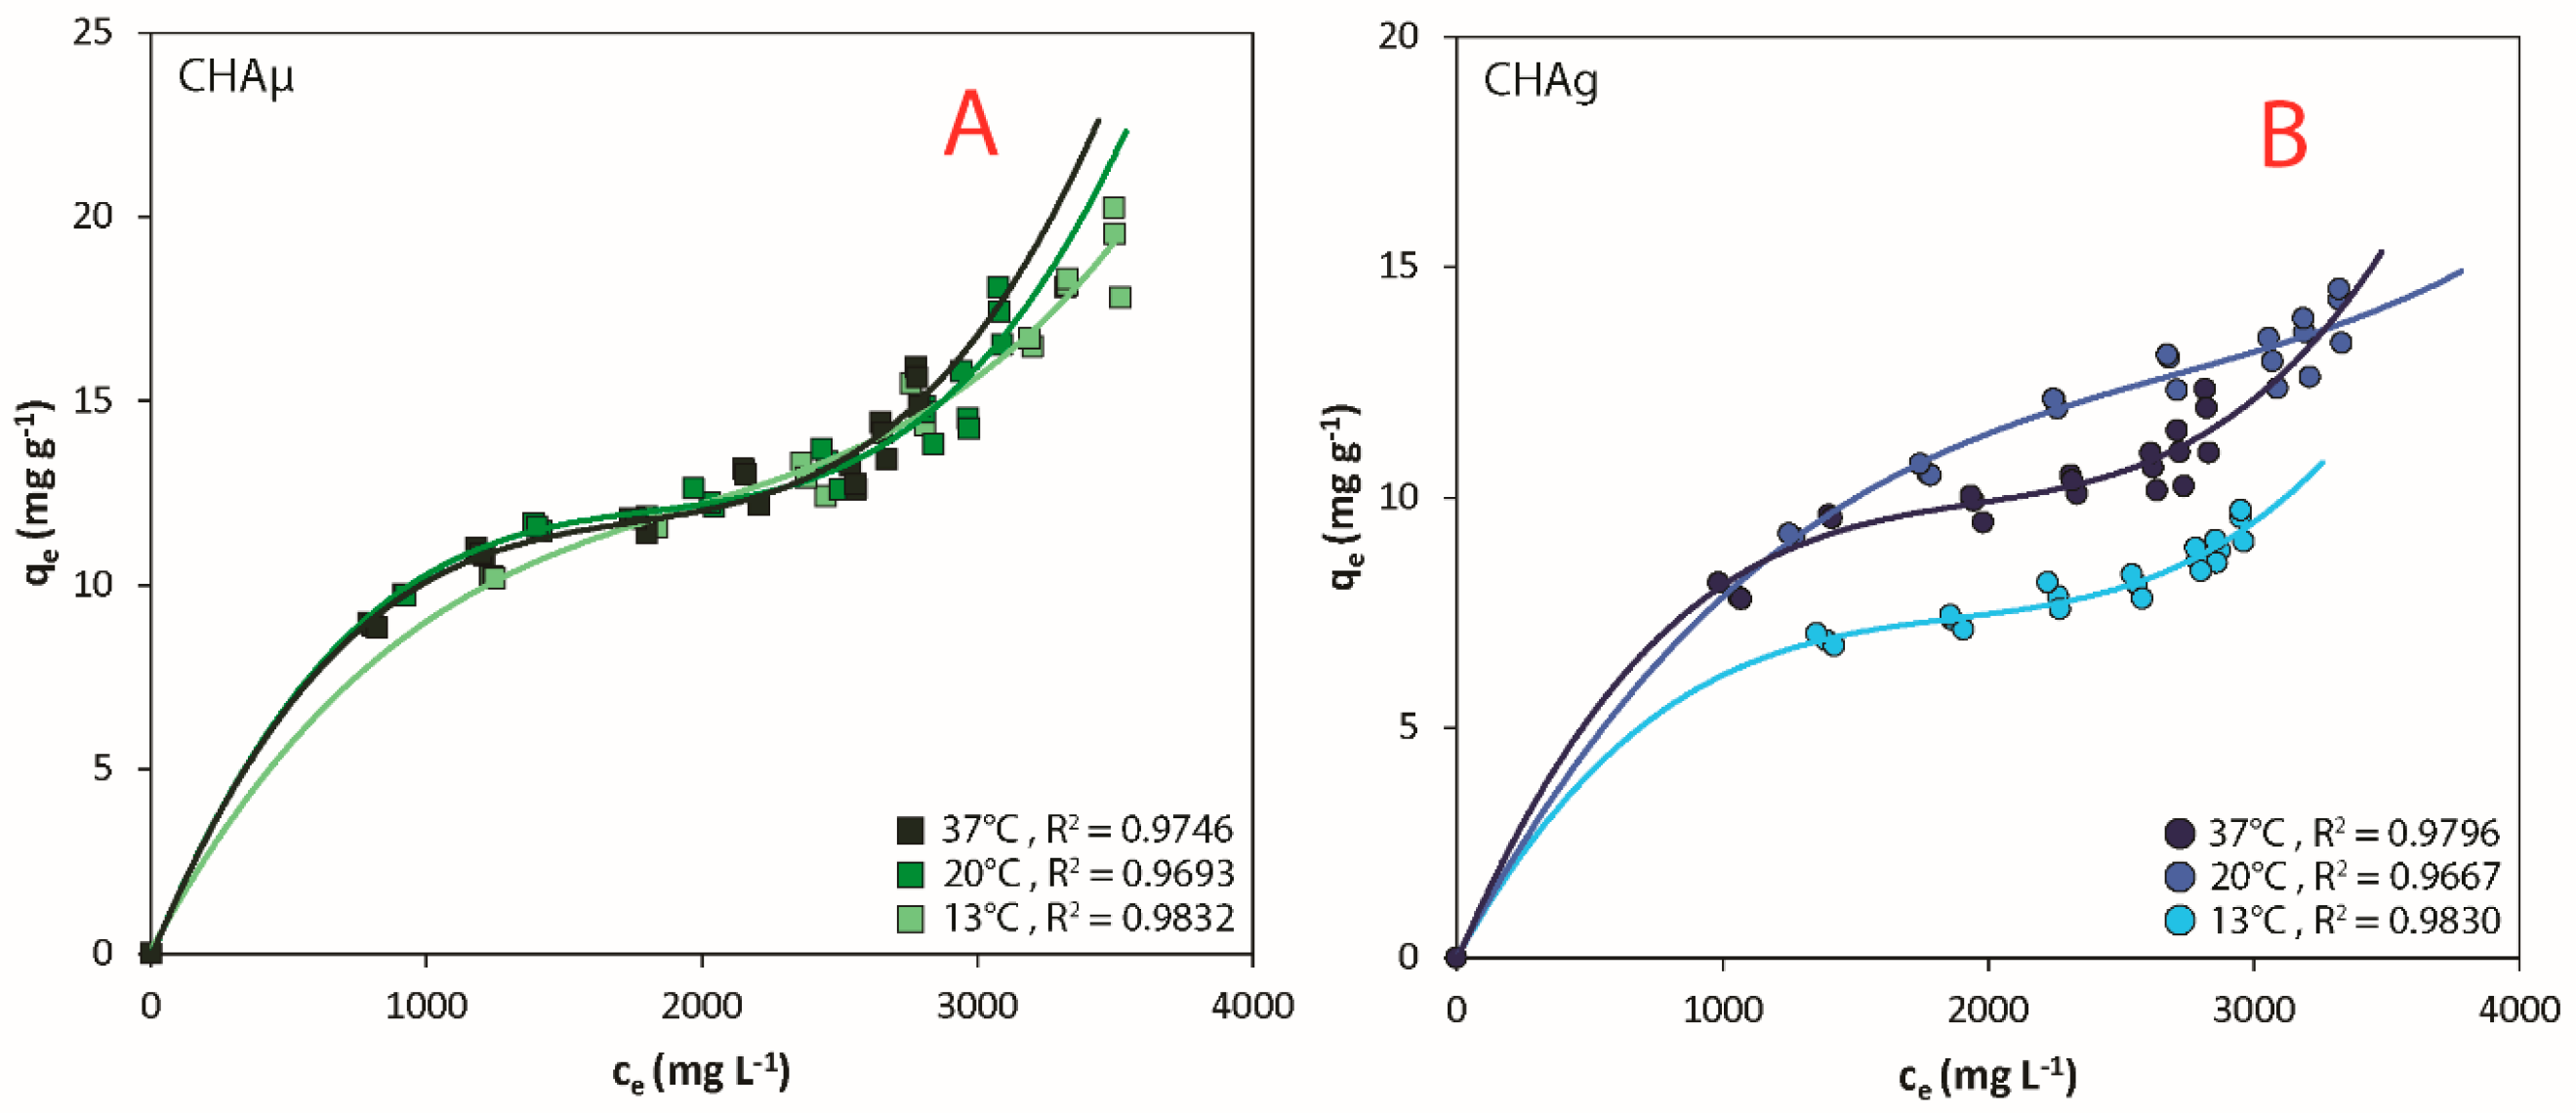
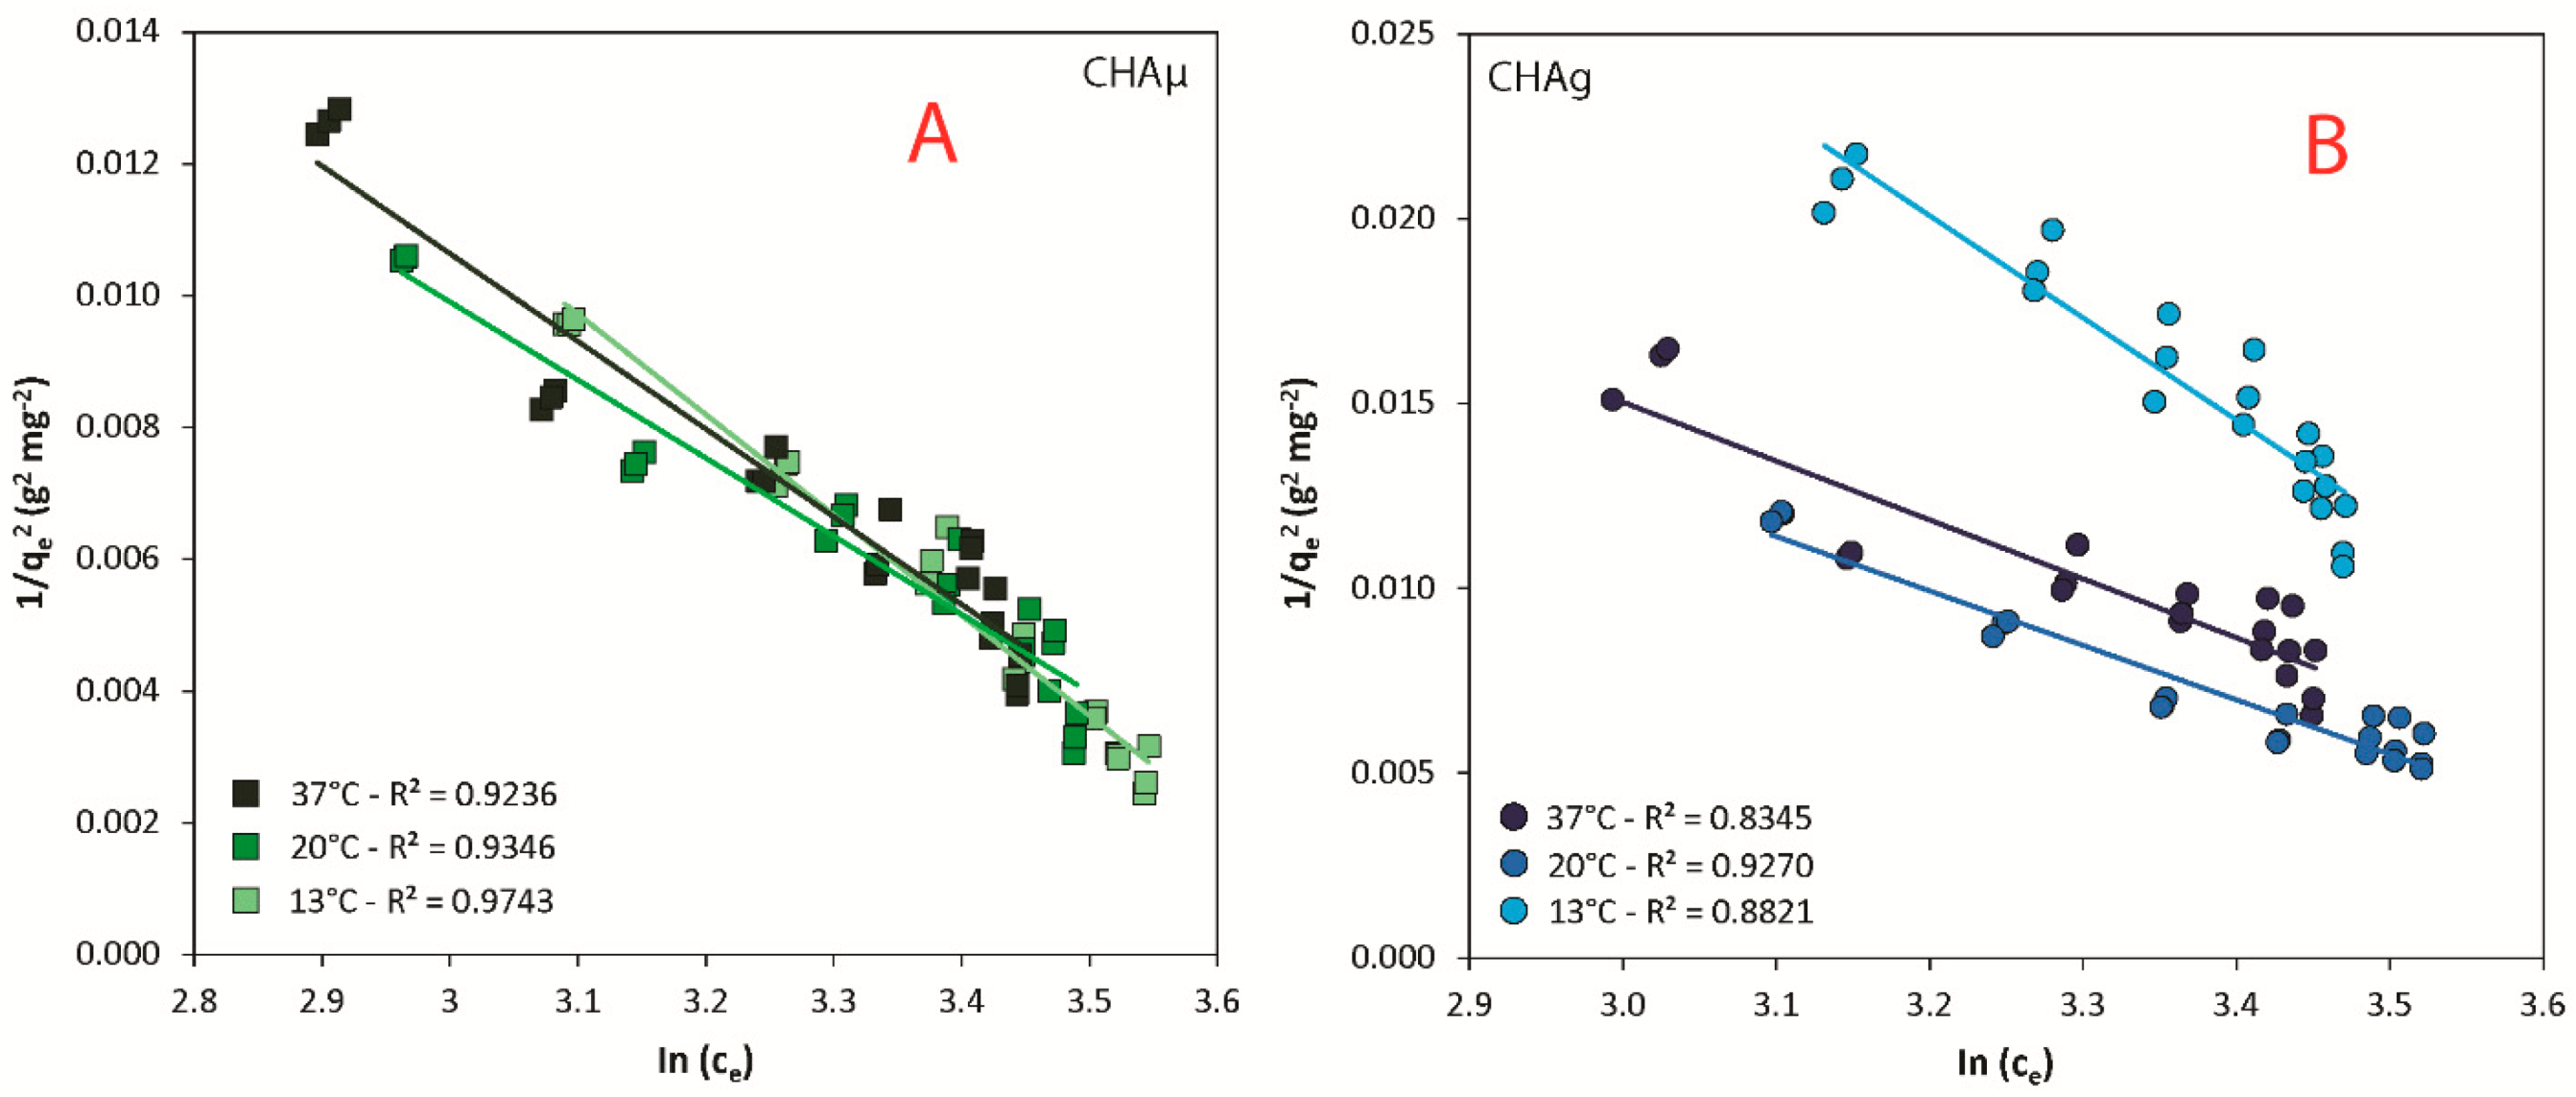
3.1. Isotherms
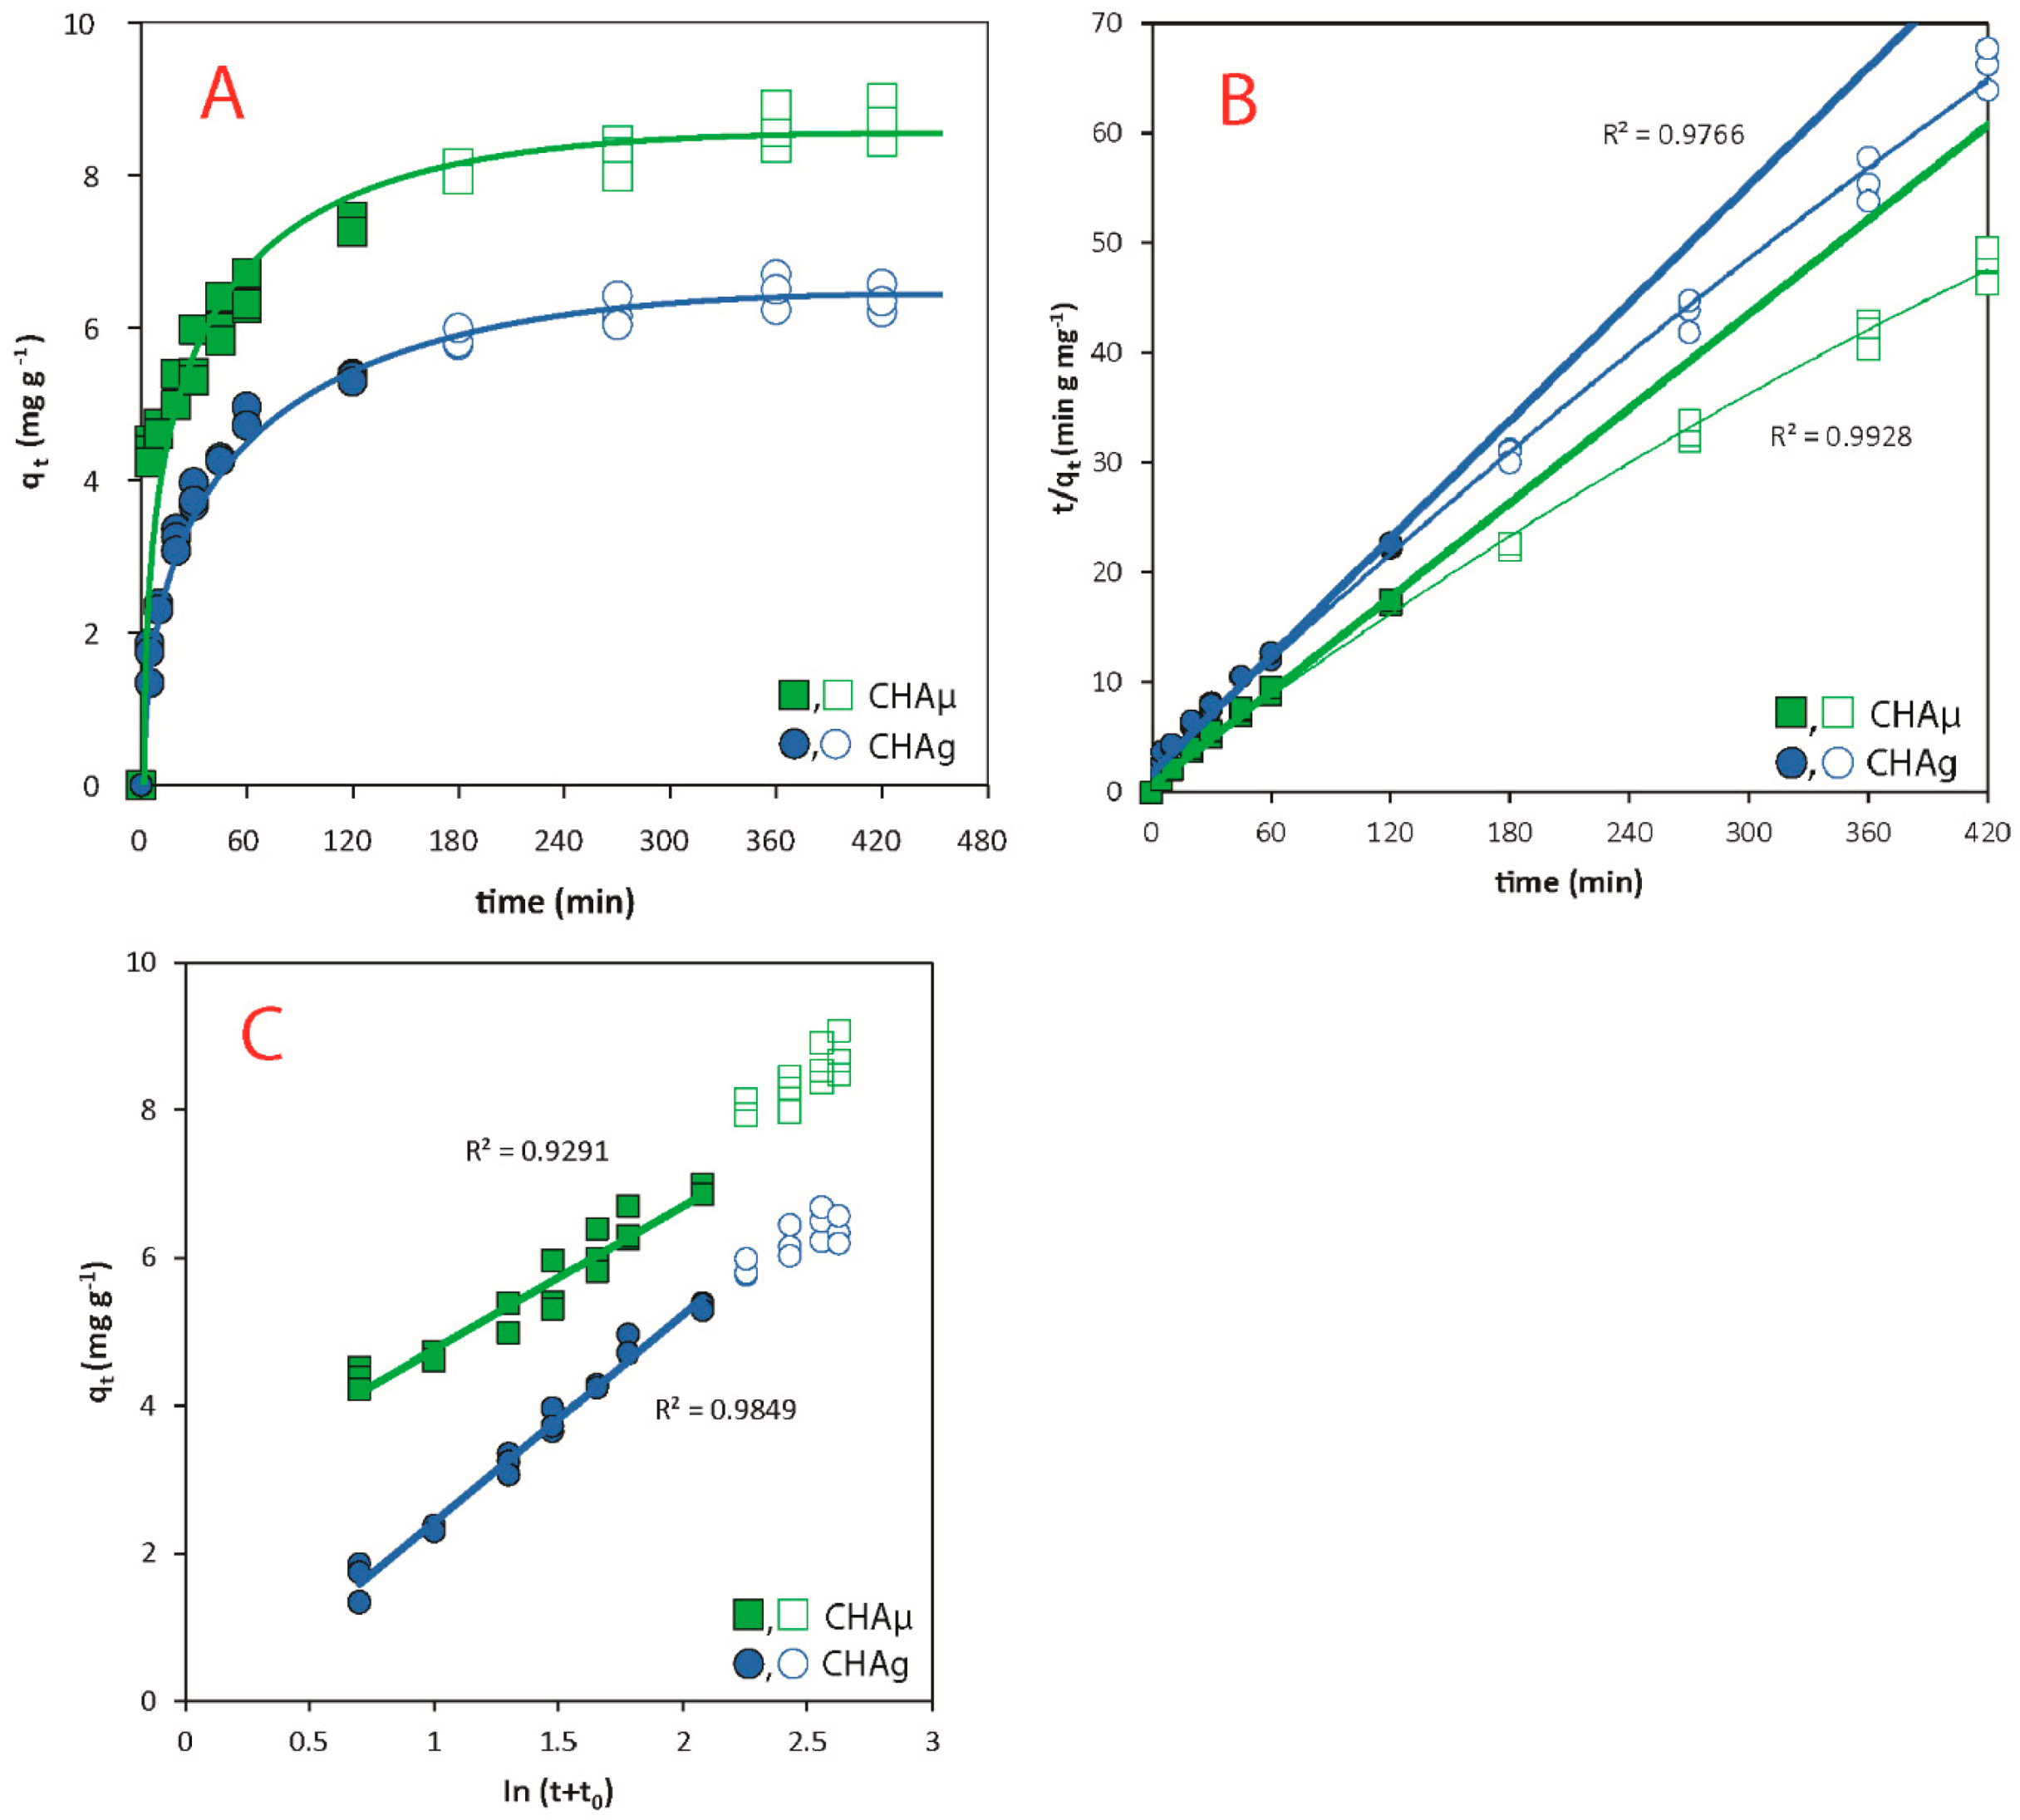
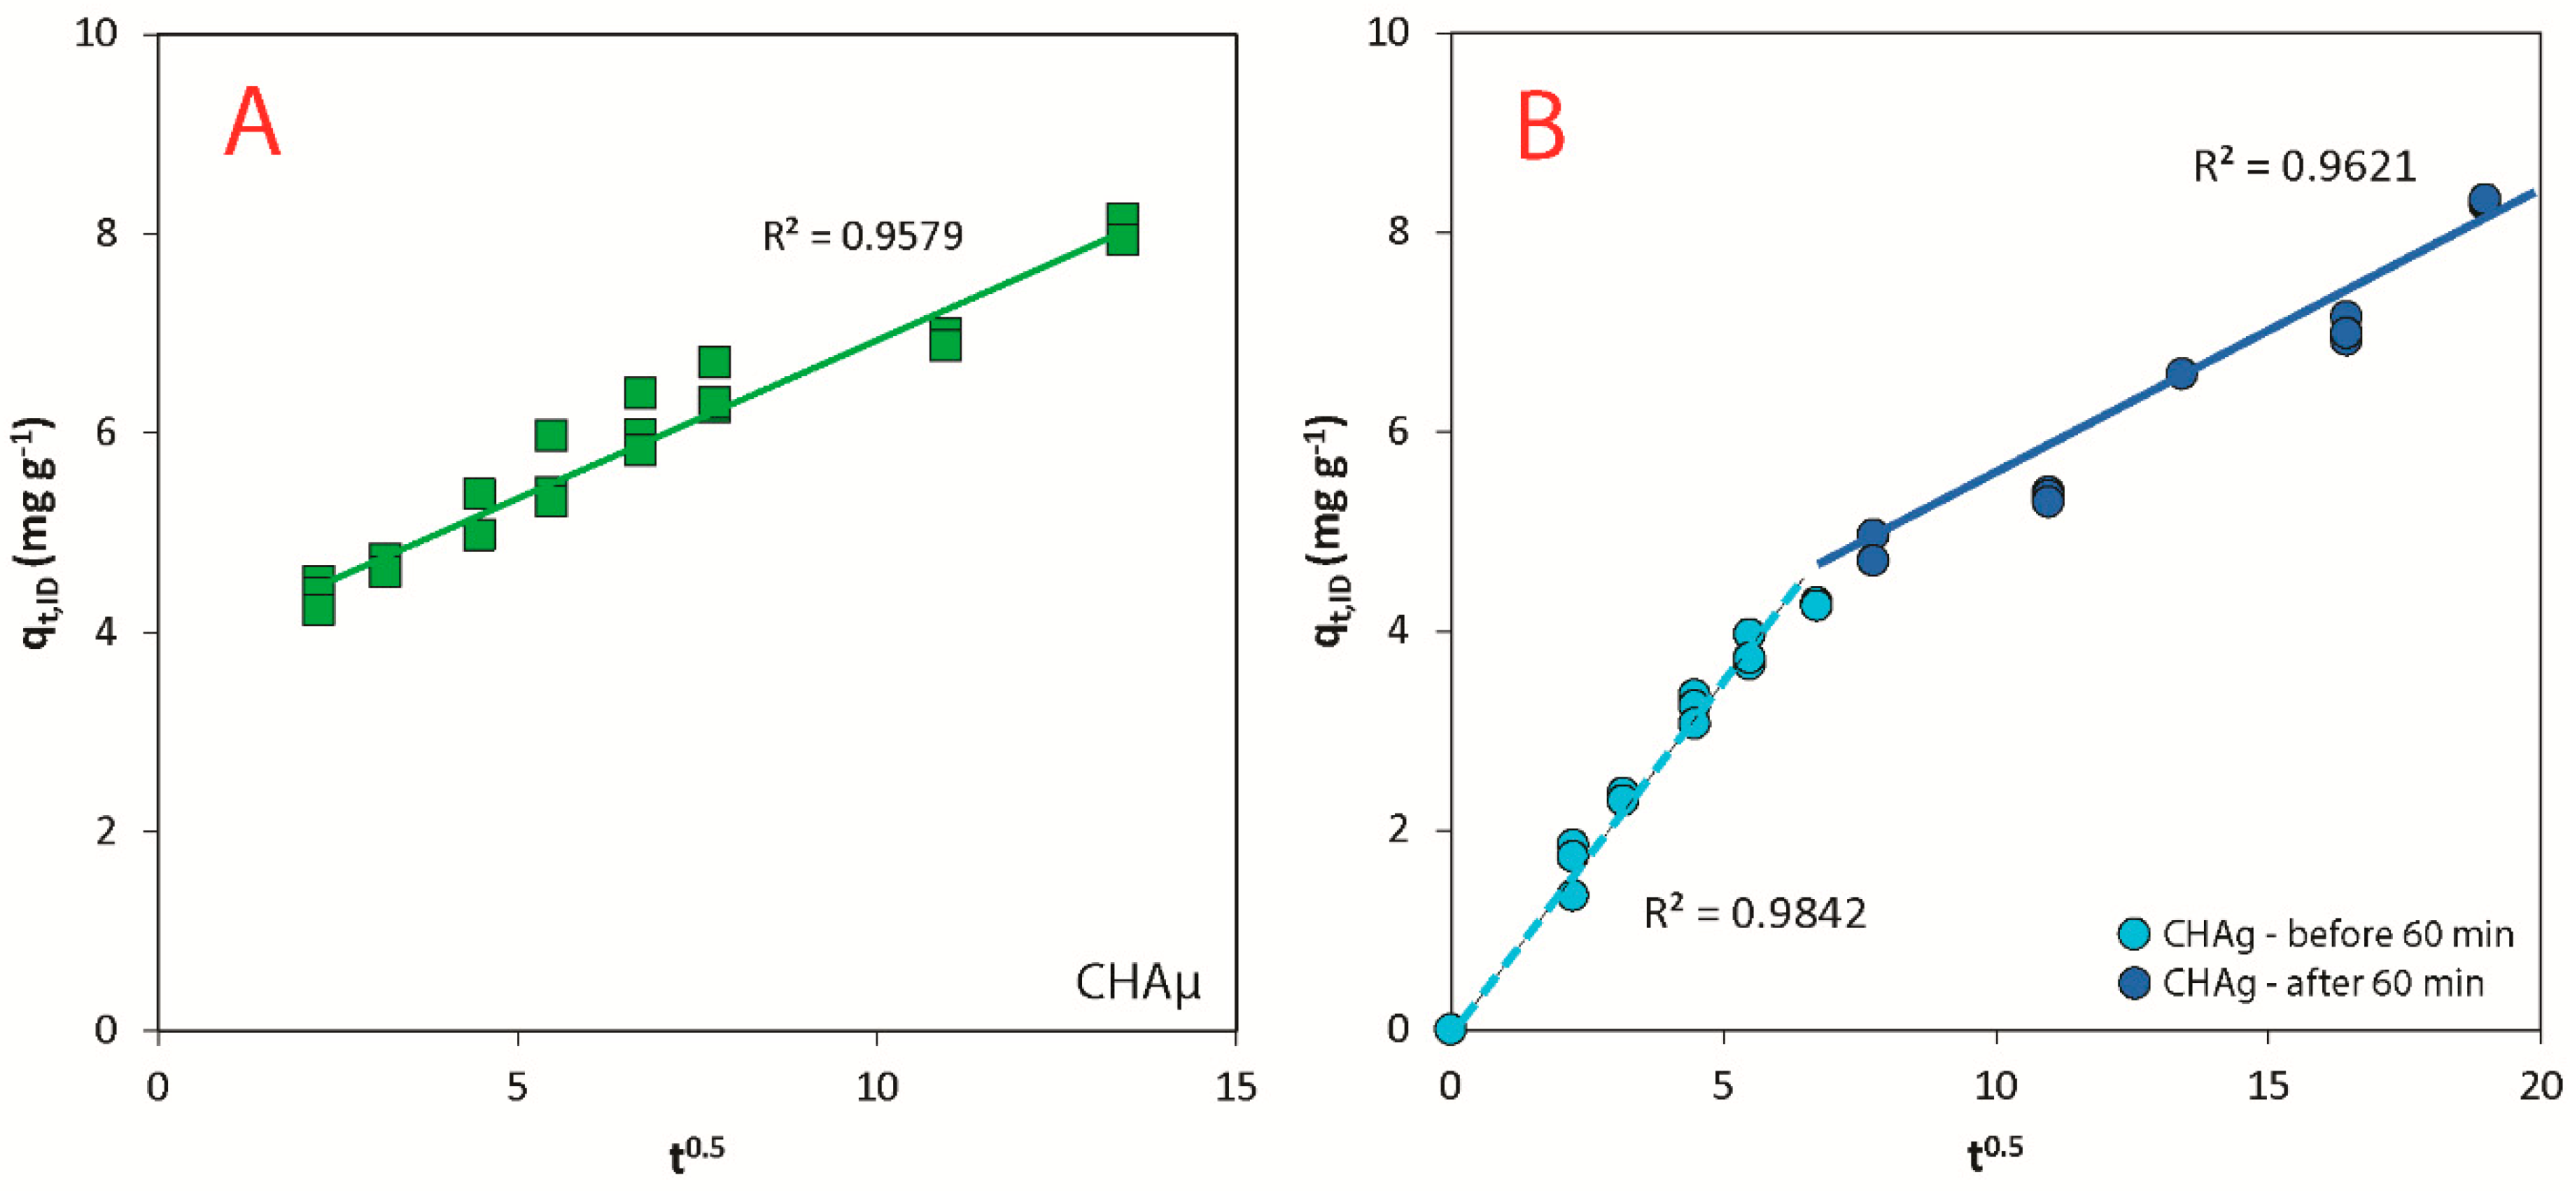
3.2. Kinetics
3.3. Thermodynamics
4. Conclusions
Author Contributions
Funding
Acknowledgments
Conflicts of Interest
References
- FAO. How to Feed the World in 2050. In Proceedings of the Expert Meeting on How to Feed the World in 2050, Rome, Italy, 24–26 June 2009. [Google Scholar]
- Dawson, J.C.; Huggins, D.R.; Jones, S.S. Characterizing nitrogen use efficiency in natural and agricultural ecosystems to improve the performance of cereal crops in low-input and organic agricultural systems. Field Crop. Res. 2008, 107, 89–101. [Google Scholar] [CrossRef]
- Afreh, D.; Zhang, J.; Guan, D.; Liu, K.; Song, Z.; Zheng, C.; Deng, A.; Feng, X.; Zhang, X.; Wu, Y.; et al. Long-term fertilization on nitrogen use efficiency and greenhouse gas emissions in a double maize cropping system in subtropical China. Soil Tillage Res. 2018, 180, 259–267. [Google Scholar] [CrossRef]
- Smith, K.A.; Jackson, D.R.; Pepper, T.J. Nutrient losses by surface run-off following the application of organic manures to arable land. 1. Nitrogen. Environ. Pollut. 2001, 112, 41–51. [Google Scholar] [CrossRef]
- Andersen, H.E.; Kronvang, B.; Larsen, S.E. Agricultural practices and diffuse nitrogen pollution in Denmark: Empirical leaching and catchment models. Water Sci. Technol. 1999, 39, 257–264. [Google Scholar] [CrossRef]
- Carpenter, S.R.; Caraco, N.F.; Correll, D.L.; Howarth, R.W.; Sharpley, A.N.; Smith, V.H. Nonpoint pollution of surface waters with phosphorus and nitrogen. Ecol. Appl. 1998, 8, 559–568. [Google Scholar] [CrossRef]
- Choudhury, A.T.M.A.; Kennedy, I.R. Nitrogen fertilizer losses from rice soils and control of environmental pollution problems. Commun. Soil Sci. Plant Anal. 2005, 36, 1625–1639. [Google Scholar] [CrossRef]
- Bijay-Singh; Yadvinder-Singh; Sekhon, G.S. Fertilizer-N use efficiency and nitrate pollution of groundwater in developing countries. J. Contam. Hydrol. 1995, 20, 167–184. [Google Scholar] [CrossRef]
- Majumdar, D. Nitrate pollution of groundwater and associated human health disorders. Indian J. Environ. Health. 2000, 42, 28–39. [Google Scholar]
- Faccini, B.; Di Giuseppe, D.; Malferrari, D.; Coltorti, M.; Abbondanzi, F.; Campisi, T.; Laurora, A.; Passaglia, E. Ammonium-exchanged zeolitite preparation for agricultural uses: From laboratory tests to large-scale application in ZeoLIFE project prototype. Period. Mineral. 2015, 84, 303–321. [Google Scholar] [CrossRef]
- Ferretti, G.; Di Giuseppe, D.; Natali, C.; Faccini, B.; Bianchini, G.; Coltorti, M. C-N elemental and isotopic investigation in agricultural soils: Insights on the effects of zeolitite amendments. Chem. Erde. 2017, 77, 45–52. [Google Scholar] [CrossRef]
- Faccini, B.; Di Giuseppe, D.; Ferretti, G.; Coltorti, M.; Colombani, N.; Mastrocicco, M. Natural and NH4+-enriched zeolitite amendment effects on nitrate leaching from a reclaimed agricultural soil (Ferrara Province, Italy). Nutr. Cycl. Agroecosyst. 2018, 110, 327–341. [Google Scholar] [CrossRef]
- Galli, E.; Passaglia, E. Natural zeolites in environmental engineering. In Zeolites in Chemical Engineering; Holzapfel, H., Ed.; Verlag ProcessEng Engineering GmbH: Vienna, Austria, 2011; pp. 392–416. ISBN 3902655089. [Google Scholar]
- Baerlocher, C.; McCusker, L.B. (Eds.) Chapter 3 Zeolite structures. In Studies in Surface Science and Catalysis 137; Elsevier: Amsterdam, The Netherlands, 2001; pp. 37–67. [Google Scholar]
- Cejka, J.; Van Bekkum, H.; Corma, A.; Schüth, F. Studies in Surface Science and Catalysis 168: Introduction to Zeolite Science and Practice; Elsevier: Amsterdam, The Netherlands, 2007; Volume 168, ISBN 978-0-444-53063-9. [Google Scholar]
- Dyer, A.; Zubair, M. Ion-exchange in chabazite. Microporous Mesoporous Mater. 1998, 22, 135–150. [Google Scholar] [CrossRef]
- Eslami, M.; Khorassani, R.; Coltorti, M.; Malferrari, D.; Faccini, B.; Ferretti, G.; Di Giuseppe, D.; Fotovat, A.; Halajnia, A. Leaching behaviour of a sandy soil amended with natural and NH4+ and K+ saturated clinoptilolite and chabazite. Arch. Agron. Soil Sci. 2018, 64, 1142–1151. [Google Scholar] [CrossRef] [Green Version]
- Ferretti, G.; Keiblinger, K.M.; Di Giuseppe, D.; Faccini, B.; Colombani, N.; Zechmeister-Boltenstern, S.; Coltorti, M.; Mastrocicco, M. Short-Term Response of Soil Microbial Biomass to Different Chabazite Zeolite Amendments. Pedosphere. 2018, 28, 277–287. [Google Scholar] [CrossRef]
- Di Giuseppe, D.; Ferretti, G.; Faccini, B.; Blasi, E.; Passeri, N.; Bianchini, G.; Coltorti, M. Is it possible to cultivate corn in a sustainable way using a quarry waste? Period. Mineral. 2016, 85, 179–183. [Google Scholar] [CrossRef]
- Ferretti, G.; Keiblinger, K.M.; Zimmermann, M.; Di Giuseppe, D.; Faccini, B.; Colombani, N.; Mentler, A.; Zechmeister-Boltenstern, S.; Coltorti, M.; Mastrocicco, M. High resolution short-term investigation of soil CO−, N2O, NOx and NH3 emissions after different chabazite zeolite amendments. Appl. Soil Ecol. 2017, 119, 138–144. [Google Scholar] [CrossRef]
- Ferretti, G.; Faccini, B.; Vittori Antisari, L.; Di Giuseppe, D.; Coltorti, M. 15N Natural Abundance, Nitrogen and Carbon Pools in Soil-Sorghum System Amended with Natural and NH4+-Enriched Zeolitites. Appl. Sci. 2019, 9, 4524. [Google Scholar] [CrossRef] [Green Version]
- Polat, E.; Karaca, M.; Demir, H.; Onus, A.N. Use of Natural Zeolite (Clinoptilolite) in Agriculture. J. Fruit Ornam. Plant Res. 2004, 12, 183–189. [Google Scholar]
- Mastinu, A.; Kumar, A.; Maccarinelli, G.; Bonini, S.A.; Premoli, M.; Aria, F.; Gianoncelli, A.; Memo, M. Zeolite clinoptilolite: Therapeutic virtues of an ancient mineral. Molecules 2019, 24, 1517. [Google Scholar] [CrossRef] [Green Version]
- Moshoeshoe, M.; Silas Nadiye-Tabbiruka, M.; Obuseng, V. A Review of the Chemistry, Structure, Properties and Applications of Zeolites. Am. J. Mater. Sci. 2017, 2017, 196–221. [Google Scholar] [CrossRef]
- Huang, H.; Xiao, X.; Yan, B.; Yang, L. Ammonium removal from aqueous solutions by using natural Chinese (Chende) zeolite as adsorbent. J. Hazard. Mater. 2010, 175, 247–252. [Google Scholar] [CrossRef] [PubMed]
- Wasielewski, S.; Rott, E.; Minke, R.; Steinmetz, H. Evaluation of Different Clinoptilolite Zeolites as Adsorbent for Ammonium Removal from Highly Concentrated Synthetic Wastewater. Water 2018, 10, 584. [Google Scholar] [CrossRef] [Green Version]
- Gunay, A. Application of nonlinear regression analysis for ammonium exchange by natural (Bigadiç) clinoptilolite. J. Hazard. Mater. 2007, 148, 708–713. [Google Scholar] [CrossRef] [PubMed]
- Jha, V.K.; Hayashi, S. Modification on natural clinoptilolite zeolite for its NH4+ retention capacity. J. Hazard. Mater. 2009, 169, 29–35. [Google Scholar] [CrossRef] [PubMed]
- Saltali, K.; Sari, A.; Aydin, M. Removal of ammonium ion from aqueous solution by natural Turkish (Yi{dotless}ldi{dotless}zeli) zeolite for environmental quality. J. Hazard. Mater. 2007, 141, 258–263. [Google Scholar] [CrossRef]
- Chen, H.-F.; Lin, Y.-J.; Chen, B.-H.; Yoshiyuki, I.; Liou, S.; Huang, R.-T. A Further Investigation of NH4+ Removal Mechanisms by Using Natural and Synthetic Zeolites in Different Concentrations and Temperatures. Minerals. 2018, 8, 499. [Google Scholar] [CrossRef] [Green Version]
- Nguyen, M.L.; Tanner, C.C. Ammonium removal from wastewaters using natural New Zealand zeolites. N. Z. J. Agric. Res. 2010, 41, 427–446. [Google Scholar] [CrossRef] [Green Version]
- Moussavi, G.; Talebi, S.; Farrokhi, M.; Sabouti, R.M. The investigation of mechanism, kinetic and isotherm of ammonia and humic acid co-adsorption onto natural zeolite. Chem. Eng. J. 2011, 171, 1159–1169. [Google Scholar] [CrossRef]
- Cheng, Q.; Li, H.; Xu, Y.; Chen, S.; Liao, Y.; Deng, F.; Li, J. Study on the adsorption of nitrogen and phosphorus from biogas slurry by NaCl-modified zeolite. PLoS ONE 2017, 12, e0176109. [Google Scholar] [CrossRef]
- Malferrari, D.; Laurora, A.; Brigatti, M.F.; Coltorti, M.; Di Giuseppe, D.; Faccini, B.; Passaglia, E.; Vezzalini, M.G. Open-field experimentation of an innovative and integrated zeolitite cycle: Project definition and material characterization. Rend. Lincei. 2013, 24, 141–150. [Google Scholar] [CrossRef]
- Li, M.; Zhu, X.; Zhu, F.; Ren, G.; Cao, G.; Song, L. Application of modified zeolite for ammonium removal from drinking water. Desalination. 2011, 271, 295–300. [Google Scholar] [CrossRef]
- Guo, X.; Zeng, L.; Li, X.; Park, H.S. Ammonium and potassium removal for anaerobically digested wastewater using natural clinoptilolite followed by membrane pretreatment. J. Hazard. Mater. 2008, 151, 125–133. [Google Scholar] [CrossRef]
- Simonin, J.P. On the comparison of pseudo-first order and pseudo-second order rate laws in the modeling of adsorption kinetics. Chem. Eng. J. 2016, 300, 254–263. [Google Scholar] [CrossRef] [Green Version]
- R Core Team. R Studio. 2019. Available online: https://rstudio.com/products/rstudio/download/ (accessed on 9 December 2019).
- Saroyda, J.R.V.; Cruz, R.Y.S.; Antonio, R.J.C.; Flestado, C.L.P.; Magalong, J.R.S.; Zagala, K.Z.P.; Barbacena, C.L.; Bumatay, J.M.; Bautista, L.F.; Deocaris, C.C. PUPAIM. 2001. Available online: https://cran.r-project.org/package=PUPAIM (accessed on 10 May 2019).
- Chattopadhyay, A. Sorption Analysis: Static Adsorption Experiment Plotting and Analysis. 2017. Available online: https://cran.r-project.org/package=SorptionAnalysi (accessed on 10 May 2019).
- Iyer, K.P.D.; Kunju, A.S. Extension of Harkins-Jura adsorption isotherm to solute adsorption. Colloids Surf. 1992, 63, 235–240. [Google Scholar] [CrossRef]
- Harkins, W.D.; Jura, G. The decrease (π) of free surface energy (γ) as a basis for the development of equations for adsorption isotherms; And the existence of two condensed phases in films on solids. J. Chem. Phys. 1944, 12, 112–113. [Google Scholar] [CrossRef]
- Rawajfih, Z.; Al Mohammad, H.; Nsour, N.; Ibrahim, K. Study of equilibrium and thermodynamic adsorption of α-picoline, β-picoline, and γ-picoline by Jordanian zeolites: Phillipsite and faujasite. Microporous Mesoporous Mater. 2010, 132, 401–408. [Google Scholar] [CrossRef]
- Shanavas, S.; Salahuddin Kunju, A.; Varghese, H.T.; Yohannan Panicker, C. Comparison of Langmuir and Harkins-Jura Adsorption Isotherms for the Determination of Surface Area of Solids: Oriental Journal of Chemistry. Orient. J. Chem. 2011, 27, 245–252. [Google Scholar]
- Ho, Y.S.; McKay, G. Application of Kinetic Models to the Sorption of Copper(II) on to Peat. Adsorpt. Sci. Technol. 2002, 20, 797–815. [Google Scholar] [CrossRef]
- Sparks, D.L. Environmental Soil Chemistry, 2nd ed.; Academic Press: Cambridge, MA, USA, 2002; ISBN 9780080494807. [Google Scholar]
- Subramanyam, B.; Das, A. Linearised and non-linearised isotherm models optimization analysis by error functions and statistical means. J. Environ. Heal. Sci. Eng. 2014, 12. [Google Scholar] [CrossRef] [PubMed] [Green Version]
- Langmuir, I. The adsorption of gases on plane surfaces of glass, mica and platinum. J. Am. Chem. Soc. 1918, 40, 1361–1403. [Google Scholar] [CrossRef] [Green Version]
- Halim, A.A.; Aziz, H.A.; Johari, M.A.M.; Ariffin, K.S. Comparison study of ammonia and COD adsorption on zeolite, activated carbon and composite materials in landfill leachate treatment. Desalination. 2010, 262, 31–35. [Google Scholar] [CrossRef]
- Lagergren, S.Y.; Sven, K. Zurtheorie der sogenannten adsorption gelösterstoffe. Kongliga Sven. Vetensk. Handl. 1898, 24, 1–39. [Google Scholar]
- Qiu, H.; Lv, L.; Pan, B.; Zhang, Q.; Zhang, W.; Zhang, Q. Critical review in adsorption kinetic models. J. Zhejiang Univ. Sci. A 2009, 10, 716–724. [Google Scholar] [CrossRef]
- Ho, Y.S. Review of second-order models for adsorption systems. J. Hazard. Mater. 2006, 136, 681–689. [Google Scholar] [CrossRef] [PubMed] [Green Version]
- Ho, Y.S.; McKay, G. A Comparison of chemisorption kinetic models applied to pollutant removal on various sorbents. Process Saf. Environ. Prot. 1998, 76, 332–340. [Google Scholar] [CrossRef] [Green Version]
- Ho, Y.S.; McKay, G. Pseudo-second order model for sorption processes. Process Biochem. 1999, 34, 451–465. [Google Scholar] [CrossRef]
- Dursun, G.; Çiçek, H.; Dursun, A.Y. Adsorption of phenol from aqueous solution by using carbonised beet pulp. J. Hazard. Mater. 2005, 125, 175–182. [Google Scholar] [CrossRef]
- Mall, I.D.; Srivastava, V.C.; Agarwal, N.K. Removal of Orange-G and Methyl Violet dyes by adsorption onto bagasse fly ash—Kinetic study and equilibrium isotherm analyses. Dye. Pigment. 2006, 69, 210–223. [Google Scholar] [CrossRef]
- Widiastuti, N.; Wu, H.; Ang, H.M.; Zhang, D. Removal of ammonium from greywater using natural zeolite. Desalination 2011, 277, 15–23. [Google Scholar] [CrossRef]
- Boyd, G.E.; Adamson, A.W.; Myers, L.S. The Exchange Adsorption of Ions from Aqueous Solutions by Organic Zeolites. II. Kinetics. J. Am. Chem. Soc. 1947, 69, 2836–2848. [Google Scholar] [CrossRef]
- Simonin, J.P.; Bouté, J. Intraparticle diffusion-adsorption model to describe liquid/solid adsorption kinetics. Rev. Mex. Ing. Quim. 2016, 15, 161–173. [Google Scholar]
- Rudzinski, W.; Panczyk, T. Kinetics of isothermal adsorption on energetically heterogeneous solid surfaces: A new theoretical description based on the statistical rate theory of interfacial transport. J. Phys. Chem. B 2000, 104, 9149–9162. [Google Scholar] [CrossRef]
- Cheung, C.W.; Porter, J.F.; Mckay, G. Sorption kinetic analysis for the removal of cadmium ions from effluents using bone char. Water Res. 2001, 35, 605–612. [Google Scholar] [CrossRef]
- Sağ, Y.; Aktay, Y. Kinetic studies on sorption of Cr(VI) and Cu(II) ions by chitin, chitosan and Rhizopus arrhizus. Biochem. Eng. J. 2002, 12, 143–153. [Google Scholar] [CrossRef]
- Cortés-Martínez, R.; Martínez-Miranda, V.; Solache-Ríos, M.; García-Sosa, I. Evaluation of natural and surfactant-modified zeolites in the removal of cadmium from aqaeous solutions. Sep. Sci. Technol. 2004, 39, 2711–2730. [Google Scholar] [CrossRef]
- Wu, F.C.; Tseng, R.L.; Juang, R.S. Characteristics of Elovich equation used for the analysis of adsorption kinetics in dye-chitosan systems. Chem. Eng. J. 2009, 150, 366–373. [Google Scholar] [CrossRef]
- Khan, A.A.; Singh, R.P. Adsorption thermodynamics of carbofuran on Sn (IV) arsenosilicate in H+, Na+ and Ca2+ forms. Colloids Surf. 1987, 24, 33–42. [Google Scholar] [CrossRef]
- Giles, C.H.; MacEwan, T.H.; Nakhwa, S.N.; Smith, D. 786. Studies in adsorption. Part XI. A system of classification of solution adsorption isotherms, and its use in diagnosis of adsorption mechanisms and in measurement of specific surface areas of solids. J. Chem. Soc. 1960. [Google Scholar] [CrossRef]
- Dada, A.O. Langmuir, Freundlich, Temkin and Dubinin–Radushkevich Isotherms Studies of Equilibrium Sorption of Zn 2+ Unto Phosphoric Acid Modified Rice Husk. IOSR J. Appl. Chem. 2012, 3, 38–45. [Google Scholar] [CrossRef]
- Alshameri, A.; Ibrahim, A.; Assabri, A.M.; Lei, X.; Wang, H.; Yan, C. The investigation into the ammonium removal performance of Yemeni natural zeolite: Modification, ion exchange mechanism, and thermodynamics. Powder Technol. 2014, 258, 20–31. [Google Scholar] [CrossRef]
- Chabazite. Available online: http://www.iza-online.org/natural/Datasheets/Chabazite/Chabazite.html (accessed on 25 September 2020).
- Ghosal, P.S.; Gupta, A.K. Determination of thermodynamic parameters from Langmuir isotherm constant-revisited. J. Mol. Liq. 2017, 225, 137–146. [Google Scholar] [CrossRef]
- Xiang, L.; Wang, X.D.; Chen, X.H.; Mo, C.H.; Li, Y.W.; Li, H.; Cai, Q.Y.; Zhou, D.M.; Wong, M.H.; Li, Q.X. Sorption Mechanism, Kinetics, and Isotherms of Di- n-butyl Phthalate to Different Soil Particle-Size Fractions. J. Agric. Food Chem. 2019, 67, 4734–4745. [Google Scholar] [CrossRef] [PubMed]
- Aydın Temel, F.; Kuleyin, A. Ammonium removal from landfill leachate using natural zeolite: Kinetic, equilibrium, and thermodynamic studies. Desalin. Water Treat. 2016, 57, 23873–23892. [Google Scholar] [CrossRef]


| Sorbent | Temperature | Harkins-Jura | Freundlich | Langmuir | ||||||
|---|---|---|---|---|---|---|---|---|---|---|
| T | R2 | α | β | R2 | KF | n | R2 | KL | qmax | |
| (K) | (-) | (g2 mg−2) | (g2 L mg−3) | (-) | (L g−1) | (-) | (-) | (L mg−1) | (mg g−1) | |
| CHAµ | 286 | 0.973 | 0.057 | −0.015 | 0.904 | 0.14 | 1.67 | 0.878 | 3.98 × 10⁻⁴ | 29.5 |
| 293 | 0.931 | 0.045 | −0.012 | 0.853 | 0.66 | 2.55 | 0.860 | 10.27 × 10⁻⁴ | 19.6 | |
| 310 | 0.920 | 0.051 | −0.013 | 0.896 | 0.77 | 2.71 | 0.911 | 12.03 × 10⁻⁴ | 18.1 | |
| CHAg | 286 | 0.876 | 0.109 | −0.028 | 0.826 | 0.45 | 2.68 | 0.798 | 9.12 × 10⁻⁴ | 12.0 |
| 293 | 0.937 | 0.057 | −0.015 | 0.937 | 0.56 | 2.55 | 0.954 | 7.40 × 10⁻⁴ | 18.9 | |
| 310 | 0.826 | 0.063 | −0.016 | 0.826 | 0.95 | 3.23 | 0.843 | 13.03 × 10⁻⁴ | 14.0 | |
| Sorbent | PFO | PSO | Elovich | |||||||
|---|---|---|---|---|---|---|---|---|---|---|
| R2 | k1 | qe,1 | R2 | k2 | qe,2 | h | R2 | α | RE | |
| (-) | (min−1) | (mg g−1) | (-) | (g mg−1 min−1) | (mg g−1) | (mg g−1 min−1) | (-) | (mg g−1 min−1) | (-) | |
| CHAµ | 0.779 | 0.0104 | 5.39 | 0.988 | 0.065 | 6.41 | 2.667 | 0.921 | 1.01 | 0.282 |
| CHAg | 0.814 | 0.0036 | 6.67 | 0.977 | 0.018 | 5.61 | 0.566 | 0.985 | 0.82 | 0.407 |
| Sorbent | ID Model | |||
|---|---|---|---|---|
| R2 | KID | C | ||
| (-) | (mg g−1 min−0.5) | (mg g−1) | ||
| CHAµ | 0.958 | 0.32 | 3.75 | |
| CHAg | Before 60 min. | 0.984 | 0.63 | 0.17 |
| After 60 min. | 0.962 | 0.31 | 2.24 |
| Thermodynamic Parameters | CHAµ | CHAg | |||||
|---|---|---|---|---|---|---|---|
| Temperature (°C) | |||||||
| 13 | 20 | 37 | 13 | 20 | 37 | ||
| Ke | (-) | 8.83 | 11.80 | 12.61 | 6.25 | 8.86 | 9.60 |
| ΔG1 | (J mol−1) | −2251 | −2613 | −2839 | −1893 | −2310 | −2533 |
| ΔG2 | (J mol−1) | −2333 | −2492 | −2878 | −1992 | −2164 | −2581 |
| Thermodynamic Parameters | CHAµ | CHAg |
|---|---|---|
| ΔH (J mol−1) | 4174 | 5036 |
| ΔS (J K−1 mol−1) | 22.7 | 24.6 |
Publisher’s Note: MDPI stays neutral with regard to jurisdictional claims in published maps and institutional affiliations. |
© 2020 by the authors. Licensee MDPI, Basel, Switzerland. This article is an open access article distributed under the terms and conditions of the Creative Commons Attribution (CC BY) license (http://creativecommons.org/licenses/by/4.0/).
Share and Cite
Galamini, G.; Ferretti, G.; Medoro, V.; Tescaro, N.; Faccini, B.; Coltorti, M. Isotherms, Kinetics, and Thermodynamics of NH4+ Adsorption in Raw Liquid Manure by Using Natural Chabazite Zeolite-Rich Tuff. Water 2020, 12, 2944. https://doi.org/10.3390/w12102944
Galamini G, Ferretti G, Medoro V, Tescaro N, Faccini B, Coltorti M. Isotherms, Kinetics, and Thermodynamics of NH4+ Adsorption in Raw Liquid Manure by Using Natural Chabazite Zeolite-Rich Tuff. Water. 2020; 12(10):2944. https://doi.org/10.3390/w12102944
Chicago/Turabian StyleGalamini, Giulio, Giacomo Ferretti, Valeria Medoro, Nicola Tescaro, Barbara Faccini, and Massimo Coltorti. 2020. "Isotherms, Kinetics, and Thermodynamics of NH4+ Adsorption in Raw Liquid Manure by Using Natural Chabazite Zeolite-Rich Tuff" Water 12, no. 10: 2944. https://doi.org/10.3390/w12102944