SPH Simulations of Real Sea Waves Impacting a Large-Scale Structure

 ,
,  ,
,  , ,
, ,
Abstract
:1. Introduction
2. Study Case
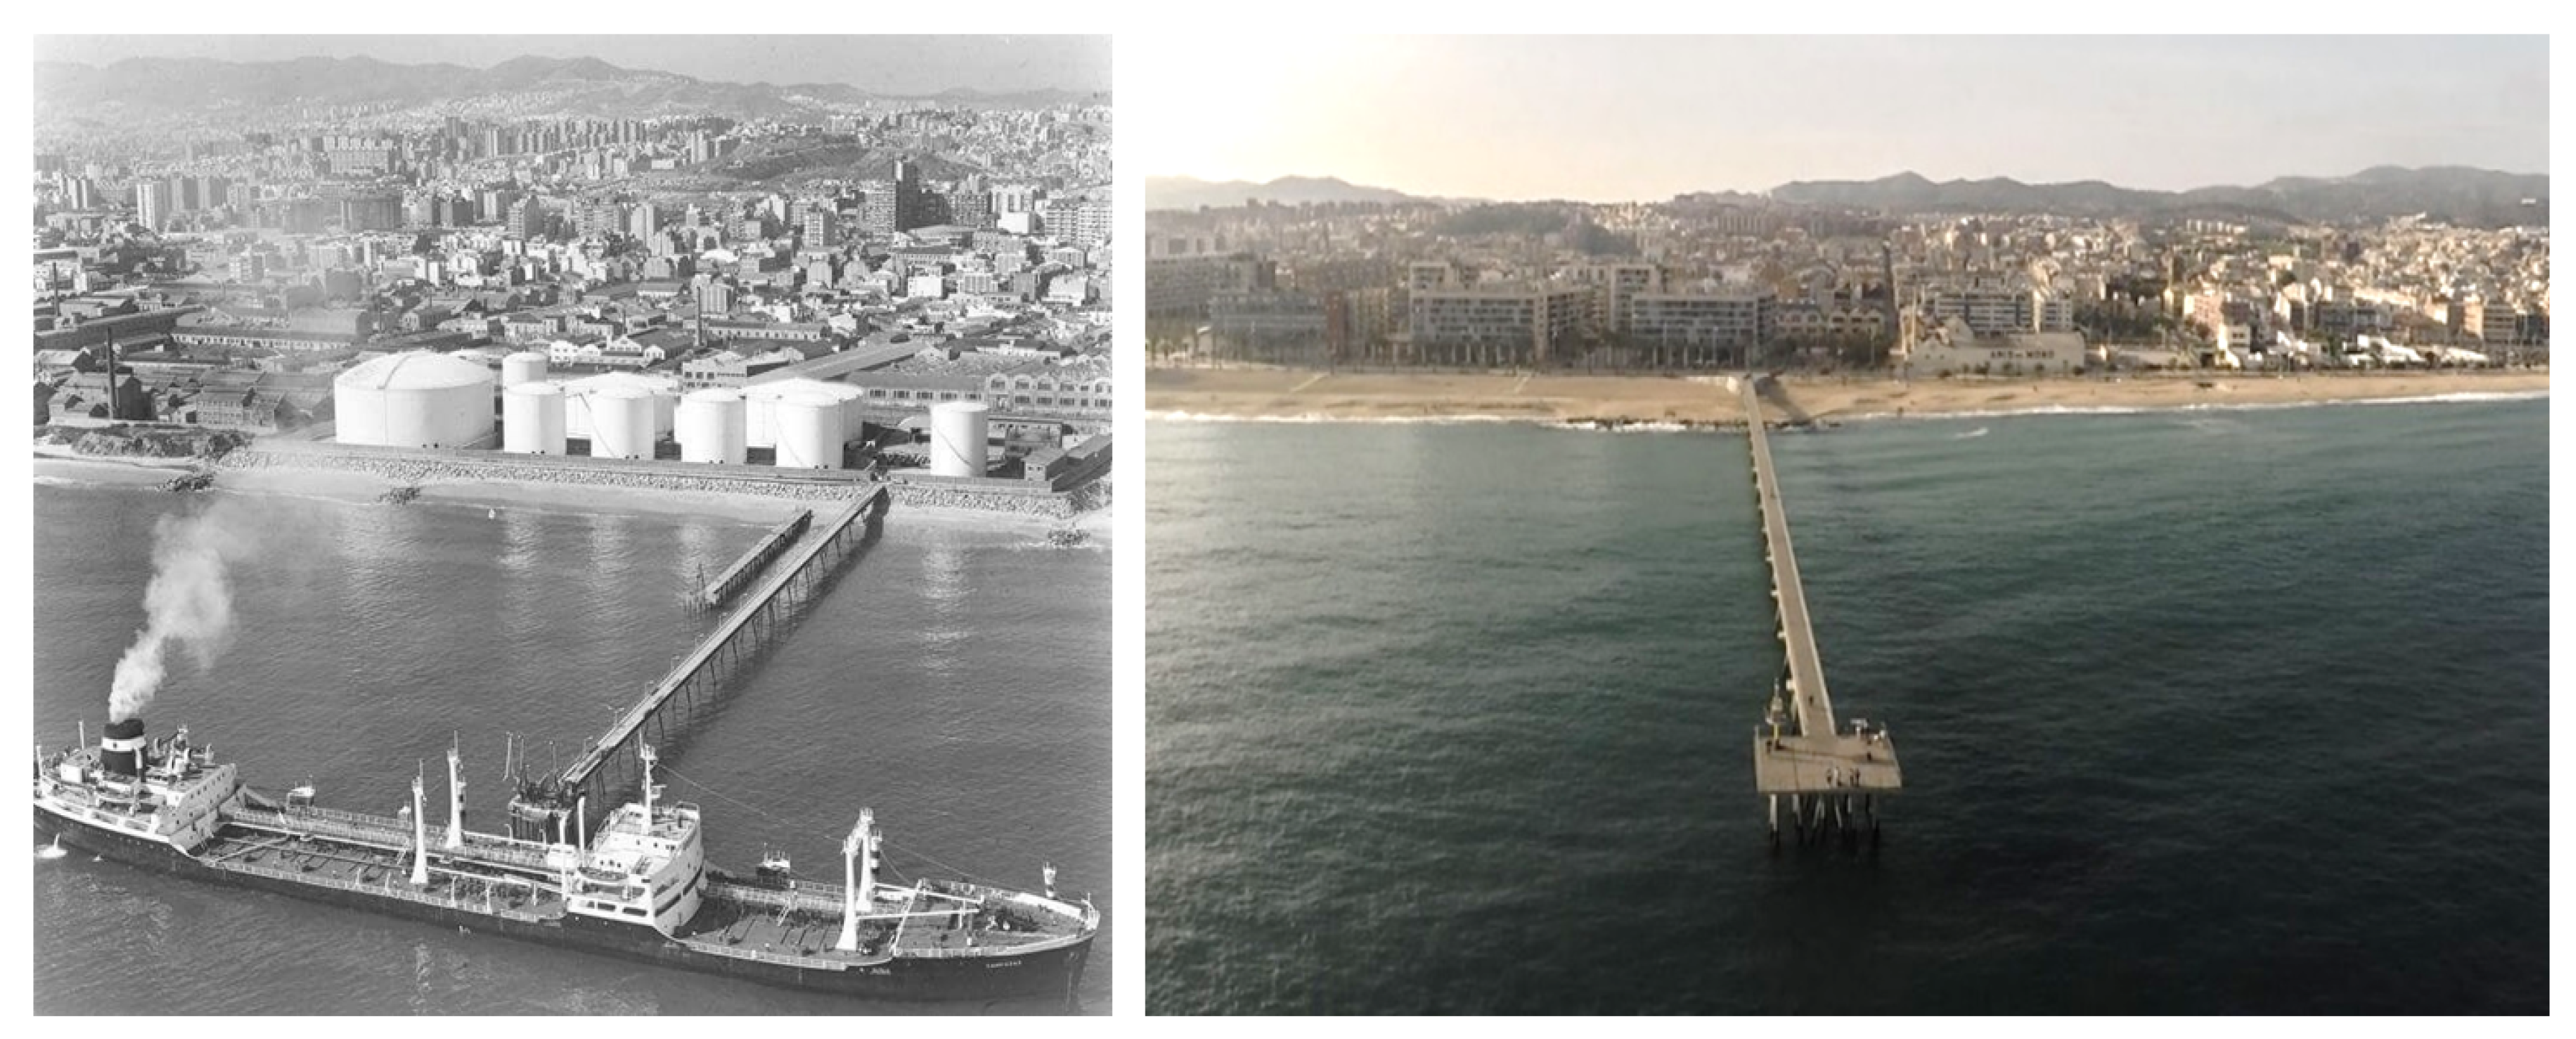
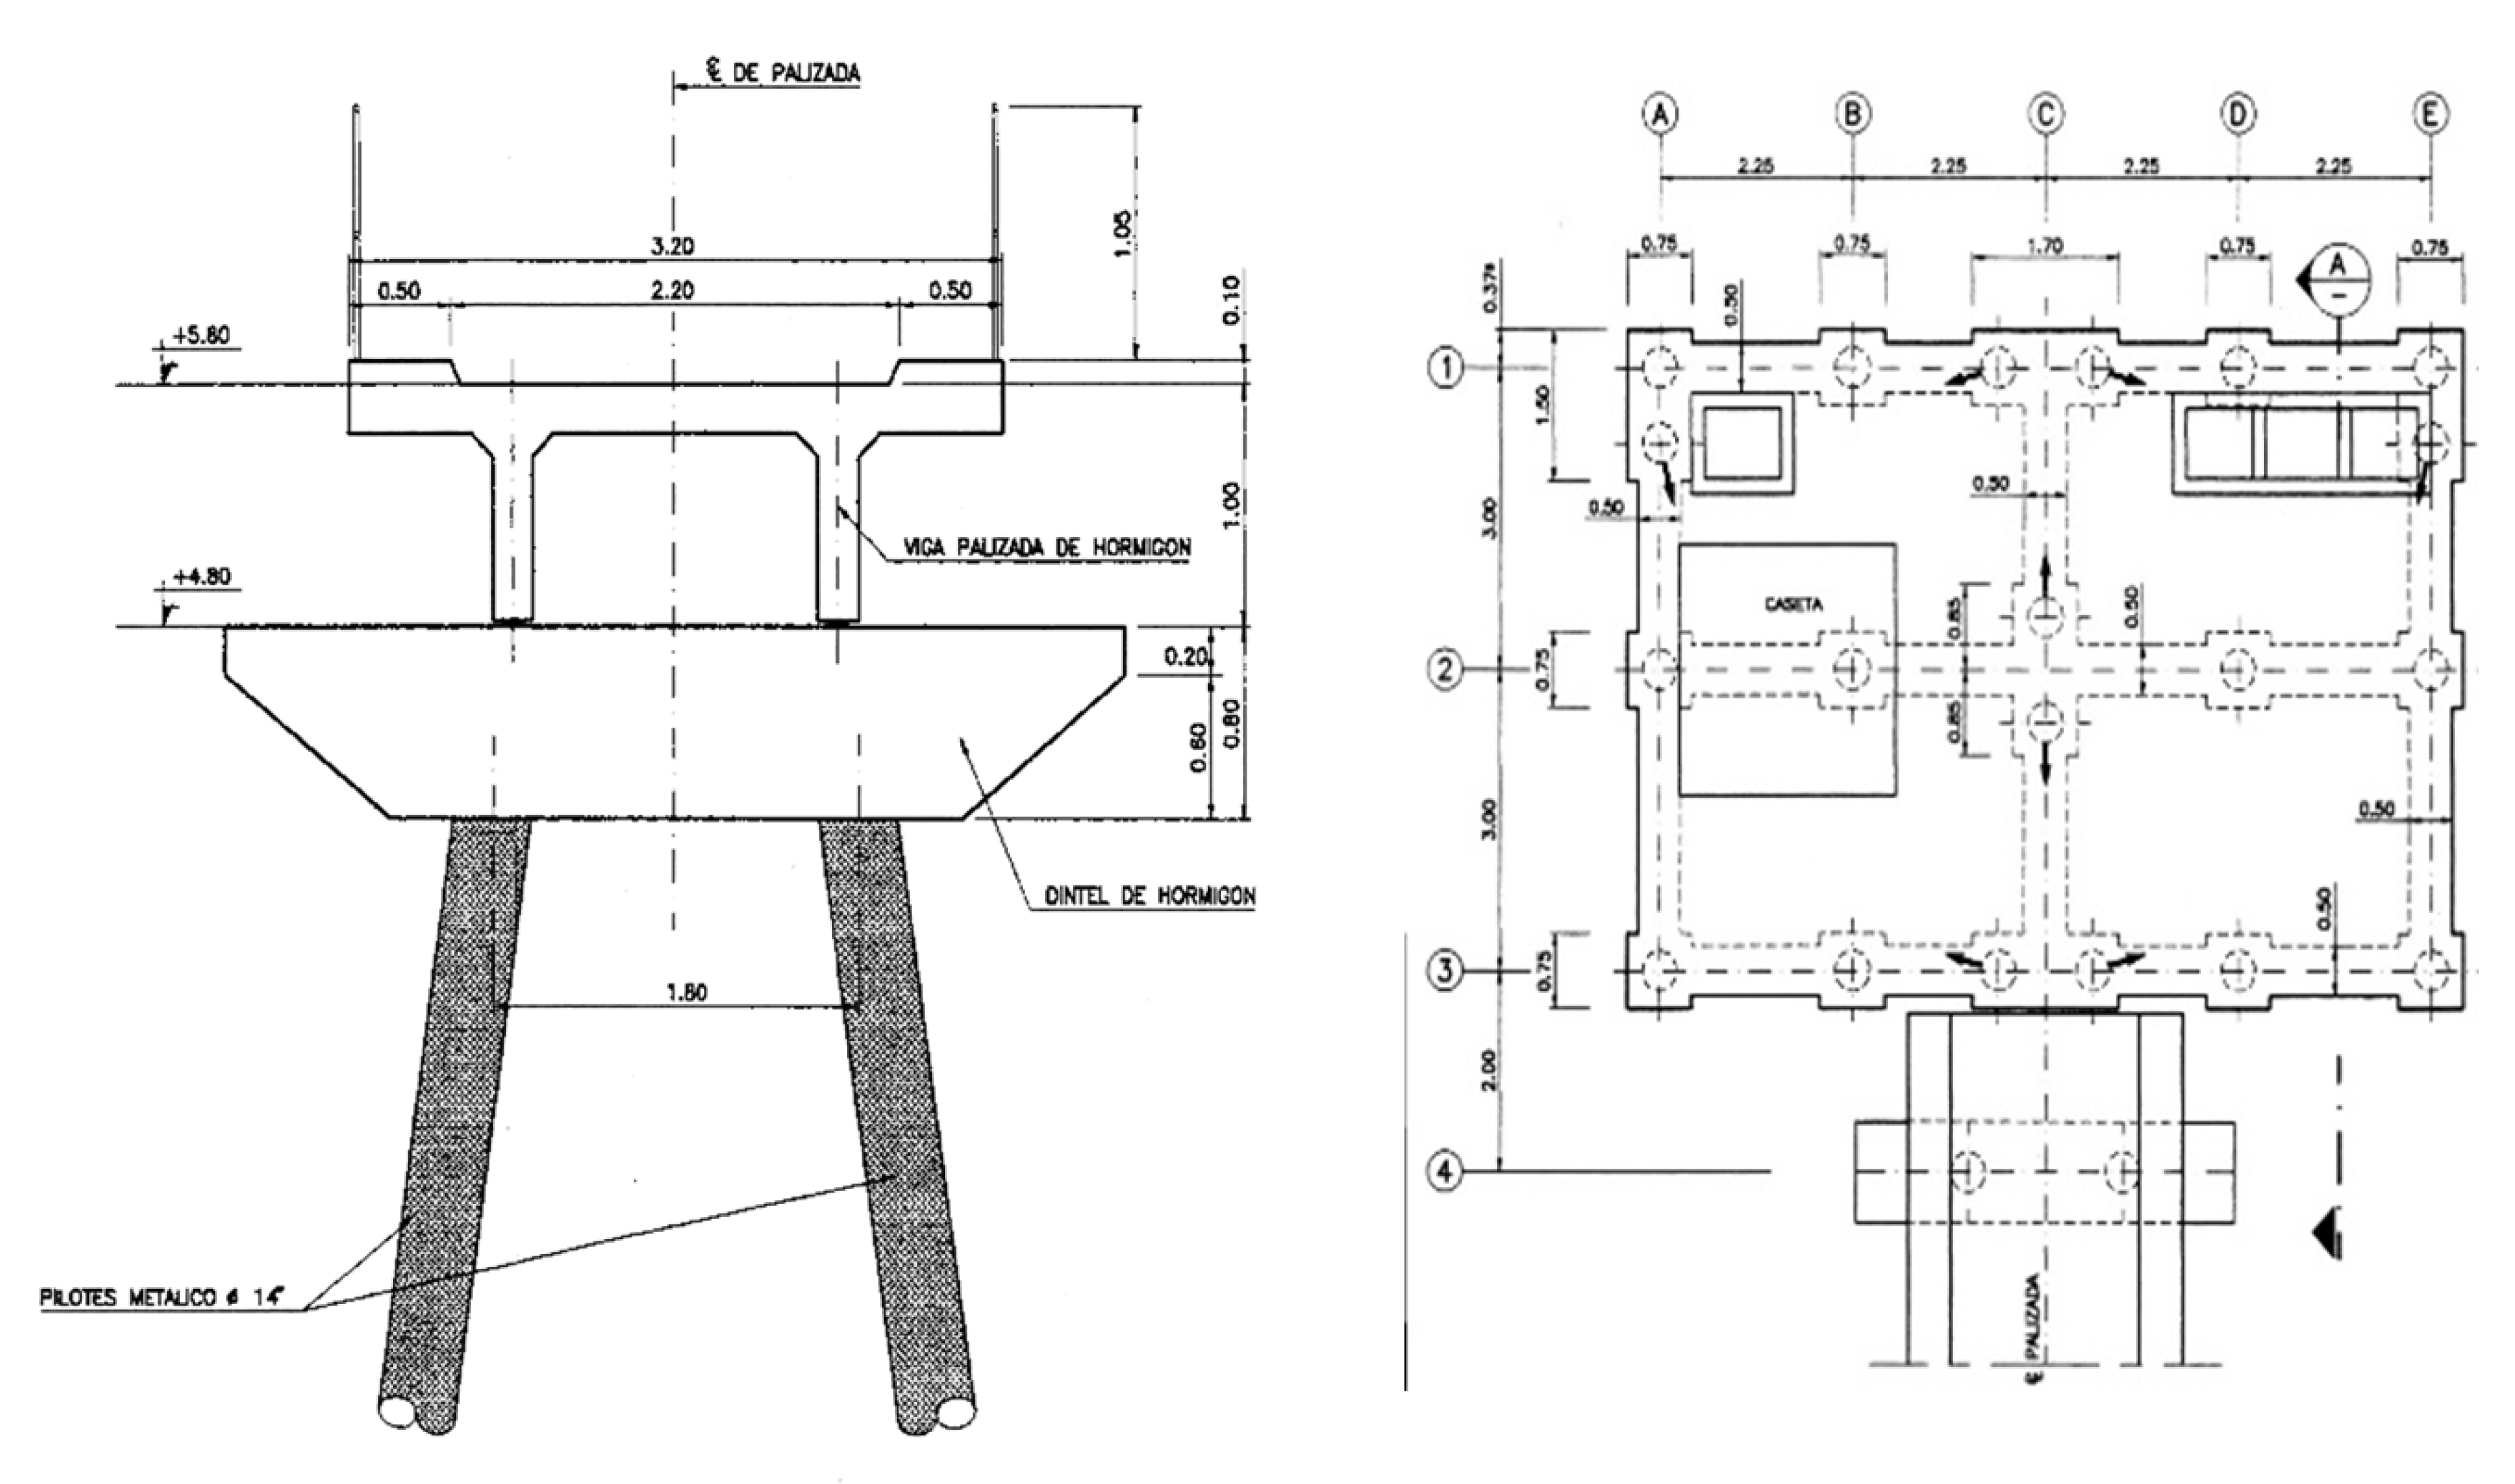
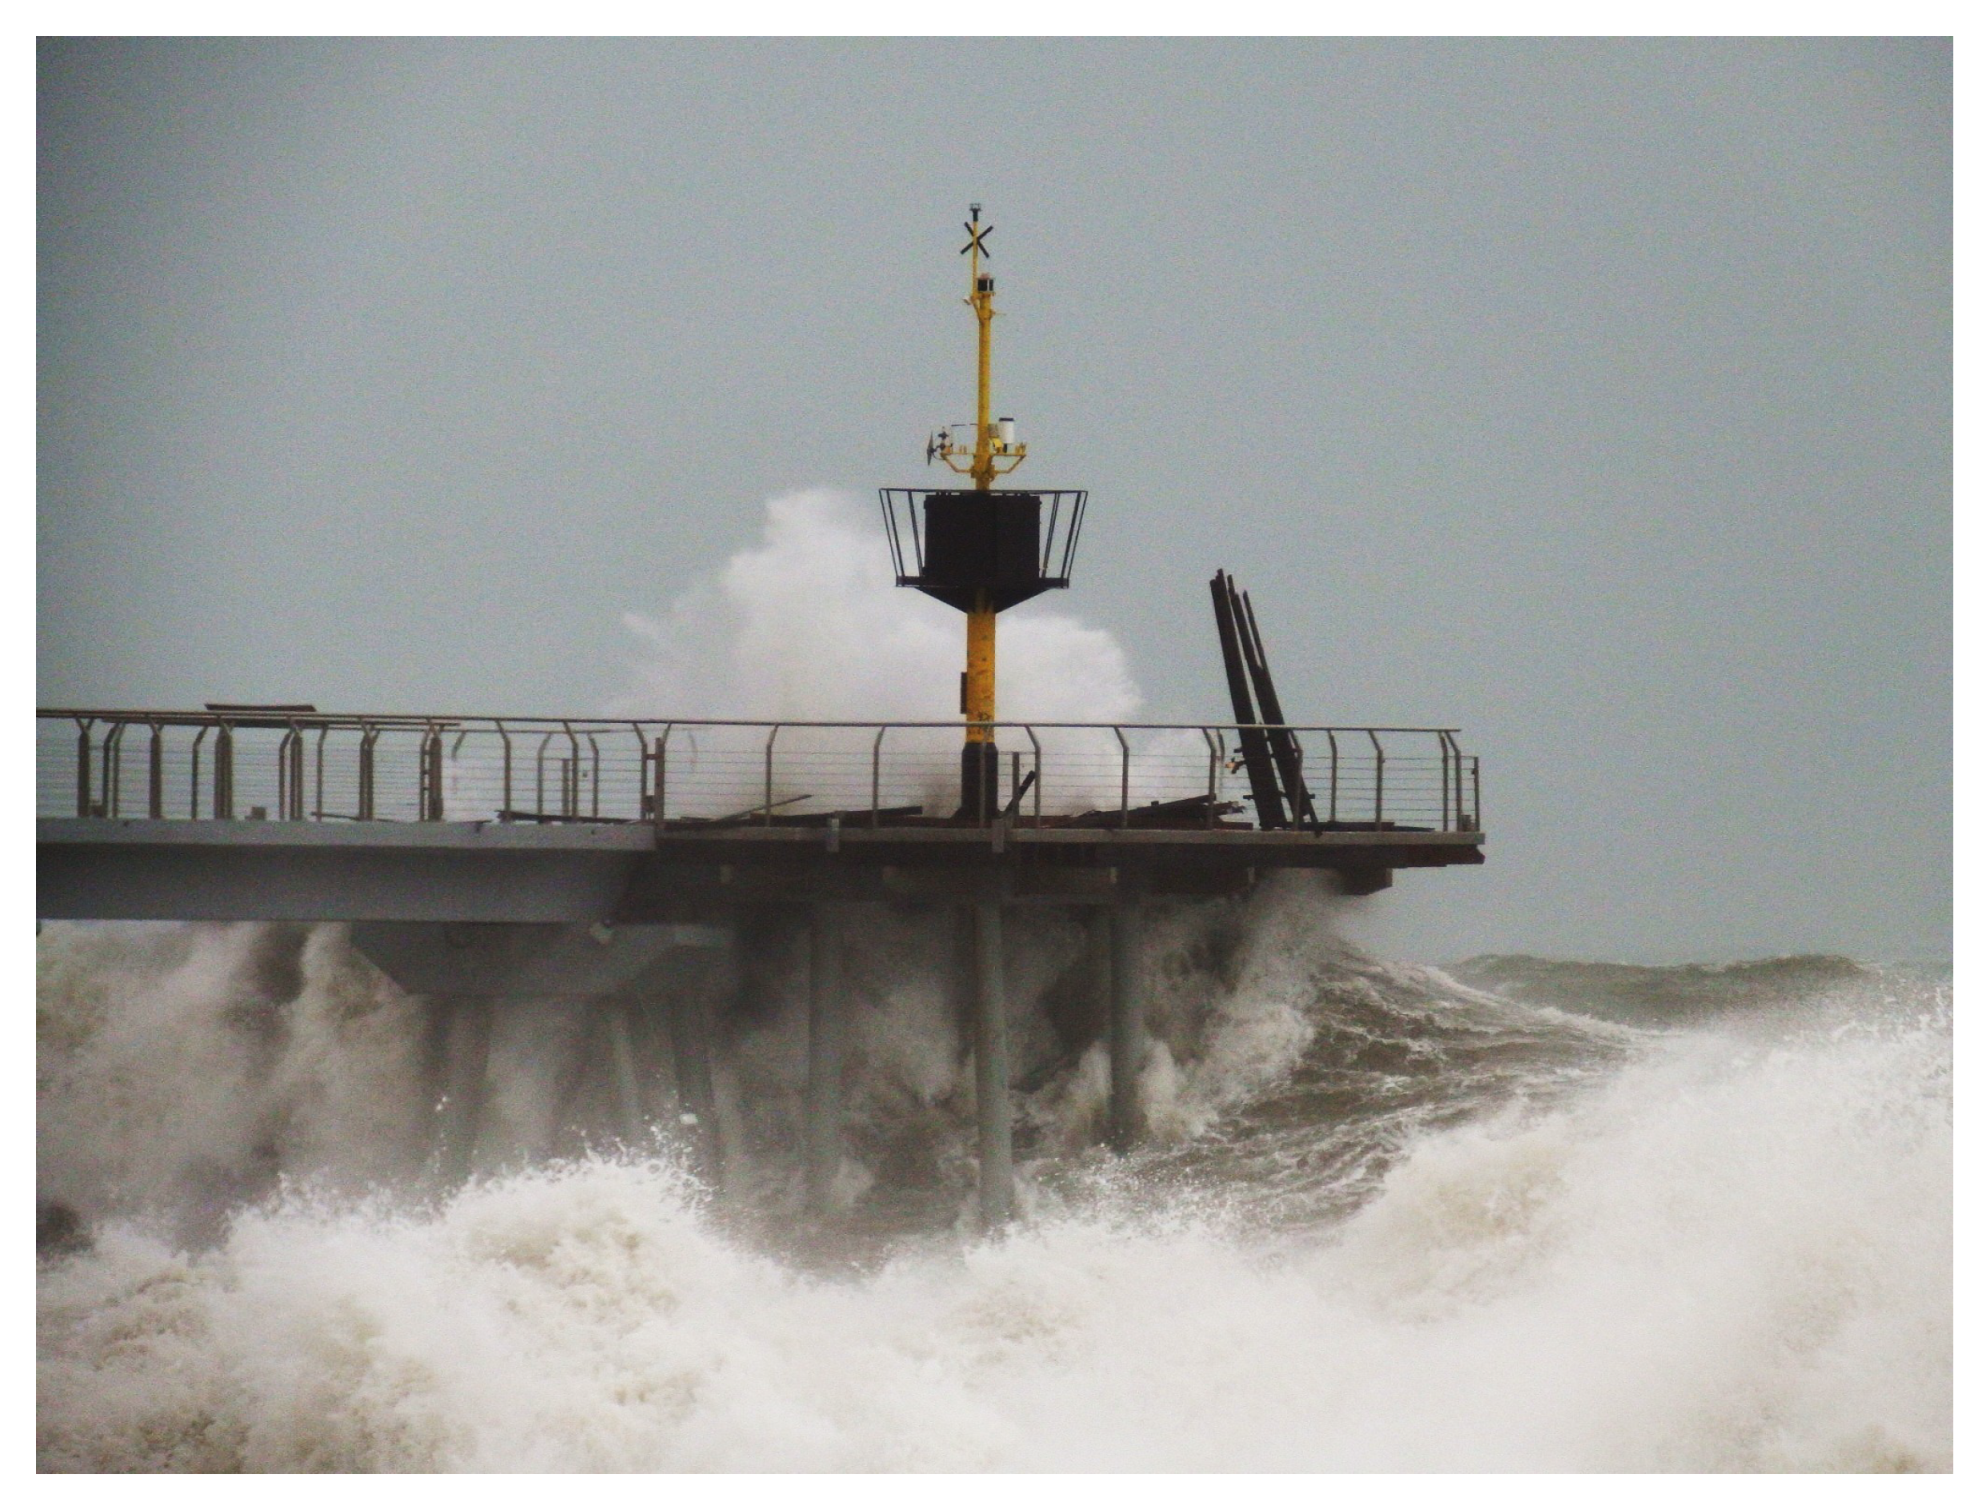
2.1. The Pont del Petroli Pier
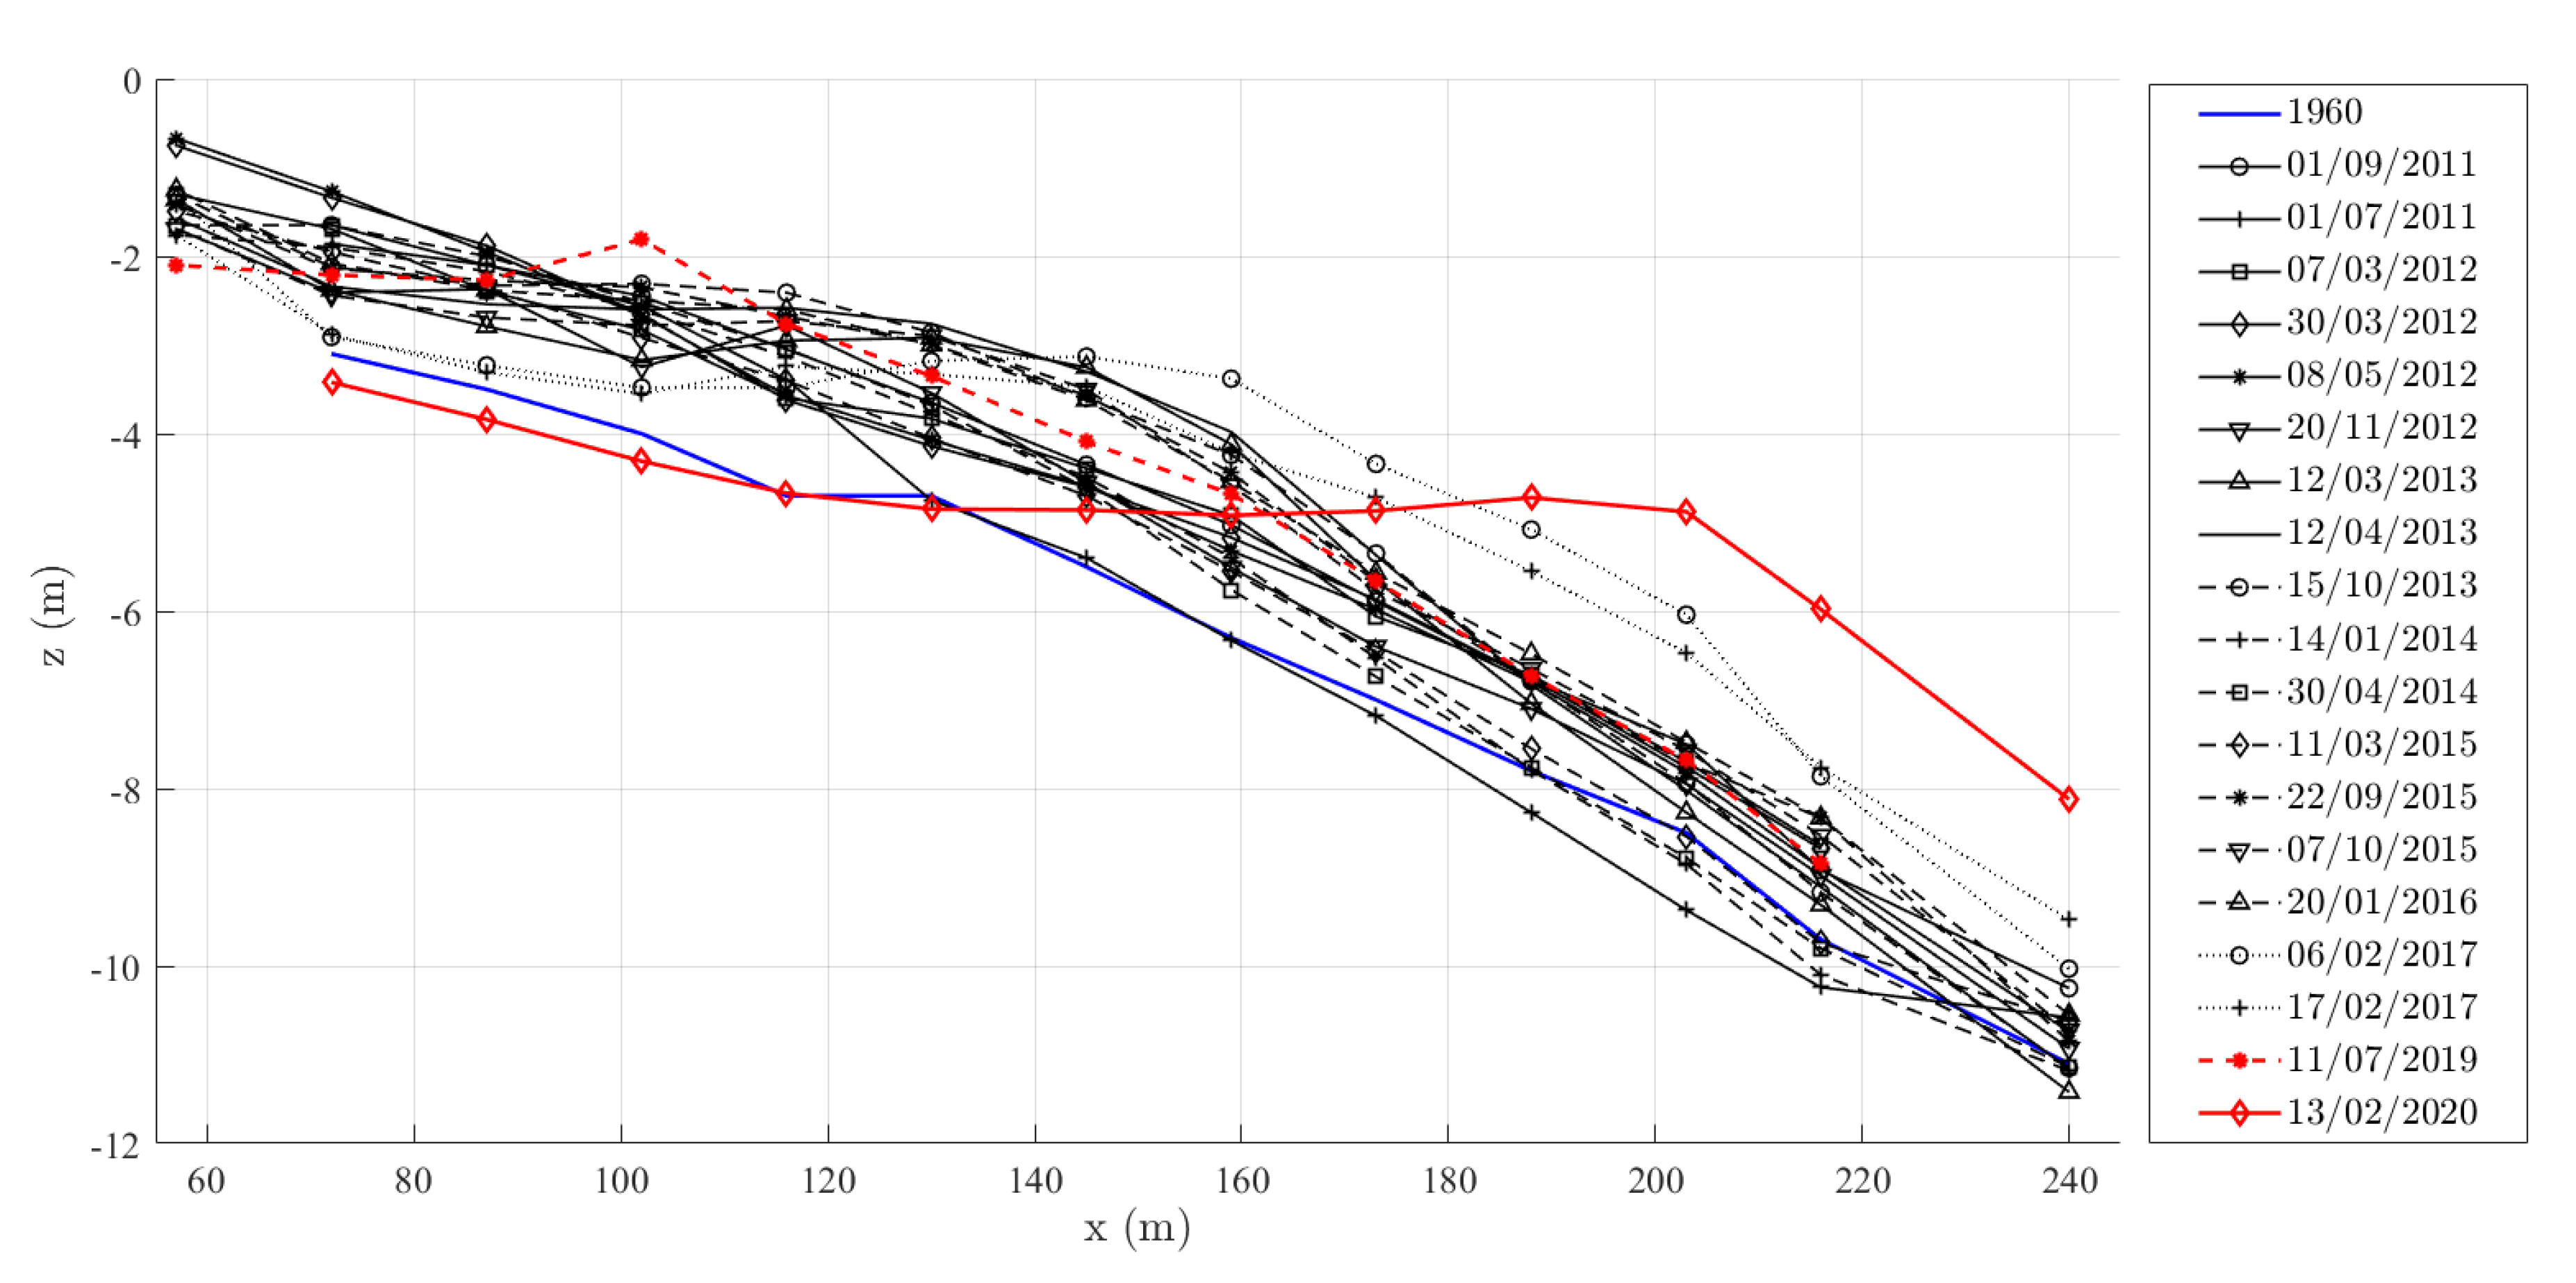
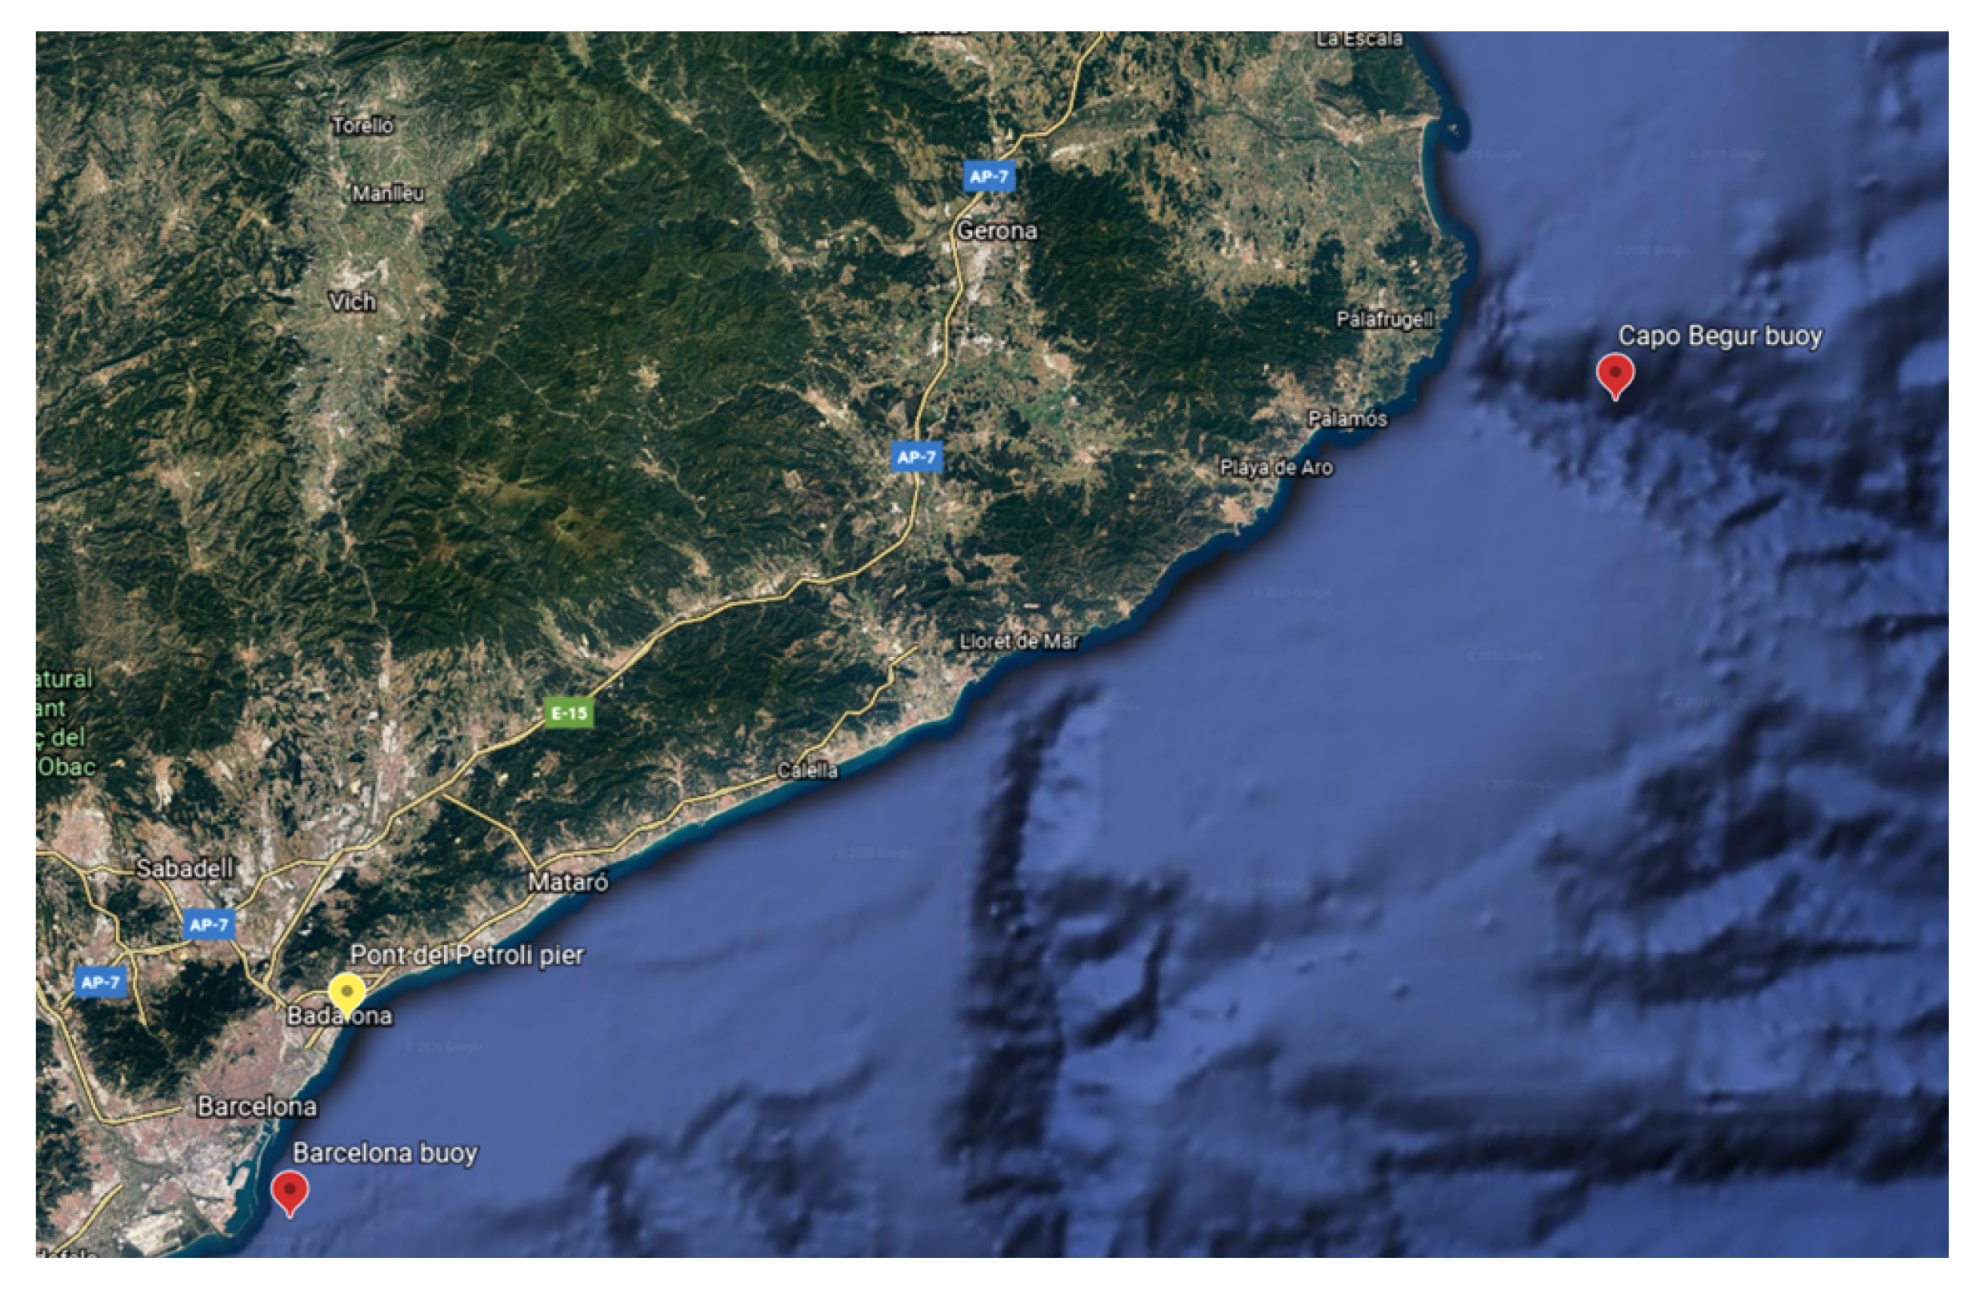
2.2. Storm Gloria: Description and Damage to the Pont del Petroli
3. Numerical Model
3.1. The DualSPHysics Code
3.2. Validation
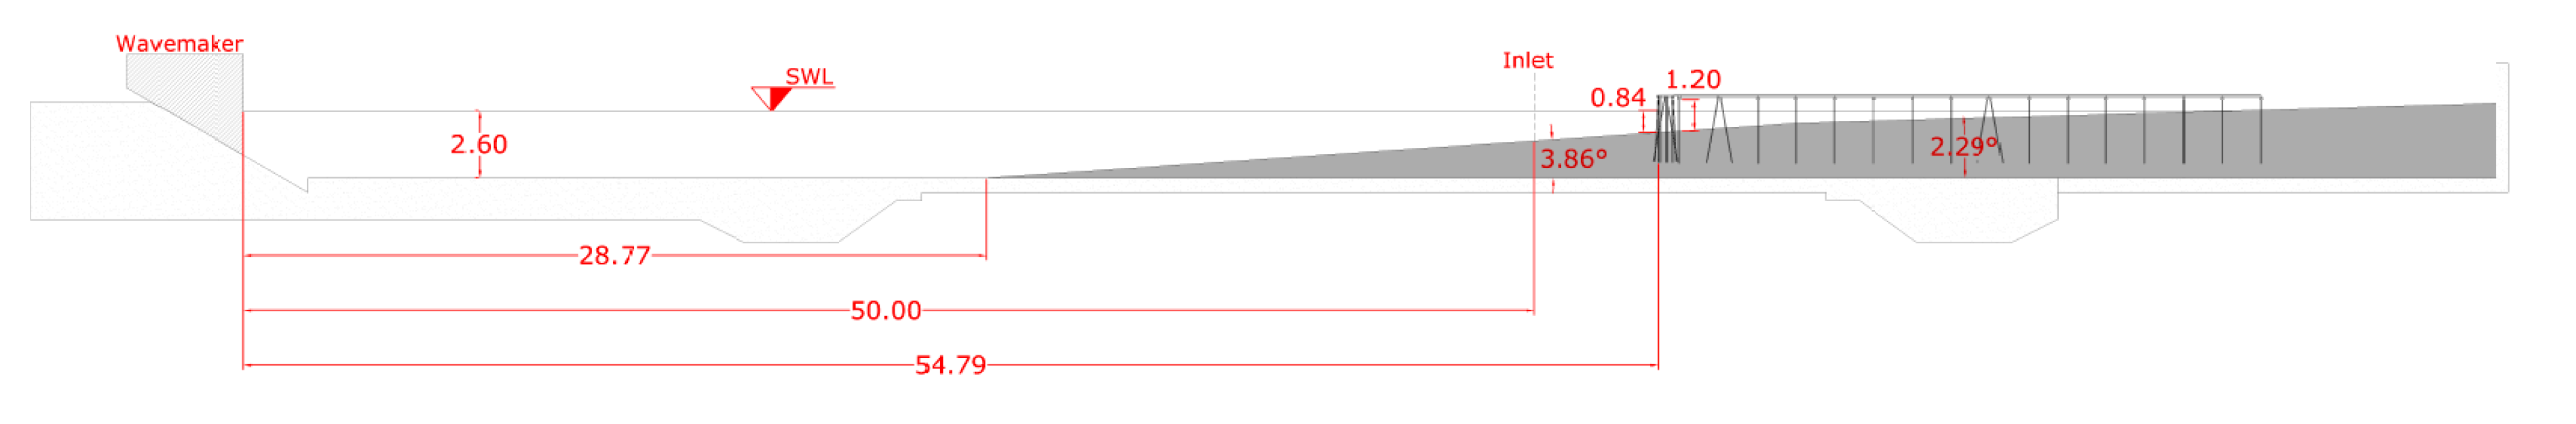
3.3. Model Set-Up
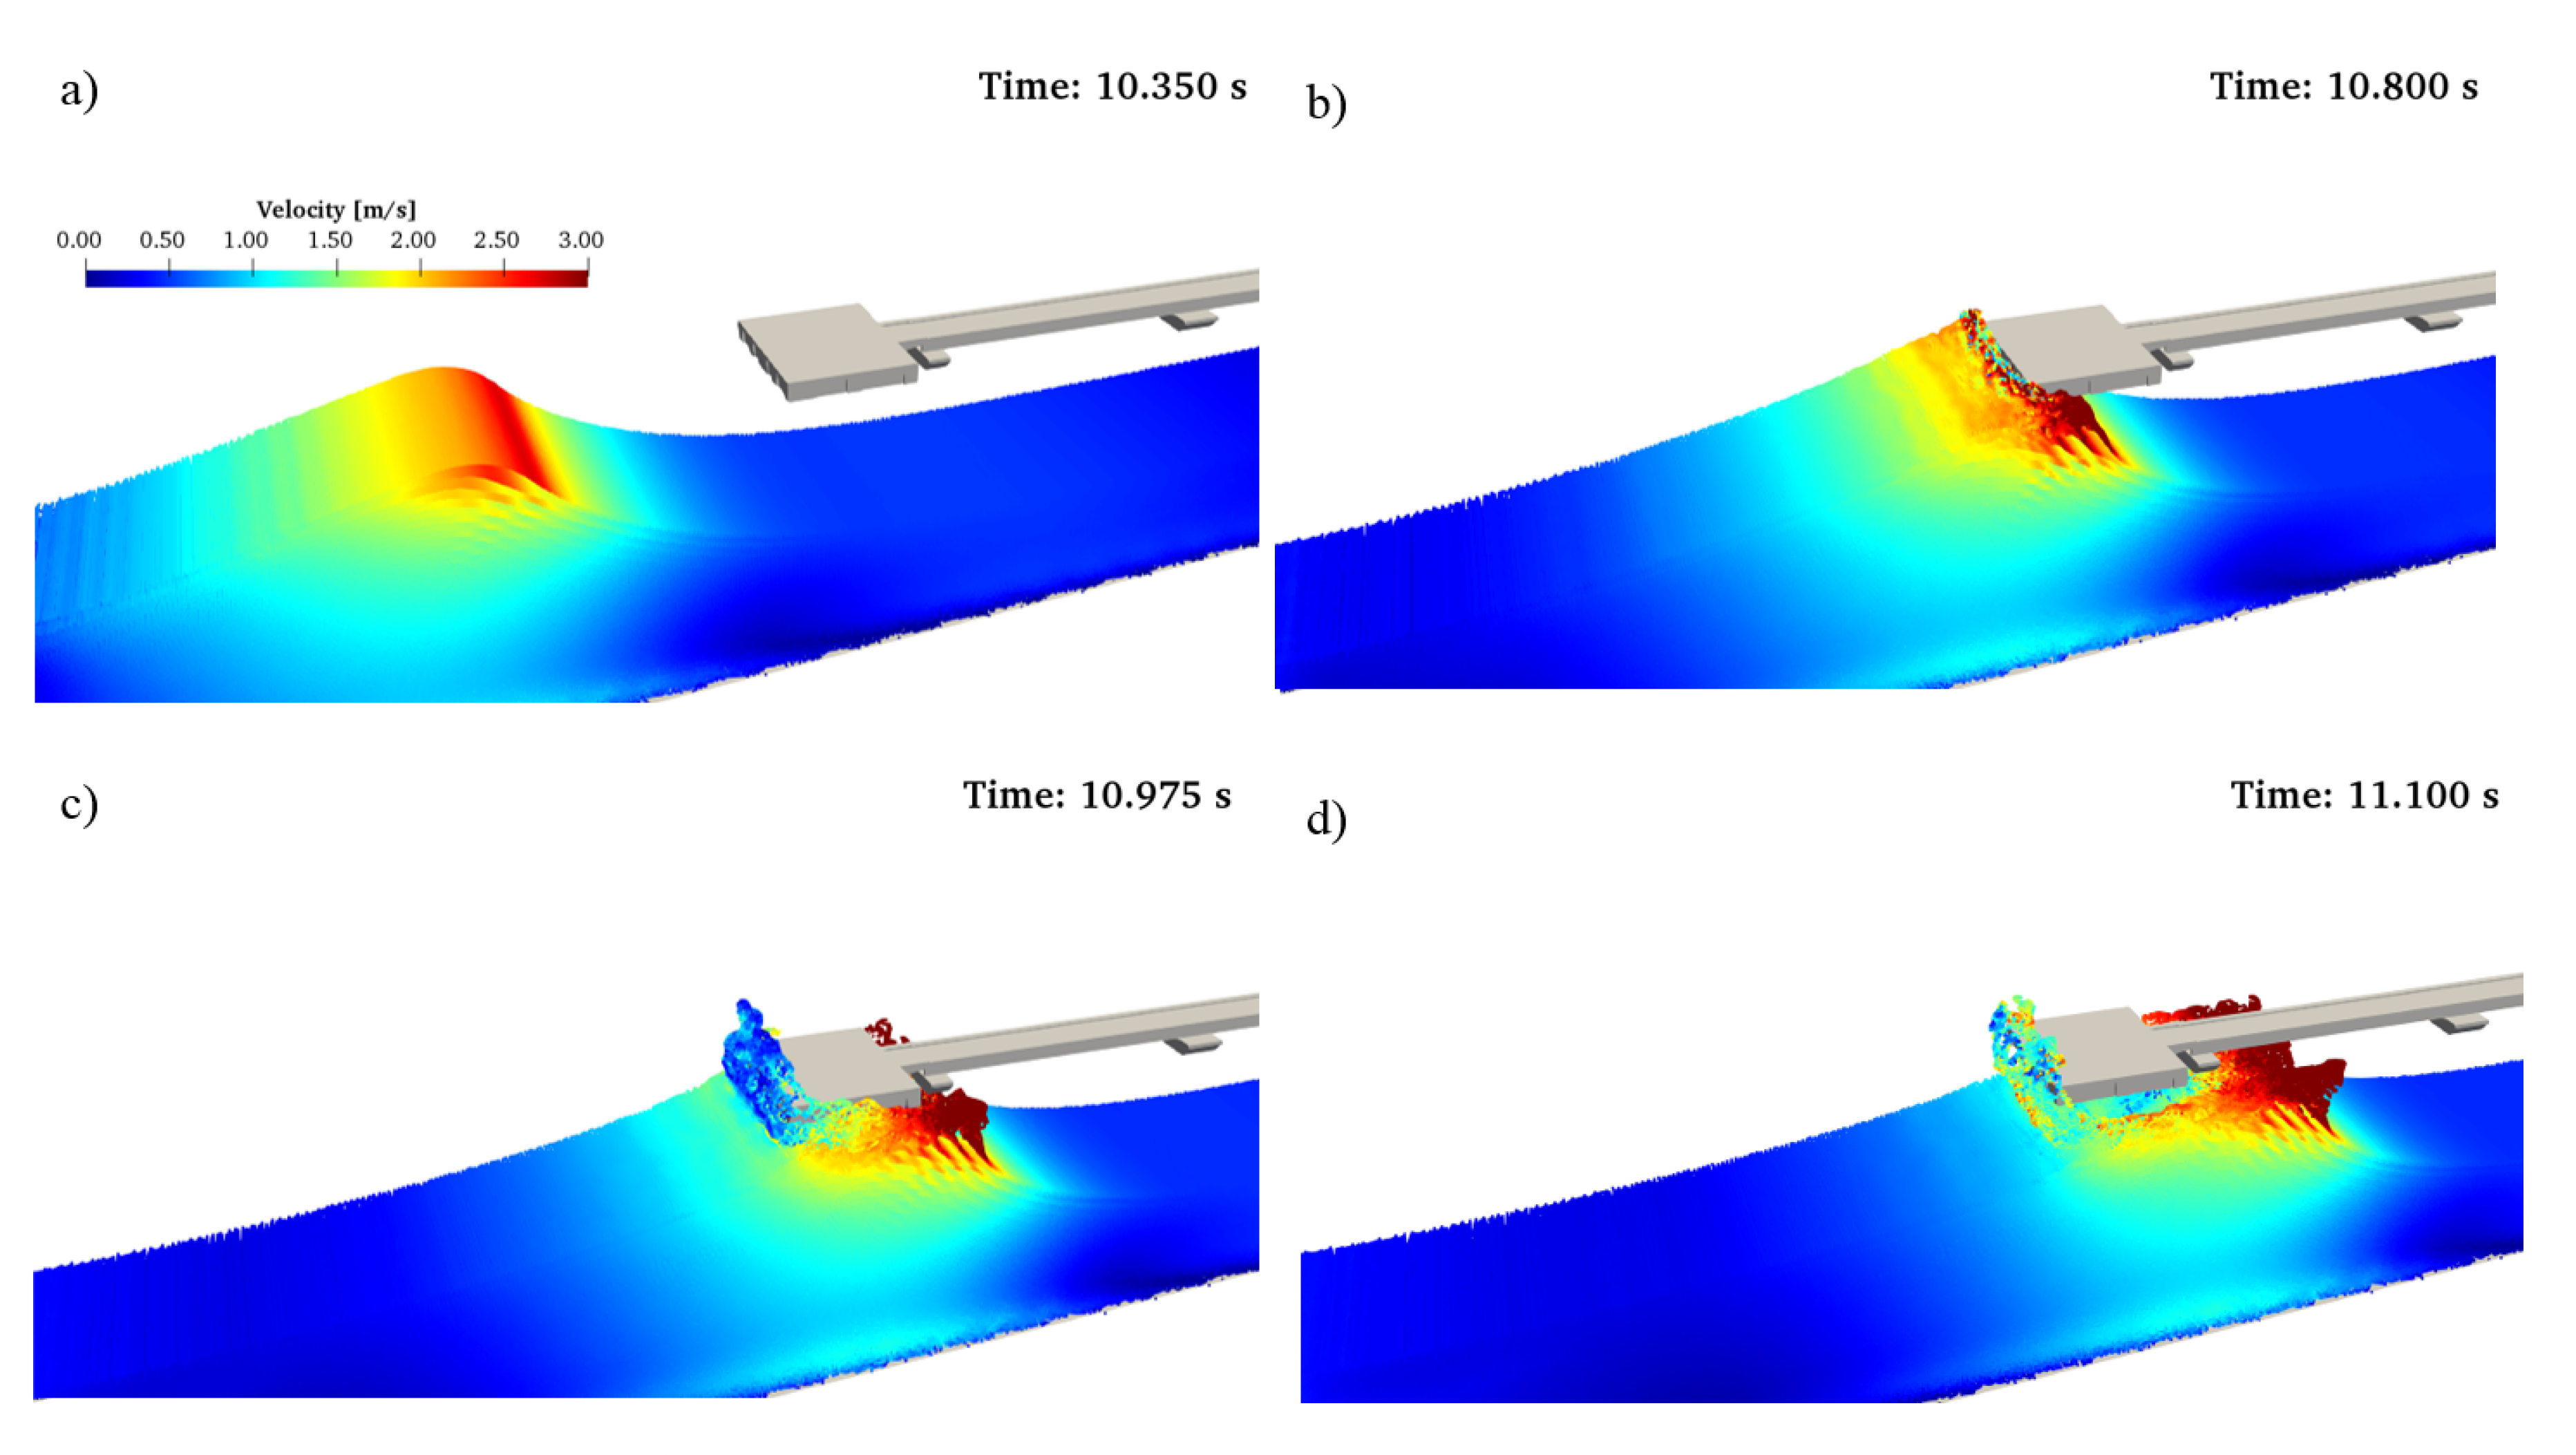
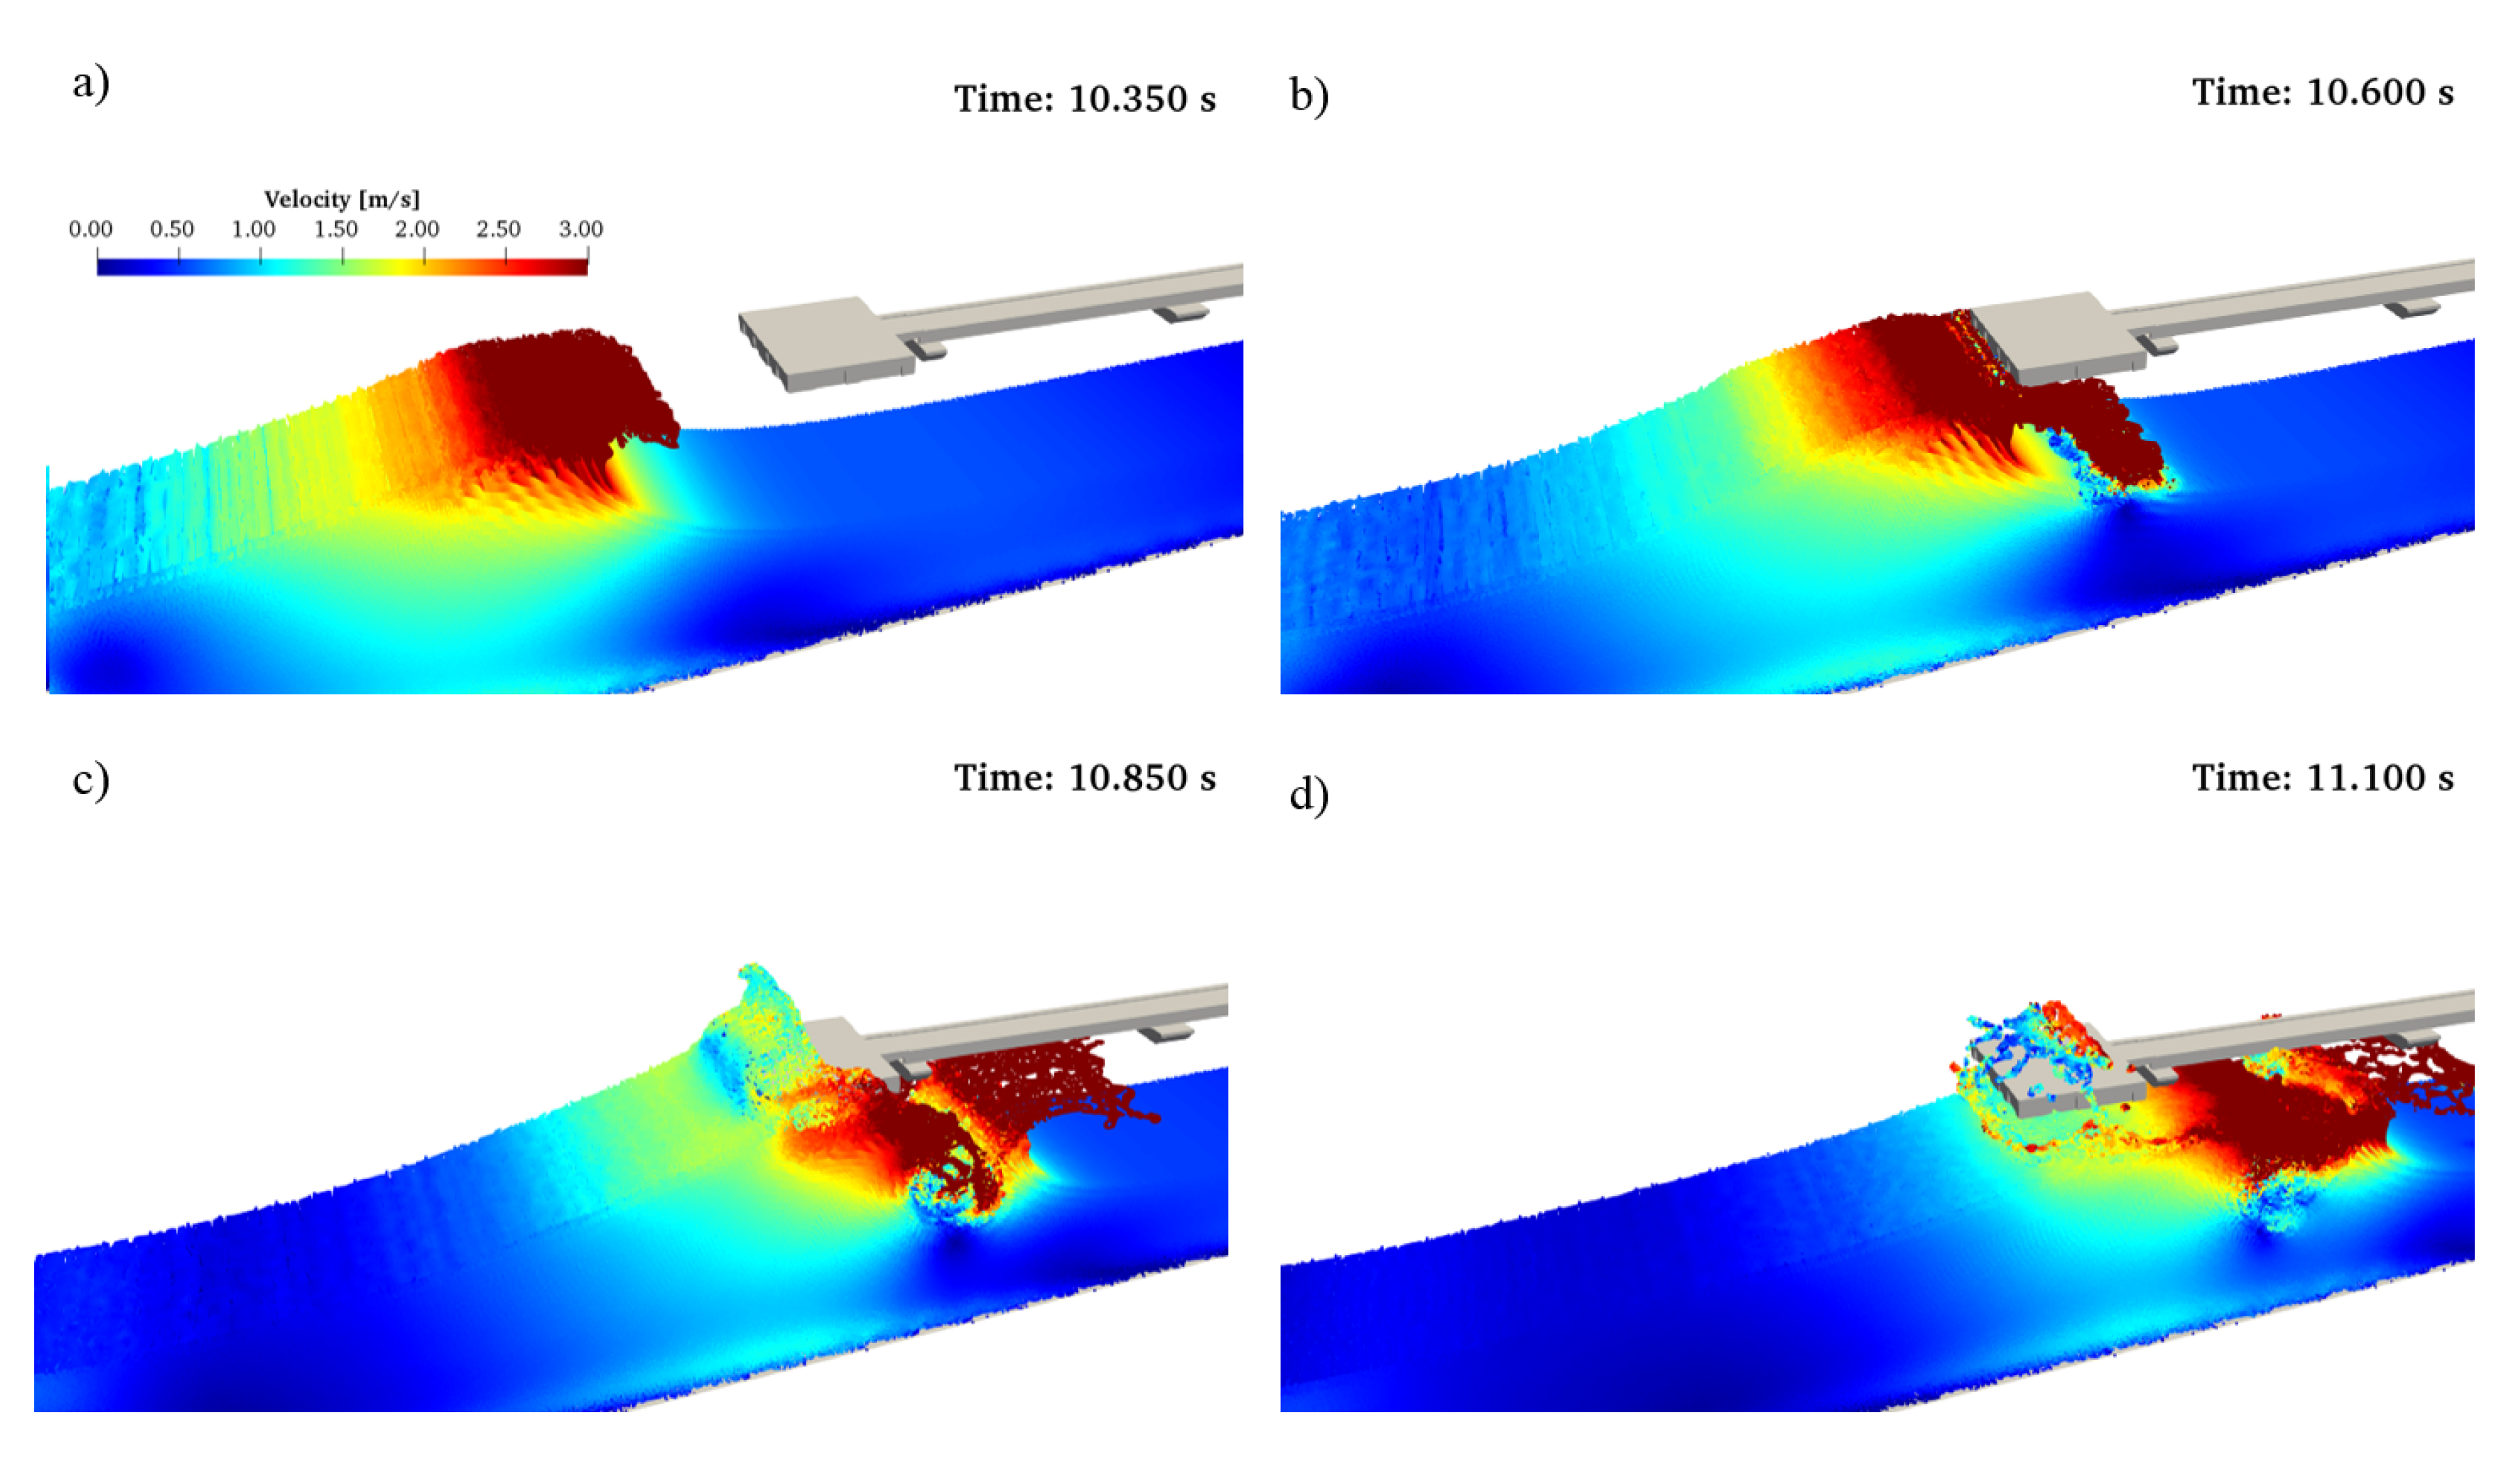
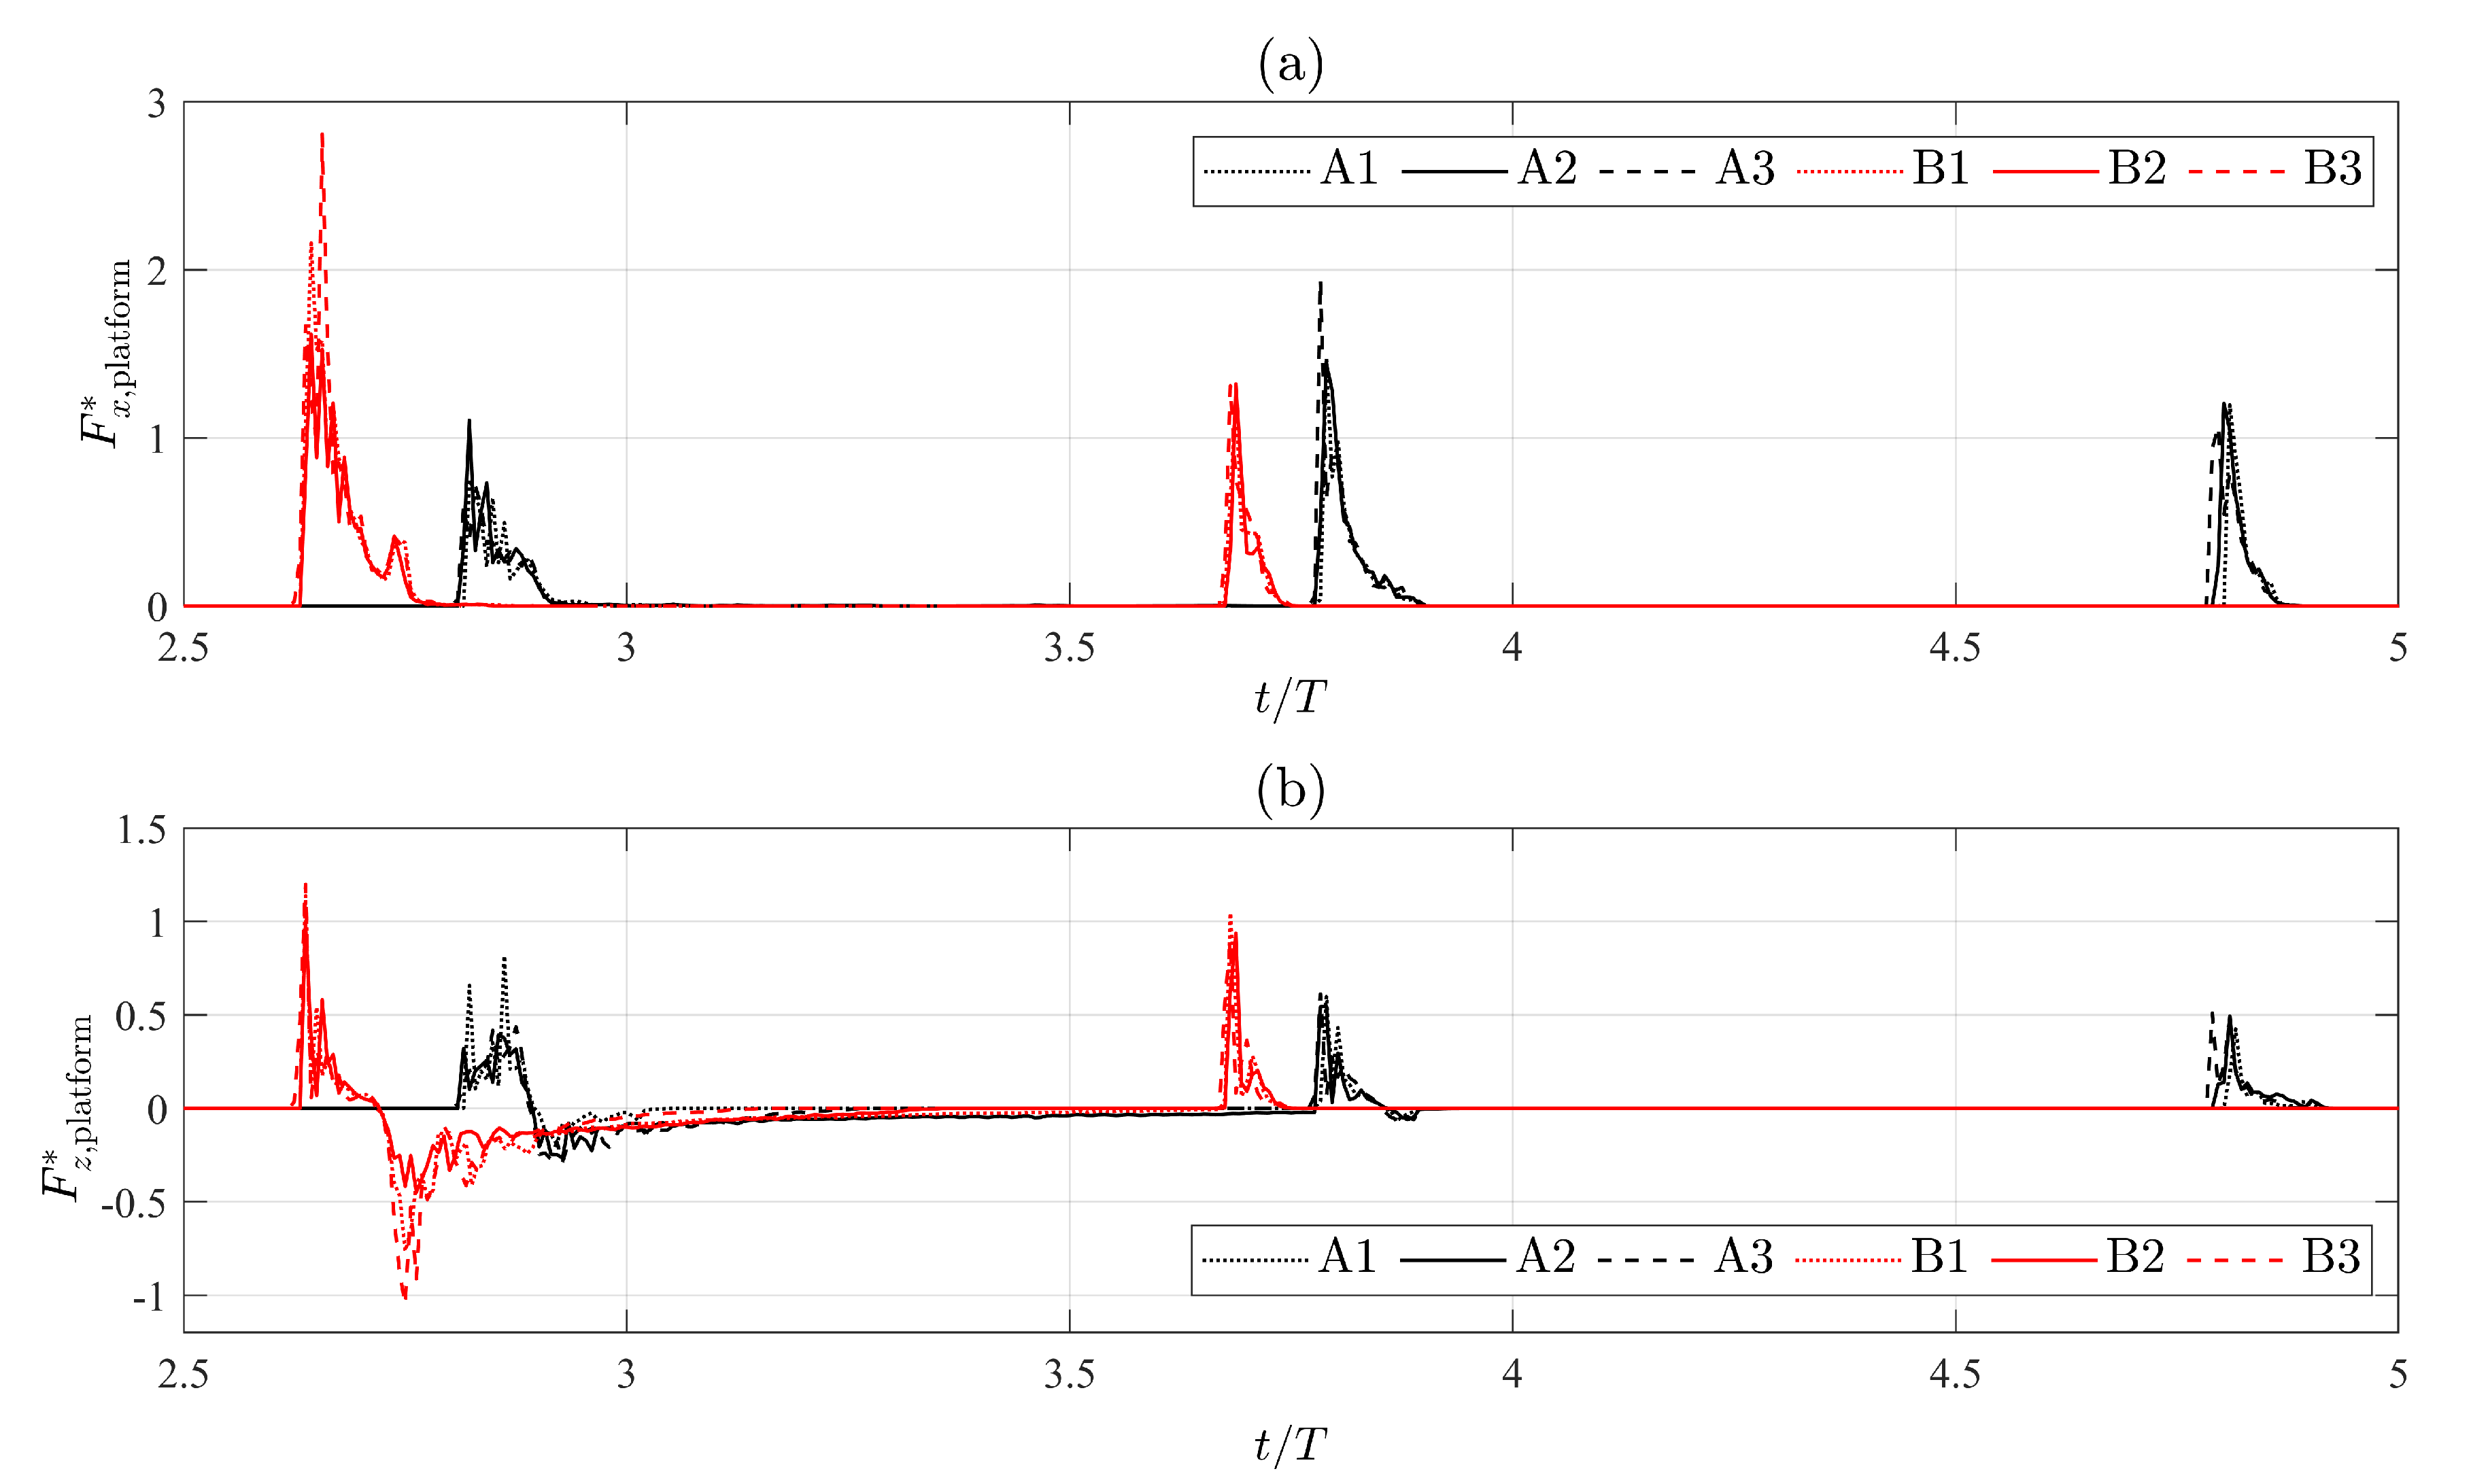
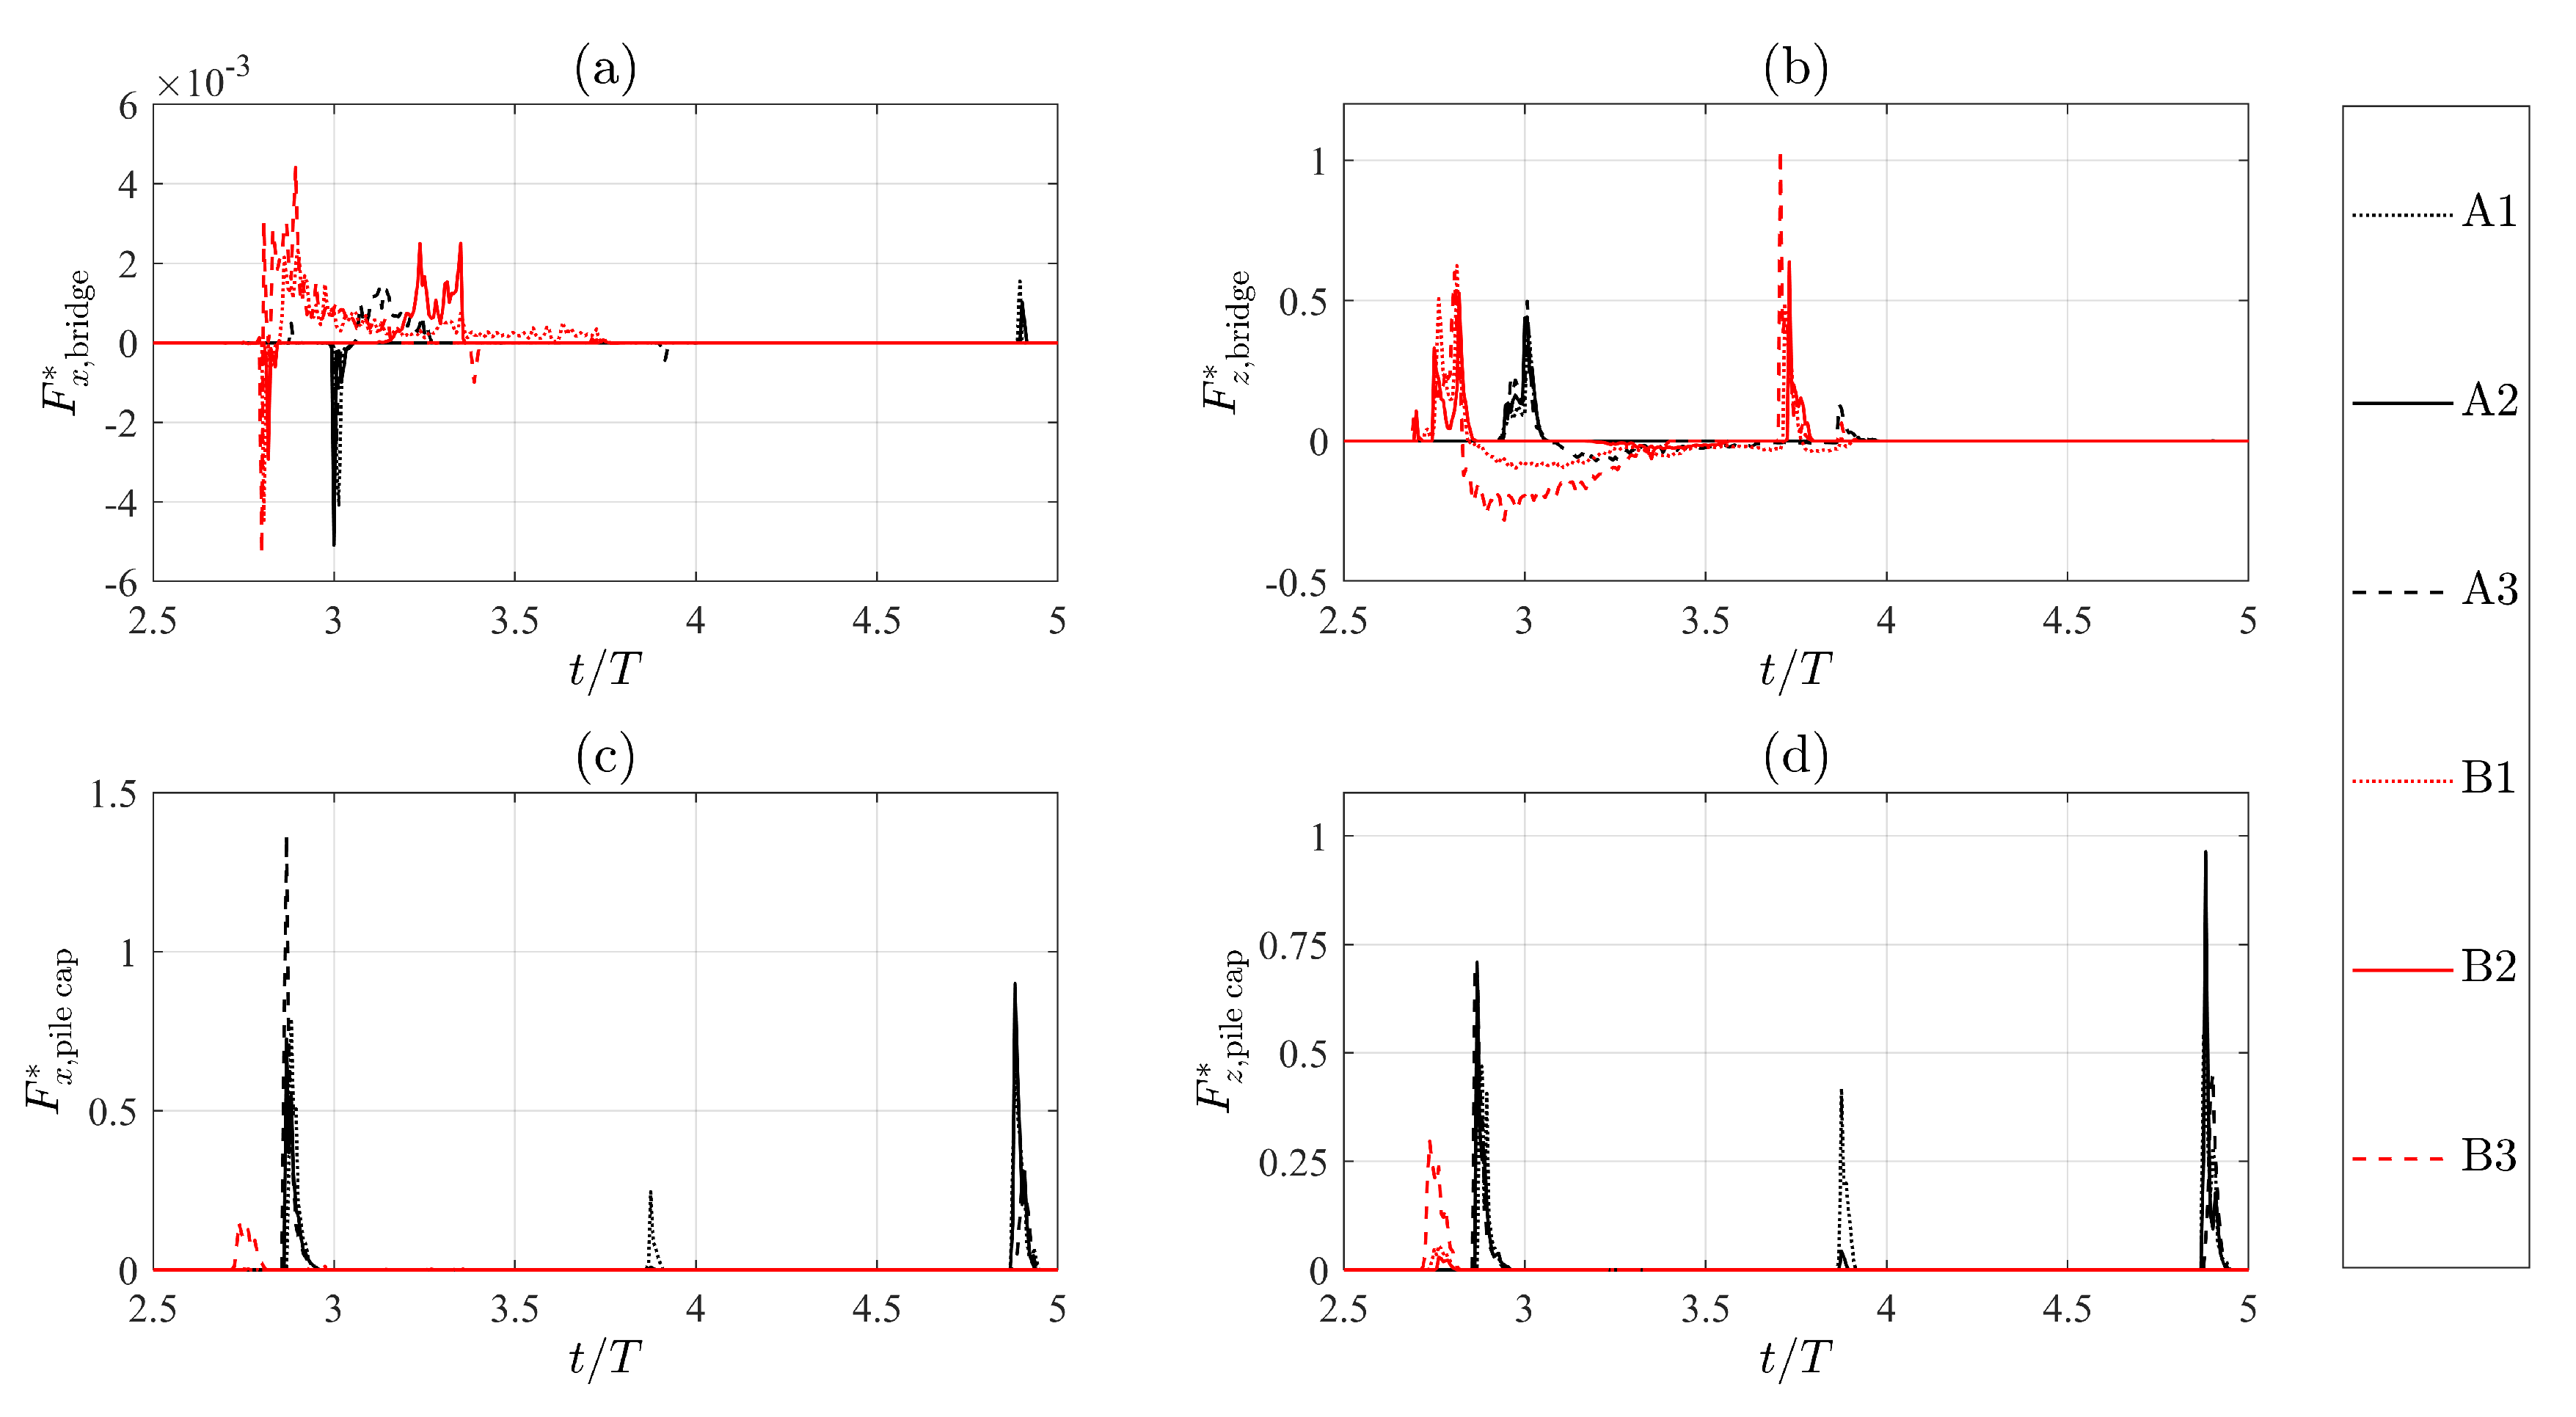
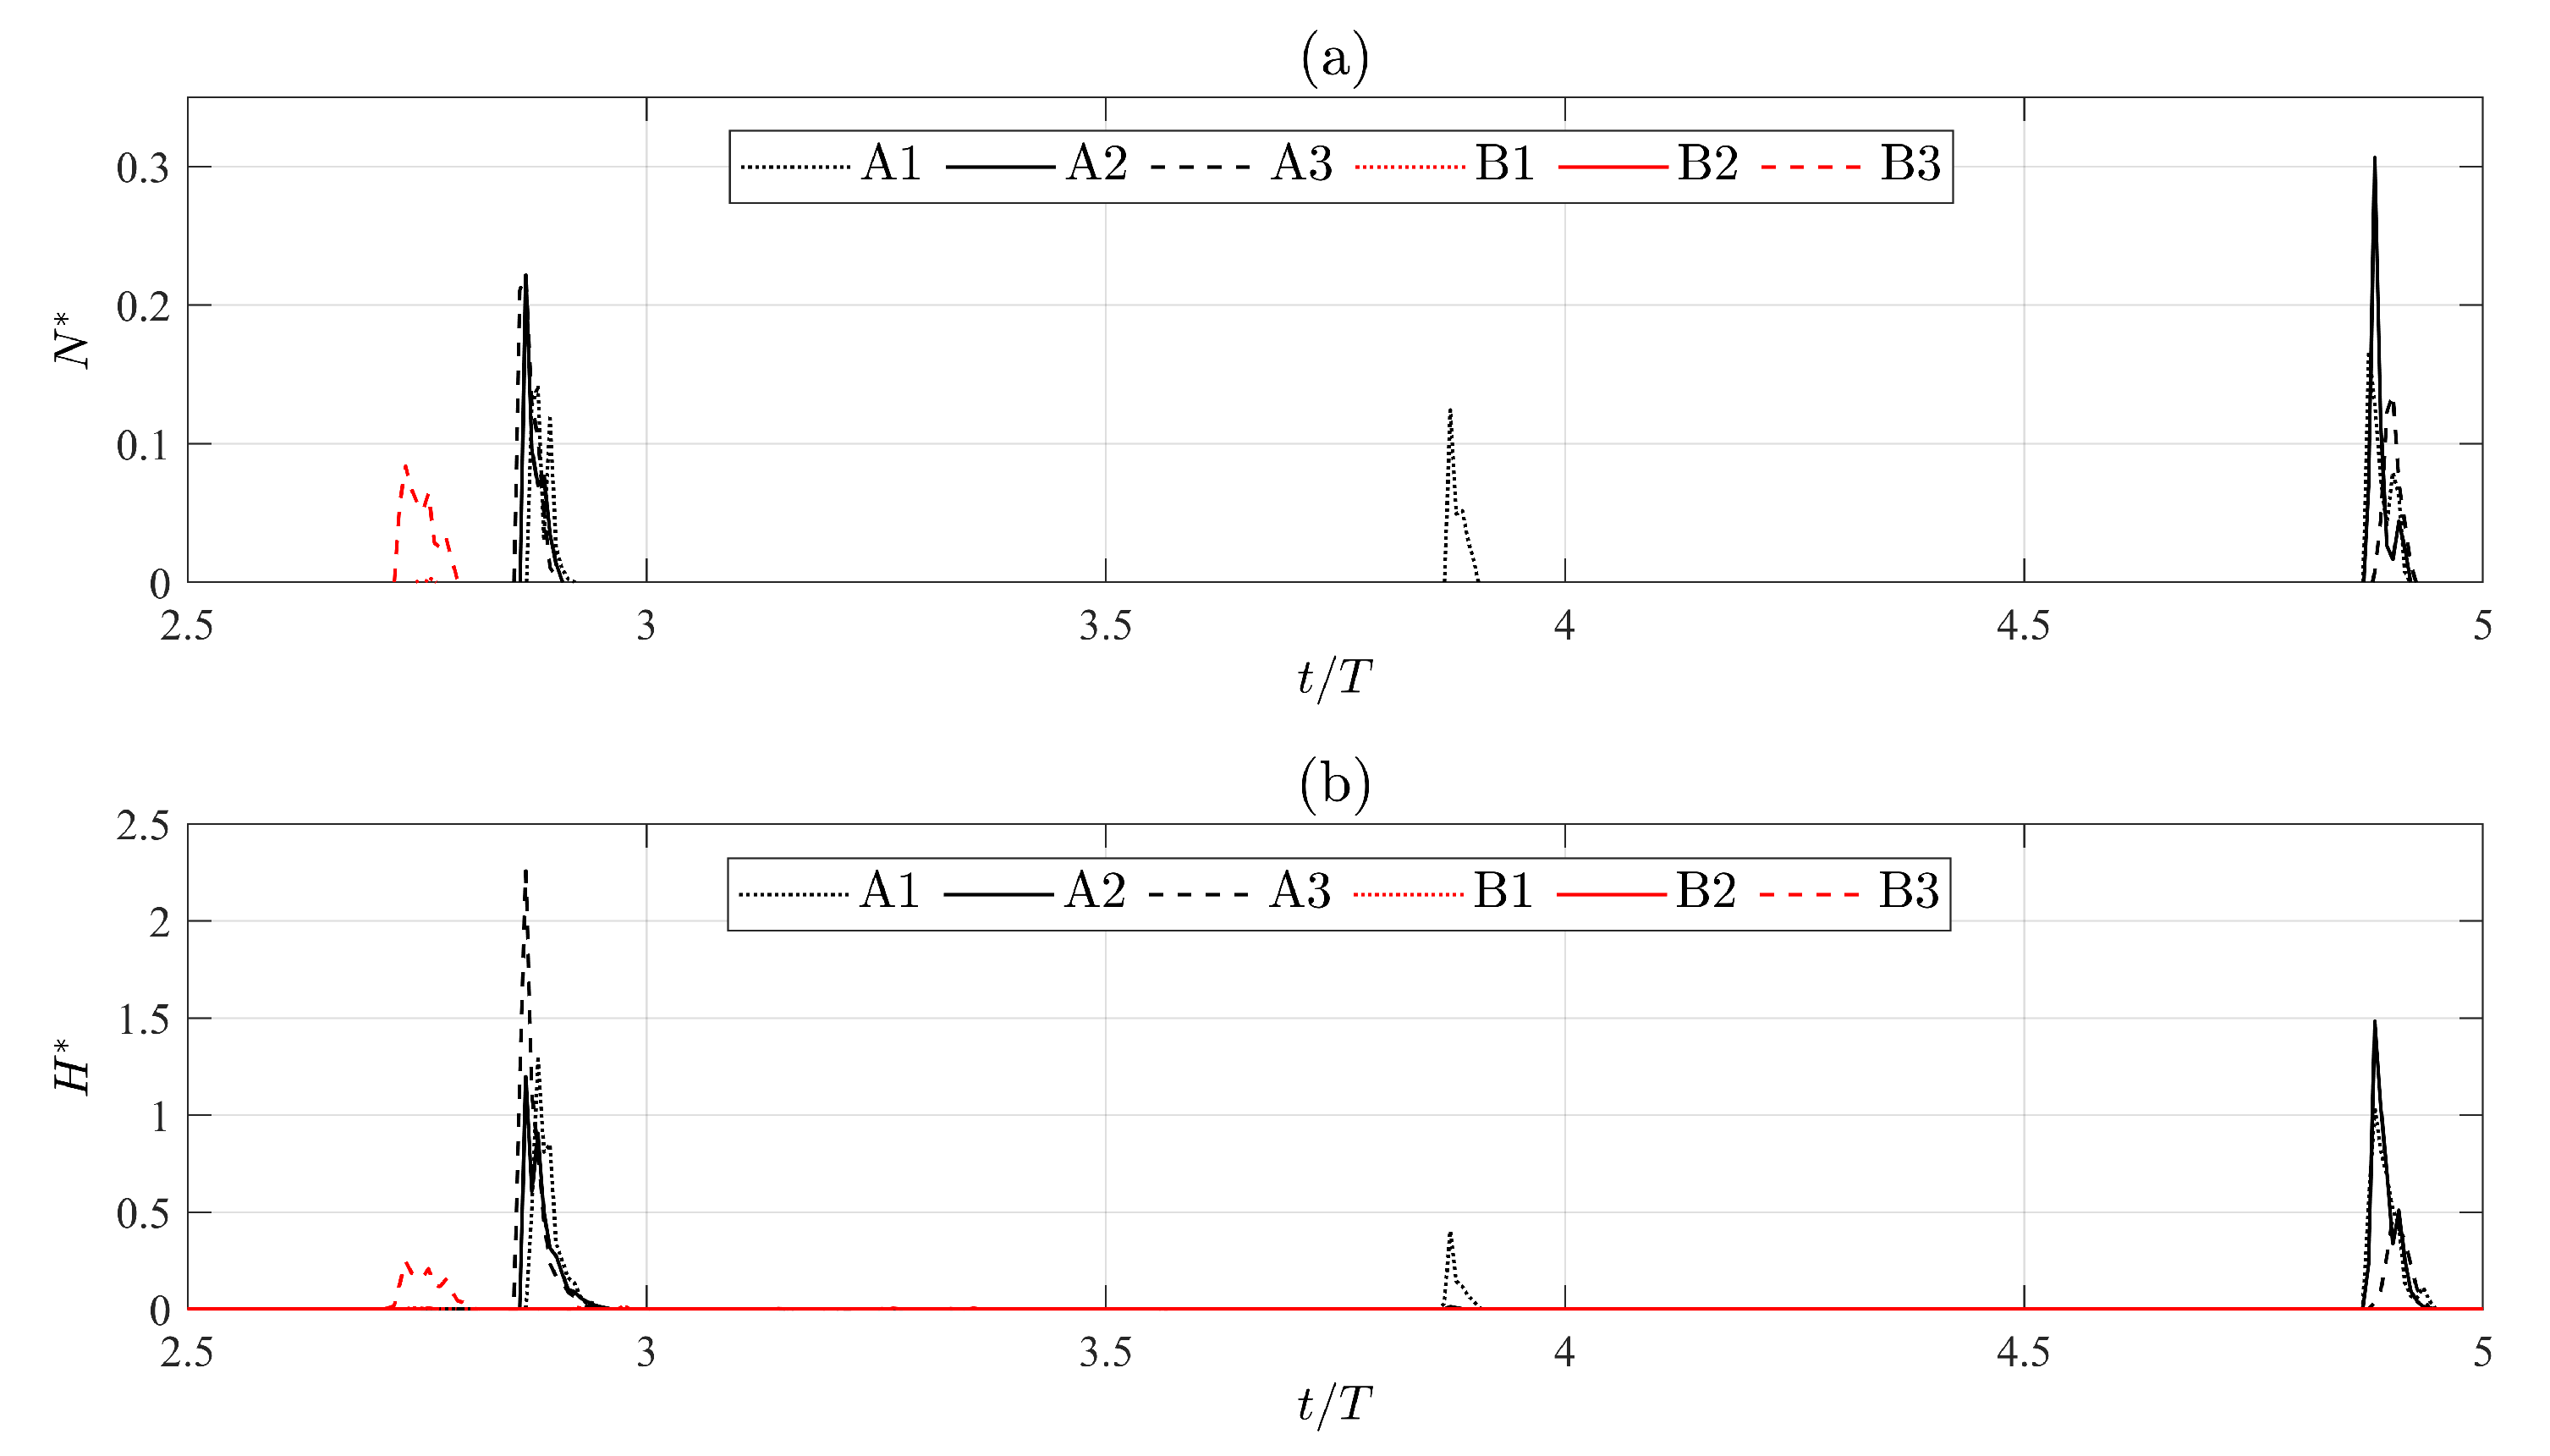
4. Results and Discussion
Derived Pile Axial Loads and Soil Bearing Capacity
5. Conclusions
Author Contributions
Funding
Conflicts of Interest
References
- Amores, A.; Marcos, M.; Carrió, D.S.; Gómez-Pujol, L. Coastal impacts of storm Gloria (January 2020) over the north-western Mediterranean. Nat. Hazards Earth Syst. Sci. 2020, 20, 1955–1968. [Google Scholar] [CrossRef]
- Reed, H.L. Wave interactions in swept-wing flows. Phys. Fluids 1987, 30, 3419–3426. [Google Scholar] [CrossRef]
- Rainey, R.C.T. A new equation for calculating wave loads on offshore structures. J. Fluid Mech. 1989, 204, 295–324. [Google Scholar] [CrossRef]
- Ferrant, P. Runup On a Cylinder Due to Waves and Current: Potential Flow Solution With Fully Nonlinear Boundary Conditions. Int. Soc. Offshore Polar Eng. 2001, 11, 33–41. [Google Scholar]
- Chalikov, D.; Sheinin, D. Modeling extreme waves based on equations of potential flow with a free surface. J. Comput. Phys. 2005, 210, 247–273. [Google Scholar] [CrossRef]
- Garriga, O.S.; Falzarano, J.M. Water Wave Interaction on a Truncated Vertical Cylinder. J. Offshore Mech. Arct. Eng. 2008, 130, 031002. [Google Scholar] [CrossRef]
- Casadei, F.; Halleux, J.; Sala, A.; Chillè, F. Transient fluid—Structure interaction algorithms for large industrial applications. Comput. Methods Appl. Mech. Eng. 2001, 190, 3081–3110. [Google Scholar] [CrossRef]
- Wang, Q.; Goosen, J.; van Keulen, F. An efficient fluid—Structure interaction model for optimizing twistable flapping wings. J. Fluids Struct. 2017, 73, 82–99. [Google Scholar] [CrossRef]
- Martínez-Ferrer, P.J.; Qian, L.; Ma, Z.; Causon, D.M.; Mingham, C.G. An efficient finite-volume method to study the interaction of two-phase fluid flows with elastic structures. J. Fluids Struct. 2018, 83, 54–71. [Google Scholar] [CrossRef] [Green Version]
- Zhan, L.; Peng, C.; Zhang, B.; Wu, W. A stabilized TL—WC SPH approach with GPU acceleration for three-dimensional fluid—Structure interaction. J. Fluids Struct. 2019, 86, 329–353. [Google Scholar] [CrossRef]
- Liang, H.; Ouled Housseine, C.; Chen, X.; Shao, Y. Efficient methods free of irregular frequencies in wave and solid/porous structure interactions. J. Fluids Struct. 2020, 98, 103130. [Google Scholar] [CrossRef]
- Gingold, R.A.; Monaghan, J.J. Smoothed particle hydrodynamics: Theory and application to non-spherical stars. Mon. Not. R. Astron. Soc. 1977, 181, 375–389. [Google Scholar] [CrossRef]
- Monaghan, J.J. Smoothed particle hydrodynamics. Annu. Rev. Astron. Astr. 1992, 30, 543–574. [Google Scholar] [CrossRef]
- Liu, G.R.; Liu, M.B. Smoothed Particle Hydrodynamics: A Meshfree Particle Method; World Scientific: Singapore, 2003. [Google Scholar]
- Violeau, D.; Rogers, B.D. Smoothed particle hydrodynamics (SPH) for free-surface flows: Past, present and future. J. Hydraul. Res. 2016, 54, 1–26. [Google Scholar] [CrossRef]
- Gotoh, H.; Khayyer, A. Current achievements and future perspectives for projection-based particle methods with applications in ocean engineering. J. Ocean Eng. Mar. Energy 2016, 2, 251–278. [Google Scholar] [CrossRef] [Green Version]
- Violeau, D. Fluid Mechanics and the SPH Method: Theory and Applications; Oxford University Press: Oxford, UK, 2012. [Google Scholar]
- Tafuni, A.; Sahin, I. Non-linear hydrodynamics of thin laminae undergoing large harmonic oscillations in a viscous fluid. J. Fluids Struct. 2015, 52, 101–117. [Google Scholar] [CrossRef]
- Shi, Y.; Li, S.; Chen, H.; He, M.; Shao, S. Improved SPH simulation of spilled oil contained by flexible floating boom under wave—Current coupling condition. J. Fluids Struct. 2018, 76, 272–300. [Google Scholar] [CrossRef]
- Pan, K.; IJzermans, R.H.A.; Jones, B.D.; Thyagarajan, A.; van Beest, B.W.H.; Williams, J.R. Application of the SPH method to solitary wave impact on an offshore platform. Comp. Part. Mech. 2016, 3, 155–166. [Google Scholar] [CrossRef] [Green Version]
- Yang, Y.; Li, J. SPH-FE-Based Numerical Simulation on Dynamic Characteristics of Structure under Water Waves. J. Mar. Sci. Eng. 2020, 8, 630. [Google Scholar] [CrossRef]
- Domínguez, J.M.; Crespo, A.J.; Hall, M.; Altomare, C.; Wu, M.; Stratigaki, V.; Troch, P.; Cappietti, L.; Gómez-Gesteira, M. SPH simulation of floating structures with moorings. Coast. Eng. 2019, 153, 103560. [Google Scholar] [CrossRef]
- Gong, K.; Shao, S.; Liu, H.; Wang, B.; Tan, S.K. Two-phase SPH simulation of fluid—Structure interactions. J. Fluids Struct. 2016, 65, 155–179. [Google Scholar] [CrossRef] [Green Version]
- Peng, C.; Xu, G.; Wu, W.; sui Yu, H.; Wang, C. Multiphase SPH modeling of free surface flow in porous media with variable porosity. Comput. Geotech. 2017, 81, 239–248. [Google Scholar] [CrossRef]
- Mokos, A.; Rogers, B.D.; Stansby, P.K. A multi-phase particle shifting algorithm for SPH simulations of violent hydrodynamics with a large number of particles. J. Hydraul. Res. 2017, 55, 143–162. [Google Scholar] [CrossRef] [Green Version]
- Crespo, A.; Domínguez, J.; Rogers, B.; Gómez-Gesteira, M.; Longshaw, S.; Canelas, R.; Vacondio, R.; Barreiro, A.; García-Feal, O. DualSPHysics: Open-source parallel CFD solver based on Smoothed Particle Hydrodynamics (SPH). Comput. Phys. Commun. 2015, 187, 204–216. [Google Scholar] [CrossRef]
- Altomare, C.; Tagliafierro, B.; Suzuki, T.; Domínguez, J.M.; Crespo, A.J.C.; Briganti, R. Relaxation zone method in SPH-based model applied to wave-structure interaction. In Proceedings of the International Ocean and Polar Engineering Conference, Sapporo, Japan, 10–15 June 2018; pp. 204–216. [Google Scholar]
- Altomare, C.; Viccione, G.; Tagliafierro, B.; Bovolin, V.; Domínguez, J.M.; Crespo, A.J.C. Computational Fluid Dynamics—Basic Instruments and Applications in Science; Chapter Free-Surface Flow Simulations with Smoothed Particle Hydrodynamics Method Using High-Performance Computing; IntechOpen: London, UK, 2017; pp. 73–100. [Google Scholar]
- Verbrugghe, T.; Domínguez, J.; Altomare, C.; Tafuni, A.; Vacondio, R.; Troch, P.; Kortenhaus, A. Non-linear wave generation and absorption using open boundaries within DualSPHysics. Comput. Phys. Commun. 2019, 240, 46–59. [Google Scholar] [CrossRef]
- Gómez Lahoz, M.; Carretero Albiach, J.C. Wave forecasting at the Spanish coasts. J. Atmos. Ocean Sci. 2005, 10, 389–405. [Google Scholar] [CrossRef]
- Booij, N.; Holthuijsen, L.; Ris, R. The “Swan” Wave Model for Shallow Water. In Proceedings of the 25th International Conference on Coastal Engineering, Orlando, FL, USA, 2–6 September 1996; pp. 668–676. [Google Scholar]
- Wendland, H. Piecewise polynomial, positive definite and compactly supported radial functions of minimal degree. Adv. Comput. Math. 1995, 4, 389–396. [Google Scholar] [CrossRef]
- Rota Roselli, R.A.; Vernengo, G.; Altomare, C.; Brizzolara, S.; Bonfiglio, L.; Guercio, R. Ensuring numerical stability of wave propagation by tuning model parameters using genetic algorithms and response surface methods. Environ. Model. Softw. 2018, 103, 62–73. [Google Scholar] [CrossRef]
- Altomare, C.; Domínguez, J.; Crespo, A.; González-Cao, J.; Suzuki, T.; Gómez-Gesteira, M.; Troch, P. Long-crested wave generation and absorption for SPH-based DualSPHysics model. Coast. Eng. 2017, 127, 37–54. [Google Scholar] [CrossRef]
- Fourtakas, G.; Dominguez, J.M.; Vacondio, R.; Rogers, B.D. Local uniform stencil (LUST) boundary condition for arbitrary 3-D boundaries in parallel smoothed particle hydrodynamics (SPH) models. Comput. Fluids 2019, 190, 346–361. [Google Scholar] [CrossRef]
- Leimkuhler, B.; Matthews, C. Molecular Dynamics; Springer International Publishing: Cham, Switzerland, 2016. [Google Scholar]
- Monaghan, J.J.; Cas, R.; Kos, A.; Hallworth, M. Gravity currents descending a ramp in a stratified tank. J. Fluid Mech. 1999, 379, 39–70. [Google Scholar] [CrossRef]
- Crespo, A.J.C.; Gomez-Gesteira, M.; Dalrymple, R.A. Boundary conditions generated by dynamic particles in SPH methods. Comput. Mater. Contin. 2007, 5, 173–184. [Google Scholar]
- Altomare, C.; Crespo, A.; Domínguez, J.M.; Gómez-Gesteira, M.; Suzuki, T.; Verwaest, T. Applicability of Smoothed Particle Hydrodynamics for estimation of sea wave impact on coastal structures. Coast. Eng. 2015, 96, 1–12. [Google Scholar] [CrossRef]
- Tafuni, A.; Sahin, I. Hydrodynamic Loads on Vibrating Cantilevers Under a Free Surface in Viscous Fluids With SPH. In ASME International Mechanical Engineering Congress and Exposition; Volume 7B: Fluids Engineering Systems and Technologies; American Society of Mechanical Engineers: New York, NY, USA, 2013. [Google Scholar]
- Mogan, S.C.; Chen, D.; Hartwig, J.; Sahin, I.; Tafuni, A. Hydrodynamic analysis and optimization of the Titan submarine via the SPH and Finite—Volume methods. Comput. Fluids 2018, 174, 271–282. [Google Scholar] [CrossRef]
- Tafuni, A.; Domínguez, J.M.; Vacondio, R.; Crespo, A.J.C. A versatile algorithm for the treatment of open boundary conditions in Smoothed particle hydrodynamics GPU models. Comput. Methods Appl. Mech. Eng. 2018, 342, 604–624. [Google Scholar] [CrossRef]
- Ferrand, M.; Laurence, D.R.; Rogers, B.D.; Violeau, D.; Kassiotis, C. Unified semi-analytical wall boundary conditions for inviscid, laminar or turbulent flows in the meshless SPH method. Int. J. Numer. Methods Fluids 2013, 71, 446–472. [Google Scholar] [CrossRef] [Green Version]
- Rogers, B.D.; Dalrymple, R.A.; Stansby, P.K. Simulation of caisson breakwater movement using 2-D SPH. J. Hydraul. Res. 2010, 48, 135–141. [Google Scholar] [CrossRef]
- Antuono, M.; Colagrossi, A.; Marrone, S.; Lugni, C. Propagation of gravity waves through an SPH scheme with numerical diffusive terms. Comput. Phys. Commun. 2011, 182, 866–877. [Google Scholar] [CrossRef]
- Verbrugghe, T.; Domínguez, J.M.; Altomare, C.; Tafuni, A.; Troch, P.; Kortenhaus, A. Application of open boundaries within a two-way coupled SPH model to simulate non-linear wave-structure interactions. Coast. Eng. Proc. 2018, 1, 14. [Google Scholar] [CrossRef] [Green Version]
- Altomare, C.; Domínguez, J.M.; Crespo, A.J.C.; Suzuki, T.; Caceres, I.; Gómez-Gesteira, M. Hybridization of the Wave Propagation Model SWASH and the Meshfree Particle Method SPH for Real Coastal Applications. Coast. Eng. J. 2015, 57, 1550024-1–1550024-34. [Google Scholar] [CrossRef]
- Lowe, R.; Buckley, M.; Altomare, C.; Rijnsdorp, D.; Yao, Y.; Suzuki, T.; Bricker, J. Numerical simulations of surf zone wave dynamics using Smoothed Particle Hydrodynamics. Ocean Model. 2019, 144, 101481. [Google Scholar] [CrossRef] [Green Version]
- Gomez-Gesteira, M.; Rogers, B.; Crespo, A.; Dalrymple, R.; Narayanaswamy, M.; Dominguez, J. SPHysics—Development of a free-surface fluid solver—Part 1: Theory and formulations. Comput. Geosci. 2012, 48, 289–299. [Google Scholar] [CrossRef]
- Gomez-Gesteira, M.; Crespo, A.; Rogers, B.; Dalrymple, R.; Dominguez, J.; Barreiro, A. SPHysics—Development of a free-surface fluid solver—Part 2: Efficiency and test cases. Comput. Geosci. 2012, 48, 300–307. [Google Scholar] [CrossRef]
- Domínguez, J.M.; Altomare, C.; Gonzalez-Cao, J.; Lomonaco, P. Towards a more complete tool for coastal engineering: Solitary wave generation, propagation and breaking in an SPH-based model. Coast. Eng. J. 2019, 61, 15–40. [Google Scholar] [CrossRef]
- González-Cao, J.; Altomare, C.; Crespo, A.; Domínguez, J.; Gómez-Gesteira, M.; Kisacik, D. On the accuracy of DualSPHysics to assess violent collisions with coastal structures. Comput. Fluids 2019, 179, 604–612. [Google Scholar] [CrossRef]
- St-Germain, P.; Nistor, I.; Townsend, R.; Shibayama, T. Smoothed-Particle Hydrodynamics Numerical Modeling of Structures Impacted by Tsunami Bores. J. Waterw. Port Coast. Ocean Eng. 2014, 140, 66–81. [Google Scholar] [CrossRef]
- Cunningham, L.S.; Rogers, B.D.; Pringgana, G. Tsunami wave and structure interaction: An investigation with Smoothed-particle hydrodynamics. Proc. Inst. Civ. Eng.—Eng. Comput. Mech. 2014, 167, 126–138. [Google Scholar] [CrossRef] [Green Version]
- Pringgana, G.; Cunningham, L.S.; Rogers, B.D. Modelling of tsunami-induced bore and structure interaction. Proc. Inst. Civ. Eng.—Eng. Comput. Mech. 2016, 169, 109–125. [Google Scholar] [CrossRef] [Green Version]
- Altomare, C.; Crespo, A.; Rogers, B.; Dominguez, J.; Gironella, X.; Gómez-Gesteira, M. Numerical modelling of armour block sea breakwater with Smoothed particle hydrodynamics. Comput. Struct. 2014, 130, 34–45. [Google Scholar] [CrossRef]
- Zhang, F.; Crespo, A.; Altomare, C.; Domínguez, J.; Marzeddu, A.; ping Shang, S.; Gómez-Gesteira, M. A numerical tool to simulate real breakwaters. J. Hydrodyn. 2018, 30, 95–105. [Google Scholar] [CrossRef]
- Subramaniam, S.; Scheres, B.; Schilling, M.; Liebisch, S.; Kerpen, N.; Schlurmann, T.; Altomare, C.; Schüttrumpf, H. Influence of Convex and Concave Curvatures in a Coastal Dike Line on Wave Run-up. Water 2019, 11, 1333. [Google Scholar] [CrossRef] [Green Version]
- Meyerhof, G.G. Closure of “Compaction of Sands and Bearing Capacity of Piles”. J. S. Mech. Fdtn. Div. ASCE 1959, 85, 1–29. [Google Scholar]
- Broms, B. Lateral Resistance of Piles in Cohesionless Soils. J. Soil Mech. Found. Div. 1964, 90, 123–156. [Google Scholar]
- Goda, Y.; Haranaka, S.; Kitahata, M. Study of impulsive breaking wave forces on piles. Rep. Port Harb. Res. Inst. Jpn. 1966, 5, 1–30. [Google Scholar]
- Goda, Y. Wave Forces on a Vertical Circular Cylinder: Experiments and a Proposed Method of Wave Force Computation. Rep. Port Harb. Res. Inst. Jpn. 1964, 8, 1–74. [Google Scholar]
- Departmet of the Army, US Army Corps of Engineers. Shore Protection Manual; CERC: Washington, DC, USA, 1984; Volume 1. [Google Scholar]
- Tanimoto, K.; Takahashi, S.; Kaneko, T.; Shiota, K. Impulsive breaking wave forces on an inclined pile exerted by random waves. In Proceedings of the 20th International Conference on Coastal Engineering, Taipei, Taiwan, 9–14 November 1986; pp. 2288–2302. [Google Scholar]
- Cuomo, G.; Tirindelli, M.; Allsop, W. Wave-in-deck loads on exposed jetties. Coast. Eng. 2007, 54, 657–679. [Google Scholar] [CrossRef]
- Liu, Q.; Sun, T.; Wang, D.; Wei, Z. Wave uplift force on horizontal panels: A laboratory study. J. Oceanol. Limnol. 2019, 37, 1899–1911. [Google Scholar] [CrossRef]


| Element | Main Exposed Area (Volume) | Self-Weight | Distributed Vertical Load (Self-Weight + Accidental Load) | Final Design Vertical Load |
|---|---|---|---|---|
| Platform | 9.75 m × 6.75 m | 32.90 tons | 2.00 tons/m | 131.62 tons |
| -shaped beam | 15.00 m × 3.20 m | 29.25 tons | 3.60 tons/m | 54.00 tons |
| Pile cap (2 piles) | 4.40 m × 0.8 (×1.2) m | 9.12 tons | 12.30 tons/m | 54.12 tons |
| Pile cap (4 piles) | 4.40 m × 0.8 (×2.0) m | 15.20 tons | 15.80 tons/m | 60.20 tons |
| Test Case | Wave Conditions at Generation in 2-D (in Prototype Scale) | Scaling Factor for from Equation (6) |
|---|---|---|
| A1 | m, s | 1.00 |
| A2 | 1.05 | |
| A3 | 1.10 | |
| B1 | m, s | 1.00 |
| B2 | 0.95 | |
| B3 | 1.05 |
Publisher’s Note: MDPI stays neutral with regard to jurisdictional claims in published maps and institutional affiliations. |
© 2020 by the authors. Licensee MDPI, Basel, Switzerland. This article is an open access article distributed under the terms and conditions of the Creative Commons Attribution (CC BY) license (http://creativecommons.org/licenses/by/4.0/).
Share and Cite
Altomare, C.; Tafuni, A.; Domínguez, J.M.; Crespo, A.J.C.; Gironella, X.; Sospedra, J. SPH Simulations of Real Sea Waves Impacting a Large-Scale Structure. J. Mar. Sci. Eng. 2020, 8, 826. https://doi.org/10.3390/jmse8100826
Altomare C, Tafuni A, Domínguez JM, Crespo AJC, Gironella X, Sospedra J. SPH Simulations of Real Sea Waves Impacting a Large-Scale Structure. Journal of Marine Science and Engineering. 2020; 8(10):826. https://doi.org/10.3390/jmse8100826
Chicago/Turabian StyleAltomare, Corrado, Angelantonio Tafuni, José M. Domínguez, Alejandro J. C. Crespo, Xavi Gironella, and Joaquim Sospedra. 2020. "SPH Simulations of Real Sea Waves Impacting a Large-Scale Structure" Journal of Marine Science and Engineering 8, no. 10: 826. https://doi.org/10.3390/jmse8100826