Article

Redox Dependent Arsenic Occurrence and Partitioning in an Industrial Coastal Aquifer: Evidence from High Spatial Resolution Characterization of Groundwater and Sediments

1
Earth Science Department, “La Sapienza” University of Rome, 00185 Rome, Italy
2
School of Earth Sciences, University of Western Australia, Perth 6009, Australia
3
Lamont-Doherty Earth Observatory of Columbia University, Palisades, NY 10964, USA
4
Department of Materials, Environmental Sciences and Urban Planning, Polytechnic University of Marche, 60131 Ancona, Italy
5
Department of Environmental, Biological and Pharmaceutical Sciences and Technologies, Campania University “Vanvitelli”, 81100 Caserta, Italy
6
Commonwealth Scientific and Industrial Research Organisation (CSIRO) Land and Water, Floreat 6014, Australia
7
State Environmental Protection Key Laboratory of Integrated Surface Water-Groundwater Pollution Control, School of Environmental Science and Engineering, Southern University of Science and Technology, Shenzhen 518055, China
*
Author to whom correspondence should be addressed.
Water 2020, 12(10), 2932; https://doi.org/10.3390/w12102932
Submission received: 28 August 2020 / Revised: 1 October 2020 / Accepted: 16 October 2020 / Published: 20 October 2020
(This article belongs to the Special Issue Groundwater and Contaminant Transport)

Abstract

:
Superlative levels of arsenic (As) in groundwater and sediment often result from industrial pollution, as is the case for a coastal aquifer in Southern Italy, with a fertilizer plant atop. Understanding conditions under which As is mobilized from the sediments, the source of that As, is necessary for developing effective remediation plans. Here, we examine hydrogeological and geochemical factors that affect groundwater As concentrations in a contaminated coastal aquifer. Groundwater has been subject to pump-and-treat at a massive scale for more than 15 years and is still ongoing. Nevertheless, As concentrations (0.01 to 100 mg/L) that are four orders of magnitude more than Italian drinking water standard of 10 μg/L are still present in groundwater collected from about 50 monitoring wells over three years (2011, 2016, and 2018). As was quantified in three different locations by sequential extractions of 29 sediment cores in 2018 (depth 2.5 m to −16.5 m b.g.l.), combined with groundwater As composition, the aqueous and solid partitioning of As were evaluated by partition coefficient (Kd) in order to infer the evolution of the contaminant plumes. Most sediment As is found in easily extractable and/or adsorbed on amorphous iron oxides/hydroxides fractions based on sequential extractions. The study shows that As contamination persists, even after many years of active remediation due to the partitioning to sediment solids. This implies that the choice of remediation techniques requires an improved understanding of the biogeochemical As-cycling and high spatial resolution characterization of both aqueous and solid phases for sites of interest.

1. Introduction

Worldwide, more than 220 million people are at risk of exposure to groundwater containing elevated levels (>10 µg/L) of geogenic As [1,2,3,4]. The average abundance of As in the upper continental crust is around 5.7 mg/kg [5], with the highest As values of about 13 mg/kg and the lowest ranging from 0.5 to 3 mg [6]. Therefore, this issue has been intensively investigated all over the world. Besides geogenic sources [7,8,9,10], industrial, landfill [11], agricultural, and mining [12,13] activities have also substantially contributed to the contamination of soils and groundwater with As over several decades, making it the third most common regulated inorganic contaminant to be detected at U.S. Superfund sites [14]. The accidental leakage of As compounds into soils and, consequently, into groundwater has been widely reported for a wide range of settings [12,15,16,17,18]. In addition, the contamination of marine environments represents an increasing global concern because of the potential risks to both human health and along the coast heavily affecting the marine ecosystems [19]. Additionally, the presence of multiple industrial inputs along the coastline, allow for contamination to persist long after the end of industrial activities [19].
Both geogenic and anthropogenic As commonly occur in or associated with minerals, such as Mn/Al/Fe-oxides/hydroxides, sulphides, arsenides, arsenites, or as elemental As. Under more oxic and neutral pH conditions, As is often strongly adsorbed onto Fe-oxides/hydroxides [20] and, thus, less mobile. However, As is often mobilized under changing environmental conditions, for example, upon the onset of anaerobic conditions [21]. These conditions favor the reductive dissolution of Fe-oxides/hydroxides, releasing associated As into porewater [22]. Aqueous As concentrations can also increase due to the oxidation of As-bearing iron sulphide minerals, such as pyrite or arsenopyrite [23,24].
Numerous environmental conditions can influence As partitioning and need to be considered in a groundwater remediation approach. One such important factor in coastal environments that can significantly influence the behavior of As is groundwater salinity, which influences both groundwater composition and ionic strength [25,26]. For example, elevated electrolyte concentrations may influence the adsorption affinity of As onto the iron oxyhydroxides [27,28,29] and a variety of other sediment properties. Seawater intrusion’s effect on As adsorption is among the most studied [25,30,31], but it is complicated to predict As partitioning near the groundwater-seawater interface, because chemical variability interacts with density gradients that can give rise to complex hydrological and geochemical processes [32,33,34]. Consequently, understanding As mobility in coastal environments can be extremely challenging. A detailed characterization of both the solid and aqueous phases. coupled with an extensive investigation of the key factors controlling, are necessary to better understand the natural fate of As. Furthermore, these data are a prerequisite for identifying the most effective remediation options.
Our field site is located adjacent to the sea, and it is highly affected by saltwater-freshwater interactions, and a manipulated hydrological network that includes pump-and-treat remediation activities [35]. This remedy has been active since 2003 [35], and it has been effective in preventing the migration of As and other contaminants to the marine environment. Despite the sustained remediation efforts, extremely high groundwater As concentrations (up to about 100 mg/L) persist and they are also accompanied by local high nitrate and ammonium concentrations, are still being widely detected. While the choice of a pump-and-treat scheme may be appropriate for some contaminants, it is generally inefficient [36,37] and requires long-term use to remove the large reservoir of the solid-phase As [38,39,40]. A detailed understanding of the partitioning of As in aqueous and solid phases, as well its spatial distribution, is a prerequisite for improving the efficiency of the pump-and-treat, or developing new and more effective remediation methods.
This study seeks to provide a comprehensive analysis of the temporal changes of As in groundwater and spatial distribution sediment As in this severely polluted coastal aquifer.
High resolution depth profiles of sediment and mineralogic composition were executed by total digestion and sequential extraction in order to provide information regarding the form and reactivity of various As reservoirs at the site that is linked to groundwater composition.
This comprehensive dataset allowed for us to assess the hydrogeochemical characteristics of our site and determine the mobilization and retardation processes responsible for the spatial variability of dissolved As.
This is a complex undertaking as the investigated site is affected by multiple pollution sources and contaminant types, of which some types also affect the fate of As [41,42]. For example, phosphate was abundant in groundwater at parts of the site [43], potentially impacting As sorption or coprecipitation. This complex and evolving hydrochemical framework also overlaps with the presence of seawater intrusion and salinity variation within the investigated aquifer. This seawater affects groundwater flow, ionic strength, and, critically, provides sulphate for sulphate reduction, potentially inducing the precipitation of As sulphides. The contamination at this site is extreme, and potentially different from most recent research examining As environments that are affected by geogenic contamination [27,44,45]. Therefore, the scope of the present study is centered around a vertical high resolution sediment and groundwater characterization that allowed to define detailed depth profiles of the contaminant distribution [46].
The results underpin a refined conceptual model of the study site’s As contamination and how it has evolved over time. This finding has implications for a more sustainable remediation strategy for this and other comparable industrial sites that are polluted with high levels of As.
In fact, this work represents the first fundamental step of a wider research project aimed to reduce As concentration in groundwater, which includes different laboratory experiments (i.e., batch microcosms, column tests), field test groundwater flow, and transport model.

2. Materials and Methods

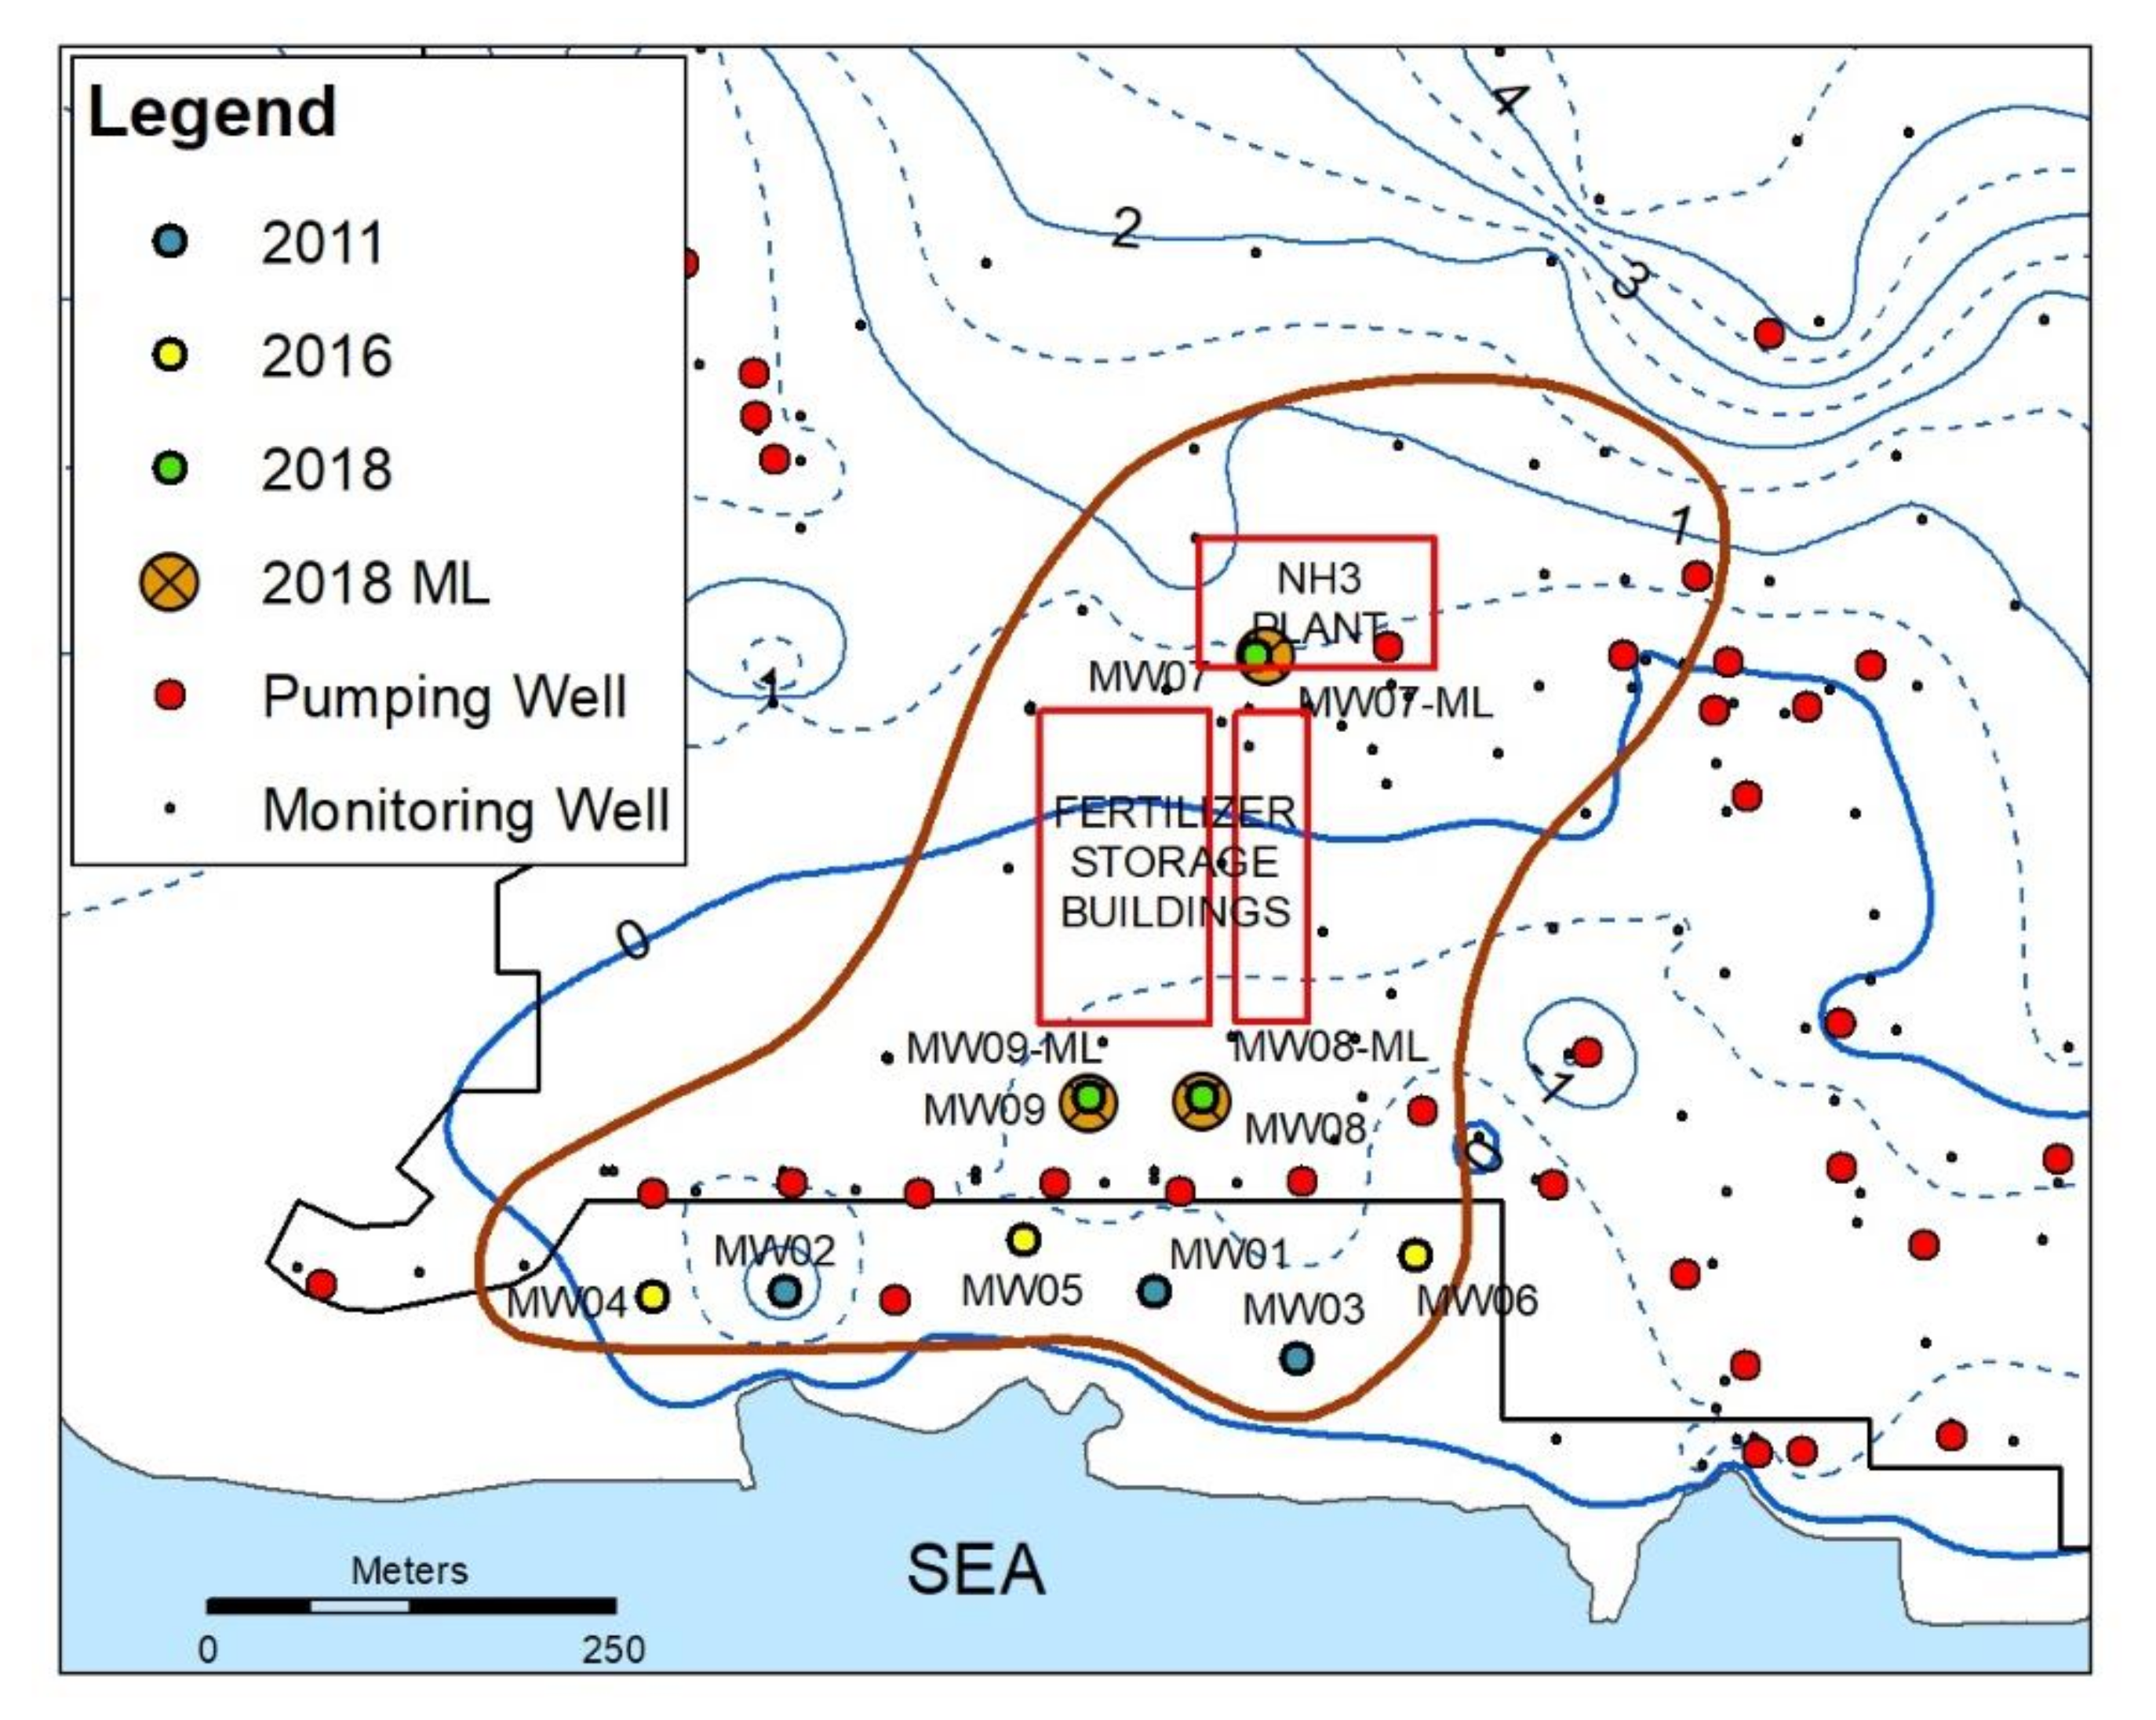
2.1. Site Description

The study site is an unconfined coastal aquifer underlying a large industrial plant in Southern Italy. The aquifer thickness ranges between 25 and 30 m at the study area. It mostly consists of sand interbedded by clay and silt layers. A more detailed description of the general geological and hydrogeological setting is provided by Mastrocicco et al. [35,47] and Sbarbati et al. [48]. In the investigated area, the vadose zone was ranging to a depth between 5 and 6 m b.g.l. and the sediments mostly consisted of interbedded sands with some silt lenses. In the saturated zone, aquifer sediments mostly consisted of medium and coarse-grained sands, interbedded with thin silty clay and silty sand lenses. The deeper part of the sequence contains a coarse sand with some gravel, consistent with the geological setting of the studied area [43]. Additional information about core stratigraphy are reported in Supplementary Material (Figure S1). Seasonal water table oscillations of <±1 m occur at the site, with the maximum levels being reached during winter and minimum levels at the end of summer (seasonal variation).
Groundwater flow at the site is generally directed from north to south towards the sea. Groundwater flow near the sea boundary is strongly affected by a large-scale pump-and-treat scheme that started to operate in 2002 for preventing the migration of the dissolved contaminants into the marine environment. This scheme (Figure 1) is still fully active today. It consists in a hydraulic barrier composed of more than 70 fully screened pumping wells, operating at an average extraction rate of 60 L/s [49]. The wells are aligned along the coastline, perpendicularly to the general groundwater flow direction to create a groundwater curtain that prevents off-site transport [35,43,47,48,50].
Besides As, portions of the aquifer are also contaminated with ammonium (NH4+), nitrate (NO3), and phosphate (PO43−) [43,50]. The contamination is the results of the historical production of agricultural fertilizers and pesticides, many of which were made from arsenic (III) trioxide, As2O3 [43,50]. A probable leakage from tanks of As2O3 close to the NH3 plant resulted in the contaminant plume present in the area, containing both of the pollutants (Figure 1).

2.2. Field Sampling

Three new sediment cores were collected and monitoring wells were installed in those sites in order to better understand the distribution and the evolution of the As contamination in both sediments and groundwater. MW07 (see Figure 1) was drilled immediately downgradient of the agricultural fertilizer production plant, while MW08 and MW09 are located in the core of the dissolved As plume, upgradient to the hydraulic barrier and to monitoring the wells realized during 2011 and 2016 investigation surveys. A total of 29 sediment core samples (from nine to 10 for each drill core) were collected with a piston corer from the three locations. For each location, the core samples cover a depth range of more than 17 m (from about 3 to 20 m b.g.l.). After collection, the samples were immediately sealed while using vacuum bags and then stored at −18 °C until analyzed.
These open boreholes were screened through the entire saturated zone (3–23 m b.g.l.) and used in order to measure a variety of aquifer properties as a function of depth after one month from the installation. These depth profiles were determined with a multiparameter probe WTW Multi 340i (Mettler Toledo, Milan, Italy) which included a SentiTix 41 pH combined electrode with a built-in temperature sensor for pH, a combined AgCl-Pt electrode for Eh, a Tetracon 325 4-Electrode Conductivity cell for EC, and a CellOx 325 galvanic oxygen sensor for dissolved oxygen (DO) measurements. Adjacent to these full-screened monitoring wells (<5 m away, Figure 1), a second set of boreholes was equipped with a Solinst CMT Multilevel Systems (Solinst Ltd, Georgetown, ON, Canada), referred to as MW07-ML, MW08-ML, and MW09-ML. This included the installation of a 1.7” (43 mm) OD polyethylene tubing system with seven depth-discrete zones for each of the borehole pairs. The number and location of ports were determined based on the known aquifer stratigraphy and sampling depths. A port cutting guide was used for creating a port within each of the channels at the pre-specified monitoring depth. A plug was positioned and sealed in the channel just below the port opening and a stainless-steel screen was fixed over the port to prevent clogging. Each channel was also sealed at the bottom of the tubing in order to avoid cross communication between monitoring zones. The first groundwater samples were collected one month after the installation of the multilevel monitoring wells. The samples were collected with Solinst-specific sampling equipment (Solinst Ltd., Georgetown, ON, Canada) consisting of a coaxial cable (Model 102 Water Level Meter) to monitor water levels in any Continuous Multichannel Tubing (CMT) channel, and a 408 Micro Double Valve Pump (DVP) connected at the surface to the Solinst 464 Electronic Control Unit and to a 12V Oil-Less Air compressor. Prior to sample collection, each CMT level was purged until pH, DO, and Eh stabilized. The groundwater samples were stored at 4 °C until analyzed.

2.3. Laboratory Analyses

Groundwater composition was determined by an independent laboratory that was commissioned by site’s owner using Environmental Protection Agency (EPA) standard methods. Sediments were analyzed using a variety of extraction methods to measure total metal concentrations and the mineralogical phases that retain As. An acid digestion procedure was performed on core samples to assess total arsenic concentrations (Astot). A homogenized sediment aliquot for each sediment sample collected during 2011, 2016, and 2018 characterization campaign was weighed and transferred into a Teflon container that was previously washed with acid, placed in a digestion block, covered, and digested by hot acid reflux in a mixture of HNO3, HCl, H2O2, and HF for several hours at 90–95 °C [51]. The obtained suspensions were filtered through 0,45 µm nylon membrane to remove any traces of undigested silicates. In addition, a sequential extraction procedure was performed for samples from all three sampling campaigns to determine As associations with solid phases under different environmental redox conditions and their concentrations. The sequential extraction procedure that was proposed by Keon et al. [52] was applied to 19 sediment samples from the 2011 sampling campaign [43] and to 18 samples from the 2016 sampling campaign. For the samples collected in 2018, the sequential extraction procedure that was proposed by Sun et al. [53] was employed to obtain a more detailed characterization of the As solid-phase associations. Table 1 shows the details of the seven extraction steps.
Each sample was taken from the center of each core sample, in order to eliminate any potential effects of oxidation and thawed in an oven at 50 °C for 24 h. Sediment aliquots of 150 mg were sequentially treated with different extracting solutions (10 mL) in a glove bag (Sigma–Aldrich Atmosbag) containing nitrogen gas to prevent sample oxidation. Once removed from the glove bag, suspensions were centrifuged for 25 min. at 11,000 rpm and the supernatant was decanted and filtered using 0.45 μm nylon membrane filters. Between each extraction phase, except for the first and fifth step, the sediments were washed with 10 mL of 1M MgCl2. The filtrate supernatant of each extraction was diluted to a volume of 50 mL with filtered and acidified (to 3% with HNO3) double-distilled water. For the MgCl2 extraction step (Step 1), an additional dilution (1:10) was necessary as a result of the high chloride concentrations. Dissolved As concentrations obtained of samples collected after the digestion procedure, during the sequential extractions were all determined by inductively coupled plasma-mass spectrometer (ICP-MS X Serie II of Thermo Fisher Scientific, Germany) following filtration (0.45 μm) and acidification (to 3% with HNO3). These analyses were performed at the Geochemical Laboratory of Sapienza, University of Rome (Italy). The analytical accuracy of these methods ranged from 2 to 5%. An internal standard, Rh, was used in order to correct the ICP-MS instrumental drift. Ultrapure water (Millipore, Milli-Q, 16 MΩ cm) was used in preparing blanks, standard solutions, and sample dilutions [54].

3. Results and Discussion

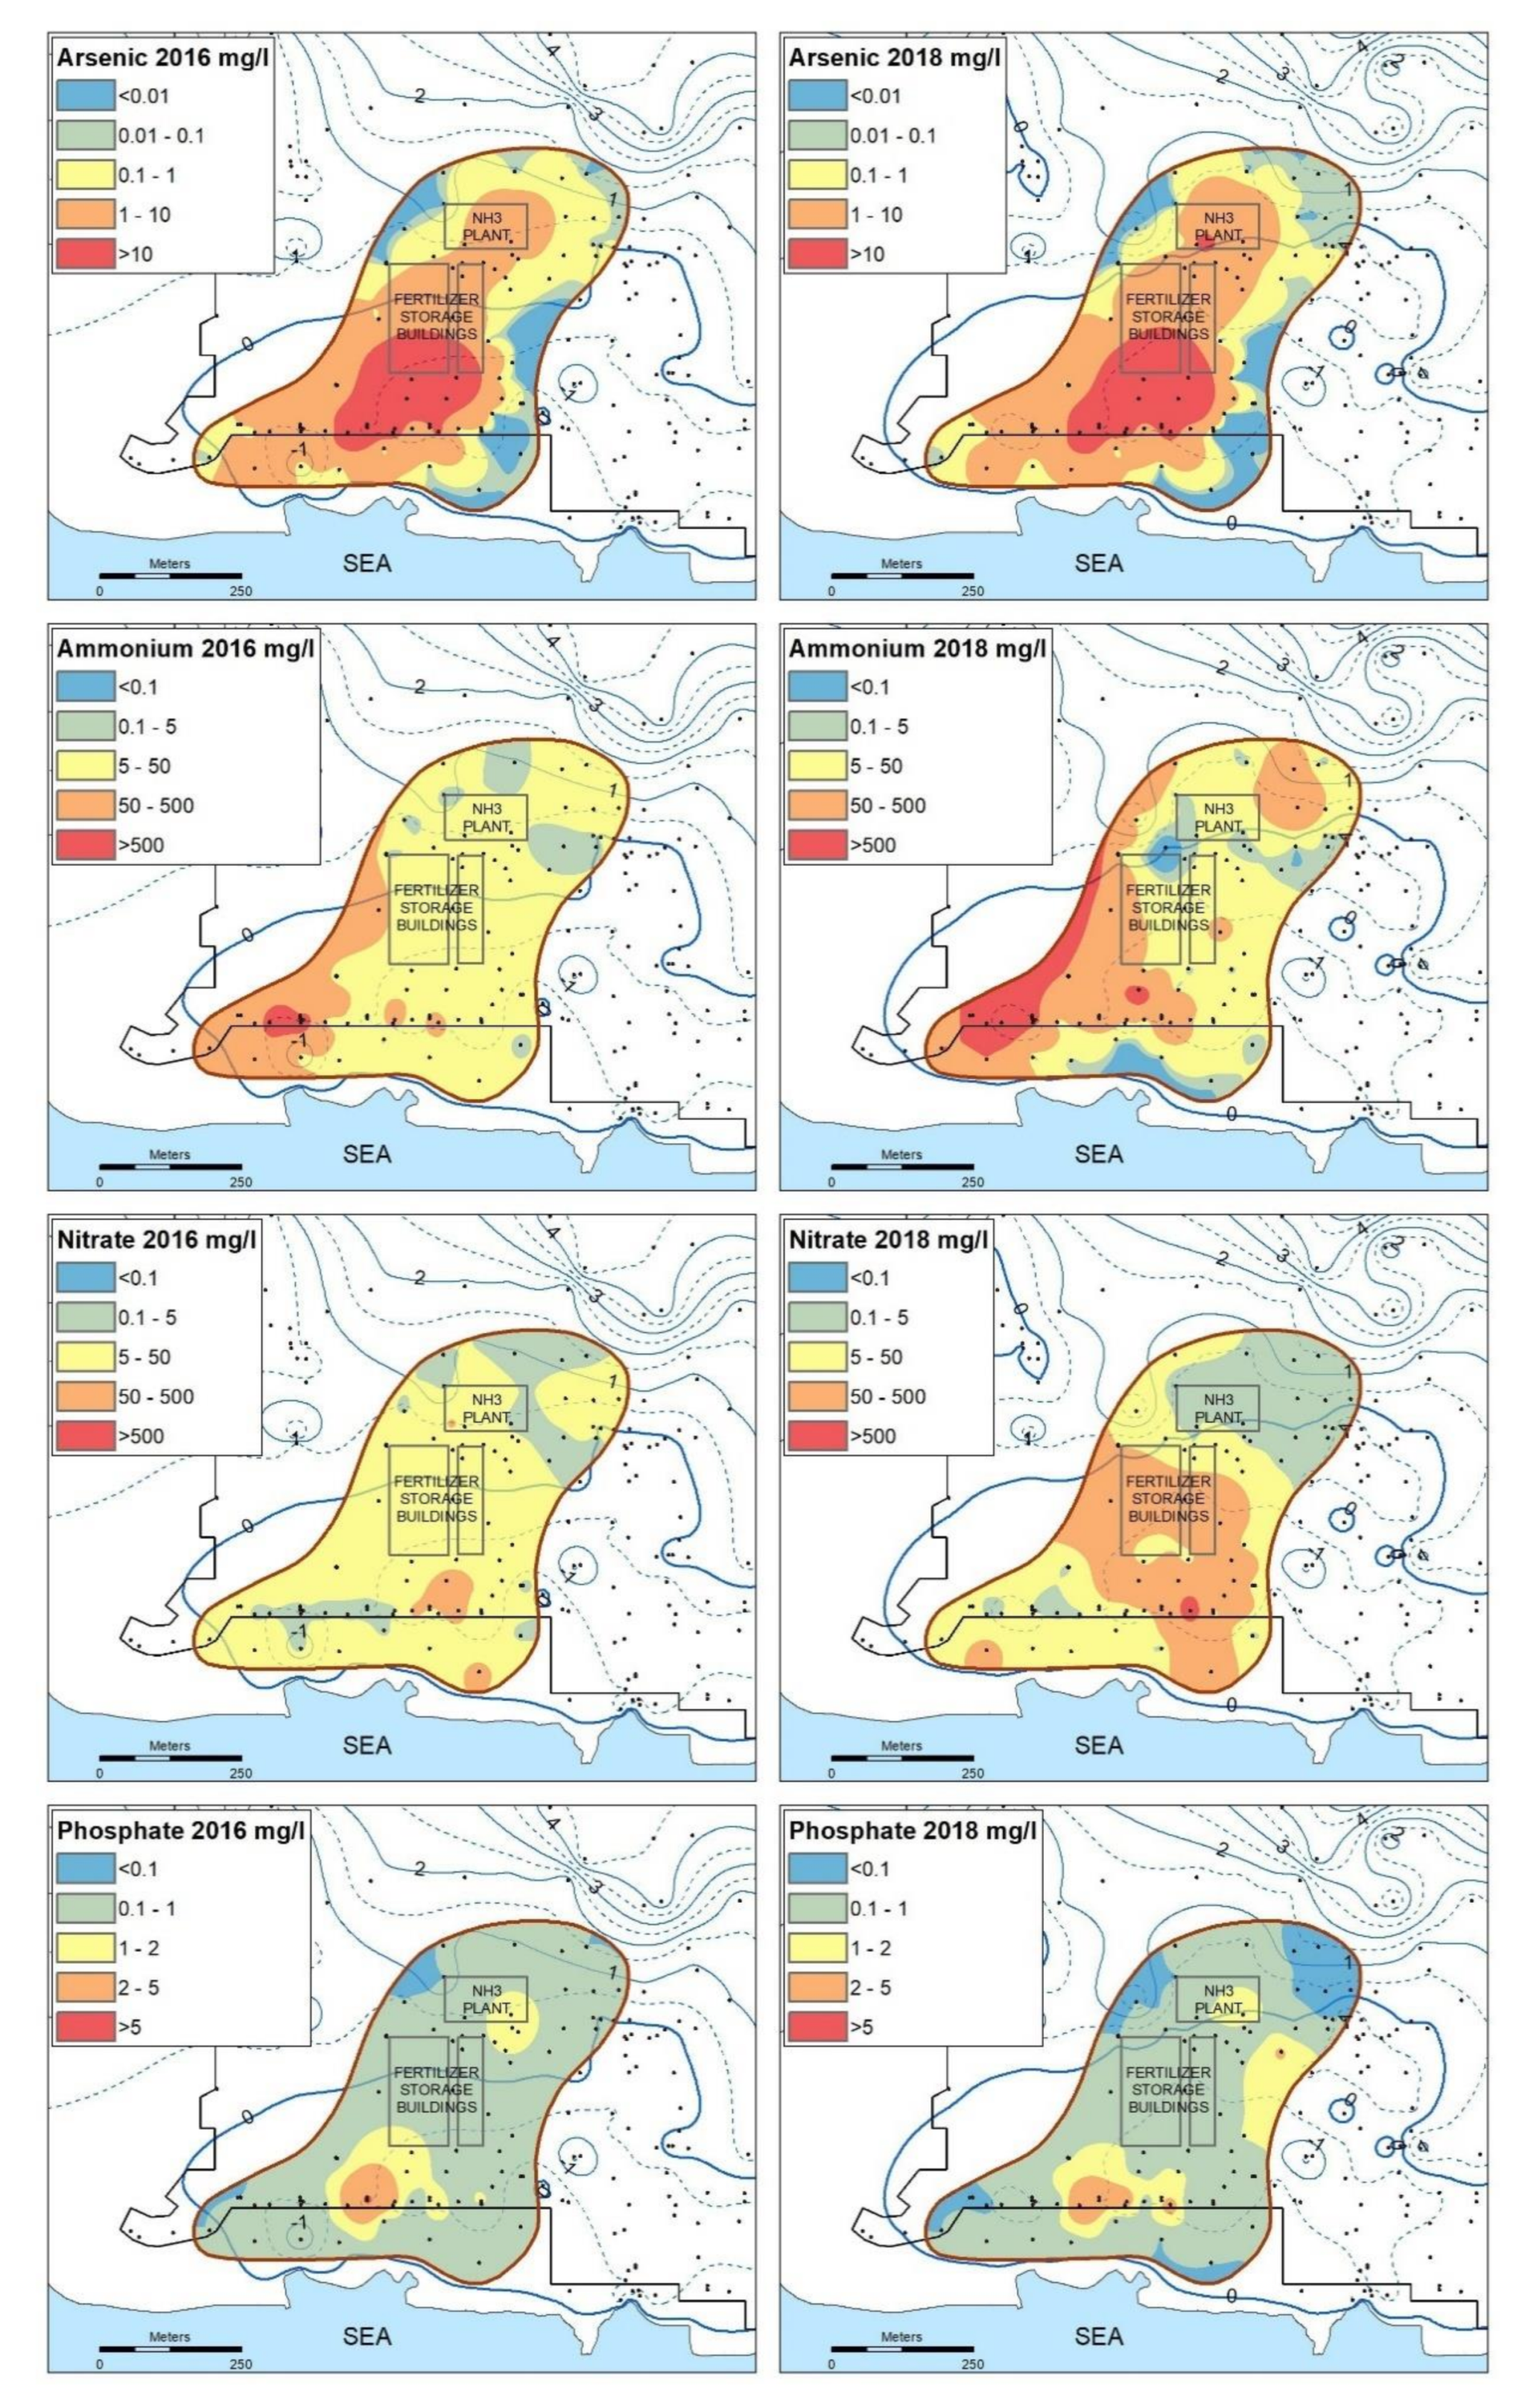
3.1. Groundwater Compositions

Vertical concentration depth profiles of groundwater pH, ORP, and conductivity are shown in Figure 2 for MW07, MW08, and MW09. The Eh values were obtained by correcting Oxidation Reduction Potential (ORP) filed measurements with a reference values for common Ag/AgCl electrodes [55]; this is because a variety of factors affect ORP measurements, including the effects of solution temperature and pH, irreversible reaction, multiple redox couples, and electrode poisoning.
The results for MW07 (Figure 2 Upper panel), which is located within the immediate historic source area, shows opposite trends with depth (an inverse correlation) for electrical conductivity (EC) and redox potential. The EC profile shows values of <4 mS/cm up to a depth of −10 m a.s.l. before sharply increasing to about 20 mS/cm, a typical value for brackish-saline water. We attribute this increase to the past leakage of an old canal that was historically used to deliver seawater to the site for cooling purposes [35,47]. In 2018, the remnant seawater is still observed at depth, although the canal is no longer in used. The redox potentials are highest in the shallow freshwater zone (+350–500 mV) and a transitioning to lower values (+250 mV) in the brackish water zone.
The EC profile for MW08 (Figure 2, upper panel), which is located upgradient of the hydraulic barrier, also shows the distinct impact of the seawater wedge below 8m a.s.l. The upper part of the profile is characterized by EC values that are typical for fresh-brackish waters (2–3 mS/cm) while increasing strongly below ~−8 m a.s.l. to values of approximately 20 mS/cm and further to 45 mS/cm, typical of seawater, in the deeper parts of the aquifer. Similarly, MW08, i.e., the monitoring well located in the source area, also shows an inverse correlation of the Eh with the EC profile, with the highest values of +480 mV in the shallower part of the aquifer and lower, but still positive, values (+160 mV) in the deeper part. A different behaviour of these physico–chemical parameters is shown for MW09 (Figure 2, upper panel), which is located close to MW08. The EC profile is characterized by an immediate increase within the first three meters of the profile, and then early constant conductivity and redox potential (about 14 mS/cm and +80mV) down to −17 m a.s.l.
Figure 2 also shows the measured Dissolved Oxygen (DO) and pH vertical profiles for the same monitoring wells. Both of the parameters show no significant variations along the profiles with values of DO remaining below 0.5 mg/L. Slightly higher values were recorded in all of the investigated monitoring wells in the upper parts of the saturated zone (Figure 2 lower panel). The measured pH values indicate circumneutral conditions, which are indicative of well-buffered conditions in all three profiles, consistent with earlier measurements at the site [43].
The variations in the measured physico-chemical parameters with depth, especially for EC and Eh, and among the different monitoring wells can be explained by the various water types that reside and mix within the polluted aquifer (seawater intrusion, leakage from pipelines, etc.). The underlying flow and transport processes have already been discussed in previous studies of this site [43,47,48].
Figure 3 compares aqueous concentrations that were obtained in 2018 with earlier measurements collected in 2016 to provide insight into the temporal changes of the main groundwater contaminants in the investigated area of the plant. Both of the sampling surveys were performed during autumn season. The iso-concentration maps were carried out using an iterative finite difference interpolation technique based on the ANUDEM (Australian National University’s Digital Elevation Model) program developed and integrated by Hutchinson 2011 [56]. It is optimized to have the computational efficiency of local interpolation methods, such as inverse distance weighted (IDW) interpolation, without losing the surface continuity of global interpolation methods, such as Kriging.
The interpolated maps of dissolved NH4+ concentrations indicate that it is most abundant in the western portion of the plume, locally exceeding concentration of >500 mg/L. The persistence of elevated concentrations of NH4+ in the western portion of the plume with values that are higher than 500 mg/L suggests the presence of a secondary source of NH4+ there [43]. A similar trend in the western area can be seen for NO3, with maximum values reaching 50–500 mg/L in the monitoring wells located upgradient of the hydraulic barrier. However, in the source area, where past NH3 plant is located, both dissolved ammonium and nitrate concentrations are also high but appear to have generally decreased over time. In the downgradient area, close to the pumping wells of the hydraulic barrier, a general coexistence of NH4+ and NO3 in groundwater has already highlighted in this area of the site due to both reducing conditions and the fast groundwater flow field [50].
The measured PO43−, concentrations in 2016 showed a significant decrease when compared to concentration levels that were measured in 2011, when values were higher than 10 mg/L [43]. Even in 2018, the phosphate concentrations almost disappear in the source area where detected values are under 1 mg/L, instead in few pumping wells of the hydraulic barrier concentrations are relatively high reaching values of about 5 mg/L. Besides the general decrease in the investigated area, a clear evidence of phosphate migration from the source area toward the hydraulic barrier is demonstrated. Consequently, the mobility of As is no longer affected by the competition with this ion for sorption sites [20,57].
However, groundwater As levels do not show evidence of attenuation. Aqueous As concentrations remain extremely high (>10 mg/L), even in 2018. The persistence of As at similar levels in 2016 and 2018 at such high concentrations suggests that the aquifer flushing that is induced by the continuous pumping has no direct positive consequences for the dissolved As load of the aquifer.
The hydraulic barrier designed to prevent discharge of these contaminants offsite and towards the sea reverses the natural hydraulic gradient; in fact, in this area piezometric heads are generally below sea level, suggesting that the hydrologic barrier is effective in preventing offsite transport. Indeed, concentrations of NH4+, NO3, and As are all much lower across the barrier along the coastline.

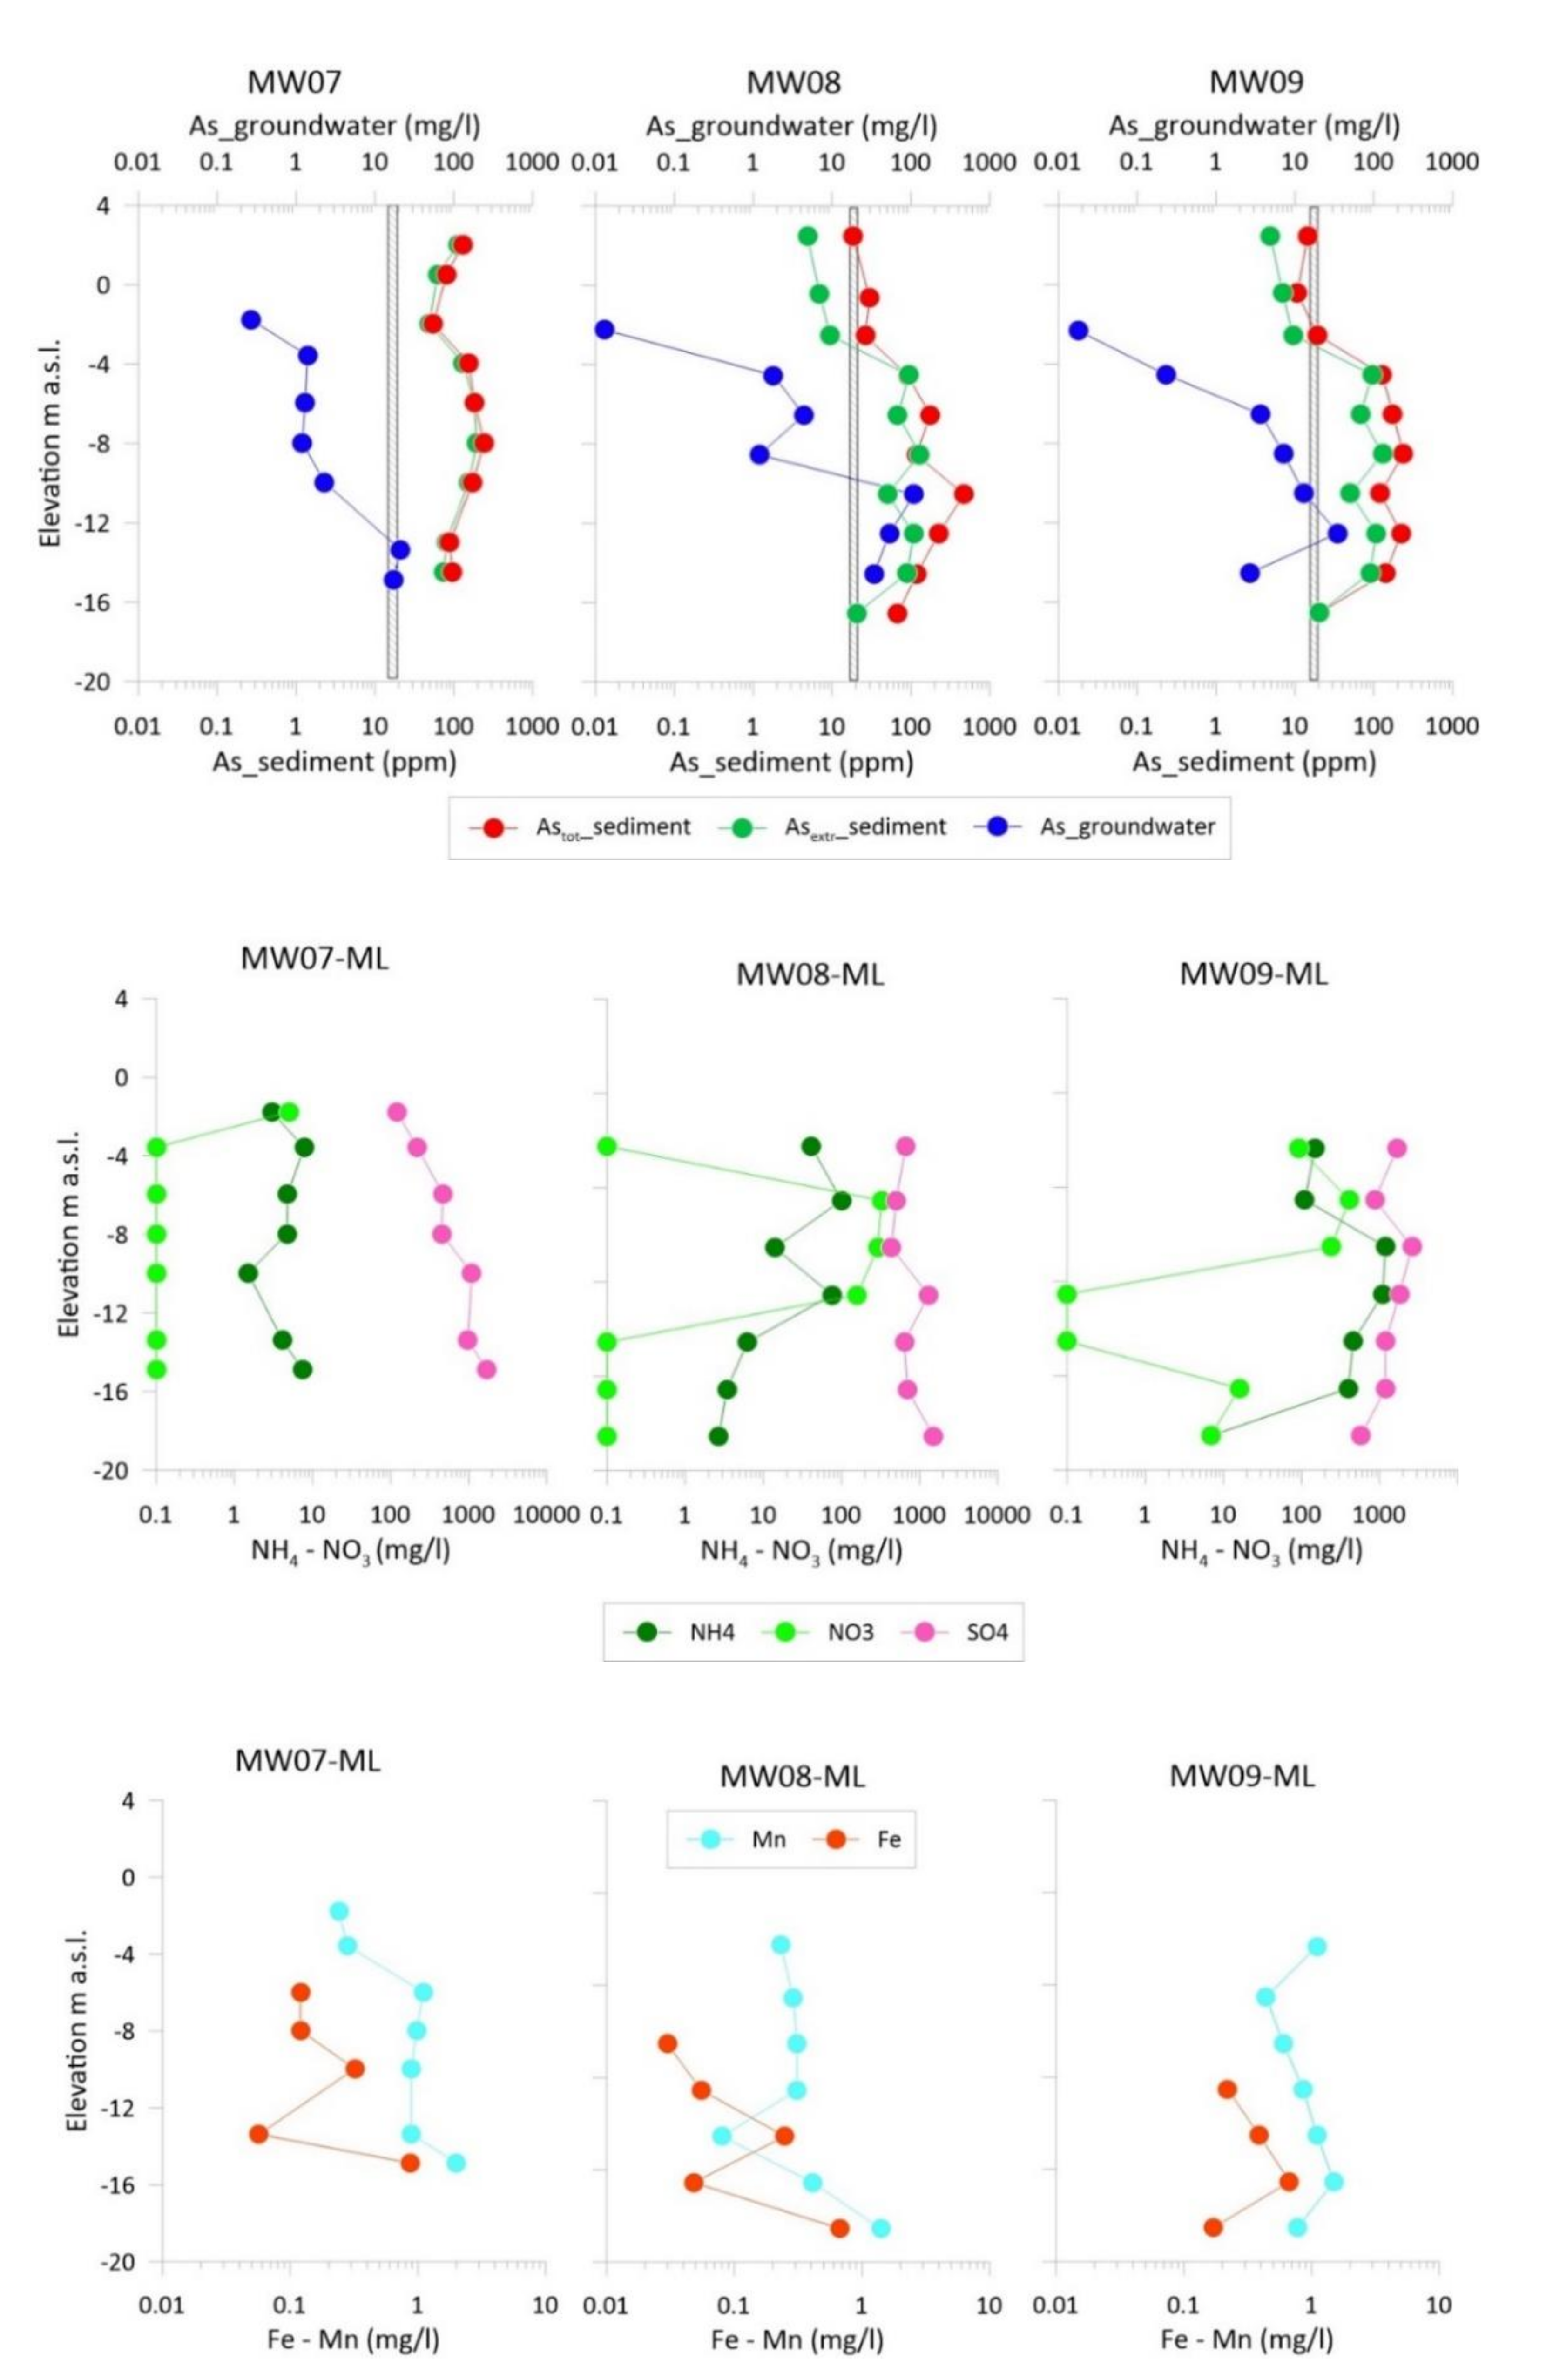
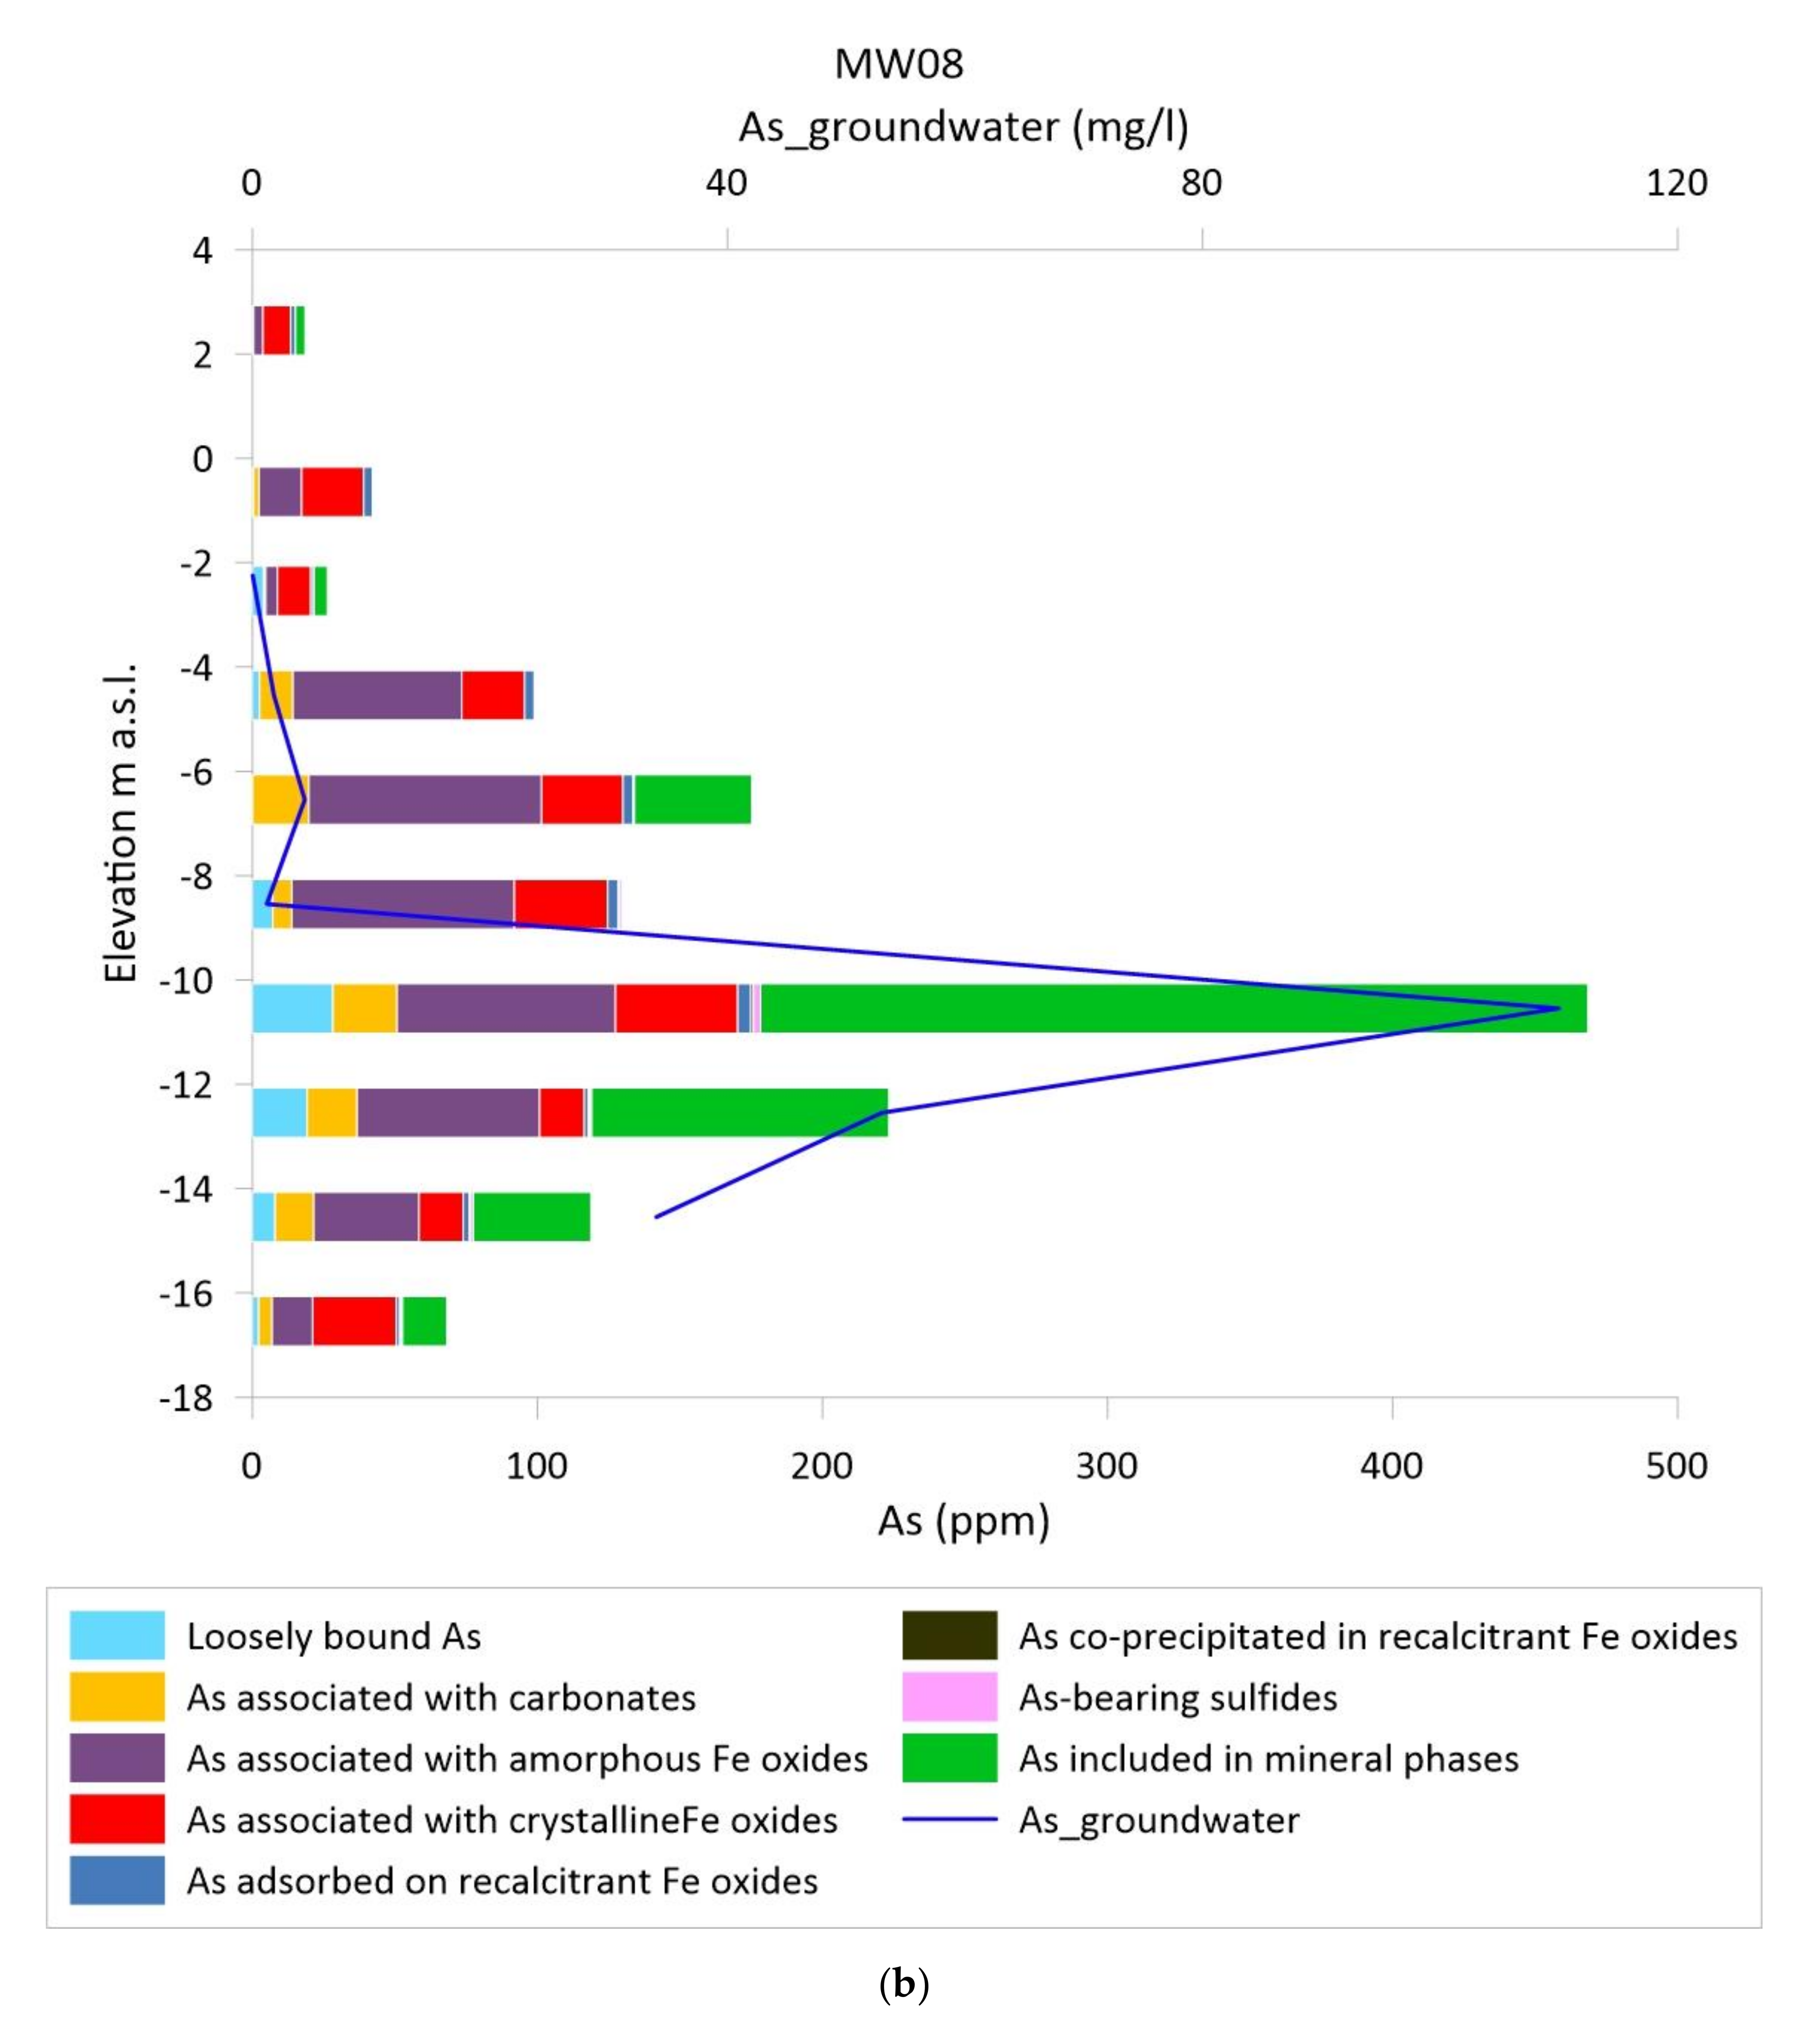
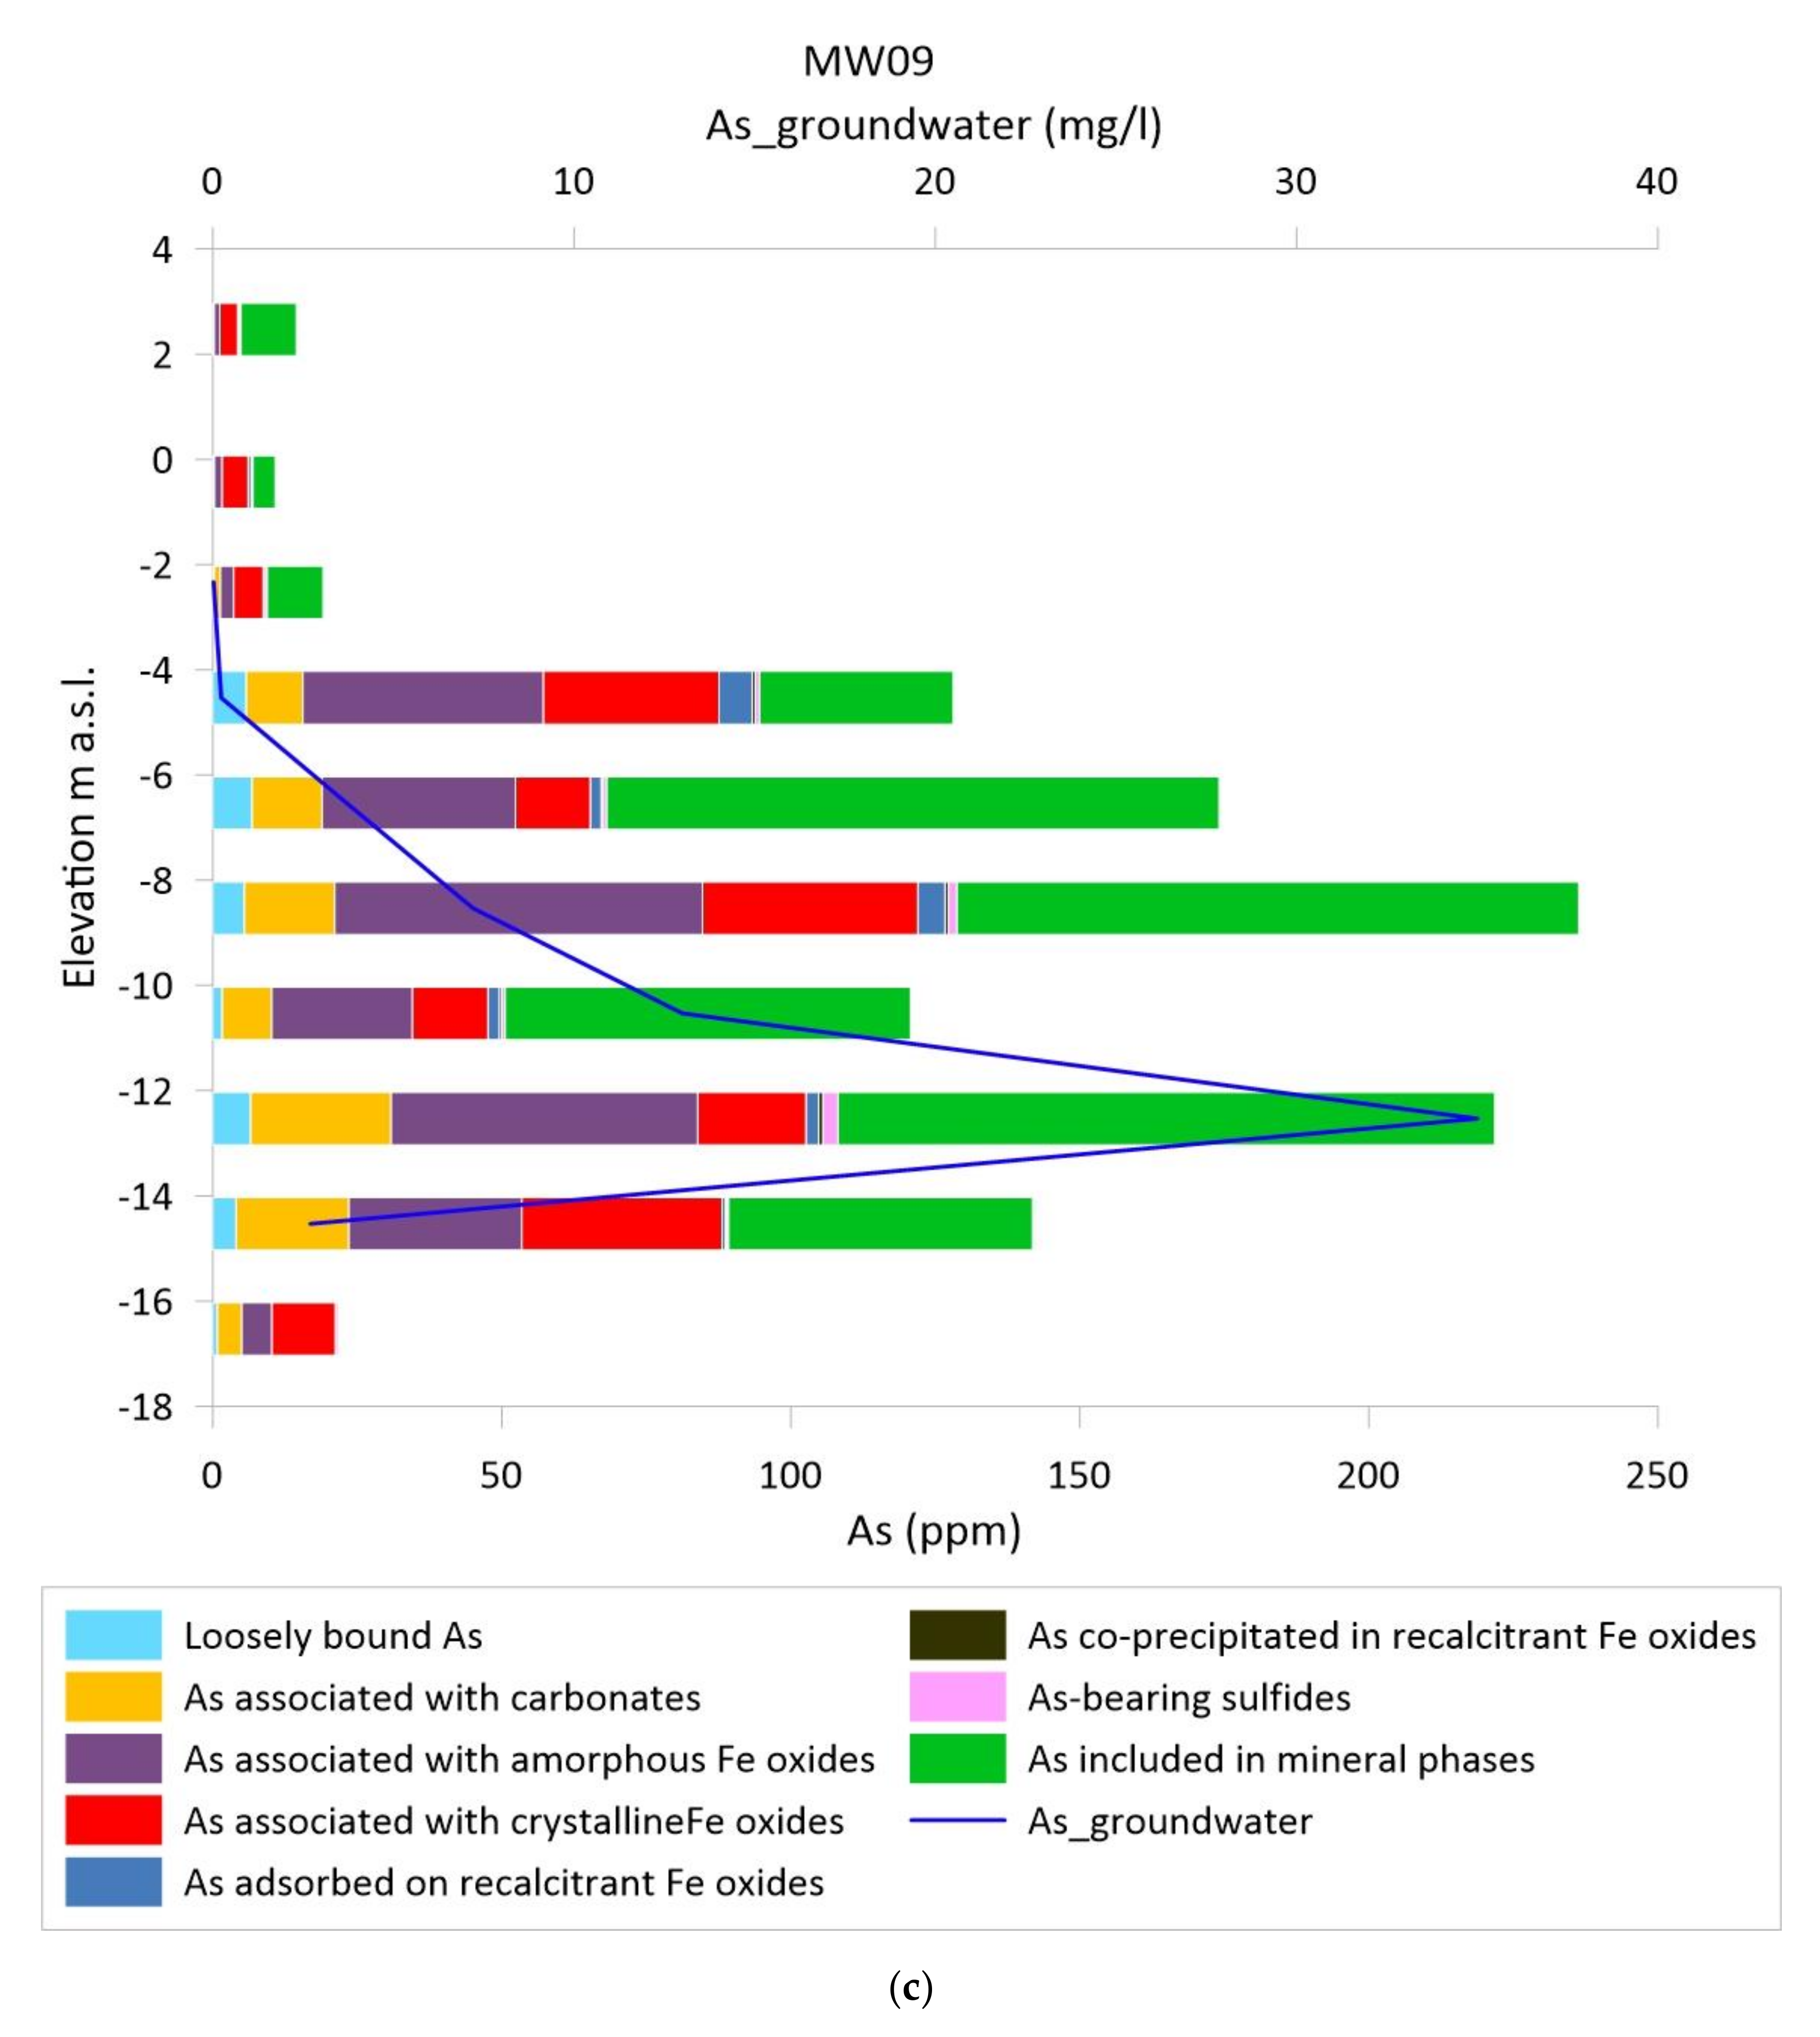
3.2. Vertical Distribution of As in Sediments and Groundwater

Figure 4 shows the depth profiles of dissolved As concentrations, total As content, and extractable As, with the latter being obtained through sequential extraction procedure, for all three new monitoring boreholes, as measured during the 2018 campaign (the results listed in Table S1 in Supplementary Materials). In addition, to shed more light on dissolved As distribution within the aquifer, NH4+, NO3, and SO42− (Figure 4 middle panel) with Fe and Mn (Figure 4 lower panel) vertical profiles were plotted. Sulfide, phosphate, and total phosphorous concentrations in the investigated area have been detected at negligible concentrations.
The results show that As concentrations in groundwater and within the sediments are both high variable, ranging between 0.01 and 110 mg/L and between 11 and 470 mg/kg, respectively.
In the source area (MW07, left panel) the total As content in the sediments is generally high (>50 ppm), and it then continues to increase sharply with depth below the water table (located at ~0 m a.s.l.) down to −8 m a.s.l. At greater depths concentrations decrease to values comparable with those from the shallower aquifer sections. Nevertheless, as expected for the source zone, the As content in the sediments are along the entire depth profile higher than the background concentrations of about 15–20 ppm [58]. The comparison with extractable As profile also highlights that a percentage ranging between 76% and 99% of arsenic in soil is represented by potentially removable phases.
Both downgradient monitoring locations (MW08, MW09, Figure 4, middle and right panels) have similar As depth profiles; sediment As concentrations (total and extractable) in the vadose zone are comparable or lower than the background values [58], but they have high sediment As concentrations within the most permeable layer (−10 and −12 m a.s.l.). In these cases, the amounts of extractable As are smaller respect to the source zone reaching minimum values of 33% of removable As in the vadose zone of MW09 (Figure 4, right panel).
Data that were collected from three boreholes drilled in 2016 downgradient to the hydraulic barrier (see Figure 1 for location) were analyzed to assess total As spatial distribution in sediment in the investigated area. These earlier drilled monitoring wells (MW04, MW05 and MW06) are located more than 200 m far from the source zone, where past dissolved arsenic concentrations >30 mg/L were recorded. The concentrations of total As in sediments sampled from the vadose zone were found to be comparable with the natural background concentrations of 15–20 ppm [58]. The highest values were detected in the saturated zone, in particular in MW05, which has also historically been associated with reducing conditions and high EC values.
A conceptual hydrological model developed previously [43] suggested that the As2O3 source was leaching through the vadose zone as part of a dense saline liquid containing a mixture of contaminants. Driven by a density gradient this leachate migrates further downward until reaching the base of the aquifer, where it pools and moves laterally. The spatial distribution of As within the sediment depth profiles is consistent with this model with a flowline starting from MW07, through MW08, MW09, and MW05 and ending downgradient to MW05 (see Figure 1). The As depth profile for MW07 (Figure 4, left panel) shows extensive As loading throughout the profile. The dissolved mixture migrated downgradient to the source area, towards the shoreline, through the saturated zone, where the As content in sediments is higher than the background values for all of the investigated monitoring wells (MW08, MW09, and MW05).
Besides the really high As content in sediments, As concentrations in groundwater are relatively low, suggesting that there is no a good correlation between the dissolved and solid phase. The apparent partition coefficient (Kd) between the solid and dissolved phases, assuming the system at equilibrium, was calculated for different depths at the three 2018 monitoring stations (Table 2).
The apparent Kd values are highly variable, changing three orders of magnitudes even within the same vertical profile, but highlighting a general low mobility of As from solid to dissolved phase. Generally, Kd starts with the higher values recorded in the shallower portion of the aquifer and decrease with depth to values lower that 10 mg/g. In the literature, Jung et al. [26] estimate different ranges of Kd for arsenic as a function of pH; specifically for sediments with pH ranging between 8 and 10, Kd values vary between 1 and 10 mL/g, instead for sediments with pH ranging between 6 and 7 apparent Kd oscillate from 30 to 80 mL/g. When considering that pH values at the study site is circumneutral, most of values are comparable with those reported in literature. The decreasing of Kd under about the same total As content in sediments, results in an increase of dissolved As concentrations in groundwater in the deeper part of the aquifer.
In fact, the dissolved As concentration profile for MW07-ML, located near the source, shows that aqueous As concentration increases sharply at the bottom of the profile within the brackish-saline groundwater zone (Figure 2, left panel). Pearson correlation coefficient (r), calculated in this area of the plume, shows that As is generally positively correlated with ions that are representative of a seawater composition, showing r values of 0.7 for Cl, 0.7 for Na+, 0.8 for B, and 0.7 for SO42−. Additionally, not surprisingly, EC is well closely correlated with As, showing correlation values of 0.7. Here the SO42−/Cl ratio is comparable with values typical of seawater of about 0.14, estimated for the study site. This aspect testified that, in the source area, the presence of sulphate in groundwater is mainly due to the impacts of the past leakage from the seawater canal [43]. Morelli et al. [28] in their work highlight that seawater ingression enhance As release from solid phase, than the close correlation between As and seawater ions suggests that the release could be influenced by the presence of seawater.
In monitoring wells MW08-ML and MW09-ML located downgradient to the source area, correlation coefficients with seawater ions generally decrease, despite the evidence of seawater encroachment already testified by a previous study [35,50]. The complete set of correlation matrices is listed in the Supplementary Material (Table S2a–c). The ratio SO42−/Cl increase up to values of 5 (recorded in MW08-ML), suggesting that an additional contribution of sulphate, as well as seawater, is present in this area of the plume. This is consistent with the migration conceptual model postulated for As and other contaminants (NH4+, NO3 and PO43−) involved in the past production of fertilizers.
In addition, As concentrations are generally increasing and under reducing condition, and this is proven by the increases in dissolved Fe and Mn that were observed at those depths (Figure 4, lower panel) and also supported by the inverse correlation between As and Eh. These conditions are consistent with many other studies observing As mobilization under Fe-reducing conditions [59,60]. The presence of ammonium and sulphate and the lack in nitrate (Figure 4, middle panel) and H2S also indicates the reducing conditions are sufficient to remove nitrate through denitrification, but insufficient to remove appreciable sulphate due to sulphate reduction.
Furthermore, despite the aqueous concentration of As being strongly pH dependent [22], the three monitoring wells show a limited correlation between As and pH and, only for MW08-ML, a significative correlation is recorded (r = 0.66) at the locations where the highest As concentrations have been detected. This is likely given the relatively buffered and circumneutral pH of the system.
Although MW07-ML is near the source, downgradient multilevel monitoring wells varied much more with depth, and had higher overall concentrations of dissolved As. This suggests that, in the source zone, As may be depleted by continuous flushing with arsenic free groundwater from upstream of the industrial plant, and that the groundwater plume has migrated through the Fe reducing zone. These downgradient wells also have water chemistry consistent with extensive but heterogeneous nitrate reduction and manganese reducing conditions within this permeable zone (Figure 4, middle and lower panel).
Overall, these data are consistent with several mechanisms of As mobilization operating at the site. It is also likely a product of heterogeneity of source contamination within sediments of As, and the complexity of aquifer system both in terms of groundwater flow and contaminant distribution.

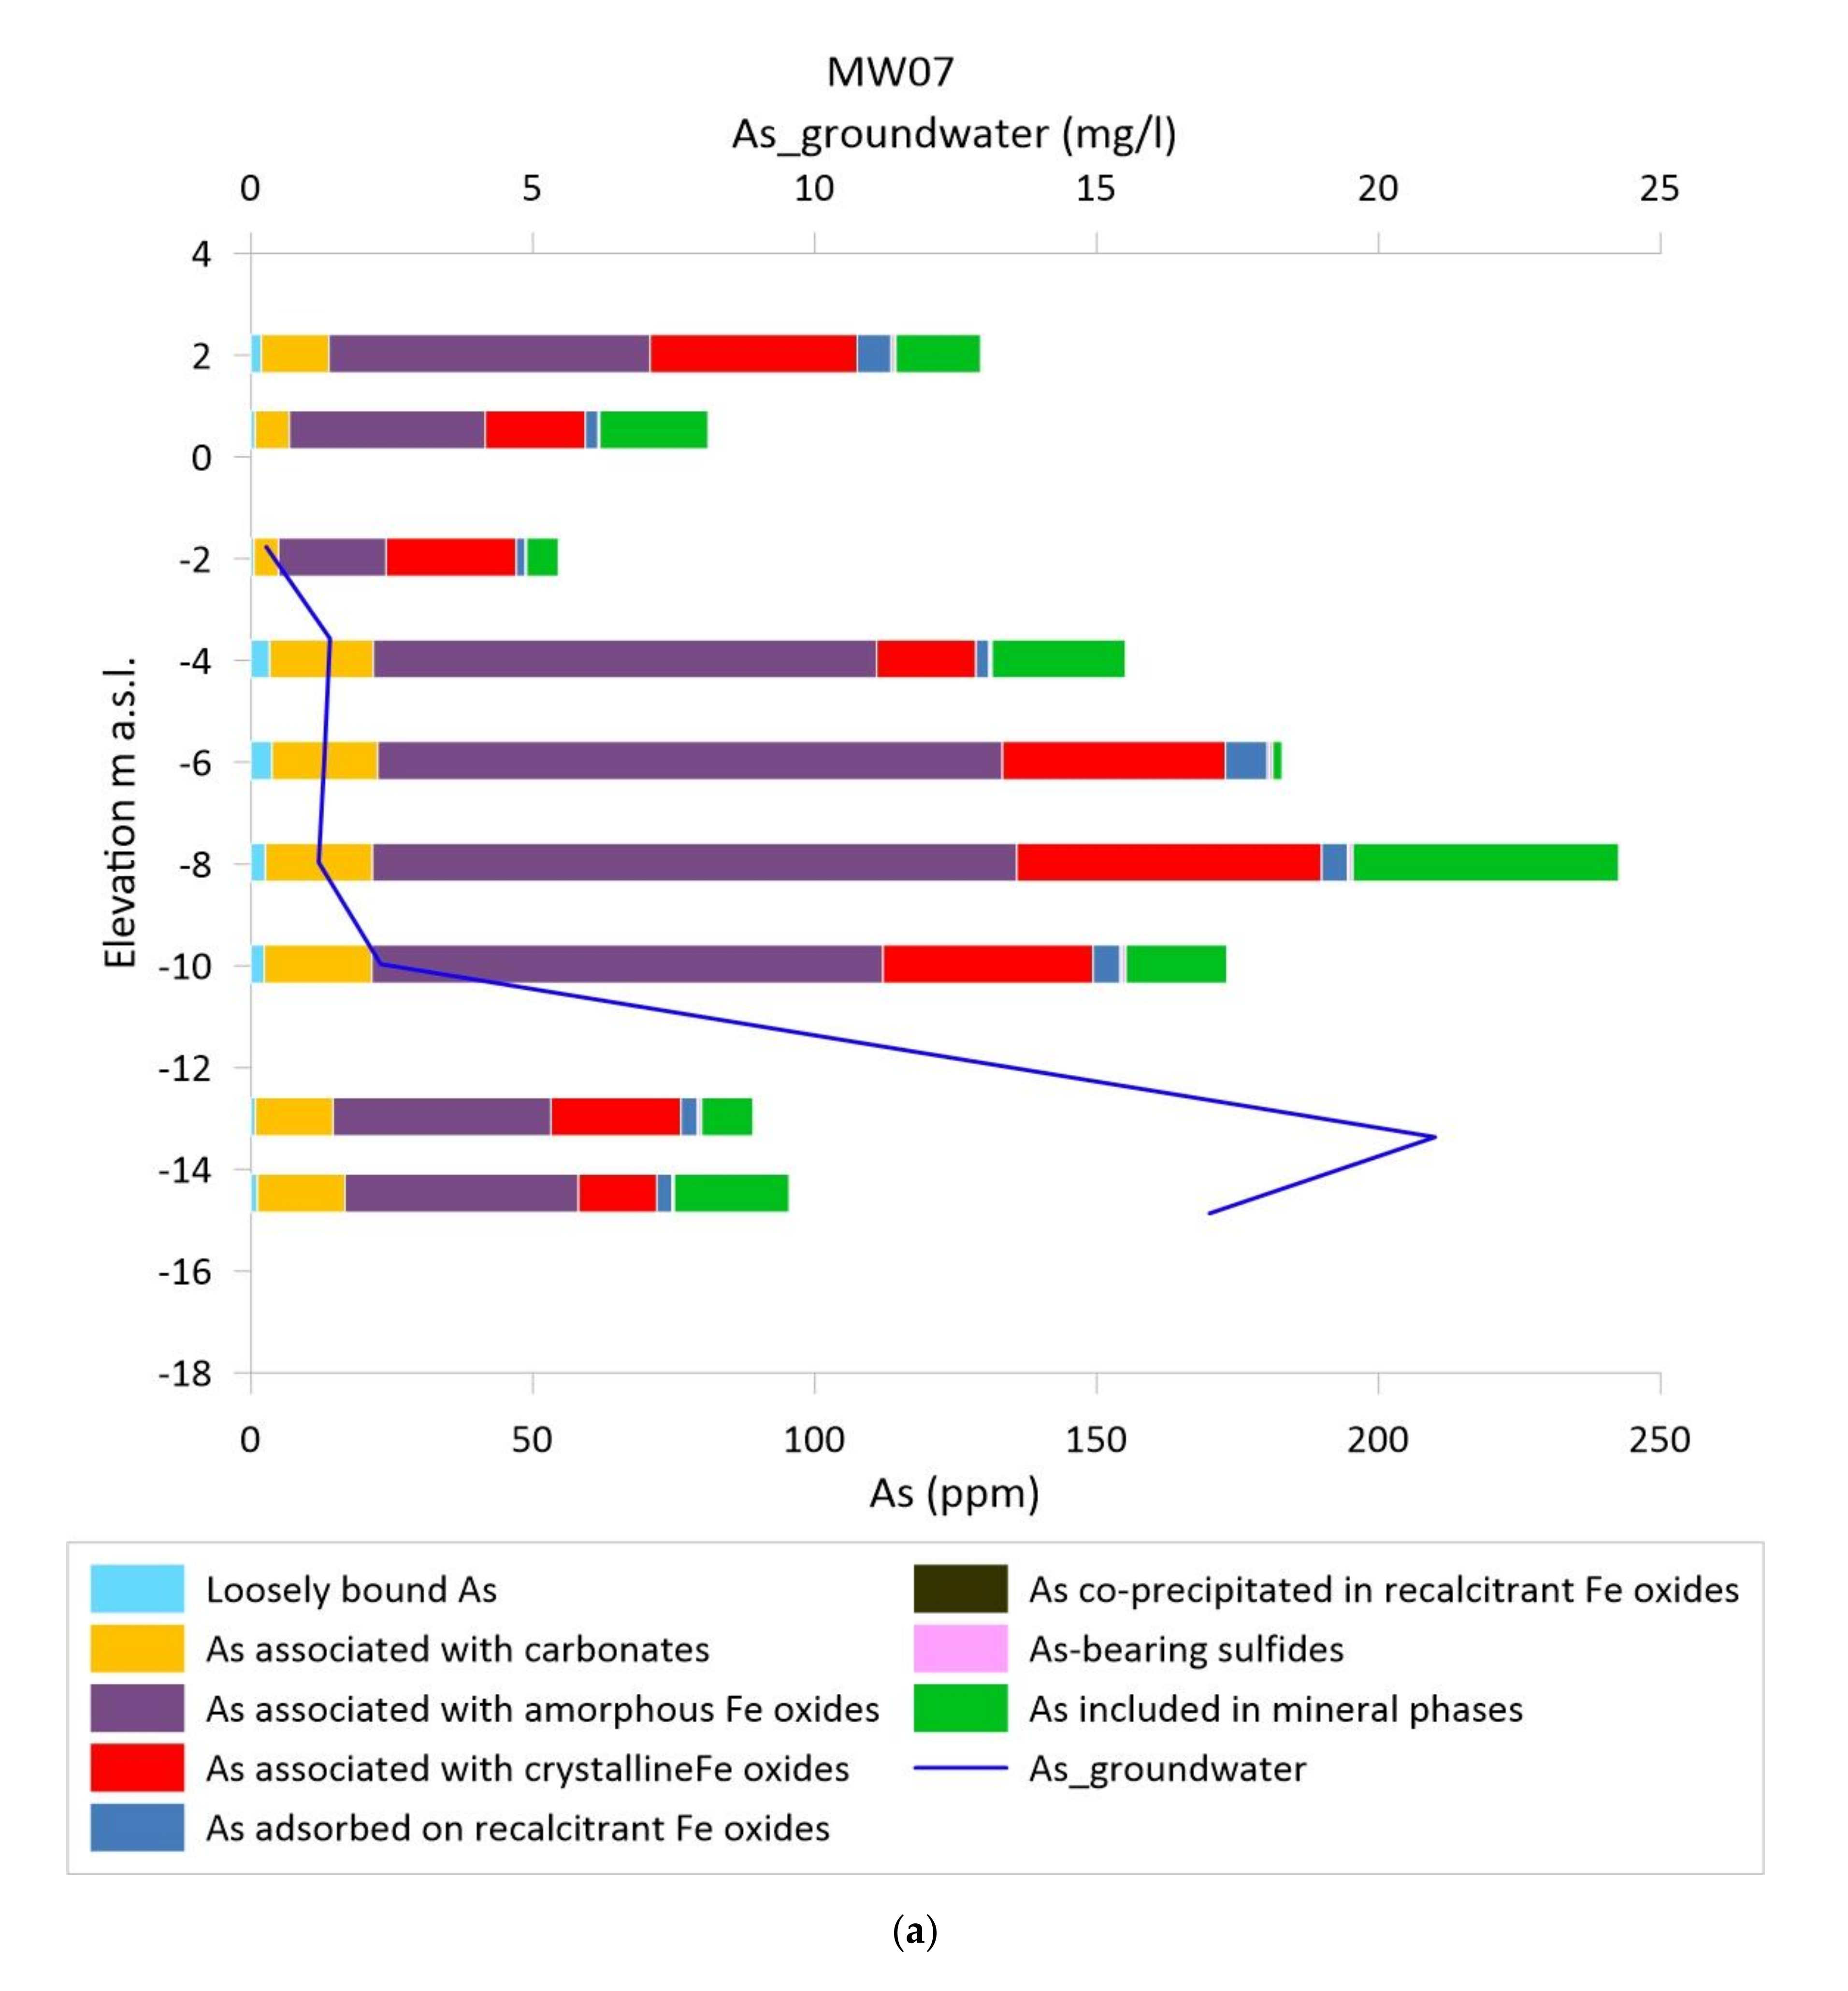
3.3. As Sequential Extraction

A detailed sequential extraction procedure was used to characterize the phase associations of As within the three cores (for MW07, MW08, MW09) collected during the 2018 sampling campaign. The resulting As concentrations and their association with the various, considered solid phases are shown in Figure 5a–c. Each graph also show the amount of As represented by the difference in concentration between digestion process and sequential extraction (As included in mineral phase, green bar). It can be seen that in all investigated cores, despite proportions ranging from 19% to 68%, the extractable As is mostly associated with amorphous Fe-oxides/hydroxides (purple bar), when extracted with hydroxylamine-hydrochloride in acetic acid (Table 1). This is particularly evident in the source area (Figure 5a), where this pool represents on average 47% of the total As content within sediments along the entire vertical profile. On the other hand, in MW08 and MW09 As bound to amorphous Fe-oxides is less abundant, and much of the As is associated with recalcitrant phases. This is strong evidence for the reductive dissolution of As-bearing iron oxides, which could prevent the effective retardation of As migrating from the source.
Given the extremely high As concentrations in the solution, it might be expected that much of the As would be weakly bound. This can be tested by measuring the MgCL2-extratable (labile fraction) of the sequential extraction procedure (light blue bar). While in the extraction procedure suggests that this phase only represents <15% of the total As, it still contains 5–10 mg/kg weakly-bound As and it has the potential to act as a source of As to groundwater for an extended period. Note that taking into account a sediment dry bulk density of 1.8 g/cm3 and an aquifer porosity of 0.3, 1 ppm of As detected in the solid phase corresponds to ~6 mg/L of dissolved As [43]. The integrated amount of As that can potentially be released from the loosely bound pool varies significantly among the considered monitoring wells between 0.4 and 169 mg/L.
The apparent Kd have been also calculated for labile fraction of As showing values that are far below than those estimated for total As content. Excluding few high values recorded for the shallower samples, the average Kd ranges between 1.5 mL/g in the source area and 0.8 mL/g in the downgradient area. This suggests that there is an effective Kd for the adsorption in some part of the aquifer.
A significant amount of As, ranging between 7% and 11%, is also associated with carbonates (yellow bar), as determined from the extractions with acetic acid and sodium acetate (Step 2, Table 1). In MW07, this pool is distributed along the entire vertical profile (Figure 5a), while in MW08 and MW09 (Figure 5b,c) it mainly occurs in the saturated zone of the aquifer. This is unusual and may reflect either As in calcareous material, particularly within the saturated zone, or As extracted from non-target phases due to the very high levels of carbonate minerals that are present in these samples. In either case, this As also is an potential source of labile As to groundwater.
Colombani et al. [43] also found in 2011 and later in 2016 (results in Table S3 in Supplementary Materials) that As is more abundant in the amorphous Fe-oxides than in any other extractable solid phase, though using an alternative extraction method [52]. This is particularly evident in the saturated zone of the aquifer, where the values average 14% (range 7% and 37%) of total As. This As is not labile without Fe reduction, but, given the evidence for Fe reduction in the system, it also could contribute As to the aquifer over the long-term. On the other hand, this reduction within the saturated zone seems to be producing recalcitrant phases. Although these phases are not yet identified, they could include magnetite or possibly pyrite (if sulphate reduction was to occur) and may represent a more stable form that has been immobilized in sediments by natural processes.

4. Conclusions

This study was aimed at delineating the spatial distribution and temporal changes of As in sediments and groundwater within a coastal aquifer that is severely impacted by a multi-contaminant mixture and subjected to an active groundwater remediation strategy. Specifically, a comparison between high resolution vertical profile in sediment and in groundwater were carried out in order to assess the distribution and the behavior of As in the polluted aquifer.
Through geochemical characterization, total As vertical distribution in the collected sediment samples has been determined, highlighting that higher concentrations are recorded in the saturated sediments at the most permeable layer (medium and coarse sand). Arsenic content in sediment were also compared with dissolved As concentrations in groundwater, pointing out the clear influence of both redox potential and electrical conductivity. Arsenic concentration generally increases with EC values and under Fe/Mn reducing condition, which, in turn, promotes the dissolution of weakly adsorbed arsenic from sediments. The influence of seawater intrusion on the release processes and/or elevated mobility is also underpinned by the positive correlation with ions that are representative of seawater compositions, especially in the source area.
The disappearing of phosphate in groundwater since 2016 suggests that the mobility of As is no longer affected by the competition with PO43− for sorption sites. The newly obtained sequential extraction results and a comparison with earlier collected data shed more light on the As associations with various solid phases. Arsenic that is associated with amorphous Fe oxides/hydroxides has emerged as the most predominant As fraction, representing 19 to 68% of the total sediment As content, while the lowest proportions were retrieved from water soluble fractions (loosely bound-As). A significant amount of As is also associated with carbonates that can represent a potential source of labile As to groundwater.
The comparison with earlier collected data further confirmed the previously developed migration conceptual model for As, also explaining the difference in As content in sediment collected at different distances from the source area. The results obtained in this study allowed for assessing potential As sources in sediments and identifying the main geochemical controlling factors that govern As mobility in the aquifer. This is reflected in the severe As contamination detected in groundwater persisting, despite the long-lasting activity of the pump and treat remediation strategy. This finding points out that an alternative remediation strategy (such as stimulated precipitation of Fe oxides/hydroxides minerals) has to be considered to limit dissolved As concentrations in groundwater.

Supplementary Materials

The following are available online at https://www.mdpi.com/2073-4441/12/10/2932/s1, Figure S1: Simplified stratigraphic logs of the three monitoring wells drilled in 2018, Table S1: Sediments sampling elevation collected in 2018 sampling survey, CMT elevation levels and groundwater sampling elevation and As content in sediment and groundwater, Table S2a: Pearson correlation matrix for MW07-ML, Table S2b: Pearson correlation matrix for MW08-ML, Table S2c: Pearson correlation matrix for MW09-ML, Table S3: Sequential extraction results from 2016 sampling survey.

Author Contributions

M.P., with the help of M.B., coordinated the entire research project. M.B., N.C., M.M., M.P. conceived and designed the experiments; C.S. coordinated and performed field activities; B.B., H.P. and Y.Z. suggested laboratory analyses, A.B., S.P. with the supervision of M.B. performed laboratory activities; C.S. wrote the paper and all the other authors revised the manuscript. All authors have read and agreed to the published version of the manuscript.

Funding

The research project “Proposal for lowering Arsenic concentration in groundwater: lab experiments, simulation models and field pilot test” has been funded by Raffineria di Gela, ENI group.

Acknowledgments

We thank Raffineria di Gela and ENI Refining & Marketing and related involved people from ENI group for their technical support in field activities. The authors would like to thank Alessandro Lacchini and Marinella Fisicaro for their technical help and suggestions. Thanks go also to Aldo Winkler of National Institute for Geophysical and Vulcanology (INGV) for the use of the magnetic susceptibility meter instrument.

Conflicts of Interest

The authors declare no conflict of interest.

References

  1. Podgorski, J.; Berg, M. Global threat of arsenic in groundwater. Science 2020, 368, 845–850. [Google Scholar] [CrossRef] [PubMed]
  2. Satinder, A. Chapter 16—Lessons learned from water disasters. In Evaluating Water Quality to Prevent Future Disasters, 1st ed.; Satinder, A., Ed.; Academic Press: Cambridge, MA, USA, 2019; Volume 11, pp. 417–427. [Google Scholar]
  3. Mukherjee, A.; Sengupta, M.; Hossain, M.; Ahamed, S.; Das, B.; Nayak, B.; Lodh, D.; Rahman, M.M.; Chakraborti, D. Arsenic contamination in groundwater: A global perspective with emphasis on the Asian scenario. J. Health Popul. Nutr. 2006, 24, 142–163. [Google Scholar] [PubMed]
  4. Chakraborti, D.; Mukherjee, S.C.; Pati, S.; Sengupta, M.K.; Rahman, M.M.; Chowdhury, U.K.; Lodh, D.; Chanda, C.R.; Chakraborti, A.K.; Basu, G.K. Arsenic groundwater contamination in Middle Ganga Plain, Bihar, India: A future danger? Environ. Health Perspect. 2003, 111, 1194–1201. [Google Scholar] [CrossRef] [Green Version]
  5. Hu, Z.; Gao, S. Upper crustal abundances of trace elements: A revision and update. Chem. Geol. 2008, 253, 205–221. [Google Scholar] [CrossRef]
  6. Smith, D.B.; Solano, F.; Woodruff, L.G.; Cannon, W.F.; Ellefsen, K.J. Geochemical and Mineralogical Maps, with Interpretation, for Soils of the Conterminous United States; USGS: Denver, CO, USA, 2017.
  7. Van Geen, A.; Bostick, B.C.; Trang, P.T.K.; Lan, V.M.; Mai, N.-N.; Manh, P.D.; Viet, P.H.; Radloff, K.; Aziz, Z.; Mey, J.L.; et al. Retardation of arsenic transport through a Pleistocene aquifer. Nature 2013, 501, 204–207. [Google Scholar] [CrossRef] [Green Version]
  8. Yang, Q.; Culbertson, C.; Nielsen, M.; Schalk, C.; Johnson, C.; Marvinney, R.; Stute, M.; Zheng, Y. Flow and sorption controls of groundwater arsenic in individual boreholes from bedrock aquifers in central Maine, USA. Sci. Total Environ. 2015, 505, 1291–1307. [Google Scholar] [CrossRef] [Green Version]
  9. Bostick, B.; Harvey, C.; Stahl, M.; Oates, P.; Vi, L.; Nguyen, M.; Viet, P.; Pham, T.; Berg, M.; Stengel, C.; et al. Distribution of Arsenic Sulfides in Van Phuc, Vietnam, and Their Relationship to Aquifer Arsenic Concentrations. In Proceedings of the AGU Fall Meeting Abstracts, San Francisco, CA, USA, 13–17 December 2010. [Google Scholar]
  10. Fendorf, S.; Michael, H.A.; van Geen, A. Spatial and temporal variations of groundwater arsenic in South and Southeast Asia. Science 2010, 328, 1123–1127. [Google Scholar] [CrossRef] [Green Version]
  11. De Lemos, J.; Bostick, B.; Renshaw, C.; Stürup, S.; Feng, X. Landfill-stimulated iron reduction and arsenic release at the coakley superfund site (NH). Environ. Sci. Technol. 2006, 40, 67–73. [Google Scholar] [CrossRef]
  12. Alonso, D.L.; Pérez, R.; Okio, C.K.Y.A.; Castillo, E. Assessment of mining activity on arsenic contamination in surface water and sediments in southwestern area of Santurbán paramo, Colombia. J. Environ. Manag. 2020, 264, 110478. [Google Scholar] [CrossRef]
  13. Camacho, L.; Gutierrez, M.; Alarcón-Herrera, M.; Villalba, L.; Deng, S. Occurrence and treatment of arsenic in groundwater and soil in northern Mexico and southwestern USA. Chemosphere 2011, 83, 211–225. [Google Scholar] [CrossRef]
  14. U.S. Environmental Protection Agency. Arsenic Treatment Technologies for Soil, Waste, and Water; U.S. EPA/National Service Center for Environmental Publications: Cincinnati, OH, USA, 2002.
  15. Root, A.R.; Vlassopoulos, D.; Rafferty, M.T.; Andrews, C.; O’Day, P.A. Speciation and natural attenuation of arsenic and iron in a tidally influenced shallow aquifer. Geochim. Cosmochim. Acta 2009, 73, 5528–5553. [Google Scholar] [CrossRef]
  16. Morin, G.; Calas, G. Arsenic in soils, mine tailings, and former industrial sites. Elements 2006, 2, 97–101. [Google Scholar] [CrossRef]
  17. Cancés, B.; Juillot, F.; Morin, G.; Laperche, V.; Alvarez, L.; Proux, O.; Hazemann, J.L.; Brown, G.E., Jr.; Calas, G. XAS Evidence of As(V) association with iron oxyhydroxides in a contaminated soil at a former arsenical pesticide processing plant. Environ. Sci. Technol. 2005, 39, 9398–9405. [Google Scholar] [CrossRef] [PubMed]
  18. Campos, V. Arsenic in groundwater affected by phosphate fertilizers at Sao Paulo, Brazil. Environ. Geol. 2002, 42, 83–87. [Google Scholar] [CrossRef]
  19. Giglioli, S.; Colombo, L.; Contestabile, P.; Musco, L.; Armiento, G.; Somma, R.; Vicinanza, D.; Azzellino, A. Source apportionment assessment of marine sediment contamination in a post-industrial area (Bagnoli, Naples). Water 2020, 12, 2181. [Google Scholar] [CrossRef]
  20. Dixit, S.; Hering, J.G. Comparison of arsenic (V) and arsenic (III) sorption onto iron oxide minerals: Implications for arsenic mobility. Environ. Sci. Technol. 2003, 37, 4182–4189. [Google Scholar] [CrossRef]
  21. Smedley, P.L.; Nicolli, H.B.; Macdonald, D.M.J.; Barros, A.J.; Tullio, J.O. Hydrogeochemistry of arsenic and other inorganic constituents in groundwaters from La Pampa, Argentina. Appl. Geochem. 2002, 17, 259–284. [Google Scholar] [CrossRef]
  22. Smedley, P.L.; Kinniburgh, D. Chapter 1. Source and Behaviour of Arsenic in Natural Waters. In United Nations Synthesis Report on Arsenic in Drinking Water; World Health Organization (WHO): Geneva, Switzerland, 2001. [Google Scholar]
  23. Prommer, H.; Sun, J.; Helm, L.; Rathi, B.; Siade, A.J.; Morris, R. Deoxygenation prevents arsenic mobilization during deepwell injection into sulfide-bearing aquifers. Environ. Sci. Technol. 2018, 52, 13801–13810. [Google Scholar] [CrossRef]
  24. Wallis, I.; Prommer, H.; Pichler, T.; Post, V.; Norton, S.B.; Annable, M.D.; Simmons, C.T. Process-based reactive transport model to quantify arsenic mobility during aquifer storage and recovery of potable water. Environmental Environ. Sci. Technol. 2011, 45, 6924–6931. [Google Scholar] [CrossRef]
  25. Wen, X.; Lu, J.; Wu, J.; Lin, Y.; Luo, Y. Influence of coastal groundwater salinization on the distribution and risks of heavy metals. Sci. Total Environ. 2019, 652, 267–277. [Google Scholar] [CrossRef]
  26. Jung, H.B.; Charette, M.A.; Zheng, Y. Field, laboratory, and modeling study of reactive transport of groundwater arsenic in a coastal aquifer. Environ. Sci. Technol. 2009, 43, 5333–5338. [Google Scholar] [CrossRef] [PubMed] [Green Version]
  27. Amarathunga, U.; Diyabalanage, S.; Bandara, U.G.C.; Chandrajith, R. Environmental factors controlling arsenic mobilization from sandy shallow coastal aquifer sediments in the Mannar Island, Sri Lanka. Appl. Geochem. 2019, 100, 152–159. [Google Scholar] [CrossRef]
  28. Morelli, G.; Rimondi, V.; Benvenuti, M.; Medas, D.; Costagliola, P.; Gasparon, M. Experimental simulation of arsenic desorption from Quaternary aquifer sediments following sea water intrusion. Appl. Geochem. 2017, 87, 176–187. [Google Scholar] [CrossRef]
  29. Liu, C.W.; Lu, K.L.; Kao, Y.H.; Wang, C.J.; Maji, S.K.; Lee, J.F. Identifying sources and controlling factors of arsenic release in saline groundwater aquifers. Hydrol. Earth Syst. Sci. 2014, 18, 1089–1103. [Google Scholar] [CrossRef] [Green Version]
  30. Le Monte, J.J.; Stuckey, J.W.; Sanchez, J.Z.; Tappero, R.; Rinklebe, J.; Sparks, D.L. Sea level rise induced arsenic release from historically contaminated coastal soils. Environ. Sci. Technol. 2017, 51, 5913–5922. [Google Scholar] [CrossRef]
  31. Sun, H. Mobilization of arsenic, lead, and mercury under conditions of sea water intrusion and road deicing salt application. J. Contam. Hydrol. 2015, 180, 12–24. [Google Scholar] [CrossRef]
  32. Misra, A.; Singh, A.; Suresh Babu, D.S.; Jain, V.; Verma, M.; Bansal, B.K.; Manish, K. Sediment and submarine groundwater discharge mediated arsenic flux into the Bay of Bengal, India: An Appraisal. Curr. Poll. Rep. 2020, 6, 206–216. [Google Scholar] [CrossRef]
  33. Qu, W.; Wang, C.; Luo, M.; Zheng, C.; Li, H. Distributions, quality assessments and fluxes of heavy metals carried by submarine groundwater discharge in different types of wetlands in Jiaozhou Bay, China. Mar. Pollut. Bull. 2020, 157, 111310. [Google Scholar] [CrossRef]
  34. Wang, Y.; Jiao, J.; Cherry, J. Occurrence and geochemical behavior of arsenic in a coastal aquifer-aquitard system of the Pearl River Delta, China. Environ. Sci. Technol. 2012, 427, 286–297. [Google Scholar] [CrossRef]
  35. Mastrocicco, M.; Colombani, N.; Sbarbati, C.; Petitta, M. Assessing the effect of saltwater intrusion on petroleum hydrocarbons plumes via numerical modelling. Water Air Soil Pollut. 2012, 223, 4417–4427. [Google Scholar] [CrossRef]
  36. Sun, J.; Bostick, B.C.; Mailloux, B.J.; Jamieson, J.; Yan, B.; Pitiranggon, M.; Chillrud, S.N. Arsenic mobilization from iron oxides in the presence of oxalic acid under hydrodynamic conditions. Chemosphere 2018, 212, 219–227. [Google Scholar] [CrossRef] [PubMed]
  37. Keimowitz, A.R.; Zheng, Y.; Chillrud, S.N.; Mailloux, B.; Jung, H.B.; Stute, M.H.; Simpson, J. Arsenic redistribution between sediments and water near a highly contaminated source. Environ. Sci. Technol. 2005, 39, 8606–8613. [Google Scholar] [CrossRef] [PubMed]
  38. Srithongkul, C.; Wongsaipun, S.; Krongchai, C.; Santasup, C.; Kittiwachana, S. Investigation of mobility and bioavailability of arsenic in agricultural soil after treatment by various soil amendments using sequential extraction procedure and multivariate analysis. Catena 2019, 181, 104084. [Google Scholar] [CrossRef]
  39. Hudson-Edwards, K.; Houghton, S.; Osborn, A. Extraction and analysis of arsenic in soils and sediments. TrAC Trends Anal. Chem. 2004, 23, 745–752. [Google Scholar] [CrossRef]
  40. Wenzel, W.W.; Kirchbaumer, N.; Stingeder, G.; Prohaska, T.; Lombi, E.; Domy, C.A. Arsenic fractionation in soils using an improved sequential extraction procedure. Anal. Chim. Acta 2001, 436, 309–323. [Google Scholar] [CrossRef]
  41. Biswas, A.; Gustafsson, J.P.; Neidhardt, H.; Halder, D.; Kundu, A.K.; Chatterjee, D.; Berner, Z.; Bhattacharya, P. Role of competing ions in the mobilization of arsenic in groundwater of Bengal Basin: Insight from surface complexation modeling. Water Res. 2014, 55, 30–39. [Google Scholar] [CrossRef] [Green Version]
  42. Wang, S.; Mulligan, C.N. Effect of natural organic matter on arsenic release from soils and sediments to groundwater. Environ. Geochem. Health 2006, 28, 197–214. [Google Scholar] [CrossRef]
  43. Colombani, N.; Mastrocicco, M.; Prommer, H.; Sbarbati, C.; Petitta, M. Fate of arsenic, phosphate and ammonium plumes in a coastal aquifer affected by saltwater intrusion. J. Contam. Hydrol. 2015, 179, 116–131. [Google Scholar] [CrossRef]
  44. Stopelli, E.; Duyen, V.T.; Mai, T.T.; Trang, P.T.; Viet, P.H.; Lightfoot, A.; Kipfer, R.; Schneider, M.; Eiche, E.; Kontny, A.; et al. Spatial and temporal evolution of groundwater arsenic contamination in the Red River delta, Vietnam: Interplay of mobilisation and retardation processes. Sci. Total Environ. 2020, 717, 137143. [Google Scholar] [CrossRef]
  45. Aullon Alcaine, A.; Schulz, C.; Bundschuh, J.; Jacks, G.; Thunvik, R.; Gustafsson, J.; Mörth, C.M.; Sracek, O.; Ahmad, A.; Bhattacharya, P. Hydrogeochemical controls on the mobility of arsenic, fluoride and other geogenic co-contaminants in the shallow aquifers of northeastern La Pampa Province in Argentina. Sci. Total Environ. 2020, 715, 136671. [Google Scholar] [CrossRef]
  46. Van Herreweghe, S.; Swennen, R.; Vandecasteele, C.; Cappuyns, V. Solid phase speciation of arsenic by sequential extraction in standard reference materials and industrially contaminated soil samples. Environ. Pollut. 2003, 122, 323–342. [Google Scholar] [CrossRef]
  47. Mastrocicco, M.; Sbarbati, C.; Colombani, N.; Petitta, M. Efficiency verification of a horizontal flow barrier via flowmeter tests and multilevel sampling. Hydrol. Process. 2013, 27, 2414–2421. [Google Scholar] [CrossRef]
  48. Sbarbati, C.; Colombani, N.; Mastrocicco, M.; Aravena, R.; Petitta, M. Performance of different assessment methods to evaluate contaminant sources and fate in a coastal aquifer. Environ. Sci. Pollut. Res. 2015, 22, 15536–15548. [Google Scholar] [CrossRef] [PubMed]
  49. Arlotti, D.; Bozzini, R.; Petitta, M.; Mancini, M.; Pianu, M.; Alberto Blanco, G.; Sbarbati, C.; Colombo, R. Control and dynamic management of a sixty-seven wells hydraulic barrier. Chem. Eng. Trans. 2012, 28, 247–252. [Google Scholar]
  50. Sbarbati, C.; Colombani, N.; Mastrocicco, M.; Petitta, M.; Aravena, R. Reactive and mixing processes governing ammonium and nitrate coexistence in a polluted coastal aquifer. Geosciences 2018, 8, 210. [Google Scholar] [CrossRef] [Green Version]
  51. USEPA. Test Methods for Evaluating Solid Waste, Physical/Chemical Methods; U.S. Environmental Protection Agency: Washington, DC, USA, 2006.
  52. Keon, N.E.; Swartz, C.H.; Brabander, D.J.; Harvey, C.; Hemond, H.F. Validation of an arsenic sequential extraction method for evaluating mobility in sediments. Environ. Sci. Technol. 2001, 35, 2778–2784. [Google Scholar] [CrossRef] [PubMed]
  53. Sun, J.; Chillrud, S.N.; Mailloux, B.J.; Bostick, B.C. In situ magnetite formation and longterm arsenic immobilization under advective flow conditions. Environ. Sci. Technol. 2016, 50, 10162–10171. [Google Scholar] [CrossRef] [Green Version]
  54. Barbieri, M.; Nigro, A.; Petitta, M. Groundwater mixing in the discharge area of San Vittorino Plain (Central Italy): Geochemical characterization and implication for drinking uses. Environ. Earth Sci. 2017, 76, 393. [Google Scholar] [CrossRef]
  55. Nordstrom, D.; Wilde, F. Reduction-6.5 Oxidation Potential (Electrode Method); U.S. Geological Survey TWRI Book 9; U.S. Geological Survey: Reston, VA, USA, 1998.
  56. Hutchinson, M.F.; Xu, T.; Stein, J.A. Recent progress in the ANUDEM elevation gridding procedure. Geomorphometry 2011, 2011, 19–22. [Google Scholar]
  57. Bostick, B.C.; Fendorf, S.; Brown, G.E. In situ analysis of thioarsenite complexes in neutral to alkaline arsenic sulphide solutions. Miner. Mag. 2005, 69, 781–795. [Google Scholar] [CrossRef]
  58. Manno, E.; Vassallo, M.; Varrica, D.; Dongarrà, G.; Hauser, S. Hydrogeochemistry and water balance in the coastal wetland area of “Biviere di Gela”, Sicily, Italy. Water Air Soil Pollut. 2007, 178, 179–193. [Google Scholar] [CrossRef]
  59. Guo, H.; Zhang, D.; Wen, D.; Wu, Y.; Ni, P.; Jiang, Y.; Guo, Q.; Li, F.; Zheng, H.; Zhou, Y. Arsenic mobilization in aquifers of the Southwest Songnen basin, P.R. China: Evidences from chemical and isotopic characteristics. Sci. Total. Environ. 2014, 490, 590–602. [Google Scholar] [CrossRef] [PubMed]
  60. Zheng, Y.; Stute, M.; van Geen, A.; Gavrieli, I.; Dhar, R.; Simpson, H.J.; Schlosser, P.; Ahmed, K.M. Redox control of arsenic mobilization in Bangladesh groundwater. Appl. Geochem. 2004, 19, 201–214. [Google Scholar] [CrossRef]
Figure 1. Investigation area (brown full line) of a contaminated coastal aquifer in Southern Italy with more than 70 pumping wells (red) for the pump-and-treat remediation scheme. The fertilizer storage buildings are presumed to be the source zone (red squares). The monitoring wells (MWs) are sampled in 2011 (blue), 2016 (yellow) and 2018 (green). Sediment cores were obtained at MW07, MW08 and MW09 in 2018 (brown, 2018 ML). Blue full and dashed lines represent iso-piezometric contour lines (0.5 m spaced out).
Water 12 02932 g001
Figure 2. (Upper panel) Electrical Conductivity (black dots) and redox potential (empty dots) vertical profile in MW07, MW08, and MW09, (Lower panel) Dissolved Oxygen (black dots) and pH (empty dots) vertical profile in MW07, MW08 and MW09.
Water 12 02932 g002
Figure 3. Iso-concentration maps of Arsenic, Ammonium, Nitrate, and Phosphate contamination in groundwater for 2016 and 2018 groundwater sampling survey.
Water 12 02932 g003
Figure 4. Total As concentration in sediments (red dots), extractable As (green dots) and in groundwater (blue dots) vertical profile in MW07-MW07-ML, MW08-MW08-ML and MW09-MW09-ML (upper panel); dashed area represents the estimate of background As concentration in sediments (Manno et al., 2007). Ammonium (NH4+), Nitrate (NO3, Sulfate (SO42−) concentration vertical profiles in groundwater in MW07-ML, MW08-ML, nd MW09-ML (middle panel); Iron (Fe) and Manganese (Mn) concentration vertical profiles in groundwater in MW07-ML (left panel), MW08-ML (middle panel), and MW09-ML.
Water 12 02932 g004
Figure 5. (a). Bar chart of sequential extraction results in MW07 compared with dissolved As vertical profile. (b) Bar chart of sequential extraction results in MW08 compared with dissolved As vertical profile. (c) Bar chart of sequential extraction results in MW09 compared with dissolved As vertical profile.
Water 12 02932 g005aWater 12 02932 g005bWater 12 02932 g005c
Table 1. Sequential extraction procedure applied to sediment samples collected in 2018 (modified from Sun et al. 2016).
StepExtractant and TimeTarget Fe PhaseTarget As Phase
11 mol/L magnesium chloride, pH 7, 2 h, one repetitionExchangeable FeLoosely bound As
2 *1 mol/L sodium acetate adjusted to pH 4.5 with acetic acid, 24 h, one repetitionFe carbonates (siderite)As associated with carbonates, weakly bound As
3 *1 mol/L hydroxylamine-hydrochloride in 25% v/v acetic acid, 48 h, one repetitionAmorphous Fe(III) oxides (ferrihydrite)As associated with amorphous Fe oxides
4 *50 g/L sodium dithionite, pH 4.8 with acetic acid/sodium citrate, 2 h, one repetitionCrystalline Fe(III) oxides (goethite and hematite)As associated with crystalline Fe oxides
51 mol/L sodium phosphate, pH 5, 16 h & 24 h, one repetition for each time period--As adsorbed on recalcitrant Fe oxides
6 *0.2 mol/L ammonium oxalate/0.17 mol/L oxalic acid, 6 h, one repetitionRecalcitrant Fe oxides
(magnetite)
As co-precipitated in recalcitrant Fe oxides
7 *16 mol/L nitric acid, 2 h, one repetitionFe(II) sulfides (mackinawite and pyrite)As-bearing sulfides
* The step has been followed by a wash step with 1 mol/L magnesium chloride.
Table 2. Apparent partition coefficient (Kd) calculated for 2018 monitoring stations.
MW07KdMW08KdMW09Kd
Depth
m a.s.l.
mL/gDepth m a.s.l.mL/gDepth m a.s.l.mL/g
−2.0201.9−2.52019.2−2.51058.9
−4.0110.8−4.550.5−4.5557.0
−6.0140.7−6.539.8−6.547.1
−8.0202.2−8.597.2−8.532.8
−10.075.3−10.54.3−10.59.3
−13.04.2−12.54.2−12.56.3
−14.55.6−14.53.5−14.552.5
Publisher’s Note: MDPI stays neutral with regard to jurisdictional claims in published maps and institutional affiliations.

