Biochar from Agricultural by-Products for the Removal of Lead and Cadmium from Drinking Water
by
 and
and
Edgar Pineda Puglla
1, 
Diana Guaya
2,
Cristhian Tituana
3,
Francisco Osorio
4 and
María J. García-Ruiz
4,* 1
Department of Geology, Mines and Civil Engineering, UTPL, Universidad Técnica Particular de Loja, Barrio San Cayetano Alto, Marcelino Champagnat Street, s/n, Loja 110107, Ecuador
2
Department of Chemical, UTPL, Universidad Técnica Particular de Loja, Barrio San Cayetano Alto, Marcelino Champagnat Street, s/n, Loja 110107, Ecuador
3
Civil Engineering Degree, UTPL, Universidad Técnica Particular de Loja, Barrio San Cayetano Alto, Marcelino Champagnat Street, s/n, Loja 110107, Ecuador
4
Department of Civil Engineering, Institute of Water, University of Granada, Ramón y Cajal Street, 4, 18071 Granada, Spain
*
Author to whom correspondence should be addressed.
Water 2020, 12(10), 2933; https://doi.org/10.3390/w12102933
Submission received: 29 August 2020
/
Revised: 7 October 2020
/
Accepted: 14 October 2020
/
Published: 20 October 2020
(This article belongs to the Special Issue Biofiltration and Physicochemical Filtration for Water Treatment)
Abstract
:This study reports the adsorption capacity of lead Pb2+ and cadmium Cd2+ of biochar obtained from: peanut shell (BCM), “chonta” pulp (BCH) and corn cob (BZM) calcined at 500, 600 and 700 °C, respectively. The optimal adsorbent dose, pH, maximum adsorption capacity and adsorption kinetics were evaluated. The biochar with the highest Pb2+ and Cd2+ removal capacity is obtained from the peanut shell (BCM) calcined at 565 °C in 45 min. The optimal experimental conditions were: 14 g L−1 (dose of sorbent) and pH between 5 and 7. The sorption experimental data were best fitted to the Freundlich isotherm model. High removal rates were obtained: 95.96% for Pb2+ and 99.05. for Cd2+. The BCH and BZM revealed lower efficiency of Pb2+ and Cd2+ removal than BCM biochar. The results suggest that biochar may be useful for the removal of heavy metals (Pb2+ and Cd2+) from drinking water.
1. Introduction
Water pollution by wastewater discharges into rivers or bodies of water by anthropogenic activities has increased due to population growth [1,2]. Heavy metals in water promote toxicity, and they are not biodegradable [3,4]. Low concentration of heavy metals has a great impact on human health and aquatic life. They can cause respiratory problems, weakening of the immune system, damage to the kidneys or liver, genetic and neurological alterations and death [5]. Lead (Pb2+) and cadmium (Cd2+) are abundant in nature; however, they are very toxic. Pb2+ and Cd2+ are incorporated into the food chain in low concentrations by water systems, affecting wildlife and people [6].
In South America, some rivers that supply drinking water to cities contain Pb2+ in high concentrations. The Rímac River in Lima, Peru, in 2009, registered a concentration of 2.15 mg L−1 Pb2+ [7]. In 2017, the Rímac river maintained a high Pb2+ concentration (2.064 mg L−1) and also reported a Cd2+ concentration of 0.038 mg L−1 [8]. In Ecuador, some rivers contain heavy metals from mining [9]. The Puyango river, located between Loja and El Oro provinces at southern Ecuador, reported an average content of 0.77 mg L−1 of Pb2+. However, the water from Puyango river is used for agricultural application and human consumption by northern Peru.
There are some technologies for heavy metal removal from water, such as chemical precipitation, ion exchange, electrochemical treatment, membrane technologies, reverse osmosis, electrodialysis, nanofiltration, coagulation and adsorption [10,11,12,13,14,15]. Adsorption is an efficient, simple and low cost technology for heavy metal removal from water [16,17]. A low cost, renewable and high heavy metal sorption capacity characterizes an efficient sorbent [18]. The activated carbon is efficient for heavy metal adsorption; however, it is expensive and unprofitable for water treatment. So, the use of agricultural by-products as a bioadsorbent-type biochar has become attractive for some researchers [19,20].
Biochar from vegetal sources is used for carbon sequestration due to its stability and physicochemical properties [21]. The biochar properties depend mainly on the source raw material and the calcination temperature. Biochar contains mineral and carbon fractions. The formation of aromatic structures and oxygenated functional groups (Oxygen Functional Groups, OFG) are controlled by the calcination temperature [22]. Biochar is also an effective sorbent for nutrient removal from water due to the high specific surface, porous structure and high cation and anion exchange capacity [23].
The aim of this study is to use the agricultural by-products: peanut shell, “chonta” pulp and corn cob, to transform them into biochar for Pb2+ and Cd2+ removal from water. The peanut shell, “chonta” pulp and corn cob were selected because they are agricultural residues that are found in abundance in the location. Not much information has been found about previous studies using “chonta” pulp for biochar obtention and adsorption of heavy metals. The objectives of the present study are: (i) determine the optimal calcination conditions of the agricultural by-products for biochar obtention and (ii) evaluate the efficiency of the biochar for Pb2+ and Cd2+ removal by batch experiments.
2. Materials and Methods
2.1. Raw Materials Collection
The agricultural by-products: peanut shells, “chonta” pulp and corn cob. The “chonta” (Bactris gasipaes) belongs to the Araceae family. The “chonta” grows in the tropical and subtropical regions of the American continent [24,25]. “Chonta” is fruit which is part of the nutritional diet of the indigenous tribes from the Amazon. The peanut (Arachis hypogaea) is a legume of the Fabaceae family which is originally from South America [26]. The corn (Zea Mays) belongs to the Graminea family [27]. The raw material was acquired in the southern region of Ecuador. The peanut shell and the corn cob were collected at Loja province (3°52′23” S–79°38′27” W). The “chonta” fruit was obtained from Ecuadorian Amazon at Zamora Chinchipe province (4°4.011′ S–78°57.293′ W).
2.2. Calcination of Biomass
The “chonta” pulp was separated from the walnut using a 1.5 kg mortar. The peanut shell and the corn cob were processed in situ from the harvesting tasks. The raw materials were washed with deionized water to remove impurities. After, raw materials were dried at 105 °C for 24 h [28,29].
The optimal calcination temperature and time were determined with a thermogravimetric analysis. A mass (10 g) of each biomass was calcinated from 30 °C to 800 °C at 10 °C min−1 rate [30,31,32]. The carbon content and yield were evaluated for the obtained biochar. The biomass was calcinated until 500 °C maintaining it at a constant during the 30 min [33,34,35]. Furthermore, the calcination was evaluated during 45 and 60 min until 600 and 700 °C, respectively [36].
After calcination, biochar was triturated pass through a mechanical sieve equipment (Retsch AS200). There was obtained biochar sizes in the range of 4.76 mm to 2 mm, sieve ASTM No. 4 and ASTM No. 10, respectively. The biochar particles were washed with deionized distilled water to remove impurities and ash [29,37], finally biochar were dried at 105 °C during 60 min [28,38].
2.3. Biochar Characterization
The moisture content, volatile matter, ash and fixed carbon were determined, according to the ASTM D3174-12 (Standard Test Method for Ash in the Analysis Sample of Coal and Coke from Coal) standard [34,39]. The yield was determined by weight mass difference between the biomass and the biochar obtained after calcination [40]. The moisture content was determined by drying 1 g of biochar at 105 °C for 180 min, then the sample was placed in a desiccator until the final weight was registered [41].
The morphology and composition of the biochar were studied in a Scanning Electron Microscopy coupled to the Energy Dispersive Spectroscopy system.
To biochar specific surface was determined by the nitrogen gas adsorption method. An automatic adsorption analyzer (Micrometrics) was used. Trials were performed with three replicates and average values are reported.
The ash content was determined using 0.10 g of dry biochar. The sample was introduced into a muffle preheated at 650 °C between 3 h and 16 h. The calcination was completed when constant weight was obtained [42]. The volatile material was determined by weighing 1 g of biochar, which is preheated in a muffle at 950 °C for 7 min. Finally, the biochar weight correspond to the non-volatile compounds [43]. The moisture, volatile material, ash and fixed carbon of biochar is equal to 100% of the carbon composition. The fixed carbon was determined by mass balance from 100% of the carbon composition, the percentage of moisture, ash and volatile material [39].
The weight: volume ratio as the apparent density was determined according to ASTM D2854 - 09 (Standard Test Method for Apparent Density of Activated Carbon). An electro vibrator was used with a uniform flow range of 0.75 cm3 s−1 to 1 cm3 s−1, to improve the density results [44].
Finally, the use of a Hirox KH 8700 digital microscope and Labscope software, the pore size on the grain surface was measured.
2.4. Evaluation of Pb2+ and Cd2+ Removal from Aqueous Solution
A nomenclature was used to identify each biochar obtained from: peanut shell (BCM), “chonta” (BCH) and corn cob (BZM). The adsorption capacity was determined using Equation (1) [32].
where (mg g−1) is the adsorption capacity; (mg L−1) is the initial concentration; . (mg L−1) is the equilibrium concentration; (L) is the volume of Pb2+ or Cd2+ aqueous solution and m (g) is the sorbent mass. The removal percentage (%Removal) were determined by Equation (2) [32].
2.4.1. Effect of pH
The adsorption capacity and removal percentage were evaluated at pH 3, 5, 7 and 9 at room temperature of 18 °C. Synthetic solutions containing 2 mg L−1 Pb2+ and 2 mg L−1 Cd2+ at were prepared from Pb (NO3)2 (purity 99.5%, MERCK) and using a standard of 1000 mg L−1 Cd2+, SIGMA – ALDRICH, respectively. The pH of the solution was adjusted using NH4OH at 0.1 mol L-1 or HCl 0.1 M [45]. The amount of biochar and adsorbate was the same for each pH value under evaluation. The flask was stirred for 45 min at 140 rpm. The equilibrated solution were filtered on a 45 μm filter paper and HNO3 was added (0.1 mol L−1) to avoid the precipitation of metal ions [28]. An inductively coupled plasma optical emission spectrometer (Perkin Elmer OPTIMA 8000) was used for determining the metals’ concentration. The adsorption capacity and removal percentage were determined.
2.4.2. Effect of Adsorbent Dose
The amount of biochar was evaluated using concentrations of 8, 10, 12, 14 and 16 g L−1 of adsorbent at room temperature at 18 °C. 100 mL of solution containing 2 mg L−1 Pb2+ and 2 mg L−1 Cd2+ at pH 5. The flask was stirred for 45 min at 140 rpm. The equilibrated solution was filtered on a 45 μm filter paper. The equilibrium concentration was determined.
2.4.3. Adsorption Isotherms
The initial concentrations of the synthetic Pb2+ and Cd2+ solutions were: 1, 2, 3 and 4 mg L−1. 50 mL of synthetic solutions using 2 mg L−1 of sorbent were equilibrated during 45 min at 18 °C. The equilibrated solution was filtered on a 45 μm filter paper. The equilibrium concentration
was determined. The experimental data were fitted to de Langmuir and Freundlich isotherm models [28,44]. Langmuir model describe the chemical or monolayer adsorption and Freundlich will indicate whether it is a physical or multilayer adsorption. The Langmuir isotherm model is represented by Equation (3) [46].
where is maximum adsorption capacity required for the formation of monolayer; (L mg−1) is a Langmuir constant related to the affinity constant between the adsorbent and an adsorbate.
The Freundlich equation model is represented by Equation (4) [47].
where (L mg−1) is the Freundlich adsorption constant, which characterizes the strength of adsorption; n (dimensionless) is a Freundlich intensity parameter.
2.4.4. Adsorption Kinetic
The adsorption kinetics of a 2 mg L−1 Pb2+ and 2 mg L−1 Cd2+ solution was performed at 5 °C and 18 °C. In total, 100 mL of a 2 mg L−1 Pb2+ and Cd2+ at 5 were equilibrated with biochar at 140 rpm. A 5 mL aliquot was taken from the solution during equilibration at 5, 15, 30, 45 and 60 min [37]. The equilibrated solution was filtered on a 45 μm filter paper. The equilibrium concentration Ce was determined. The experimental data were fitted to the pseudo-first order [48] and the pseudo-second order [49] kinetic model. The adsorption of metal ions as a function of time was determined by Equation (5) [37].
where (mg g−1) is the sorption capacity at t time; (mg L−1) is the concentration of an adsorbate after a contact time t (min). The Lagergren pseudo-first order model is represented by Equation (6) [48].
where (min−1) is the first order rate constant; t (min) is the contact time. The Ho Model or pseudo-second order is denoted by Equation (7) [49].
Integrating the previous equation for the conditions of for 0, Equation (8) [50].
where (g mg−1 min−1) is the second order constant. The adsorption rate is denoted by Equation (9).
where v (mg g−1 min−1) is the adsorption rate; (min) is the equilibrium time determined by the kinetic.
3. Results
3.1. Calcination Conditions
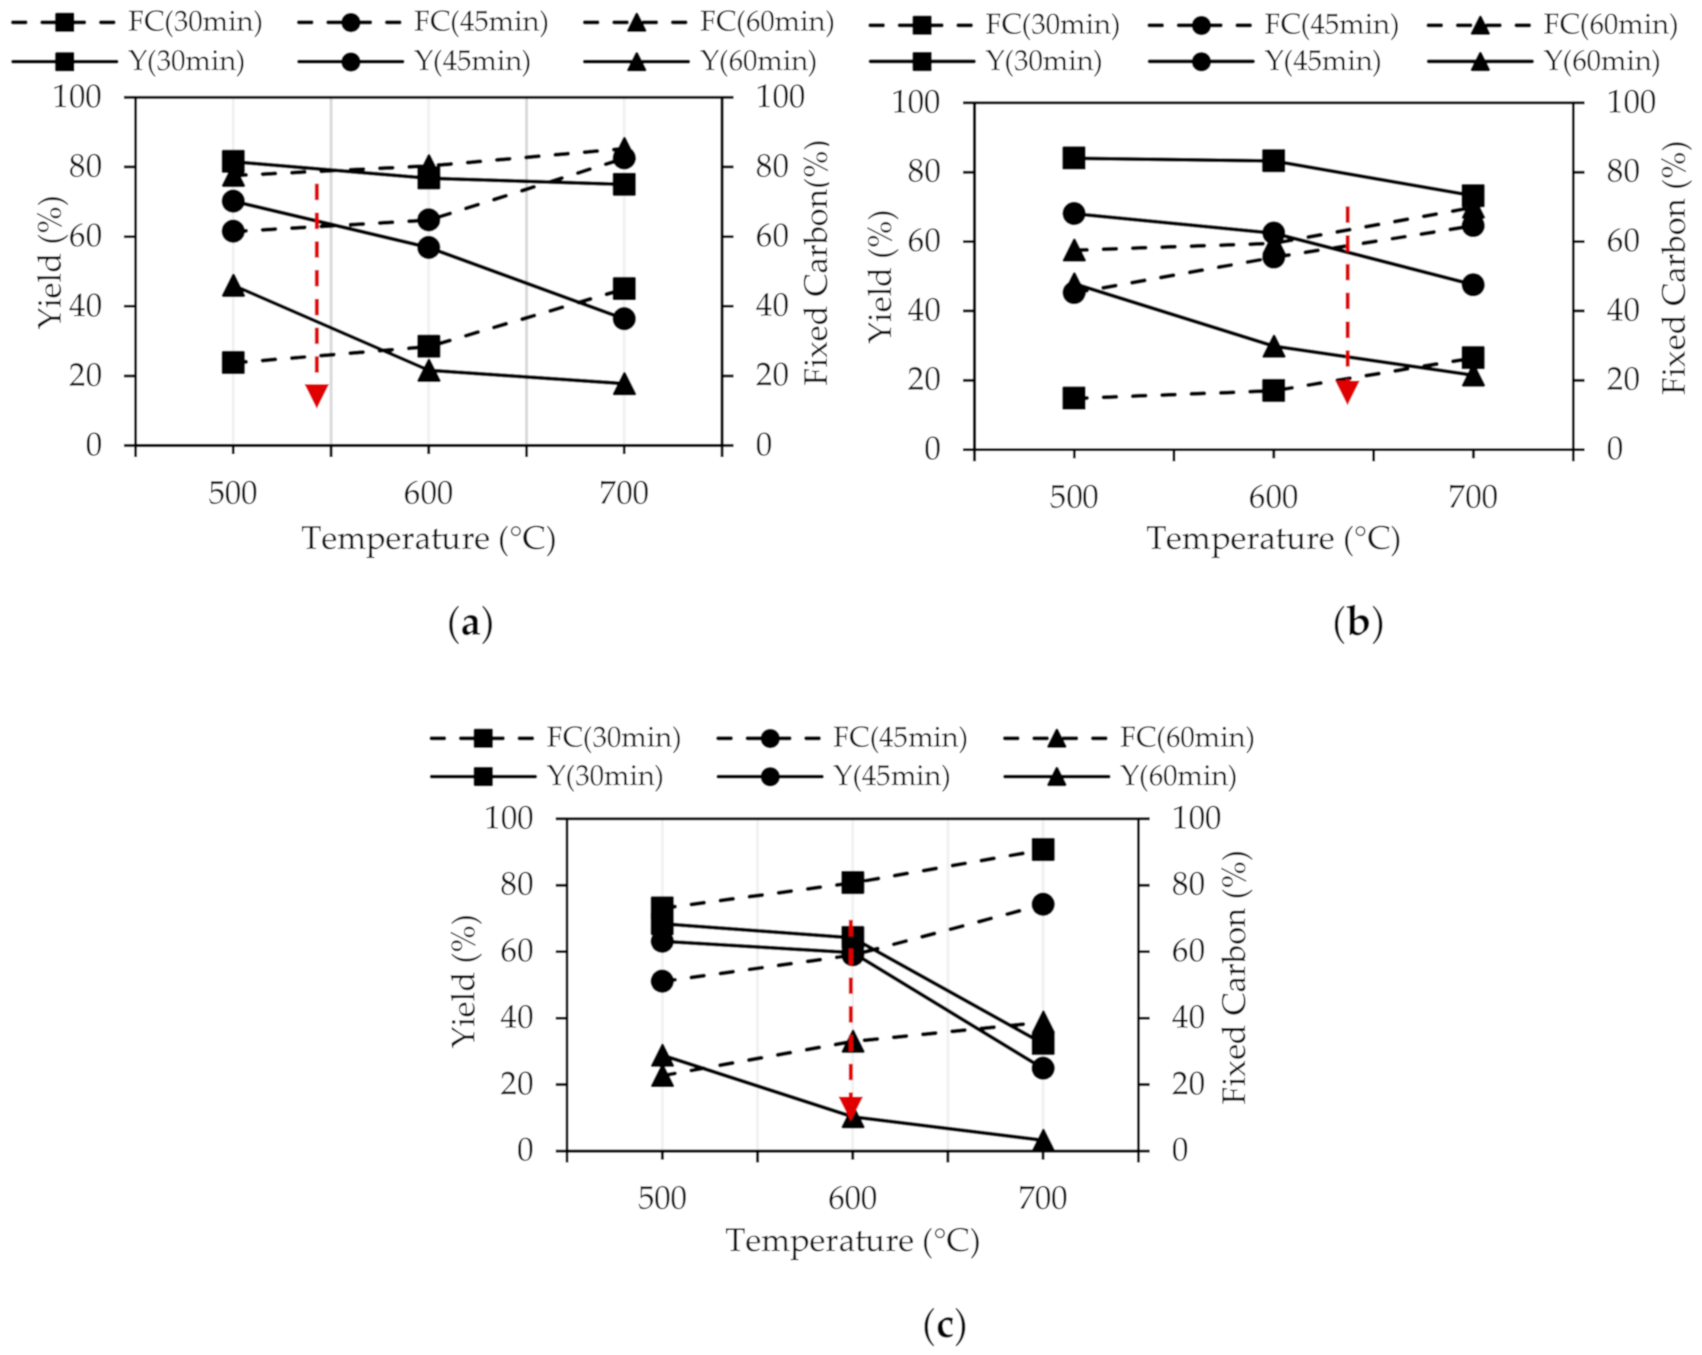
The curves for the fixed carbon content at 30, 45 and 60 min are presented by Figure 1. They are identified as FC (30 min), FC (45 min) and FC (60 min). The yield is identified as Y (30 min), Y (45 min) and Y (60 min), respectively.
The intersection of Y and FC curves is the optimal carbonization point. For the BCM, the optimal calcination point was determined at 565 °C for 45 min. The BCH is optimally calcinated at 630 °C for 45 min, and the BZM is optimally calcined at the 600 ° C for 45 min. At 30 and 60 min, biochar present high content of FC and a low Y.
These results have been compared with other studies developed with biochar obtained from organic material. N’goran et al. [37] calcined cashew shells at 500 °C for 240 min and walnut shells at 450 °C for 120 min in an electric oven. Colpas et Al. [39] calcined the corn cob at 400 °C for 60 min in a multipurpose furnace. Castellar [51] reports calcination temperatures of 530 °C for 30 min for the cassava shell, carried out in a muffle furnace. Therefore, the carbonization temperature obtained for the organic materials used is in the order of the values reported in similar studies, considering it ideal for the transformation of these biomass.
3.2. Biochar Characterization
The result of biochar characterization is presented in Table 1. Peanut shell biochar obtained at 565 °C, “chonta” pulp biochar obtained at 630 °C and corn cob biochar obtained at 600 °C. The moisture content of biochar is according to the recommended values suggested according to the ASTM D2867-04, between 2%–15%.
The apparent density of the biochar is in the order of the range established by the ASTM D2854-09 standard, from 0.26–0.65 g cm−3. The apparent density of the biochar obtained is low, so the mass of these adsorbents should be less in a batch device. This fact can be favorable because fewer particles increase the porosity and a better contact between the adsorbent’s surface and the adsorbate can occur. This avoids overlapping of adsorption sites due to large adsorbent masses [44]. The biochars obtained are in accordance with the AWWA B604-90 (Standard for granular activated carbon) [52]. This Standard recommends that the particle of the granular carbon for water treatment should have an effective size between 0.4 to 3.3 mm.
The ASTM D3175-20 (Standard Test Method for Volatile Matter in the Analysis Sample of Coal and Coke) considers Mv is optimal between 21.25% and 28.84%. ASTM D3175-20 (Standard Test Method for Volatile Matter in the Analysis Sample of Coal and Coke) establishes a range of 21.25%–28.84% for Mv. The Mv of BCH is higher than BCM and BZM. A biochar with a low content of volatile material is not very combustible; the lower the amount of Mv, the higher the fixed carbon content, an aspect that will favor at the time of adsorption [39,53,54].
The Cc of the biochar are in accordance with the ASTM D-2866-11 (Standard Test Method for Total Ash Content of Activated Carbon) standard establishes a range from 3% to 15%. A high ash content indicates that the biochar is fragile to carbonize but the low Cf content obtained affect its specific surface the adsorption capacity [55,56]. The higher specific surface the better the adsorption capacity. The specific surface of the BCM was higher and had a higher adsorption capacity than the other materials tested. The specific surface of the biochar was compared with other similar materials (Table 2).
3.3. Sorbent Chemical Characteristics
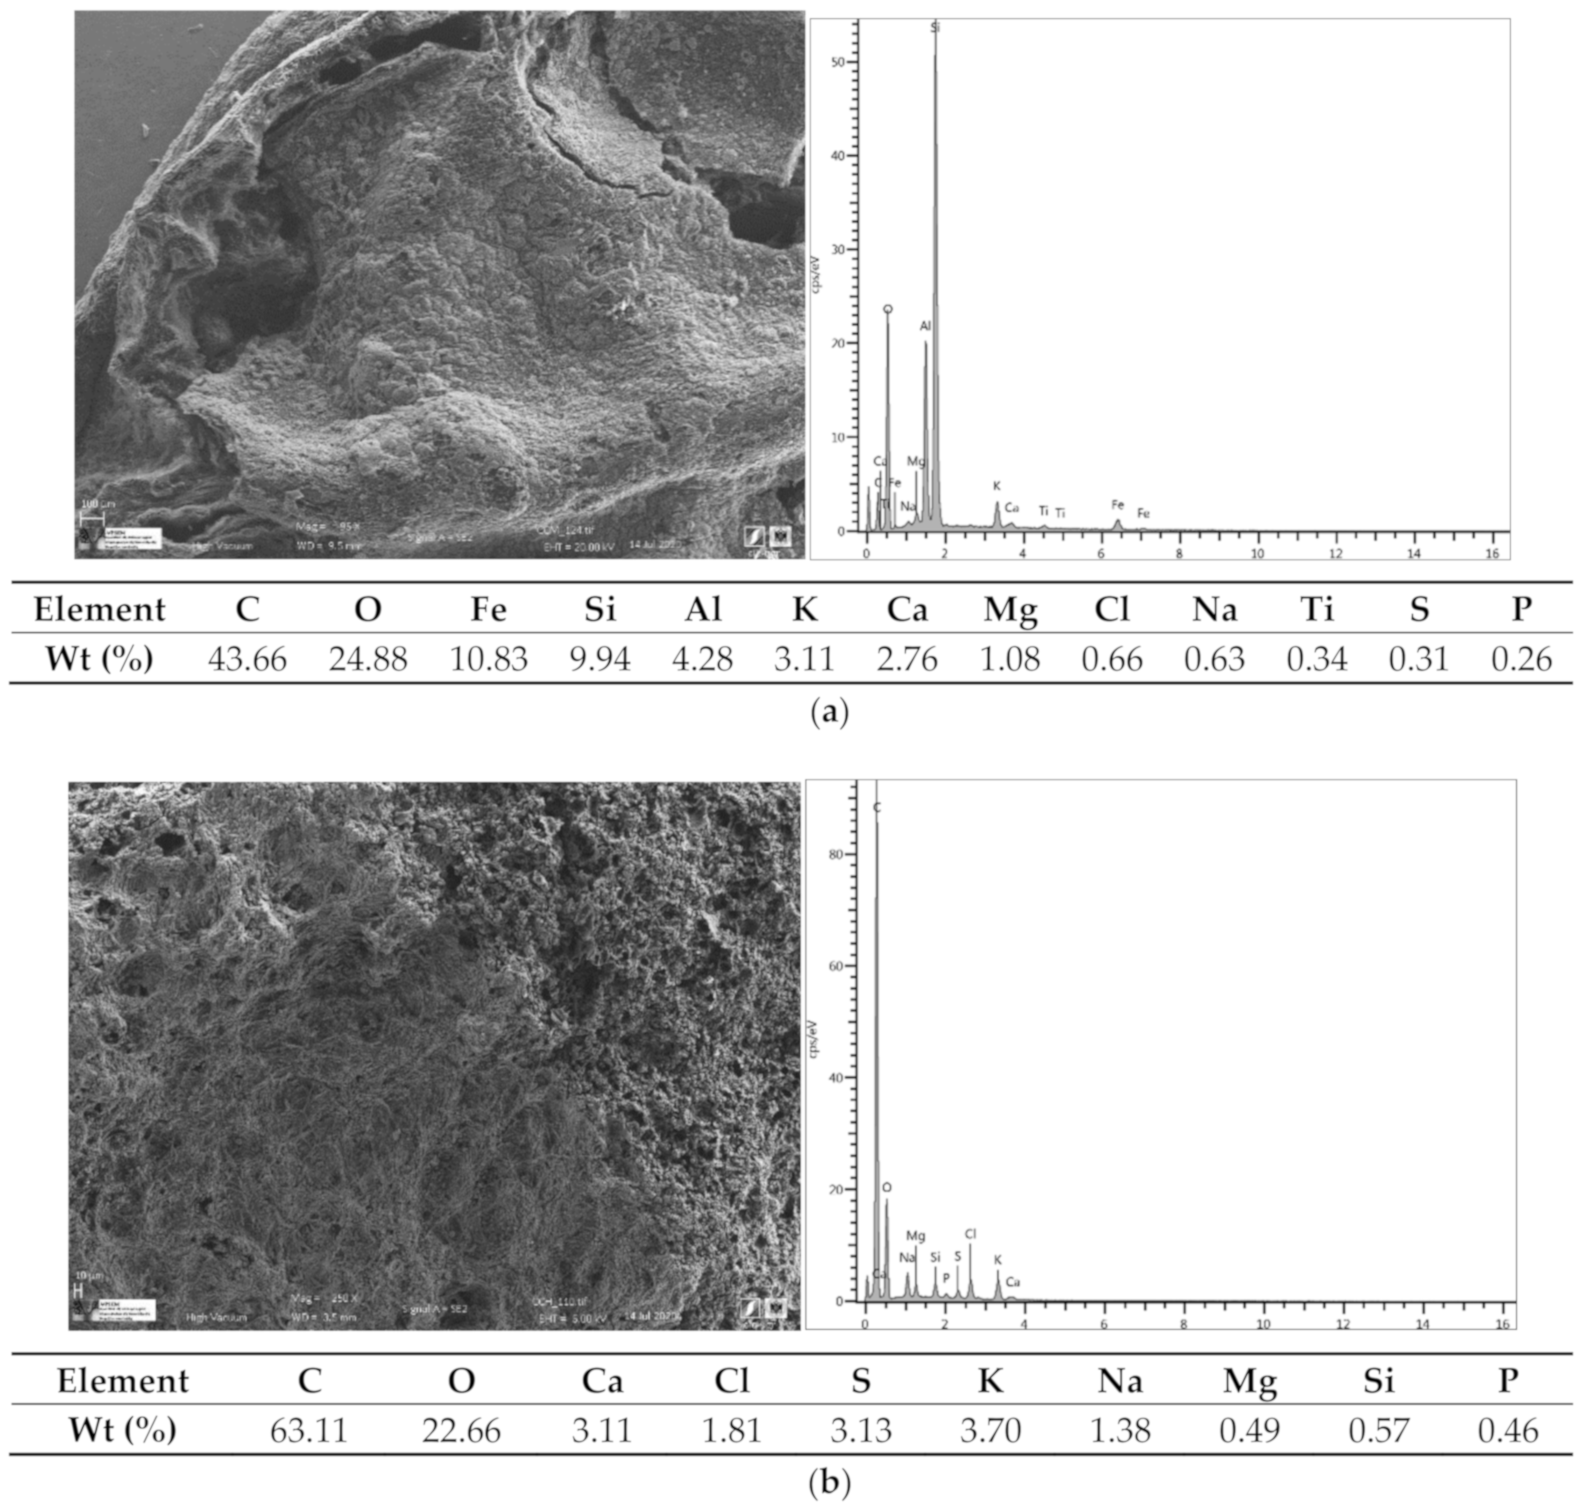
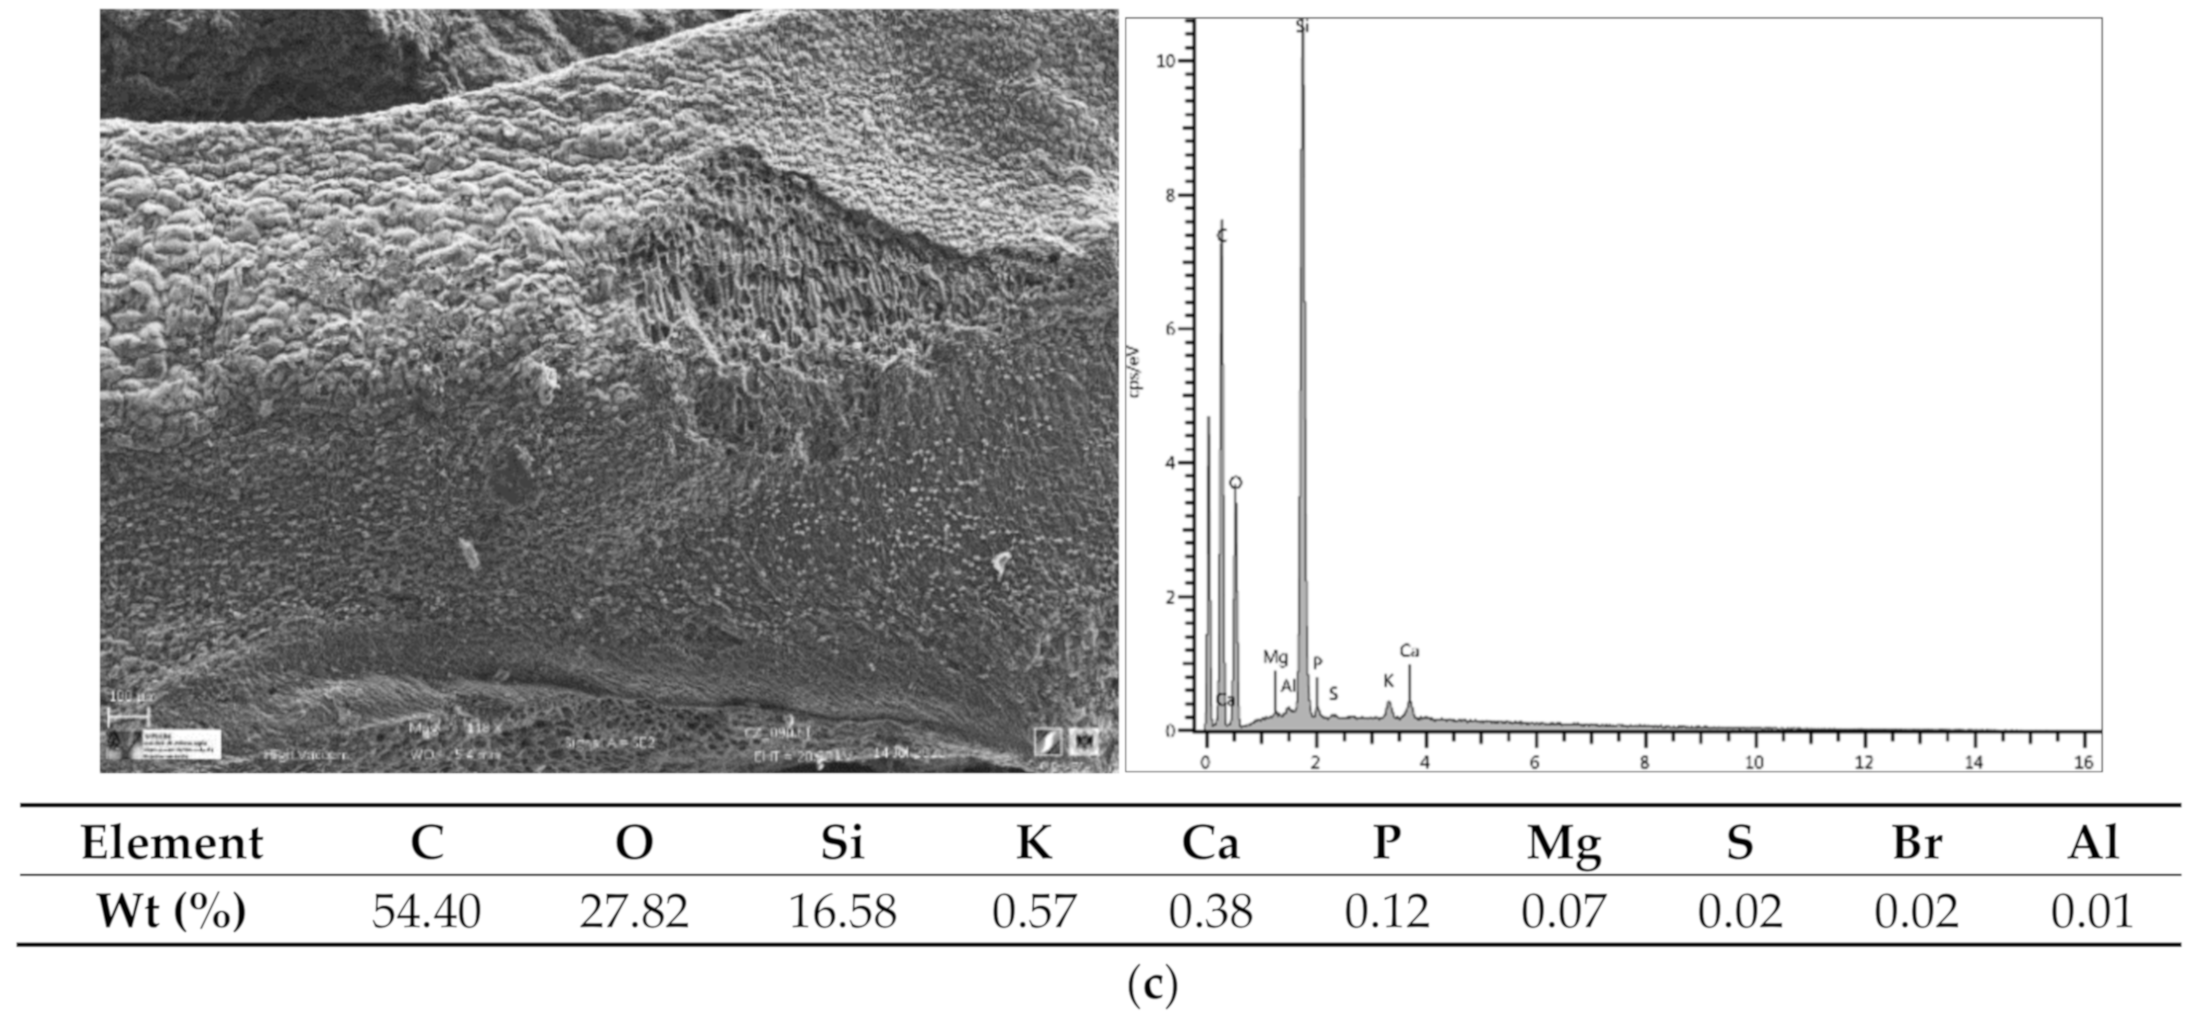
The morphology and chemical compositions of the adsorbents were analyzed using a scanning electron microscope (SEM) coupled Energy Dispersive X-ray spectroscopy (EDX) (EDX) (Figure 2a–c). BZM contains mainly silicon, the whitish coloration can be leathery materials from the plant that generated the carbon. BCH contains a lot of calcium sulphate, gypsum, some phosphorus (typical of organic materials) and a little silicon.
3.4. Adsorption as A Function of pH
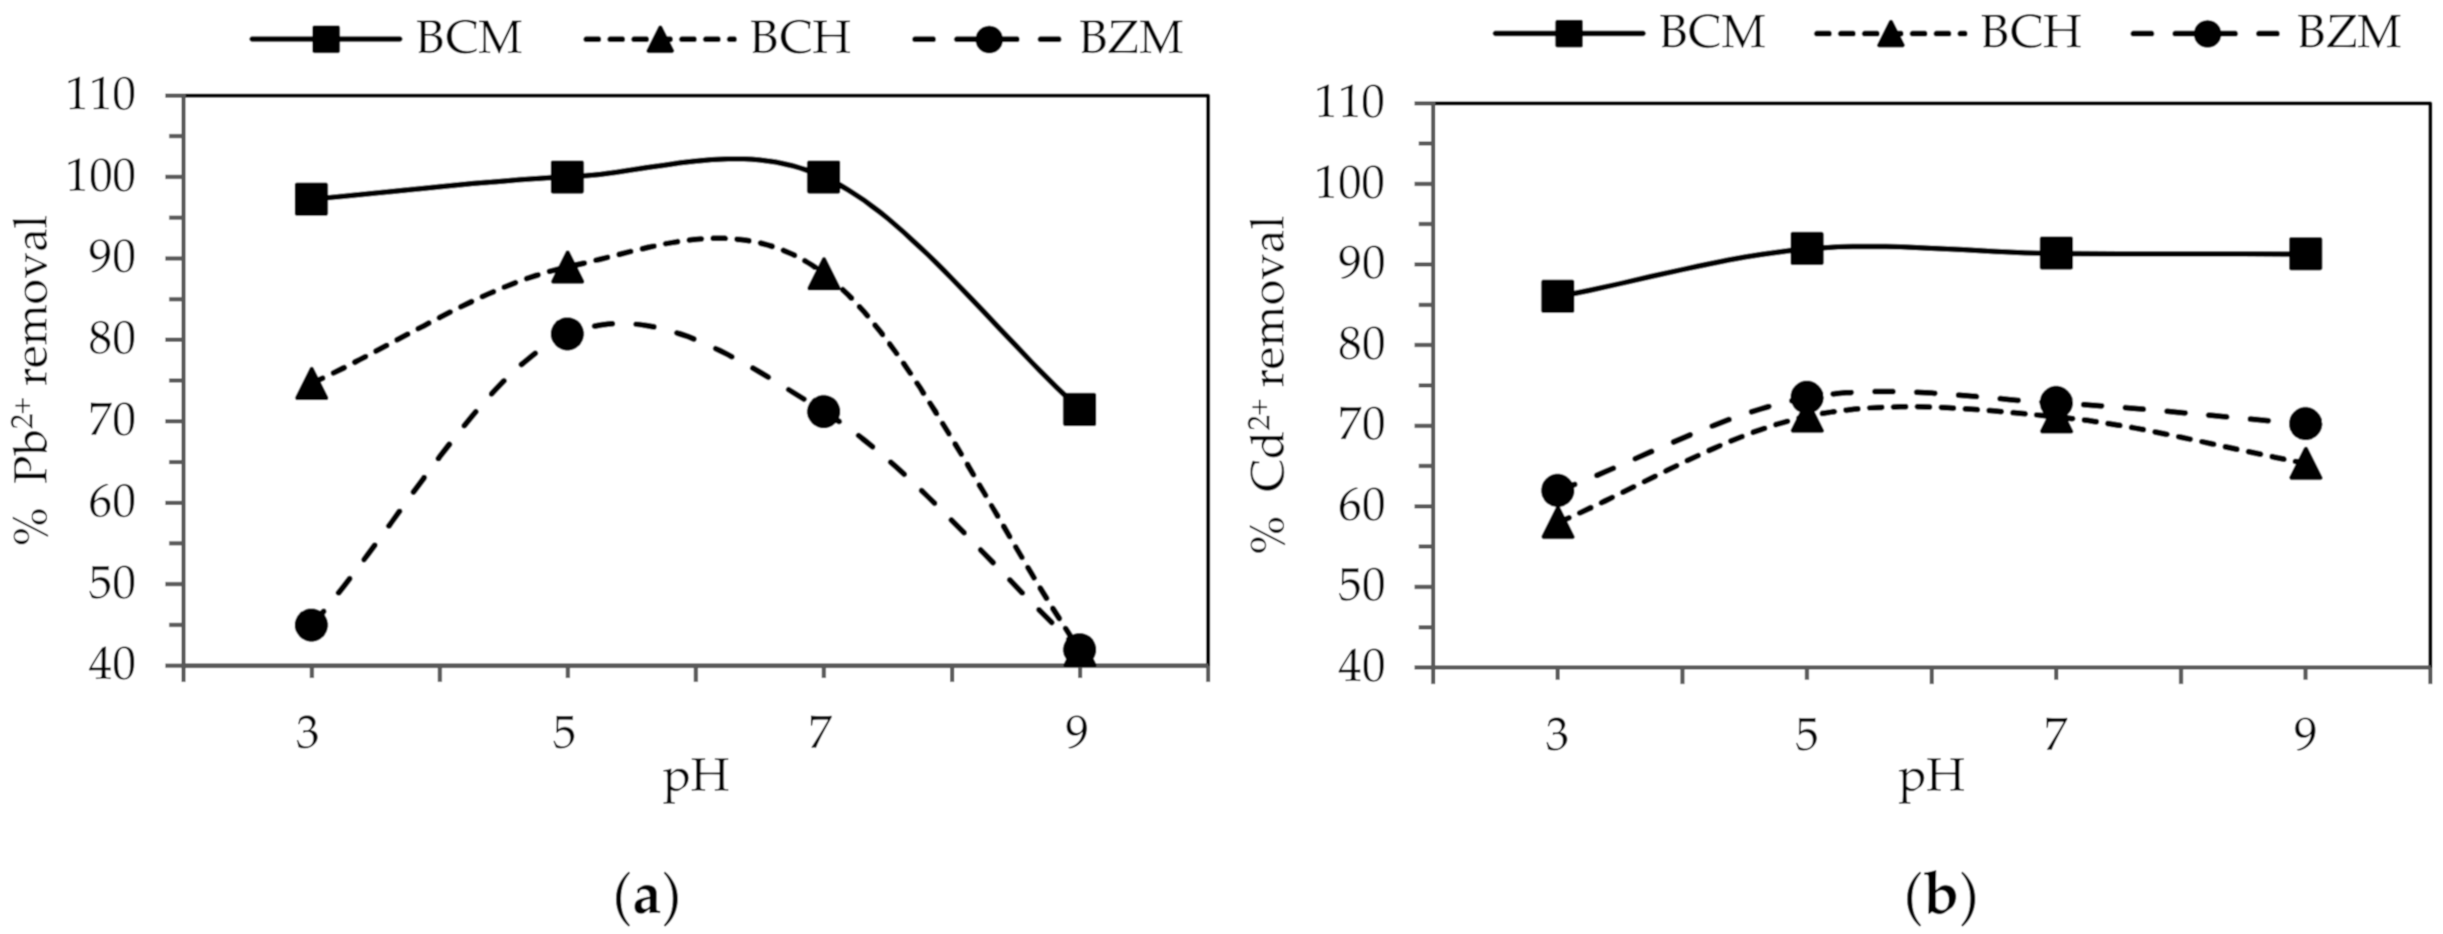
The pH is determinant for the adsorption of heavy metals for biochar, since it shows that the adsorption occurs through electrostatic attraction. In Figure 3 is represented the adsorption as a function of pH for the three biochars. The Pb2+ adsorption increases with the increase of pH from 3 to 5. However, when pH increase from 7 to 9 the Pb2+ adsorption decrease. The Cd2+ removal percentage is the same for the pH range evaluated. The optimal pH for the removal of Pb2+ and Cd2+ is performed the best at pH 5.
The adsorption decrease below pH 5 because an excess of hydrogen ions is generated, producing a competition with the positively charged metal ions towards the same places on the adsorbent surface [37]. Removal also decreases when pH is higher than 7, the pH increase promotes the formation of anionic hydroxide complexes that decrease the concentrations of free Pb2+ ions [62]. The occurrence of the hydrolysis reactions is represented by Equations (10)–(12):
Kumar et al. [61] and Coelho et al. [63] determine pH 5 is the best for lead and cadmium removal using activated carbon obtained from cashew nuts in India and Brazil, respectively. The behavior of the biochar evaluated in this study represents an excellent possibility for drinking water treatment with typical pH values between 6.5 and 7.5.
3.5. Effect of Adsorbent Dose
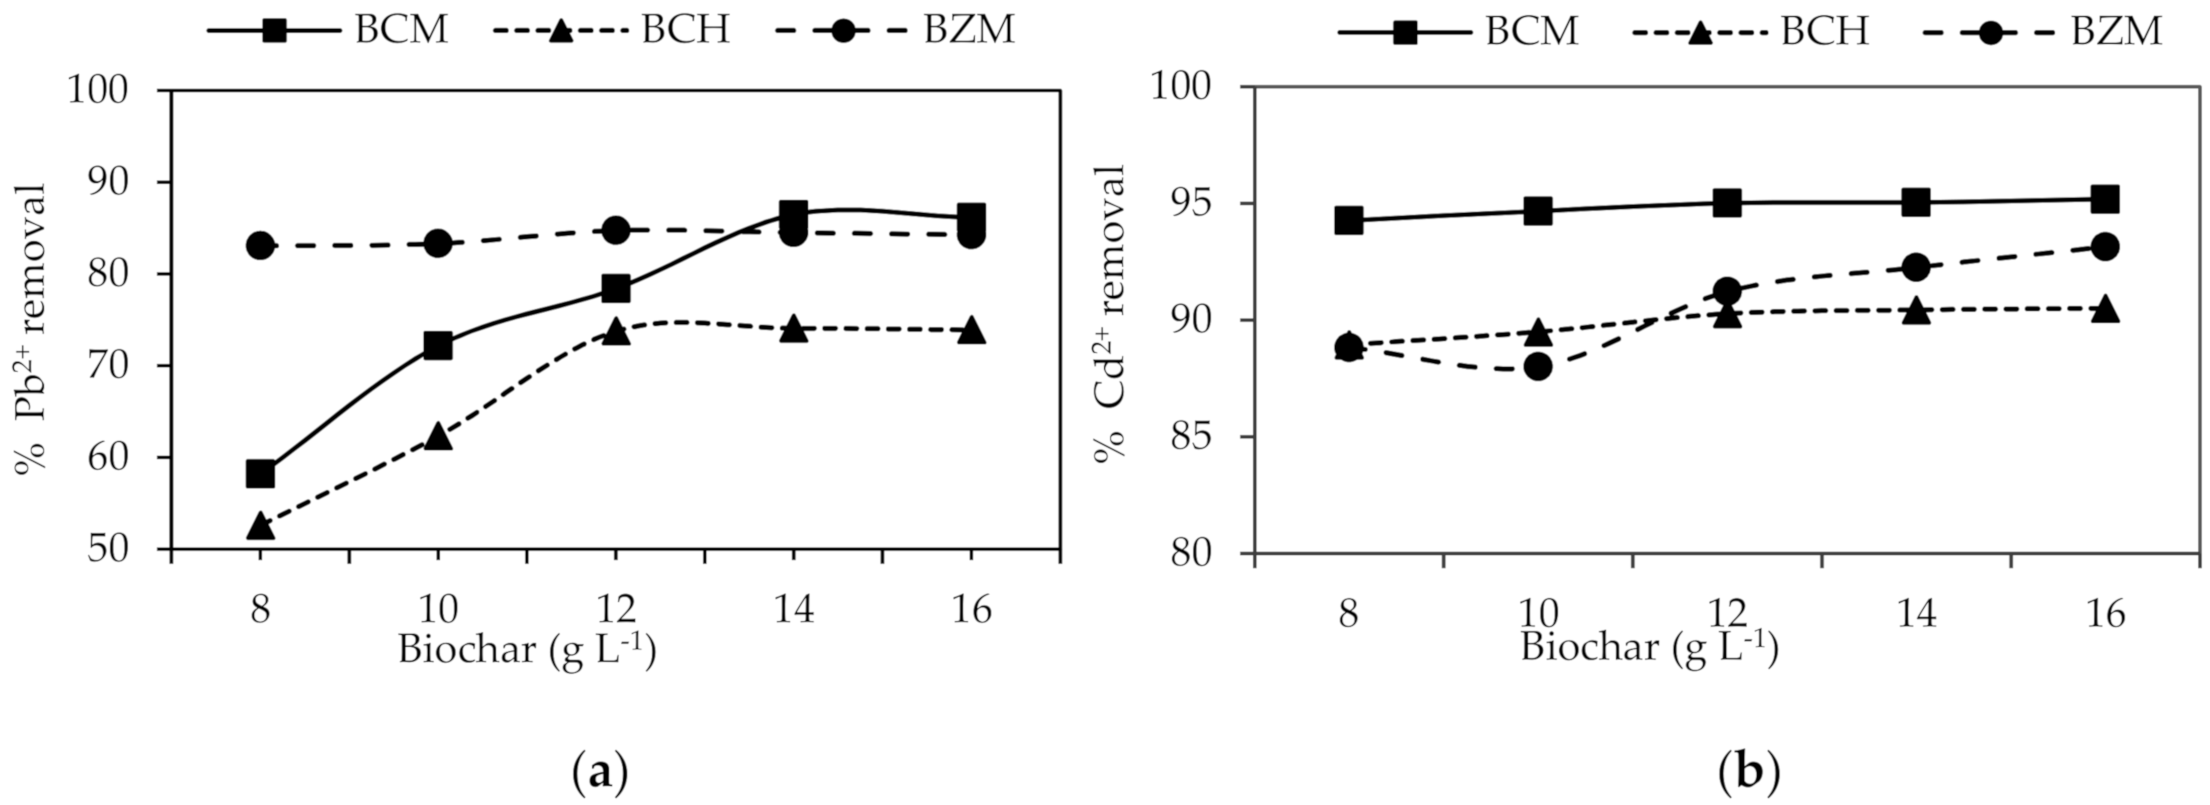
The BCM using 14 g L−1 allowed 86% of Pb2+ removal, but BCH and BZM with 12 g L−1 removes a maximum of 74% and 85%, respectively (Figure 4). There are no differences between the BCM doses used for Cd2+ removal. The BCH and BZM using 14g L−1 obtained over 90% of Cd2+ removal. The percentage of removal increases with mass biochar increase. The greater the biochar mass the more available spaces for adsorption. However, when the equilibrium is reached, no matter how much biochar is used, the removal percentage does not increase. The aggregation or partial agglomeration of the adsorbent particles in higher concentration promotes this behavior [6,64,65].
3.6. Adsorption Kinetics
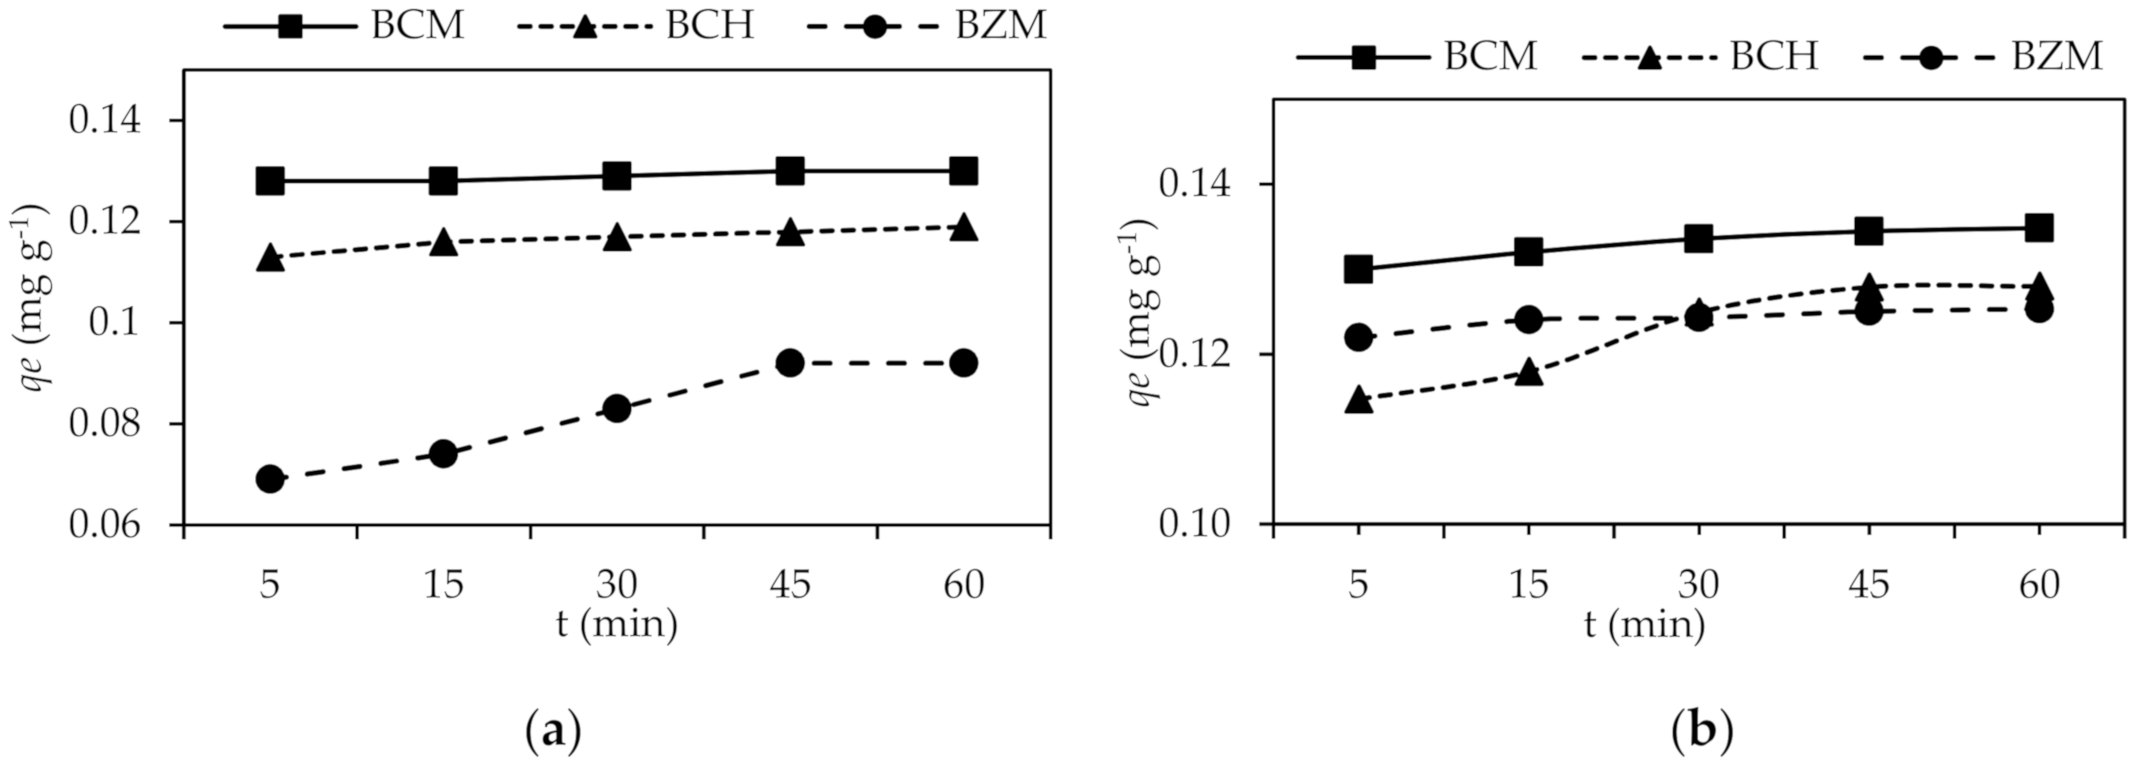
The equilibrium sorption for Pb2+ and Cd2+ on the biochar was reached within 45 min at which was obtained the highest removal value (Figure 5).
BCM developed the higher adsorption rate 0.0029 mg−1 g min−1 which developed the highest Pb2+ removal. The removal percentage of biochar: 95.96% for BCM, the 87.37% for BCH and 67.77% for BZM (Table 3). The adsorption capacity depends on the specific surface because the BCM (1224 m2 g−1) is higher than BZM and BCH. The BCM has a great surface to retain Pb2+ and Cd2+ from water.
The kinetic parameters of biochar evaluated in this study are summary in Table 4. So, the adsorption mechanism of Pb2+ and Cd2+ removal on biochar can be determined [65].
Taking into account the R2 value near to 1 the experimental sorption data are best fitted to the pseudo-second order kinetic model. So, Pb2+ and Cd2+ removal on biochar is performed by chemisorption. Furthermore, Pb2+ and Cd2+ removal by biochar is governed by physisorption due to the electrostatic attraction previously discussed as an effect of pH [66].
Chemical sorption reactions occur through chemical bonds at specific functional groups which are irreversible. Previous studies attributed the Pb2+ and Cd2+ removal is performed by ion exchange reactions. The three biochar of this study contain some exchangeable metals on the surface such as: Na+, K+, Ca2+ and Mg2+ that allow the exchange. The adsorption of lead and cadmium by ion exchange reaction with those exchangeable ions can be described by Equation (13).
B-Na+/K+/Ca2+/Mg2+ + Pb2+/Cd2+ → B-Pb2+/Cd2+ + Na+/K+/Ca2+/Mg2+
Furthermore, some complexation reactions occurred between Pb2+ and Cd2+ and the functional groups existing on the surfaces of coals. Biochar contains some organic groups containing oxygen that promote the Pb2+ and Cd2+ sorption on the biochar [67]. B-COOH and B-OH (B: biochar) represents the functional surface groups of BCM, BCH and BZM. The Pb2+ and Cd2+ adsorption is expected to occur by complexation reactions described in Equations (14) and (15) [29].
Furthermore, it has been found in previous reports that some precipitation reactions may occur due to the components of biochar [28,68]. However, in this study we do not have evidence of this fact. The low Pb2+ and Cd2+ concentrations used for the study make it improbable to detect them by SEM-EDX characterization.
3.7. Adsorption Isotherms
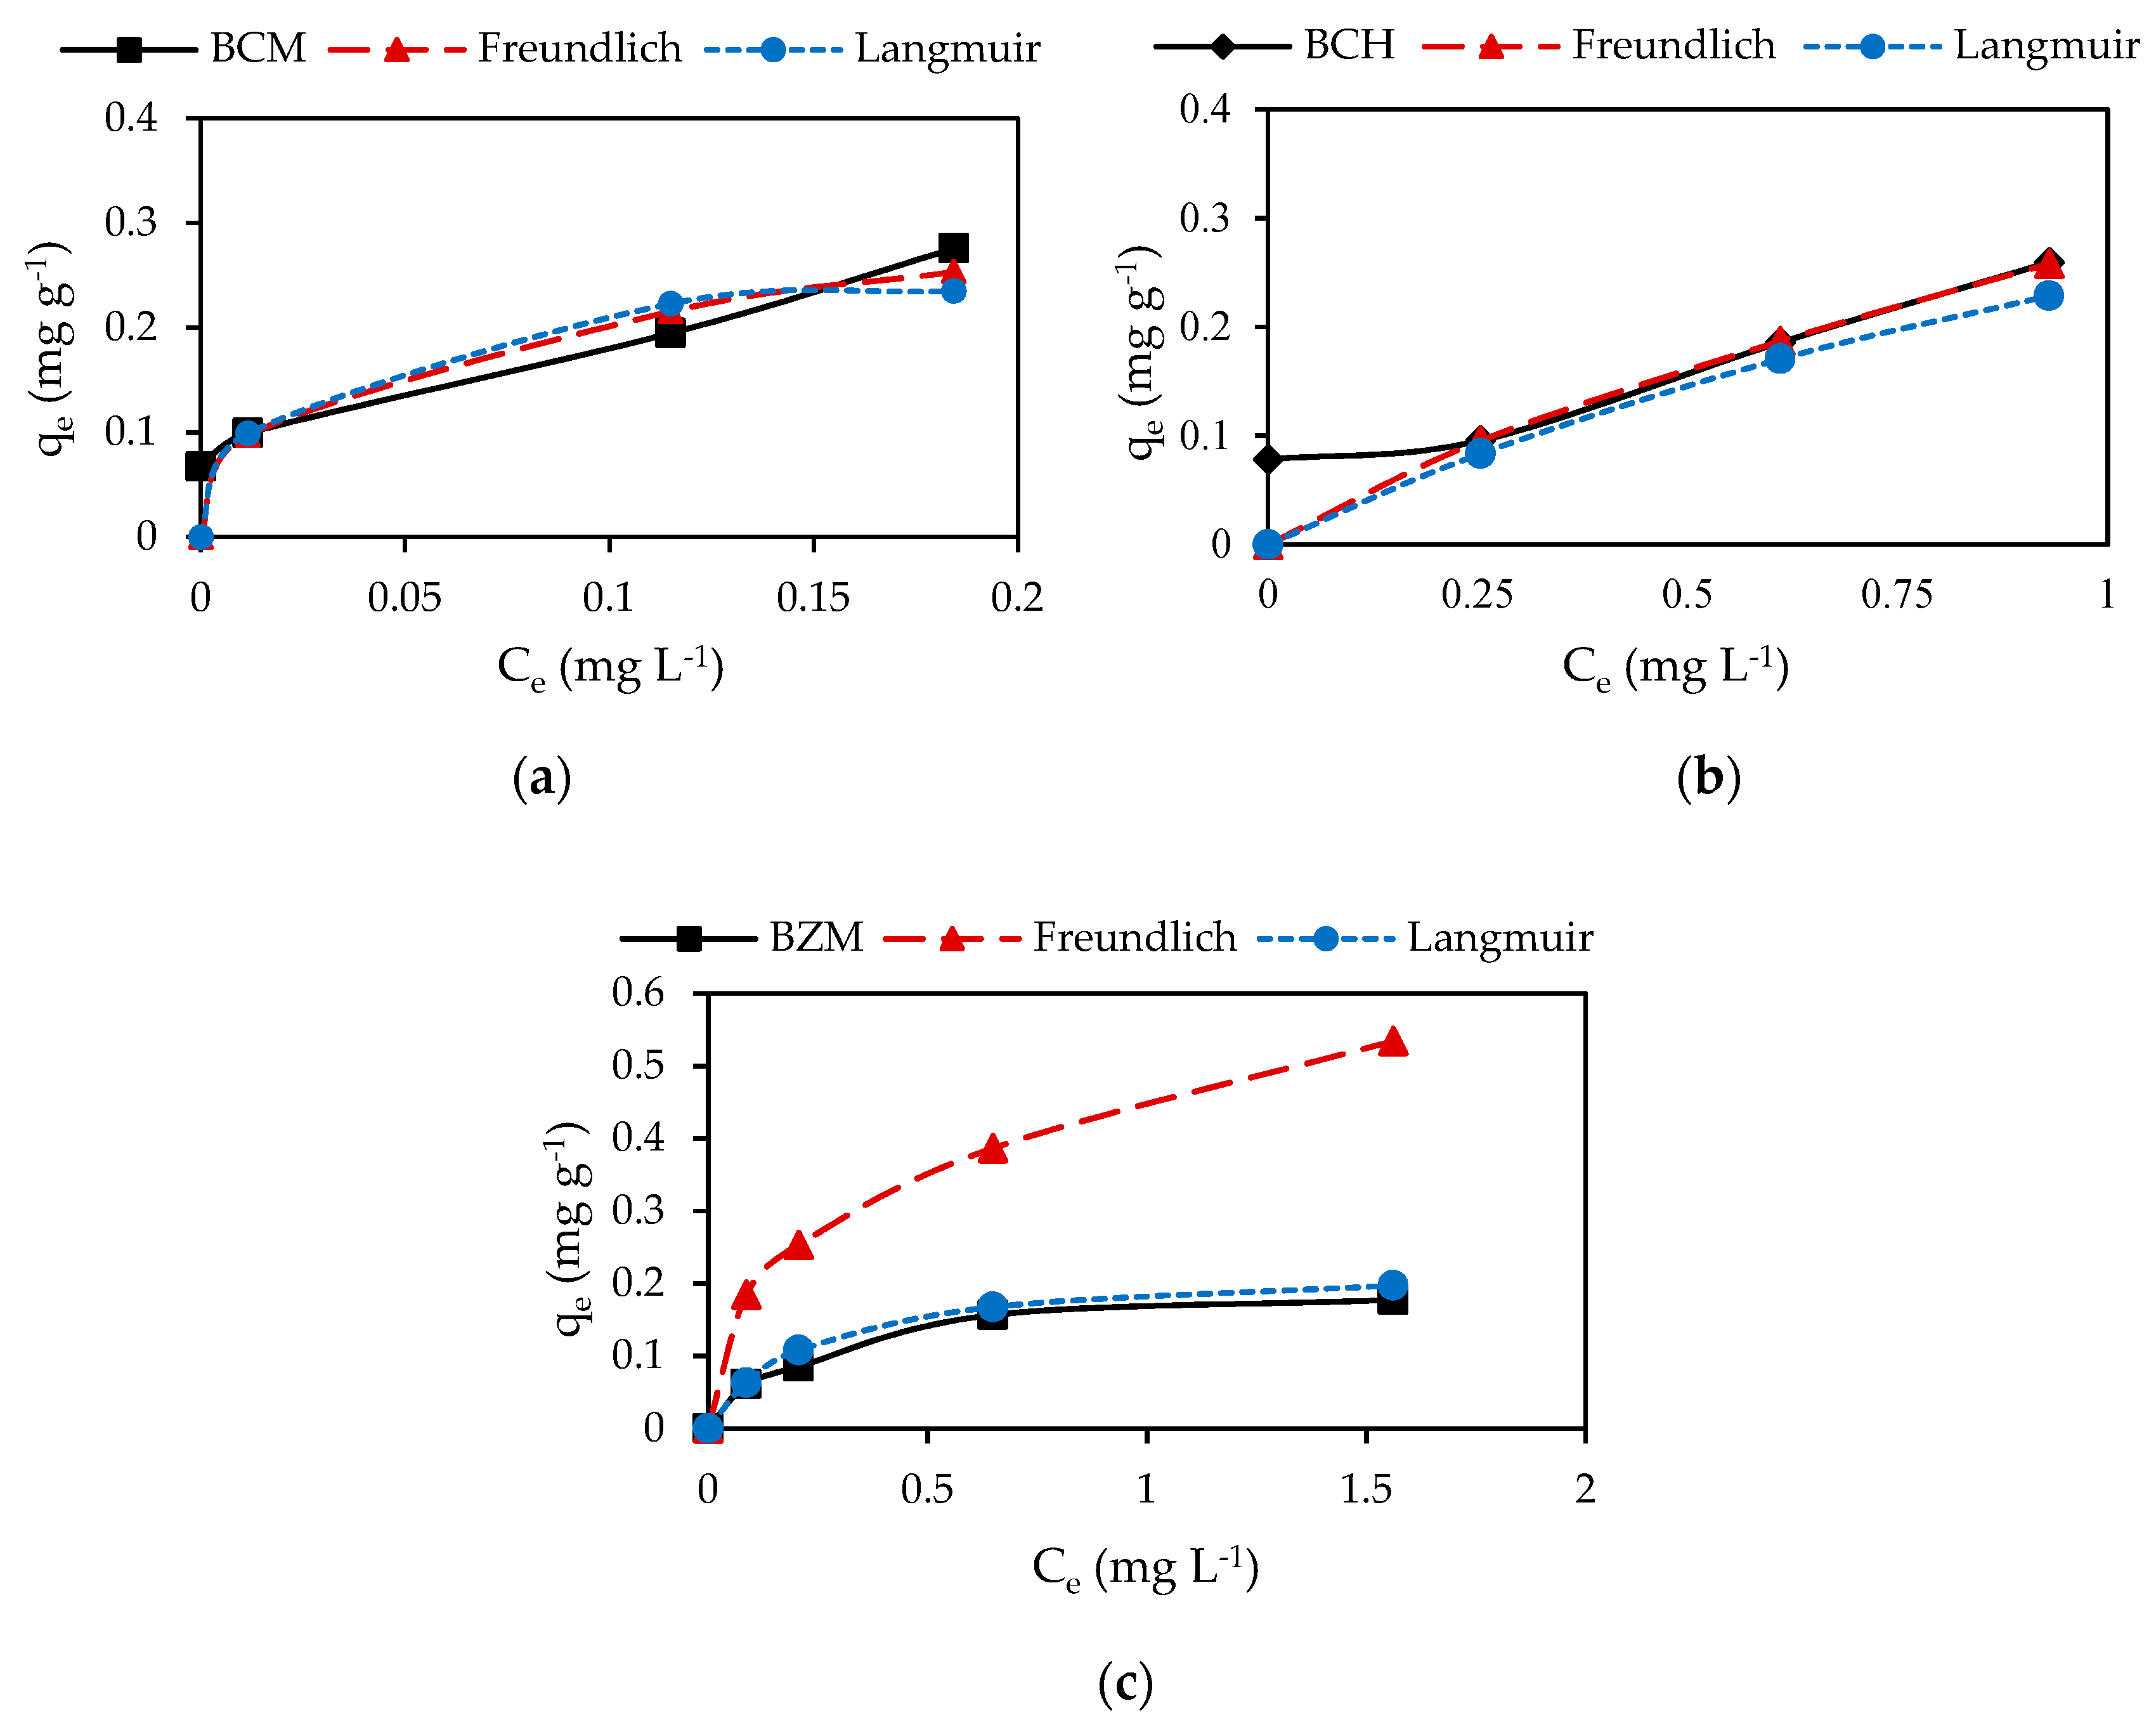
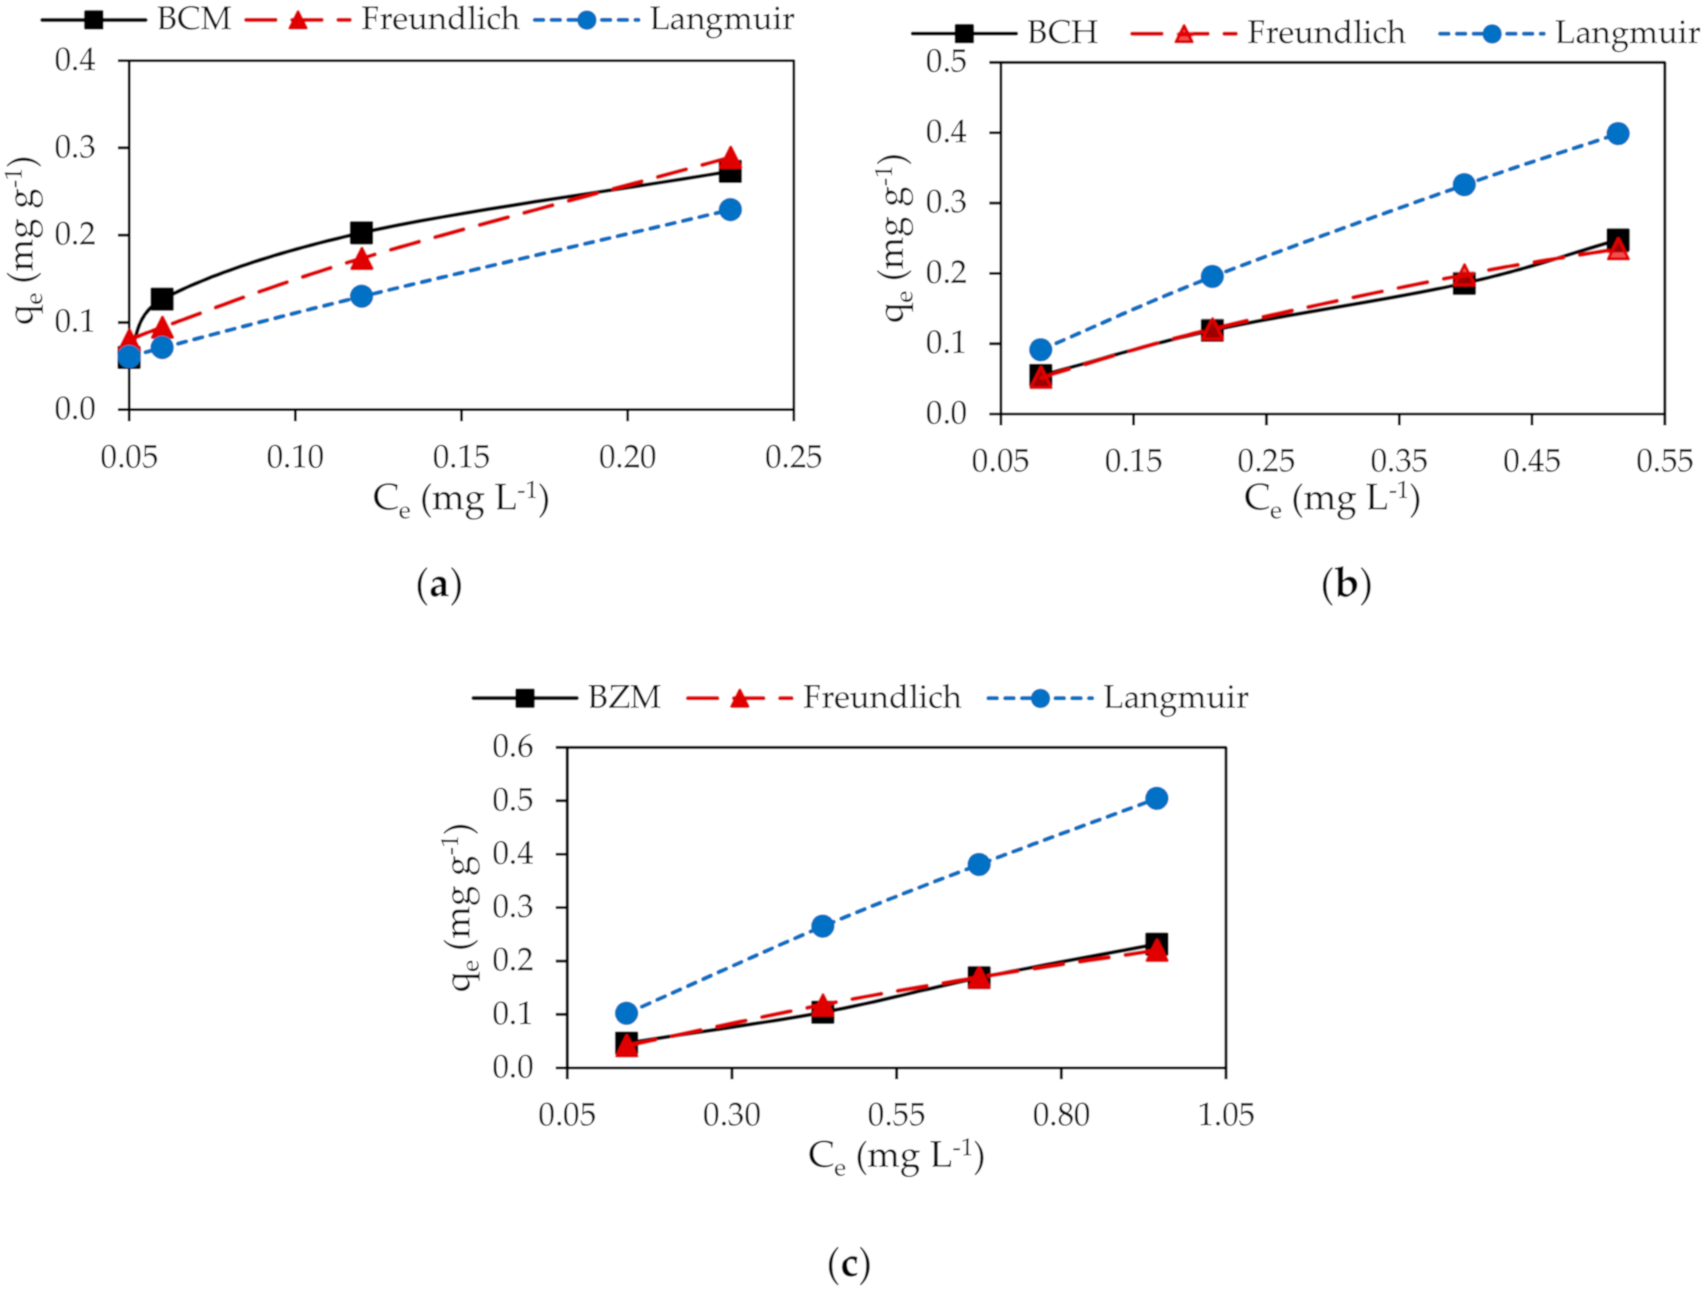
The Pb2+ and Cd2+ removal by biochar increase with the increase of initial metal concentration. Taking into account the R2, the experimental sorption data of both Pb2+ and Cd2+ on biochar are best fitted to Freundlich isotherm. The highest Pb2+ and Cd2+ sorption on biochar is obtained by BCM (Table 5).
Accordingly, to Freundlich isotherm model the adsorption is performed by physical mechanisms (Figure 6 and Figure 7). Physical adsorption denotes the existence of an energetically heterogeneous surface. The occurrence of Van der Waals forces and the metal adhesion to the porosity is determinant for adsorption. The Langmuir isotherm establishes chemisorption as the basis mechanism. Chemisorption takes place in a homogeneous layer, indicating finite sites on the adsorbent’s surface specific for the adsorbate [13,28]. As it was reported before, Pb2+ and Cd2+ adsorption on the biochar occurred by specific ion exchange and complexation reactions represented by Equations (13)–(15).
The results of this study suggest the simultaneous occurrence of physical and chemical adsorption for the Pb2+ and Cd2+ removal. Physisorption, is the mechanism that governed the Pb2+ and Cd2+ caption on biochar.
4. Conclusions
The yield of BCH ≈ 78.64% > CZM ≈ 61.23% > BCM ≈ 60.16%. The moisture content, the effective particle size, ash content and volatile material of biochar is in accordance with the standards for granularly activated carbon. BCM has the higher Pb2+ and Cd2+ adsorption capacity. The physicochemical characteristics of BCM are responsible for the high adsorption behavior. BCM has the highest specific surface area of biochar: BCM ≈ 1224 m2 g−1 > BZM ≈ 778 m2 g−1 > BCH ≈ 652 m2 g−1. The Pb2+ adsorption capacities of biochar were: BCM ≈ 2.528 mg g−1 > BCH ≈ 0.532 mg g−1 > BZM ≈ 0.453 mg g−1. The Cd2+ adsorption capacities of biochar were: BCM ≈ 0.314 mg g−1 > BZM ≈ 0.155 mg g−1 > BCH ≈ 0.049 mg g−1. The experimental data were best fitted to the Freundlich isotherm model and the pseudo-second order kinetic model. The adsorption is denoted by physical mechanisms: Van der Waals forces and the biochar porosity. The adsorption on biochar is also promoted by means of chemical reactions, complexation and ion exchange.
The biochar evaluated has great potential to be used in the treatment of water, allowing Pb2+ and Cd2+ removal from drinking water. The low cost and availability of the raw material makes it an interesting proposal for water treatment. Furthermore, adsorption is a low-cost and easy-to-implement technology in treatment systems for drinking water. Although the energy requirement to obtain the biochar is important, the social benefit is also very relevant for developing countries, because with this application we are able to avoid serious diseases in children and adults, which is of evident public health interest. Furthermore, on the other hand, a sustainable use of waste is achieved, that otherwise would have to be managed, incurring significant costs.
Author Contributions
E.P.P.: Investigation, Writing—Original Draft; Writing—Review & Editing; Visualization, Project administration, Funding acquisition/D.G.: Methodology, Validation, Writing—Original Draft; Data Curation; Formal analysis; Writing—Review & Editin /C.T.: Investigation, Writing—Original Draft; Data Curation/F.O.: Conceptualization, Writing—Review & Editing, Supervision, Visualization/M.J.G.-R.: Conceptualization, Writing—Review & Editing, Supervision, Visualization. All authors have read and agreed to the published version of the manuscript.
Funding
This research was financially supported by Universidad Técnica Particular de Loja – Ecuador.
Conflicts of Interest
The authors declare no conflict of interest.
References
- Kouassi, N.L.B.; Yao, K.M.; Trokourey, A.; Soro, M.B. Distribution, Sources, and Possible Adverse Biological Effects of Trace Metals in Surface Sediments of a Tropical Estuary. Environ. Forens. 2015, 16, 96–108. [Google Scholar] [CrossRef]
- Chakraborty, S.; Chakraborty, P.; Nath, B.N. Lead distribution in coastal and estuarine sediments around India. Mar. Pollut. Bull. 2015, 97, 36–46. [Google Scholar] [CrossRef] [PubMed]
- Fonseca, A.R.; Fernandes, L.F.S.; Fontaínhas-Fernandes, A.; Monteiro, S.M.; Pacheco, F.A.L. The impact of freshwater metal concentrations on the severity of histopathological changes in fish gills: A statistical perspective. Sci. Total Environ. 2017, 599, 217–226. [Google Scholar] [CrossRef] [PubMed]
- Taiwo, A.M.; Awomeso, J.A. Assessment of trace metal concentration and health risk of artisanal gold mining activities in Ijeshaland, Osun State Nigeria—Part 1. J. Geochem. Explor. 2017, 177, 1–10. [Google Scholar] [CrossRef]
- Li, N.; Kang, Y.; Pan, W.; Zeng, L.; Zhang, Q.; Luo, J. Concentration and transportation of heavy metals in vegetables and risk assessment of human exposure to bioaccessible heavy metals in soil near a waste-incinerator site, South China. Sci. Total Environ. 2015, 144–151. [Google Scholar] [CrossRef] [PubMed]
- Zhang, H.; Tang, Y.; Cai, D.; Liu, X.; Wang, X.; Huang, Q.; Yu, Z. Hexavalent chromium removal from aqueous solution by algal bloom residue derived activated carbon: Equilibrium and kinetic studies. J. Hazard. Mater. 2010, 181, 801–808. [Google Scholar] [CrossRef]
- Instituto Nacional de Estadística e Informática (INEI). Estadísticas Ambientales Resultados, Info. Téc 2009. Available online: https://sinia.minam.gob.pe/documentos/informe-tecnico-estadisticas-ambientales-marzo-2009 (accessed on 2 August 2020).
- Castillo, M.F.; Salas, E.H.; Alcantara, R.B. Estadísticas Ambientales. Estadístic. Ambient. Info. Téc. 2018, 5, 49. [Google Scholar]
- Oviedo, A.R.; Moína-Quimí, E.; Naranjo-Morán, J.; Barcos-Arias, M. Contaminación por metales pesados en el sur del Ecuador asociada a la actividad minera. Bionatura 2017, 2, 437–441. [Google Scholar] [CrossRef]
- Malamis, S.; Katsou, E.; Haralambous, K.J. Study of Ni(II), Cu(II), Pb(II), and Zn(II) Removal Using Sludge and Minerals Followed by MF/UF. Water Air Soil Pollut. 2010, 218, 81–92. [Google Scholar] [CrossRef]
- Carolin, C.F.; Kumar, P.S.; Saravanan, A.; Joshiba, G.J.; Naushad, M. Efficient techniques for the removal of toxic heavy metals from aquatic environment: A review. J. Environ. Chem. Eng. 2017, 5, 2782–2799. [Google Scholar] [CrossRef]
- Ko, D.; Lee, J.S.; Patel, H.A.; Jakobsen, M.H.; Hwang, Y.; Yavuz, C.T.; Hansen, H.C.B.; Andersen, H.R. Selective removal of heavy metal ions by disulfide linked polymer networks. J. Hazard. Mater. 2017, 332, 140–148. [Google Scholar] [CrossRef] [Green Version]
- Liu, C.; Lei, X.; Wang, L.; Jia, J.; Liang, X.; Zhao, X.; Zhu, H. Investigation on the removal performances of heavy metal ions with the layer-by-layer assembled forward osmosis membranes. Chem. Eng. J. 2017, 327, 60–70. [Google Scholar] [CrossRef]
- Visa, M. Synthesis and characterization of new zeolite materials obtained from fly ash for heavy metals removal in advanced wastewater treatment. Powder Technol. 2016, 294, 338–347. [Google Scholar] [CrossRef]
- Bilal, M.; Rasheed, T.; Sosa-Hernández, J.E.; Raza, A.; Nabeel, F.; Iqbal, H.M. Biosorption: An Interplay between Marine Algae and Potentially Toxic Elements—A Review. Mar. Drugs 2018, 16, 65. [Google Scholar] [CrossRef] [PubMed] [Green Version]
- Inyang, M.; Gao, B.; Yao, Y.; Xue, Y.; Zimmerman, A.R.; Pullammanappallil, P.; Cao, X. Removal of heavy metals from aqueous solution by biochars derived from anaerobically digested biomass. Bioresour. Technol. 2012, 110, 50–56. [Google Scholar] [CrossRef]
- Sigdel, A.; Jung, W.; Min, B.; Lee, M.; Choi, U.; Timmes, T.; Kim, S.-J.; Kang, C.-U.; Kumar, R.; Jeon, B.-H. Concurrent removal of cadmium and benzene from aqueous solution by powdered activated carbon impregnated alginate beads. Catena 2017, 148, 101–107. [Google Scholar] [CrossRef]
- Chen, L.; Wu, P.; Chen, M.; Lai, X.; Ahmed, Z.; Zhu, N.; Dang, Z.; Bi, Y.; Liu, T. Preparation and characterization of the eco-friendly chitosan/vermiculite biocomposite with excellent removal capacity for cadmium and lead. Appl. Clay Sci. 2018, 159, 74–82. [Google Scholar] [CrossRef]
- Elhafez, S.A.; Hamad, H.A.; Zaatout, A.A.; Malash, G.F. Management of agricultural waste for removal of heavy metals from aqueous solution: Adsorption behaviors, adsorption mechanisms, environmental protection, and techno-economic analysis. Environ. Sci. Pollut. Res. 2016, 24, 1397–1415. [Google Scholar] [CrossRef]
- Bouhamed, F.; Elouear, Z.; Jalel, B.; Ouddane, B. Multi-component adsorption of copper, nickel and zinc from aqueous solutions onto activated carbon prepared from date stones. Environ. Sci. Pollut. Res. 2015, 23, 15801–15806. [Google Scholar] [CrossRef]
- Lehmann, J. A handful of carbon. Nature 2007, 447, 10–11. [Google Scholar] [CrossRef]
- Yuan, J.-H.; Xu, R.-K.; Zhang, H. The forms of alkalis in the biochar produced from crop residues at different temperatures. Bioresour. Technol. 2011, 102, 3488–3497. [Google Scholar] [CrossRef]
- Lafdani, E.K.; Saarela, T.; Laurén, A.; Pumpanen, J.; Palviainen, M. Purification of Forest Clear-Cut Runoff Water Using Biochar: A Meso-Scale Laboratory Column Experiment. Water 2020, 12, 478. [Google Scholar] [CrossRef] [Green Version]
- Valencia, R.; Montúfar, R.; Navarrete, H.; Balslev, H. Palmas Ecuatorianas: Biología y so sostenible. In Ecuadorian Palms: Biology and Sustainable Use, 1st ed.; Herbario QCA de la Pontificia Universidad Católica del Ecuador: Quito, Ecuador, 2013. [Google Scholar]
- Smith, N. Palms and People in the Amazon. In Geobotany Studies; Springer: Berlin, Germany, 2015. [Google Scholar]
- Zapata, N.; Henriquez, L.; Finot, V.L. Caracterización y clasificación botánica de veintidos líneas de maní (Arachis hypogaea L.) Evaluadas en la Provincia de Nuble, Chile. Chil. J. Agric. Anim. Sci. 2017, 33, 202–212. [Google Scholar] [CrossRef] [Green Version]
- Montoya, E.; Maria, F. Estudio Sobre la Comercialización de Maíz Duro en la Sierra—Centro Norte del Ecuador. Bachelor’s Thesis, Universidad Politécnica Salesiana—Quito, Cuenca, Ecuador, 2010. [Google Scholar]
- Lee, M.-E.; Park, J.H.; Chung, J.W. Comparison of the lead and copper adsorption capacities of plant source materials and their biochars. J. Environ. Manag. 2019, 236, 118–124. [Google Scholar] [CrossRef] [PubMed]
- Vo, A.T.; Nguyen, V.P.; Ouakouak, A.; Nieva, A.; Doma, J.B.T.; Tran, H.N.; Chao, H.-P. Efficient Removal of Cr(VI) from Water by Biochar and Activated Carbon Prepared through Hydrothermal Carbonization and Pyrolysis: Adsorption-Coupled Reduction Mechanism. Water 2019, 11, 1164. [Google Scholar] [CrossRef] [Green Version]
- Khiari, B.; Ghouma, I.; Ibn Ferjani, A.; Azzaz, A.A.; Jellali, S.; Limousy, L.; Jeguirim, M. Kenaf stems: Thermal characterization and conversion for biofuel and biochar production. Fuel 2020, 262, 116654. [Google Scholar] [CrossRef]
- Lee, M.-E.; Park, J.H.; Chung, J.W. Adsorption of Pb(II) and Cu(II) by Ginkgo-Leaf-Derived Biochar Produced under Various Carbonization Temperatures and Times. Int. J. Environ. Res. Public Health 2017, 14, 1528. [Google Scholar] [CrossRef] [PubMed] [Green Version]
- Liu, L.; Huang, Y.; Zhang, S.; Gong, Y.; Su, Y.; Cao, J.; Hu, H. Adsorption characteristics and mechanism of Pb(II) by agricultural waste-derived biochars produced from a pilot-scale pyrolysis system. Waste Manag. 2019, 100, 287–295. [Google Scholar] [CrossRef]
- Colpas, F.; Taron-Dunoyer, A.A. Área superficial de carbones activados y modificados obtenidos del recurso agrícola Saccharum officinarum. Rev. Ciencias Agric. 2017, 34, 62–72. [Google Scholar] [CrossRef] [Green Version]
- Park, J.; Lee, Y.; Ryu, C.; Park, Y.-K. Slow pyrolysis of rice straw: Analysis of products properties, carbon and energy yields. Bioresour. Technol. 2014, 155, 63–70. [Google Scholar] [CrossRef] [PubMed]
- Wendlandt, W.; Dosch, E. The deltatherm V differential thermal analysis and thermogravimetry system. Thermochim. Acta 1987, 117, 45–50. [Google Scholar] [CrossRef]
- Schlegel, M.; Ibrahim, B.; Laurel, O.; Kipping, R.; Fras, J.; Kanswohl, N.; Zosel, J. Hydrothermal Carbonization Process to Improve Transportability of Plant Biomass. Agroproductividad 2018, 11, 3–9. [Google Scholar]
- N’Goran, K.P.D.A.; Diabaté, D.; Yao, K.M.; Kouassi, N.L.B.; Gnonsoro, U.P.; Kinimo, K.C.; Trokourey, A. Lead and cadmium removal from natural freshwater using mixed activated carbons from cashew and shea nut shells. Arab. J. Geosci. 2018, 11, 498. [Google Scholar] [CrossRef]
- Rwiza, M.J.; Oh, S.-Y.; Kim, K.-W.; Kim, S.D. Comparative sorption isotherms and removal studies for Pb(II) by physical and thermochemical modification of low-cost agro-wastes from Tanzania. Chemosphere 2018, 195, 135–145. [Google Scholar] [CrossRef] [PubMed]
- Colpas, F.; Tarón, A.; Fong, W. Analisis del desarrollo textural de carbones activados preparados a partir de zuro de maíz. Temas Agrar. 2016, 20, 103–112. [Google Scholar] [CrossRef] [Green Version]
- Filippín, A.J.; Luna, N.S.; Pozzi, M.T.; Pérez, J.D. Obtención y Caracterización De Carbón Activado a Partir De Residuos Olivícolas Y Oleícolas Por Activacion Física Obtaining and Characterizing of Carbon Activated from Olivic and Olive-Residues By Physical Activation. Avan. Cie. Ingeni. 2017, 8, 59–71. [Google Scholar]
- ASTM D2867-09. Standard Test Methods for Moisture in Activated Carbon; ASTM: West Conshohocken, PA, USA, 2014. [Google Scholar] [CrossRef]
- ASTM D2866-11. Standard Test Method for Total Ash Content of Activated Carbon; ASTM: West Conshohocken, PA, USA, 2018. [Google Scholar] [CrossRef]
- Hernández, M.; Otero-Calvis, A.; Falcón-Hernandez, J.; Yperman, Y. Características Fisicoquímicas Del Carbón Activado de Conchas de Coco Modificado Con HNO3. Rev. Cubana Quím. 2017, 29, 26–38. [Google Scholar]
- Ravulapalli, S.; Kunta, R. Removal of lead (II) from wastewater using active carbon of Caryota urens seeds and its embedded calcium alginate beads as adsorbents. J. Environ. Chem. Eng. 2018, 6, 4298–4309. [Google Scholar] [CrossRef]
- Sadeek, S.A.; Negm, N.A.; Hefni, H.H.; Wahab, M.M.A. Metal adsorption by agricultural biosorbents: Adsorption isotherm, kinetic and biosorbents chemical structures. Int. J. Biol. Macromol. 2015, 81, 400–409. [Google Scholar] [CrossRef]
- Langmuir, I. The constitution and fundamental properties of solids and liquids. Part II—Liquids. J. Frankl. Inst. 1917, 184, 721. [Google Scholar] [CrossRef]
- Freundlich, H. Über die Adsorption in Lösungen. Zeitschrift Physikal. Chem. 1907, 57, 385–470. [Google Scholar] [CrossRef]
- Lagergren, S. About the Theory of So-Called Adsorption of Soluble Substances. Kungliga Svenska Vetenskapsakademiens Handlingar. 1898, 24, 1–39. [Google Scholar]
- Ho, Y.S.; McKay, G. Pseudo-Second Order Model for Sorption Processes. Org. Process. Res. Dev. 1998, 21, 866–870. [Google Scholar] [CrossRef] [Green Version]
- Pinzón, M.; Vera, L. Modelamiento de la cinética de bioadsorción de Cr (III) usando cáscara de naranja kinetc modeling biosorption of Cr(III) using orange shell. Dyna 2009, 76, 95–106. [Google Scholar]
- Castellar-Ortega, G.; Mendoza-Colina, E.D.J.; Mercado, E.R.A.; Colpas, J.E.J.; Pereira, Z.A.P.; Bravo, M.C.R. Equilibrio, cinética y termodinámica de la adsorción del colorante DB-86 sobre carbón activado de la cáscara de yuca. Revista MVZ Córdoba 2019, 24, 7231–7238. [Google Scholar] [CrossRef] [Green Version]
- American Water Works Association. AWWA B604-90 Granular Activated Carbon; AWWA: Denver, CO, USA, 2019. [Google Scholar] [CrossRef]
- Organización de las naciones unidas para la agricultura y la alimentación FAO. Capitulo 10. Uso Eficiente Del Carbón Vegetal. In Métodos Simples Para Fabricar Carbón Vegetal; FAO: Rome, Italy, 1999; Available online: http://www.fao.org/3/X5328S/X5328S05.htm (accessed on 2 May 2020).
- Hernández, F.; Cristina, A.; Tort, S.; Recio, R. Valoración De La Calidad Del Carbón Vegetal De Las Zonas De La Efi Empresa Forestal Gran Piedra- Baconao. Rev. Cubana Quím. 2006, XVIII, 30–38. [Google Scholar]
- Cortés, V. Carbón. 2000. Available online: https://docplayer.es/9596492-Carbon-prof-dr-vicente-j-cortes.html (accessed on 2 May 2020).
- Goswami, M.; Phukan, P. Enhanced adsorption of cationic dyes using sulfonic acid modified activated carbon. J. Environ. Chem. Eng. 2017, 5, 3508–3517. [Google Scholar] [CrossRef]
- Aboua, K.N.; Yobouet, Y.A.; Yao, K.B.; Goné, D.L.; Trokourey, A. Investigation of dye adsorption onto activated carbon from the shells of Macoré fruit. J. Environ. Manag. 2015, 156, 10–14. [Google Scholar] [CrossRef]
- Adebisi, G.A.; Chowdhury, Z.Z.; Alaba, P.A. Equilibrium, kinetic, and thermodynamic studies of lead ion and zinc ion adsorption from aqueous solution onto activated carbon prepared from palm oil mill effluent. J. Clean. Prod. 2017, 148, 958–968. [Google Scholar] [CrossRef]
- Song, X.; Wang, L.; Zeng, Y.; Zhan, X.; Gong, J.; Li, T. Application of activated carbon modified by acetic acid in adsorption and separation of CO2 and CH4. Advances in energy science and environment engineering II: Proceedings of 2nd International Workshop on Advances in Energy Science and Environment Engineering. AESEE 2018 2018, 1944, 020056. [Google Scholar] [CrossRef]
- Senthilkumar, P.; Ramalingam, S.; Sathyaselvabala, V.; Kirupha, S.D.; Sivanesan, S. Removal of copper(II) ions from aqueous solution by adsorption using cashew nut shell. Desalination 2011, 266, 63–71. [Google Scholar] [CrossRef]
- Kumar, P.S.; Ramalingam, S.; Sathyaselvabala, V.; Kirupha, S.D.; Murugesan, A.; Sivanesan, S. Removal of cadmium(II) from aqueous solution by agricultural waste cashew nut shell. Korean J. Chem. Eng. 2012, 29, 756–768. [Google Scholar] [CrossRef]
- Cheraghi, E.; Ameri, E.; Moheb, A. Adsorption of cadmium ions from aqueous solutions using sesame as a low-cost biosorbent: Kinetics and equilibrium studies. Int. J. Environ. Sci. Technol. 2015, 12, 2579–2592. [Google Scholar] [CrossRef]
- Ferreira-Coelho, G.; Affonso, C.G., Jr.; Tarley, C.R.T.; Casarin, J.; Nacke, H.; Francziskowski, M.A. Removal of metal ions Cd (II), Pb (II), and Cr (III) from water by the cashew nut shell Anacardium occidentale L. Ecol. Eng. 2014, 73, 514–525. [Google Scholar] [CrossRef]
- Ansari, T.M.; Hanif, M.A.; Mahmood, A.; Ijaz, U.; Khan, M.A.; Nadeem, R.; Ali, M. Immobilization of Rose Waste Biomass for Uptake of Pb(II) from Aqueous Solutions. Biotechnol. Res. Int. 2011, 2011, 685023. [Google Scholar] [CrossRef] [PubMed] [Green Version]
- Ho, Y.S.; Porter, J.F.; McKay, G. Equilibrium Isotherm Studies for the Sorption of Divalent Metal Ions onto Peat: Copper, Nickel and Lead Single Component Systems. Water Air Soil Pollut. 2002, 141, 1–33. [Google Scholar] [CrossRef]
- Albis, A.; Rangel, A.J.L.; Castilla, M.C.R. Removal of methylene blue from aqueous solutions using cassava peel (Manihot esculenta) modified with phosphoric acid//Remoción de azul de metileno de soluciones acuosas utilizando cáscara de yuca (Manihot esculenta) modificada con ácido fosfórico. Prospectiva 2017, 15, 60–73. [Google Scholar] [CrossRef] [Green Version]
- Li, J.; Zheng, L.; Wang, S.-L.; Wu, Z.; Wu, W.; Niazi, N.K.; Shaheen, S.M.; Rinklebe, J.; Bolan, N.; Ok, Y.S.; et al. Sorption mechanisms of lead on silicon-rich biochar in aqueous solution: Spectroscopic investigation. Sci. Total Environ. 2019, 672, 572–582. [Google Scholar] [CrossRef] [PubMed]
- Xu, X.; Cao, X.; Zhao, L. Comparison of rice husk- and dairy manure-derived biochars for simultaneously removing heavy metals from aqueous solutions: Role of mineral components in biochars. Chemosphere 2013, 92, 955–961. [Google Scholar] [CrossRef]
Figure 1.
Yield vs. fixed carbon of biochar: (a) peanut shell (BCM), (b) “chonta” pulp (BCH) and (c) corn cob (BZM).
Figure 1.
Yield vs. fixed carbon of biochar: (a) peanut shell (BCM), (b) “chonta” pulp (BCH) and (c) corn cob (BZM).

Figure 2.
SEM photographs and EDS spectra of adsorbents, (a) BCM ≈ 565 °C, (b) BCH ≈ 630 °C, (c) BZM ≈ 605 °C.
Figure 2.
SEM photographs and EDS spectra of adsorbents, (a) BCM ≈ 565 °C, (b) BCH ≈ 630 °C, (c) BZM ≈ 605 °C.


Figure 3.
Percentage of (a) Pb2+ and (b) Cd2+ adsorption as a function of pH.

Figure 4.
Removal percentage as a function of the biochar dose: (a) Pb2+ and (b) Cd2+.

Figure 5.
Biochar adsorption kinetics: (a) Pb2+ and (b) Cd2+.

Figure 6.
Adsorption Pb2+ isotherms: (a) BCM, (b) BCH and (c) BZM.

Figure 7.
Adsorption Cd2+ isotherms: (a) BCM, (b) BCH and (c) BZM.


Table 1.
Physicochemical characteristics of biochar.
| Parameter | Units | BCM | BCH | BZM |
|---|---|---|---|---|
| Apparent density | g cm−3 | 0.12 | 0.17 | 0.11 |
| Moisture content | % | 6.81 | 5.98 | 5.23 |
| Volatile material Mv | % | 24.49 | 34.62 | 19.99 |
| Ash content Cc | % | 5.85 | 10.48 | 4.22 |
| Fixed carbon Cf | % | 62.85 | 48.92 | 70.22 |
| Specific surface | m2 g−1 | 1224 | 652.8 | 778.3 |
| Pore size | µm | 21.11 | 30.62 | 28.44 |
| Effective size (D10) | mm | 1.45 | 2.28 | 2.11 |
| Yield Y | % | 60.16 | 78.64 | 61.23 |
Table 2.
Specific surface area of various activated carbons and biochar.
| Sorbent | Reference | |
|---|---|---|
| Ripened Tea Leaf (MTL) | 1313 | [56] |
| Macore fruit | 229.5 | [57] |
| Palm oil mill effluent | 59.19 | [58] |
| Coconut shell | 1135 | [59] |
| Cashew shell | 395.0 | [60] |
| Cashew shell | 984.0 | [61] |
| Shea shell | 768 | [37] |
| Cashew shell | 512 | [37] |
| Peanut shell (BCM) | 1224 | This study |
| “Chonta” pulp (BCH) | 652 | This study |
| Corn cob (BZM) | 778 | This study |
Table 3.
Comparison of the adsorption results obtained for the biochar.
| Element | Biochar | Co | Ce | Removal | qe | Time | Velocity |
|---|---|---|---|---|---|---|---|
| (mg L−1) | (mg L−1) | (%) | (mg g −1) | (min) | (mg g−1 min−1) | ||
| Pb2+ | BCM | 1.90 | 0.077 | 95.96 | 0.130 | 45 | 0.00289 |
| BCH | 1.90 | 0.240 | 87.37 | 0.119 | 45 | 0.00263 | |
| BZM | 1.90 | 0.612 | 67.77 | 0.092 | 45 | 0.00204 | |
| Cd2+ | BCM | 1.90 | 0.018 | 99.05 | 0.134 | 45 | 0.00299 |
| BCH | 1.90 | 0.109 | 94.25 | 0.128 | 45 | 0.00284 | |
| BZM | 1.90 | 0.150 | 92.12 | 0.125 | 45 | 0.00278 |
Table 4.
Parameters of mathematical kinetic models.
| Element | Biochar | First Order | Second Order | ||||
|---|---|---|---|---|---|---|---|
| qe (mg g−1) | K1 (h−1) | R2 | qe (mg g−1) | K2 (g mg−1 h−1) | R2 | ||
| Pb2+ | BCM | 0.019 | 6.094 | 0.658 | 0.130 | 2676.817 | 0.99995 |
| BCH | 0.031 | 6.714 | 0.827 | 0.119 | 1334.948 | 0.99996 | |
| BZM | 0.099 | 8.199 | 0.836 | 0.096 | 187.224 | 0.99252 | |
| Cd2+ | BCM | 0.028 | 6.247 | 0.754 | 0.142 | 1604.717 | 0.99998 |
| BCH | 0.077 | 8.409 | 0.909 | 0.138 | 418.102 | 0.99999 | |
| BZM | 0.025 | 3.560 | 0.753 | 0.132 | 2879.693 | 0.99999 | |
Table 5.
Fit to mathematical models of isotherms.
| Element | Biochar | Langmuir | Freundlich | ||||
|---|---|---|---|---|---|---|---|
| qMAX (mg g−1) | KL (L mg−1) | R2 | KF (L mg−1) | n | R2 | ||
| Pb2+ | BCM | 0.271 | 11.58 | 0.940 | 2.528 | 0.34 | 0.967 |
| BCH | 0.245 | 4.34 | 0.763 | 0.532 | 0.76 | 0.999 | |
| BZM | 0.205 | 4.27 | 0.996 | 0.453 | 0.37 | 0.920 | |
| Cd2+ | BCM | 1.038 | 1.67 | 0.189 | 0.816 | 0.86 | 0.839 |
| BCH | 0.655 | 1.08 | 0.881 | 0.675 | 0.79 | 0.997 | |
| BZM | 0.857 | 0.37 | 0.534 | 0.0.528 | 0.84 | 0.989 | |
Publisher’s Note: MDPI stays neutral with regard to jurisdictional claims in published maps and institutional affiliations. |
© 2020 by the authors. Licensee MDPI, Basel, Switzerland. This article is an open access article distributed under the terms and conditions of the Creative Commons Attribution (CC BY) license (http://creativecommons.org/licenses/by/4.0/).
Share and Cite
MDPI and ACS Style
Puglla, E.P.; Guaya, D.; Tituana, C.; Osorio, F.; García-Ruiz, M.J. Biochar from Agricultural by-Products for the Removal of Lead and Cadmium from Drinking Water. Water 2020, 12, 2933. https://doi.org/10.3390/w12102933
AMA Style
Puglla EP, Guaya D, Tituana C, Osorio F, García-Ruiz MJ. Biochar from Agricultural by-Products for the Removal of Lead and Cadmium from Drinking Water. Water. 2020; 12(10):2933. https://doi.org/10.3390/w12102933
Chicago/Turabian StylePuglla, Edgar Pineda, Diana Guaya, Cristhian Tituana, Francisco Osorio, and María J. García-Ruiz. 2020. "Biochar from Agricultural by-Products for the Removal of Lead and Cadmium from Drinking Water" Water 12, no. 10: 2933. https://doi.org/10.3390/w12102933
Note that from the first issue of 2016, this journal uses article numbers instead of page numbers. See further details here.