Article

Phenotypic Variability and Genetic Diversity of Phragmites australis in Quebec and Kashmir Reveal Contrasting Population Structure

1
Department of Botany, University of Kashmir, Srinagar 190006, Jammu & Kashmir, India
2
Centre for Forest Research (CEF) and Institute for Integrative and Systems Biology (IBIS), Université Laval, Québec, QC G1V0A6, Canada
3
Department of Plant Biology, Faculty of Science, University of Yaoundé, IPO Box 812 Yaoundé, Cameroon
4
World Agroforestry, West and Central Africa Region, Cocody, Angré 7ème Tranche B.P. 2823, Abidjan 08 BP 2823, Cote D’Ivoire
*
Author to whom correspondence should be addressed.
Plants 2020, 9(10), 1392; https://doi.org/10.3390/plants9101392
Submission received: 14 September 2020 / Revised: 9 October 2020 / Accepted: 13 October 2020 / Published: 20 October 2020
(This article belongs to the Special Issue Competition among Native and Invasive Plants)

Abstract

:
The origin of differences in traits influencing competitive success between invasive and native wild populations of alien species is subject of debate. Herbarium-based information sources from 2005 onwards about nativity and distributional range of Phragmites australis were used to survey putative native populations of the species in Quebec, and chloroplast DNA (cpDNA) PCR-RFLP analyses identified only one native population, whereas the same analyses revealed that the Kashmir populations are invasive. We compared the native population of P. australis in Quebec (QN), ten populations invasive to Quebec (QE), and five populations invasive in Kashmir, India (KE) using morphometric traits. Using nine cpDNA microsatellite loci, we also compared nine KE populations, ten QE populations, and the QN population. Phenotypic variation was observed among and within populations. Only dry mass of flowers varied across regions. Characterization of morphotypes defined three distinct haplotypes. A bimodal distribution of stem diameter (SD), internode length (IL), leaf length (LL), and leaf width (LW) suggests that a major gene may control growth traits or occurrence of co-selection. High genetic differentiation was observed between populations (RST = 0.353) and haplotypes (RST = 0.133 to 0.418), indicating limited gene flow and probable local adaptation. Principal coordinates analysis and the neighbor-joining phylogenetic tree clearly distinguished the three haplotypes. Among-populations phenotypic difference (PST) was lower than overall RST for plant height, SD, and fresh and dry mass of flowers and seeds, whereas PST estimates for LL and LW exceeded among-populations RST, suggesting divergent selection, while local adaptation might have occurred in IL, LL, and flower masses. Genetic drift probably influenced among-populations IL differences.

Graphical Abstract

1. Introduction

The spread of invasive alien species (IAS) has received a great deal of attention, given the adverse ecological and economic effects that they can impose on invaded ecosystems [1,2]. Why invasive species expand their range faster in non-native regions, but not in their native range, and how these species become dominant components of non-native habitats while being minor constituents of their native ecosystems [3] are still open questions. Alien plants are those plants that have been introduced to an area from their native range, either accidentally or intentionally, whereas invasive plants are those plants that are non-native to an ecosystem and which may cause a threat to native biodiversity and ecosystem integrity in many ecologically sensitive parts of the world. Very recently, the International Union for Conservation of Nature has come up with a standard Environmental Impact Classification of Alien Taxa (EICAT), based on the magnitude of the detrimental environmental impacts. Earlier studies have indicated that invasive species often possess specific demographic or physiological traits, such as faster growth rates, greater productivity, high fecundity, greater tolerance to environmental extreme events, or very effective dispersal compared to native and non-invasive introduced species [4,5,6,7]. These traits enable introduced species to spread very extensively and achieve high abundance. The origin of such variations in traits that influence success in competition between invasive and native species under natural conditions may include geographic isolation, genetic drift, divergent selection, phenotypic plasticity [8], and rapid adaptive evolution [9,10]. Whether phenotypic divergence among and between populations of alien species is due to one or more of these factors is a debate that remains to be resolved.
The phenotypic differences within and among populations of invasive species in their native and non-native ranges are widely speculated [11,12]. The colonization of new areas by invasive species would be associated theoretically with founder diversity [13], phenotypic plasticity, and environmental conditions at the points of origin [14], various ecological and evolutionary processes associated with geographical zone [15], and population bottlenecks that reduce within-population genetic diversity and increase genetic differentiation among populations [16]. These population genetic differentiations have important effects on species invasiveness, which is apparently linked to increased genetic variation and evolutionary potential [17]. Moreover, population genetic analyses can increase our understanding of the origin and expansion of invasive species and invasive populations [18,19], or haplotypes (i.e., individuals with a specific group of alleles that are inherited within a species), and the same could have useful management implications as well. Previous research has typically focused on detecting how invasive haplotypes have invaded and replaced native haplotypes [20,21]. This replacement is most often due to better performance of invasive haplotypes compared to native haplotypes with respect to morphological traits, such as plant height and size, and to reproductive success. However, little attention has been paid to understanding the variation patterns of such invasive haplotypes in their native regions. Further, the causes of morphological differences between invasive and natural populations of IAS are not well understood. Thus, investigating phenotypic and genotypic differentiation between invasive and native haplotypes in wild populations should contribute to the understanding of mechanisms behind the invasion of alien species.
Among-population phenotypic differentiation in the wild is effectively estimated using PST (i.e., the phenotypic analogue of QST); [22,23,24]. Lande (1992) [25] stated that genetic variance in phenotypic traits between populations is expected to equal that of variation in neutral molecular loci under the influence of the forces that drive evolution. Indeed, the level of differentiation of quantitative traits should be similar to the level of differentiation at neutral loci, as divergent selection in quantitative traits induces more morphological differences than would be expected for neutral molecular markers [24]. For this reason, a valuable method for investigating morphological differences between invasive and natural populations of IAS is to compare divergence in allele frequencies to divergence in quantitative traits. Whether selection or genetic drift is responsible for phenotypic divergence is a complex task and requires the initial step of comparing genetic differentiation with phenotypic differentiation. Phenotypic differences between populations are often assumed to be adaptive, and epigenetics are reported to play key role on adaptation of invasive species [26]. Both molecular and quantitative variations can be influenced by non-adaptive processes that involve random genetic drift and gene flow [27,28]. Under these conditions, it would be especially challenging and interesting to determine whether phenotypic differences between populations represent the outcomes of adaptive or non-adaptive processes.
Common reed (Phragmites australis [Cav.] Trin. ex Steud; Poaceae) is a polyploid perennial grass species with clonal architecture [29,30,31]. The species is distributed worldwide and is highly invasive in Kashmir Himalayan aquatic habitats [32]. In Kashmir, India, this species was earlier reported as a South American native [33] and European native [32], but substantial molecular evidence for the nativity of this species is lacking. Saltonstall (2002) [29] sampled individuals of P. australis worldwide and recovered 27 haplotypes of this species on the basis of the sequences of two chloroplast DNA (hereafter, cpDNA) fragments. In North America, both native and exotic haplotypes of the species are found. Introduction of an exotic genotype of P. australis (Haplotype M) and its rapid spread, aided by anthropogenic disturbance, has contributed significantly to its invasion and range expansion in North America [29]. Recently, Guo et al. [34] showed that evolutionary mechanisms act differently in the native and introduced ranges of P. australis and that invasive populations of European origin have evolved to adapt to a different climate and to human-made habitats in North America. In Quebec, Canada, the native haplotype is characterized by a red stem and ligule base (i.e., the junction of the leaf blade with the leaf sheath) with fewer hairs, compared to the green stem of invasive haplotypes, which have more hairs on the ligule. Moreover, the inflorescence of the native haplotype is less dense relative to that of the invasive haplotype, containing fewer seeds [35,36]. The invasive haplotype in Quebec tends to grow preferentially along roads and in other human-made habitats, while the native haplotype prefers undisturbed, pristine habitats [37,38,39,40]. In India, the invasive P. australis haplotype is found to occur widely in various aquatic habitats, especially in Kashmir Himalayan wetlands.
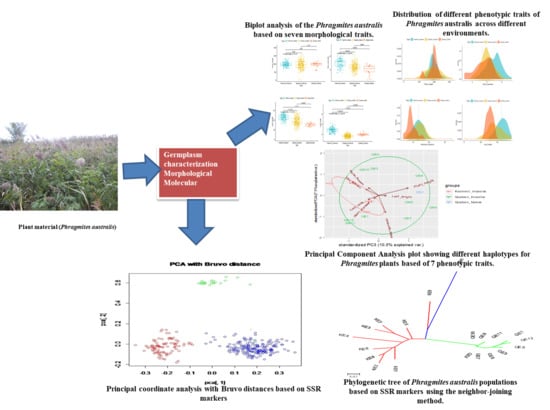
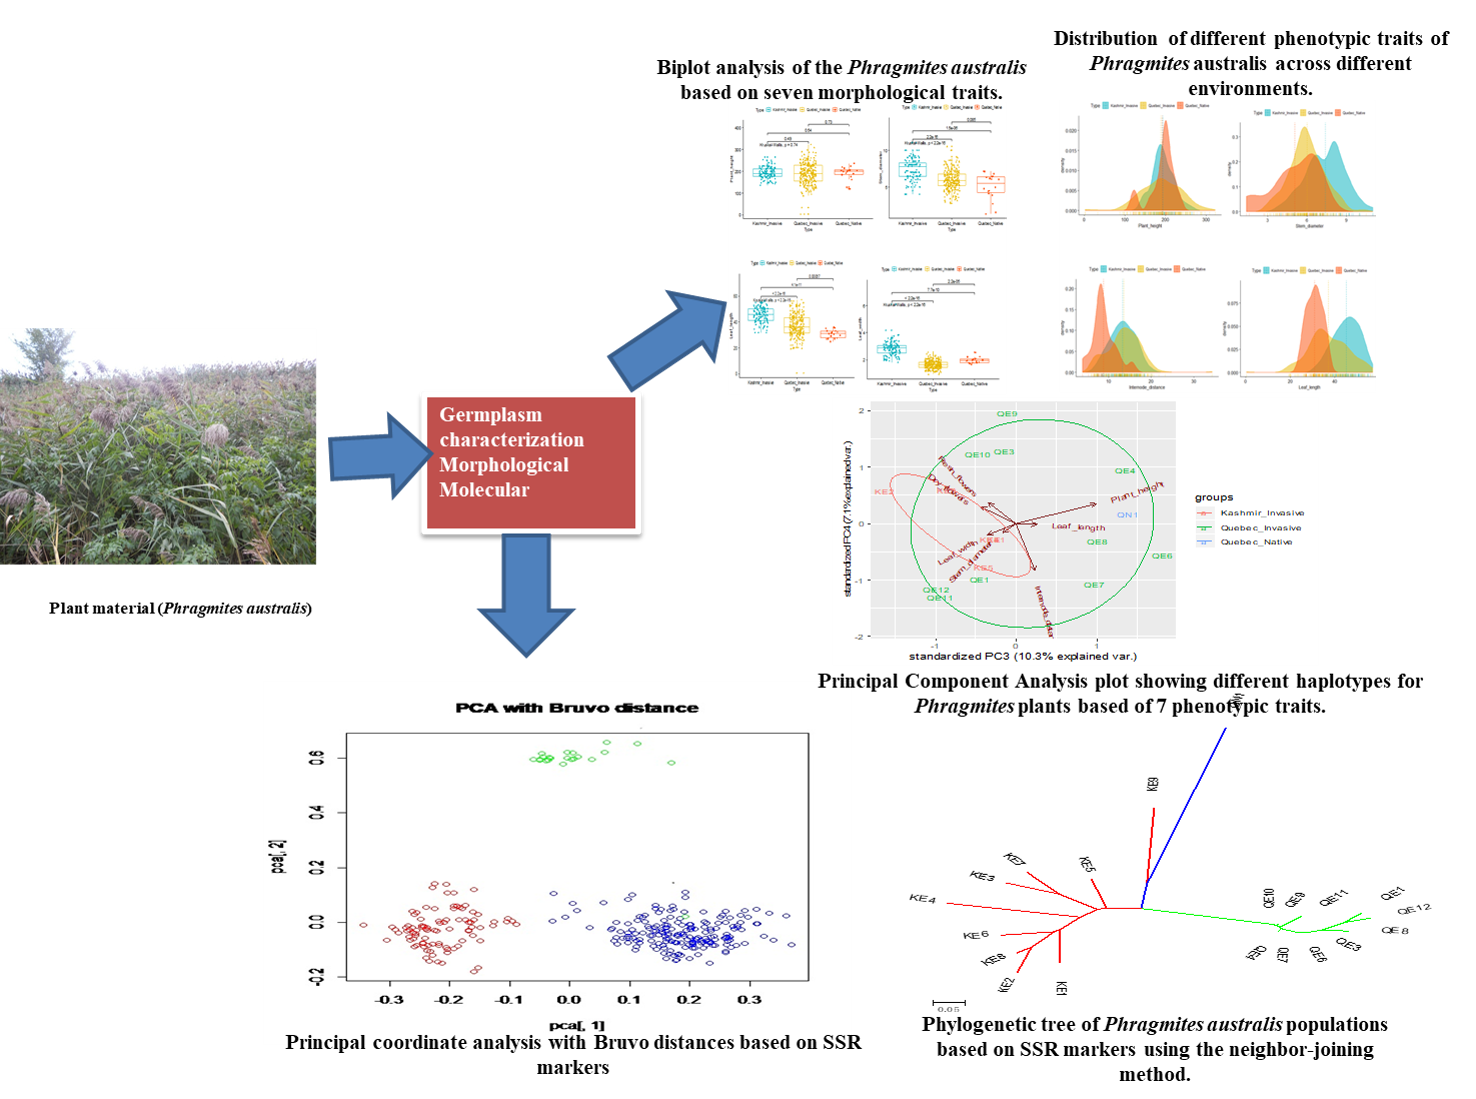
The objectives of this study were: (i) to assess and compare the phenotypic and genetic diversity of invasive populations of P. australis in Kashmir and Quebec, together with native haplotypes of this species in Quebec, and (ii) to assess evolutionary similarities between them.

2. Results

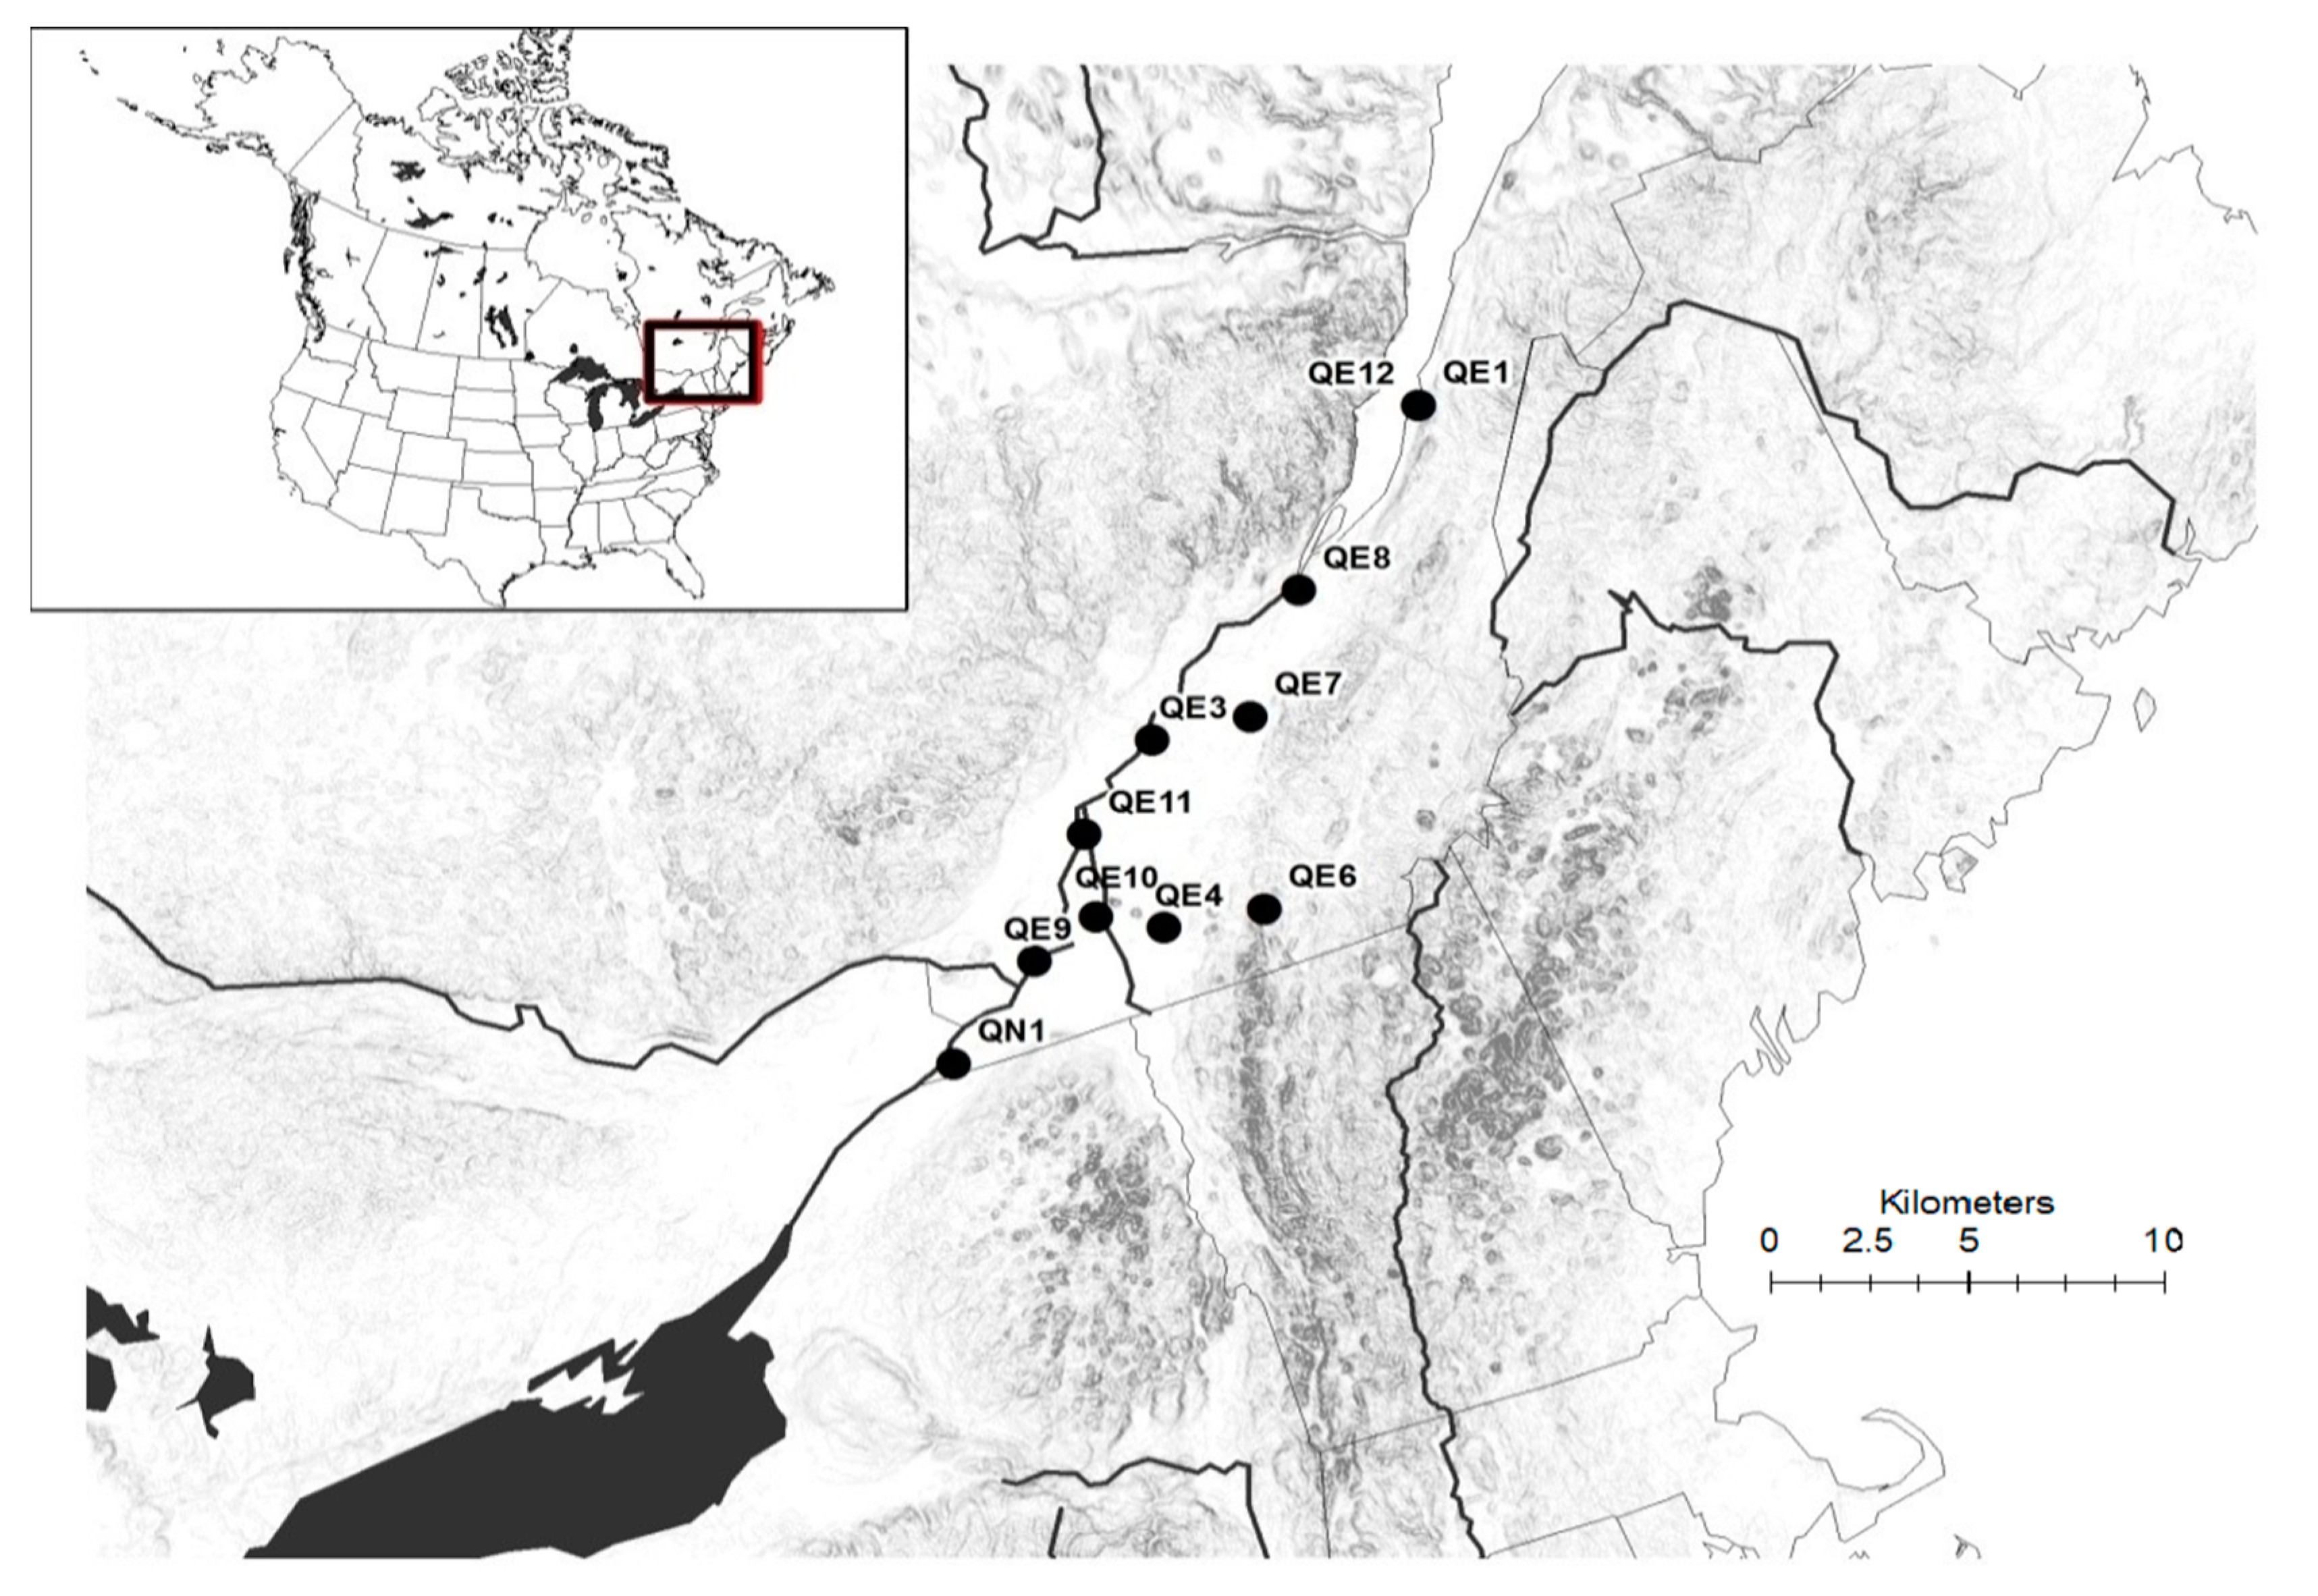
Restriction fragment length polymorphism (hereafter, RFLP) analysis confirmed that there was only one native population (QN1) in our sampled populations, instead of five as thought based on morphological variations. In utilizing the cpDNA PCR-RFLP analyses, we found that the Quebec population QN1 shared the same restriction pattern as native populations in USA [41]. Further, we found that ten populations (QE1 to QE12) exhibited the same restriction sites as haplotype M [42]. Results for the sequence trnT-trnL in the native Quebec QN1 population was 99% similar to haplotype E2 (NCBI accession no. AY016325; [42]). Sequence trnT-trnL in the invasive Quebec QE1 population and sequence trnT-trnL in the Kashmir KE1 population were 99% similar to haplotype 4 (NCBI accession no. AY016327; [42]). BLAST analysis was done in GenBank NCBI database for the rbcL-psaI intergenic spacer, and for native Quebec QN1, the sequence was identical to haplotype E2 (100% identity with NCBI accession no. JQ409547; Freeland and Vachon Unpublished data). Sequence rbcL-psaI in the invasive Quebec QE1 population was 99% similar to haplotype 4, while Kashmir KE1 population was identical (100% similar) to the same sequence of haplotype 4 (NCBI accession no. AY016335, [42]). All nine populations from Kashmir displayed the same restriction pattern as haplotype M. Based on this information, we considered the putative native Quebec populations of Lac St-Louis, Parc Louis-Racine, Sablière Colette, and La Pocatière as invasive P. australis populations, referring to them instead as QE9, QE10, QE11, and QE12.

2.1. Phenotypic Diversity
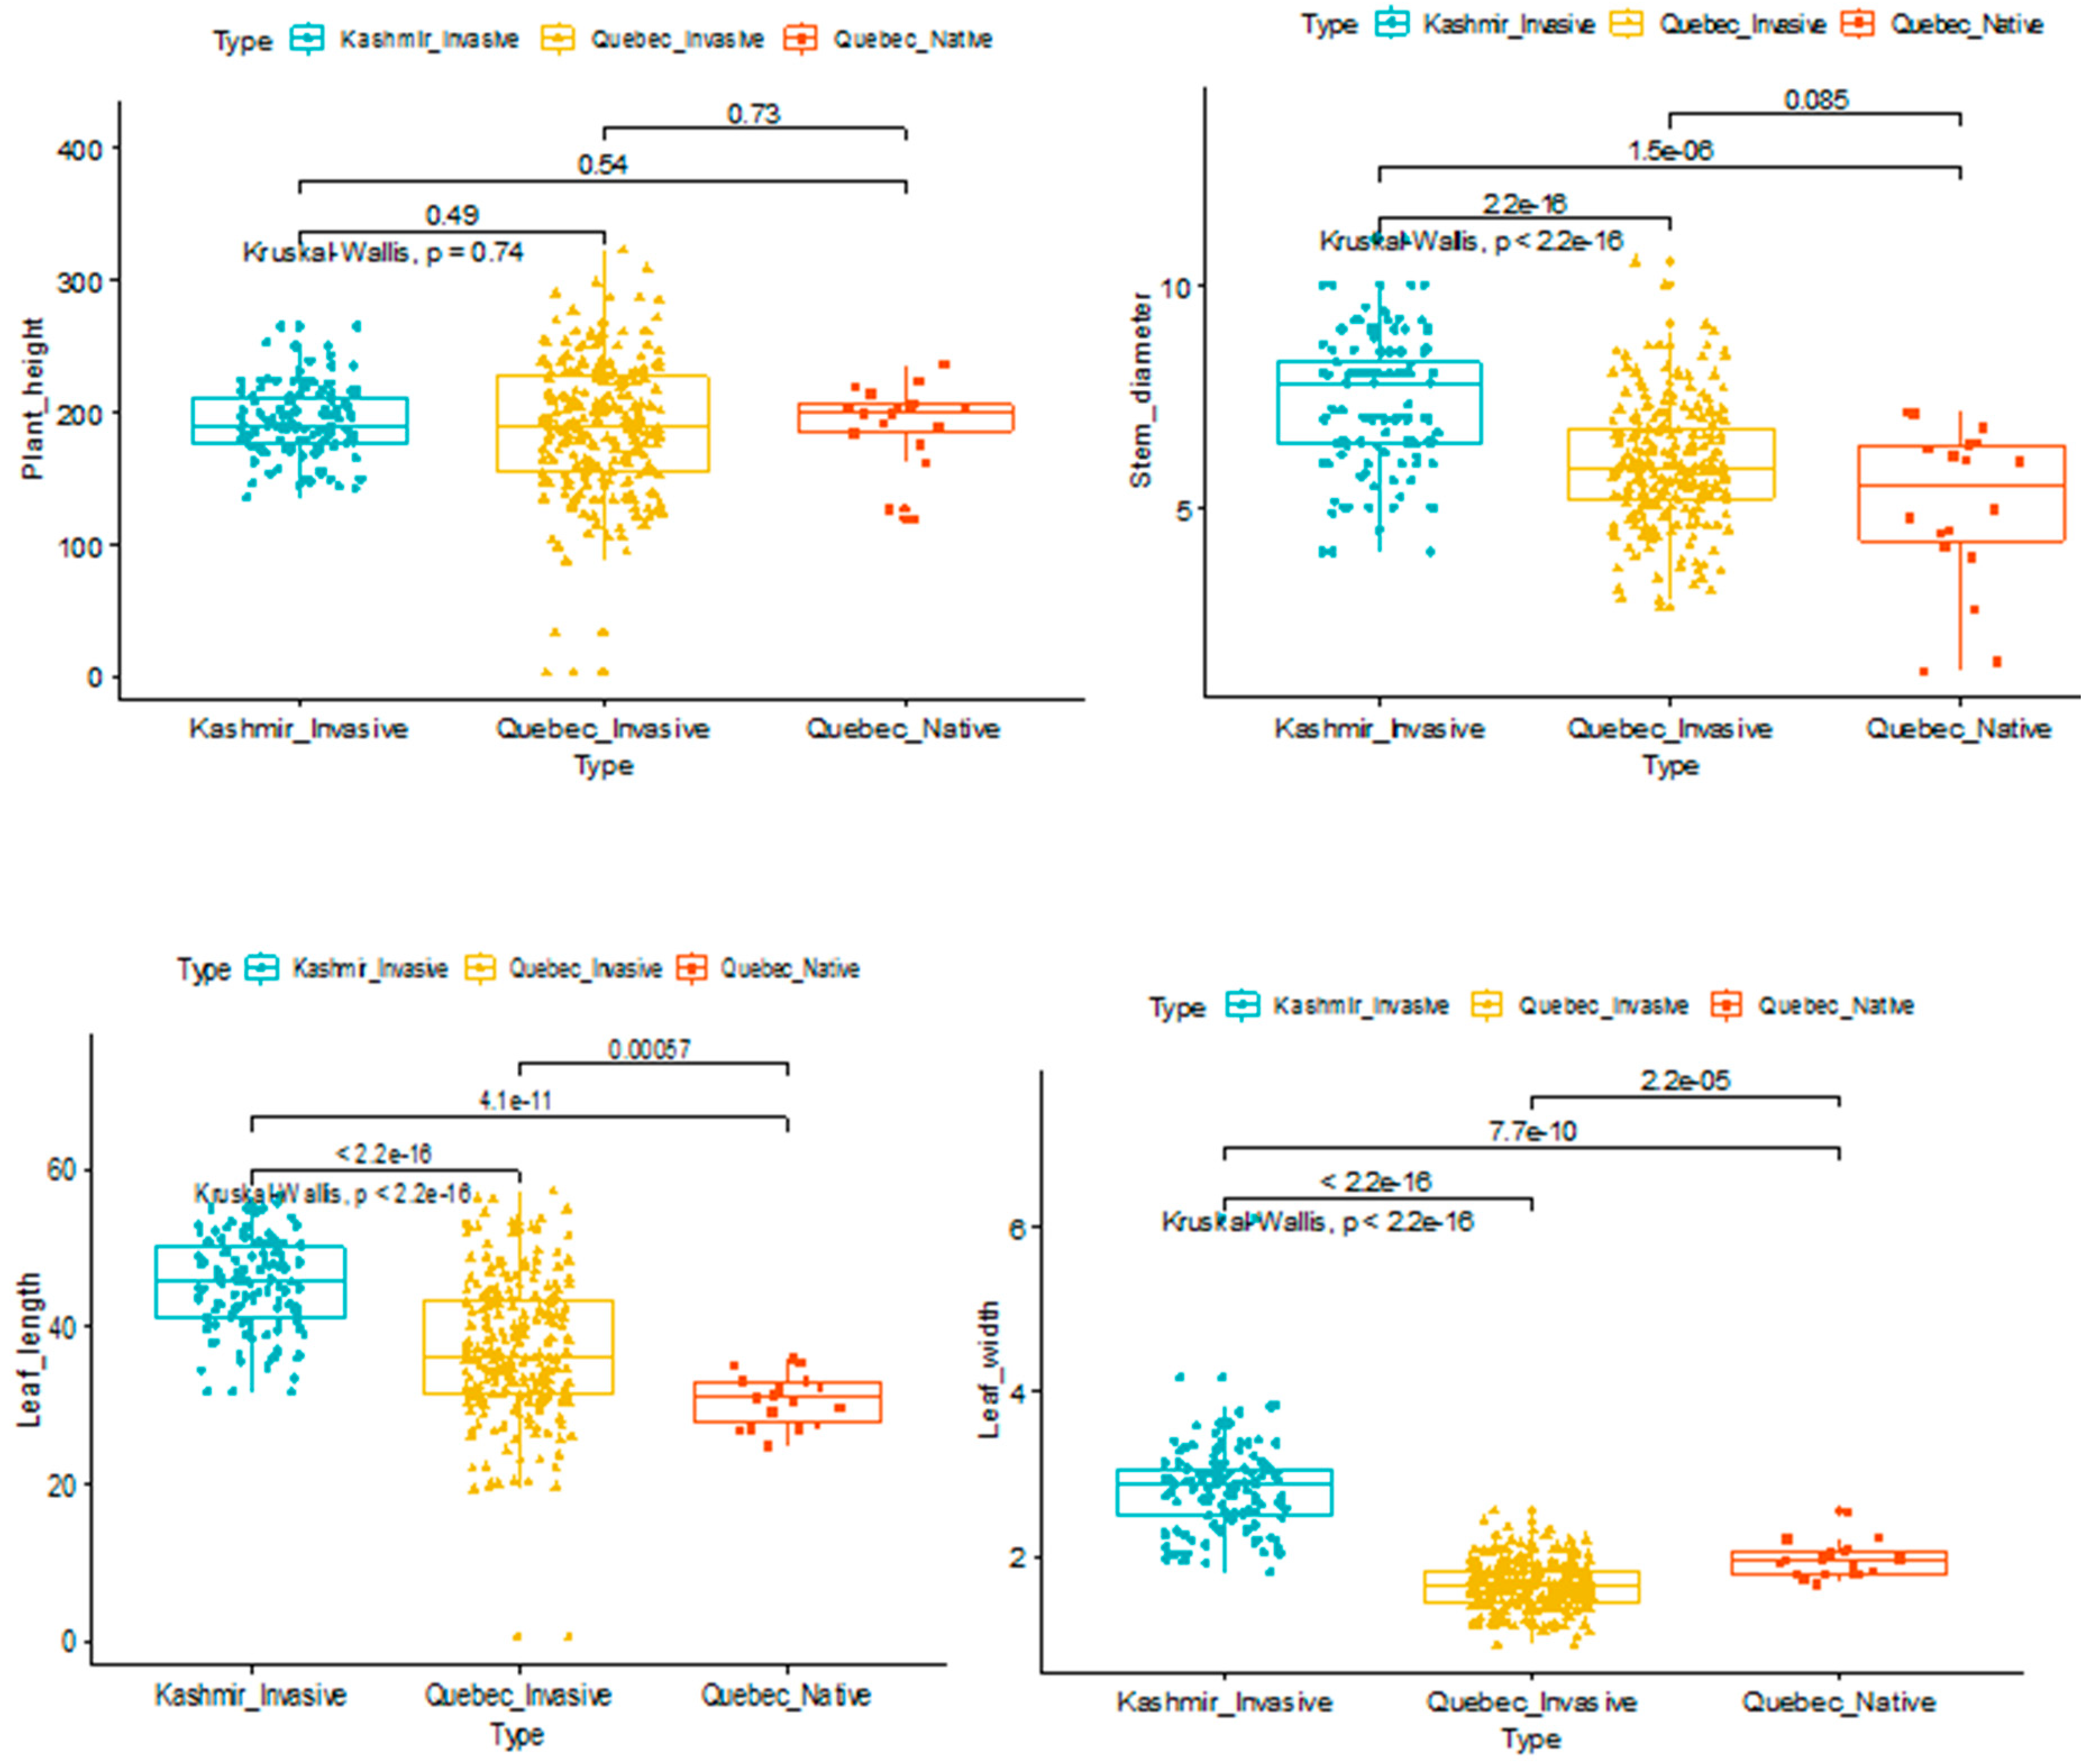
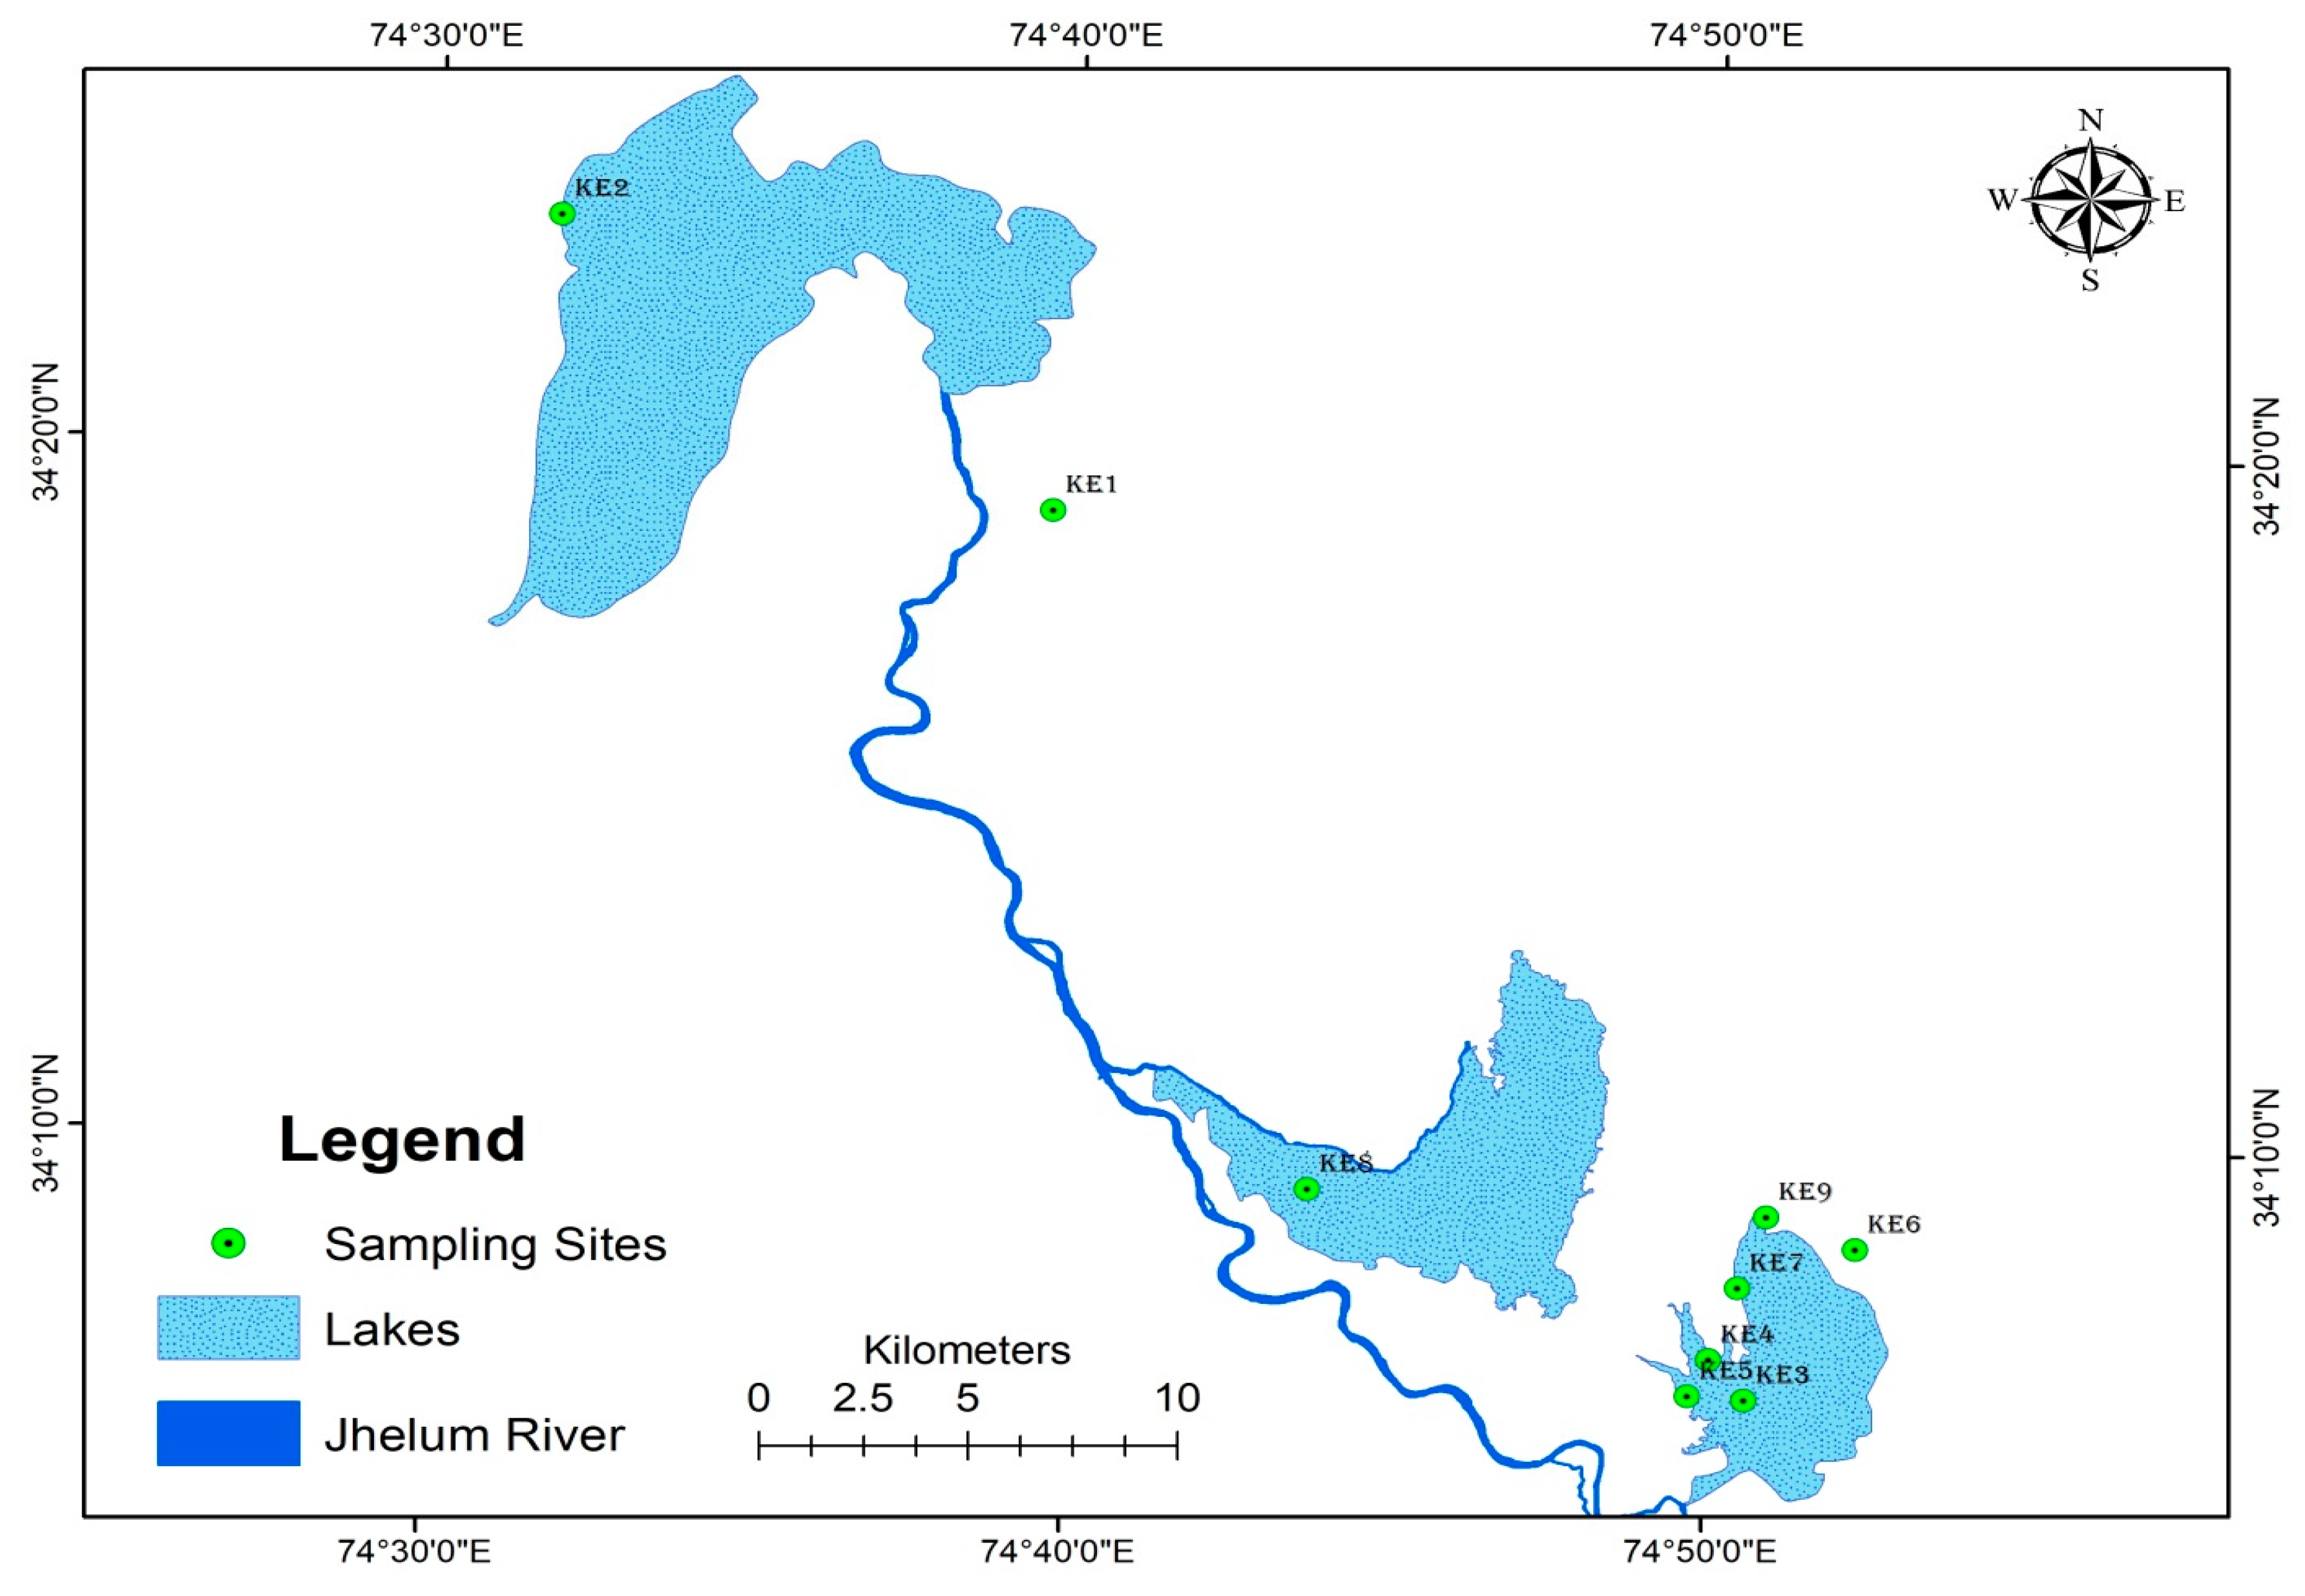
The invasive P. australis plants of the Ange-Gardien population, Quebec (QE4) were the tallest (Mean ± SE: 230.74 ± 55.54 cm height), followed by the invasive haplotypes of Bernière, Quebec (QE8: 226.72 ± 34.63 cm height), and the invasive haplotypes of Eastman, Quebec (QE6: 212.44 ± 68.96 cm height; Table 1). The thickest plant stems were recorded for invasive P. australis plants from Kuhunus Wullar populations (KE5: 7.83 ± 1.362 cm), Ashaibagh (KE2: 7.78 ± 1.332 cm) and Rangharstop (KE4: 7.74 ± 1.264 cm; Table 5). The heaviest flowers in terms of fresh and dry mass were also recorded in Ashaibagh, Ange-Gardien, and Bernière populations (Table 1). The highest intermodal length was recorded in plants from Bernière (QE8: 18.00 ± 3.749 cm), La Pocatière (QE1: 16.16 ± 2.407 cm), and Princeville (QE7: 16.77 ± 2.266 cm; Table 1). The longest leaves were recorded in Ashaibagh, Rangharstop, Ange-Gardien, and Eastmann P. australis populations, whereas the widest leaves were recorded in invasive P. australis plants from Kashmir (Table 1).
Highly significant variation was observed among plants, whereas significant to highly significant variation was found among populations for the measured characters, except for leaf width (Table 2). The variation between individual plants and between populations most often contributed to the bulk of total variation in the measured characters, except for leaf width (Table 2). Additionally, among-populations variation was higher than between-haplotypes variation for all the characters that were measured (Table 2). While P. australis plants from Kashmir had more highly significant (p < 0.001) heavier flower dry mass (3.59 ± 0.59 g) than did Quebec plants (2.55 ± 0.116 g), invasive P. australis plants had significantly wider leaves (2.04 ± 0.036 cm) than did native plants (1.65 ± 0.05 cm). Additionally, except for flower and dry seeds mass, no variation was found among regions for all measured characters (Table 2).

2.2. Characterization of Phenotypes

To investigate the effects of morphological traits in distinguishing the haplotypes that were investigated, we analyzed the distribution of each trait among haplotypes. Though stem diameter, plant height, leaf length, and width distinguished the haplotypes that were studied, the differences were not significant (Figure 1).
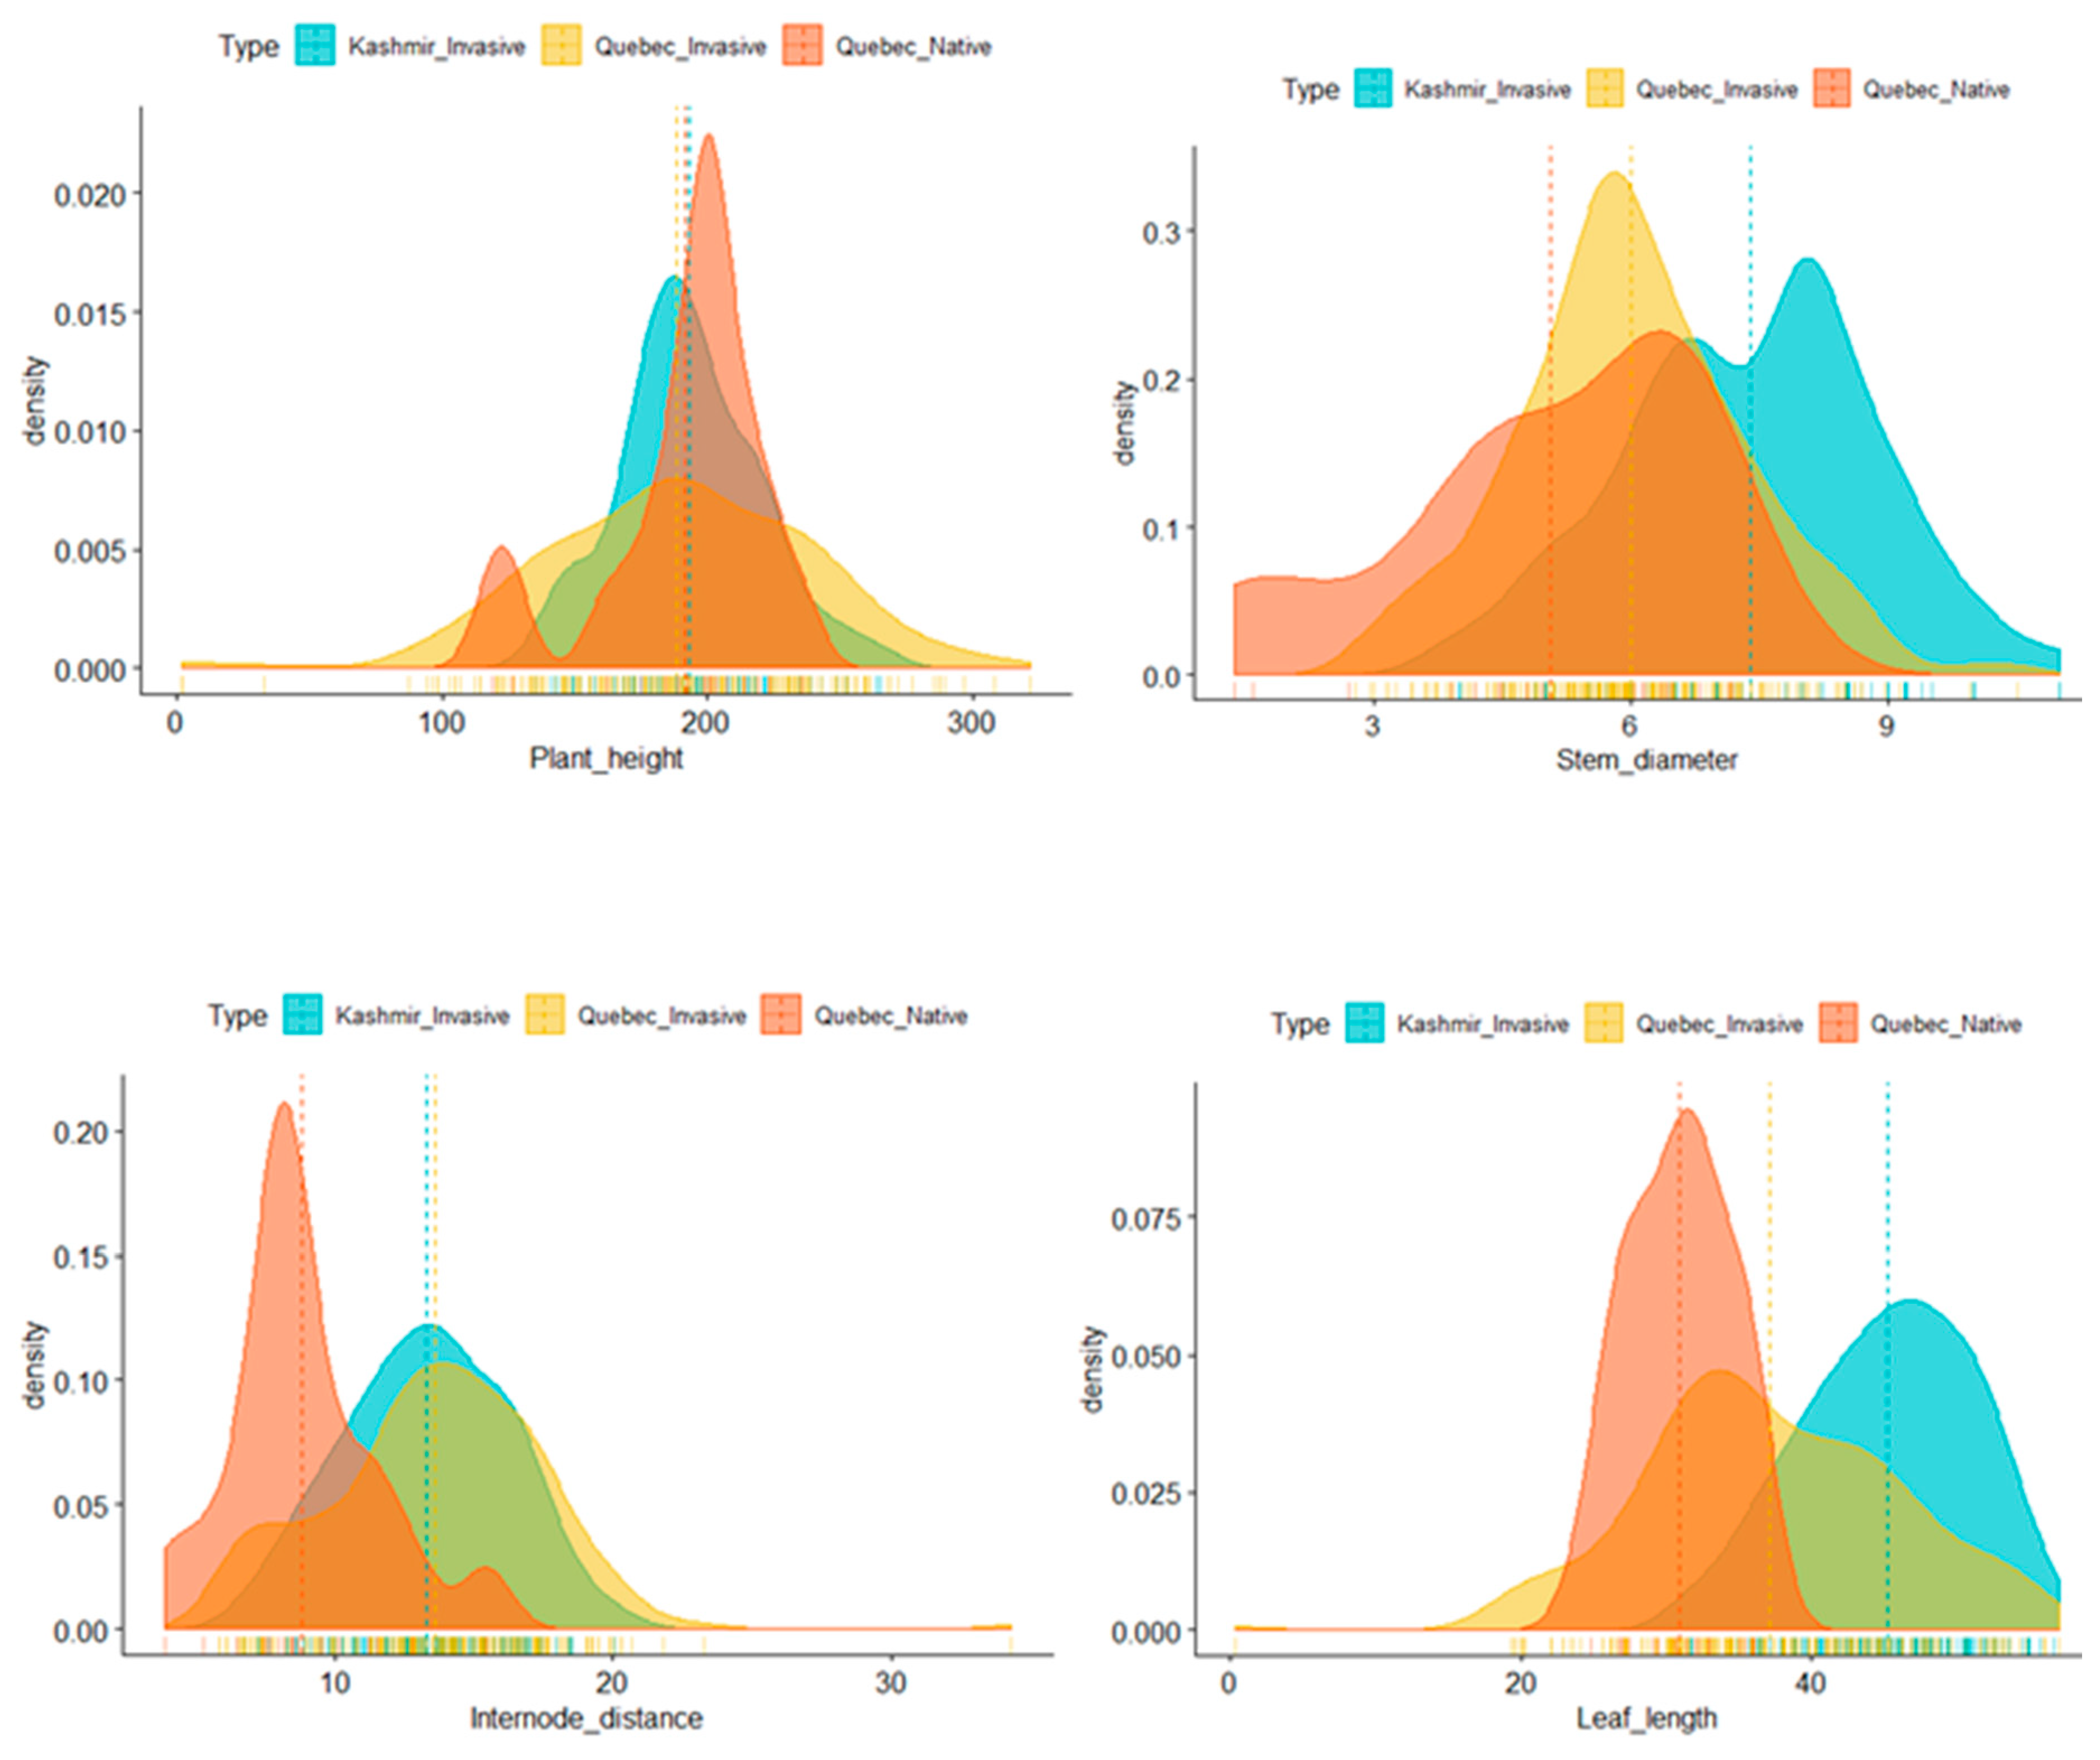
To explore descriptors, we measured seven phenotypes (plant height, stem diameter, fresh flowers, dry flowers, internode length, and leaf length and width) in P. australis. A bimodal distribution was observed for stem diameter, internode length, leaf length, and width (Figure 2). Normal distributions without any significant skewness were observed for the rest of traits.
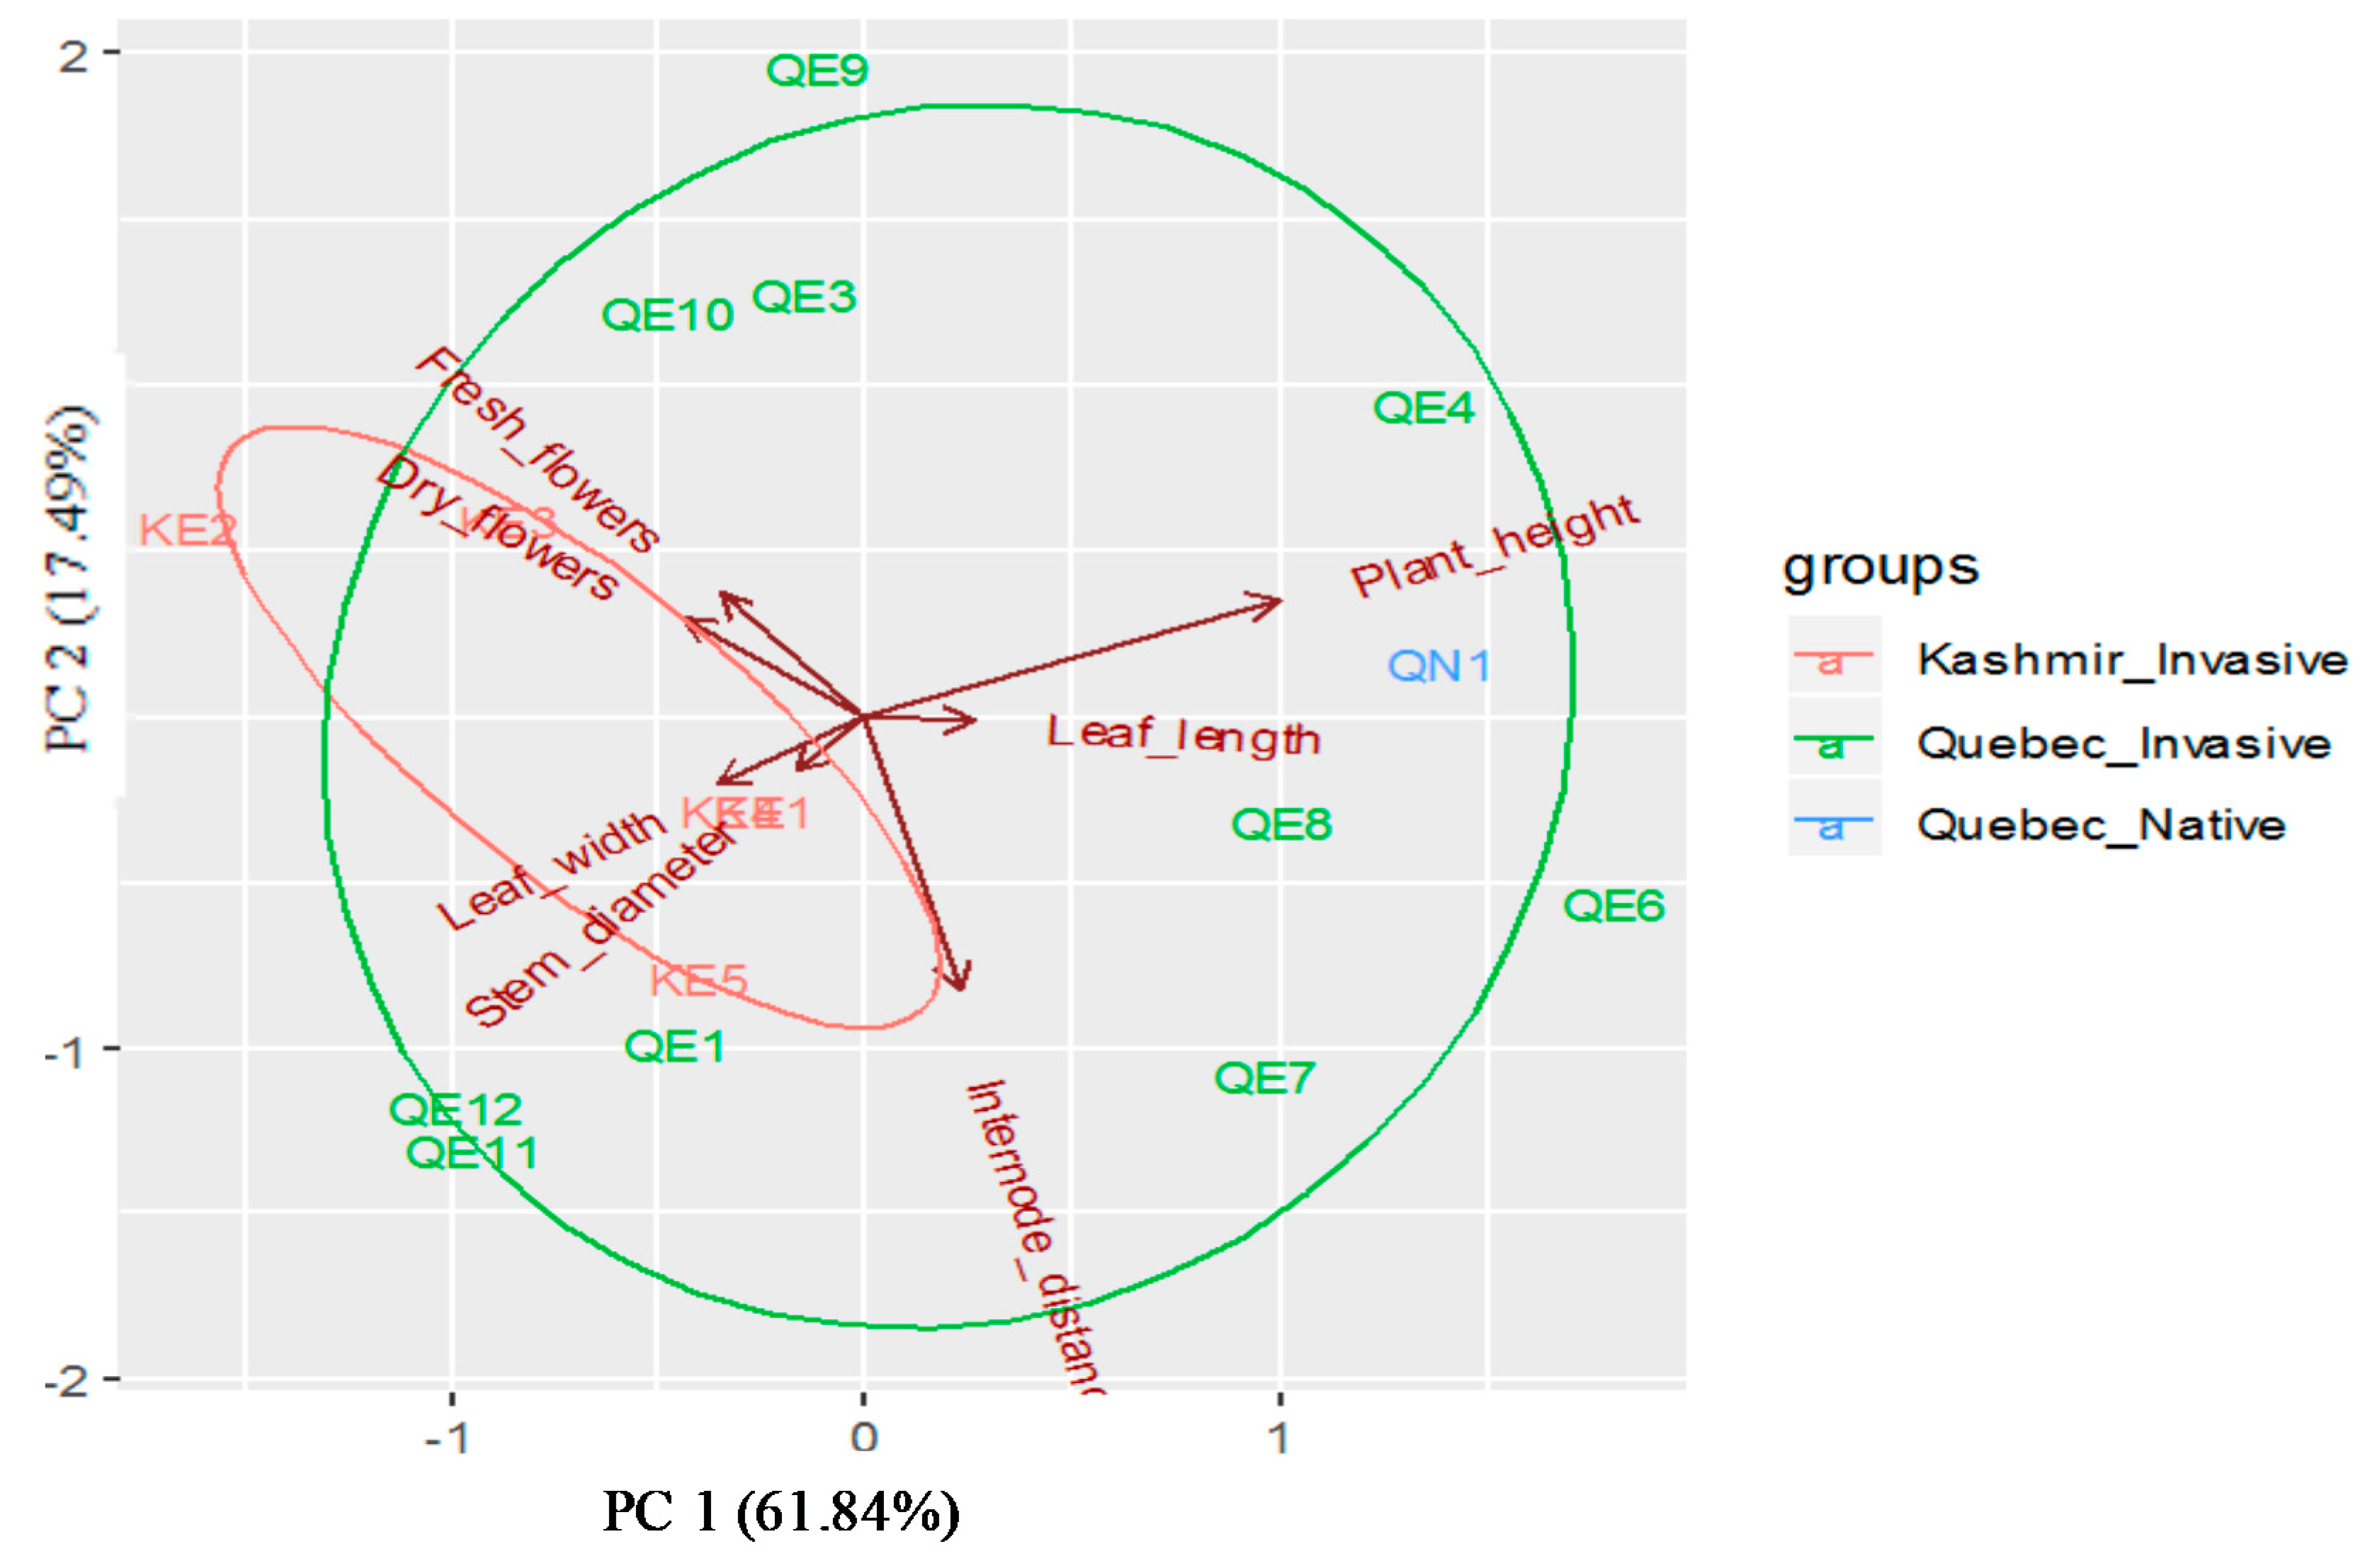
Principal component analysis (PCA) indicated two principal components with eigen-values greater than 1. The PCA grouped the seven P. australis descriptors into various components, with the first two explaining 79.33% of the variation, while the first principal axis (PC1) alone explained 61.84% of the variation (Figure 3). The PC1 had high loading for leaf width. The second axis (PC2), explaining about 17.49% of the total variation, was correlated with plant height, stem diameter, fresh flowers and seeds, dry flowers, and seeds, internode length, and leaf length, indicating the usefulness of descriptors in P. australis (Table 3).

2.3. Phenotypic Differences and Heritability

Moderate PST estimates were observed among populations, ranging from 0.12 for flower and seed fresh mass to 0.41 for leaf length (Table 2). The measured traits were weakly (leaf width) to moderately (internode length, leaf length, and flower masses) heritable (Table 2).

2.4. Genetic Diversity

The polymorphism information content (PIC) varied from 0.4 (PaGT11) to 0.9, with an average of 0.8 (Table 4). Based on the number of alleles, it was found that P. australis in Kashmir shows hexaploidy as the number of alleles from each population ranged from 1–6; for Quebec populations, it shows tetraploidy as the number of alleles ranged from 1–4. However, Quebec native population plants seem to be diploid, having only 1–2 alleles (Table 4). All loci that were surveyed were variable in each population. Within-population genetic diversity indices are summarized in Table 5. The mean number of alleles per locus ranged from 1.89 to 4.56, and the overall mean number of alleles per locus amounted to 8.56. The mean number of alleles per polymorphic locus ranged from 1.61 to 3.37, whereas the overall mean number of alleles per polymorphic locus amounted to 4.16 (Table 5). For P. australis populations in Kashmir, A ranged from 2.00 to 4.56 and Ap ranged from 2.04 to 3.37. The range of values for A and Ap was not as wide in the Quebec populations, and respectively, 1.89 to 3.56, and 1.61 to 2.32. Mean percentages of polymorphic loci ranged from 66.67% (KE9, Ganderbal, Kashmir) to 100% (KE1, KE4, KE5, KE6, KE7, and KE8) for Kashmir populations. For the Quebec populations, P ranged from 88.89% (QE1, QE3, QE6, QE8, QE9, QE12, and QN1) to 100% (QE4, QE7, QE10, and QE11). The overall percentage of polymorphic loci was 92.78% for all study populations. Allelic richness for Kashmiri and Quebec populations ranged from 1.81 to 2.54, and 1.54 to 2.18, respectively. Observed and expected heterozygosities for Kashmir populations were 0.70 and 0.54, respectively; for Quebec populations, HO was 0.38 and HE was 0.39. Overall mean observed and expected estimates of heterozygosity were 0.52 and 0.46, respectively, while HO and HE per population ranged from 0.23 (QN1; Lac St François, Quebec) to 0.78 (KE6; Saderkote wullar, Kashmir) and from 0.20 (QN) to 0.66 (KE6), respectively (Table 5).

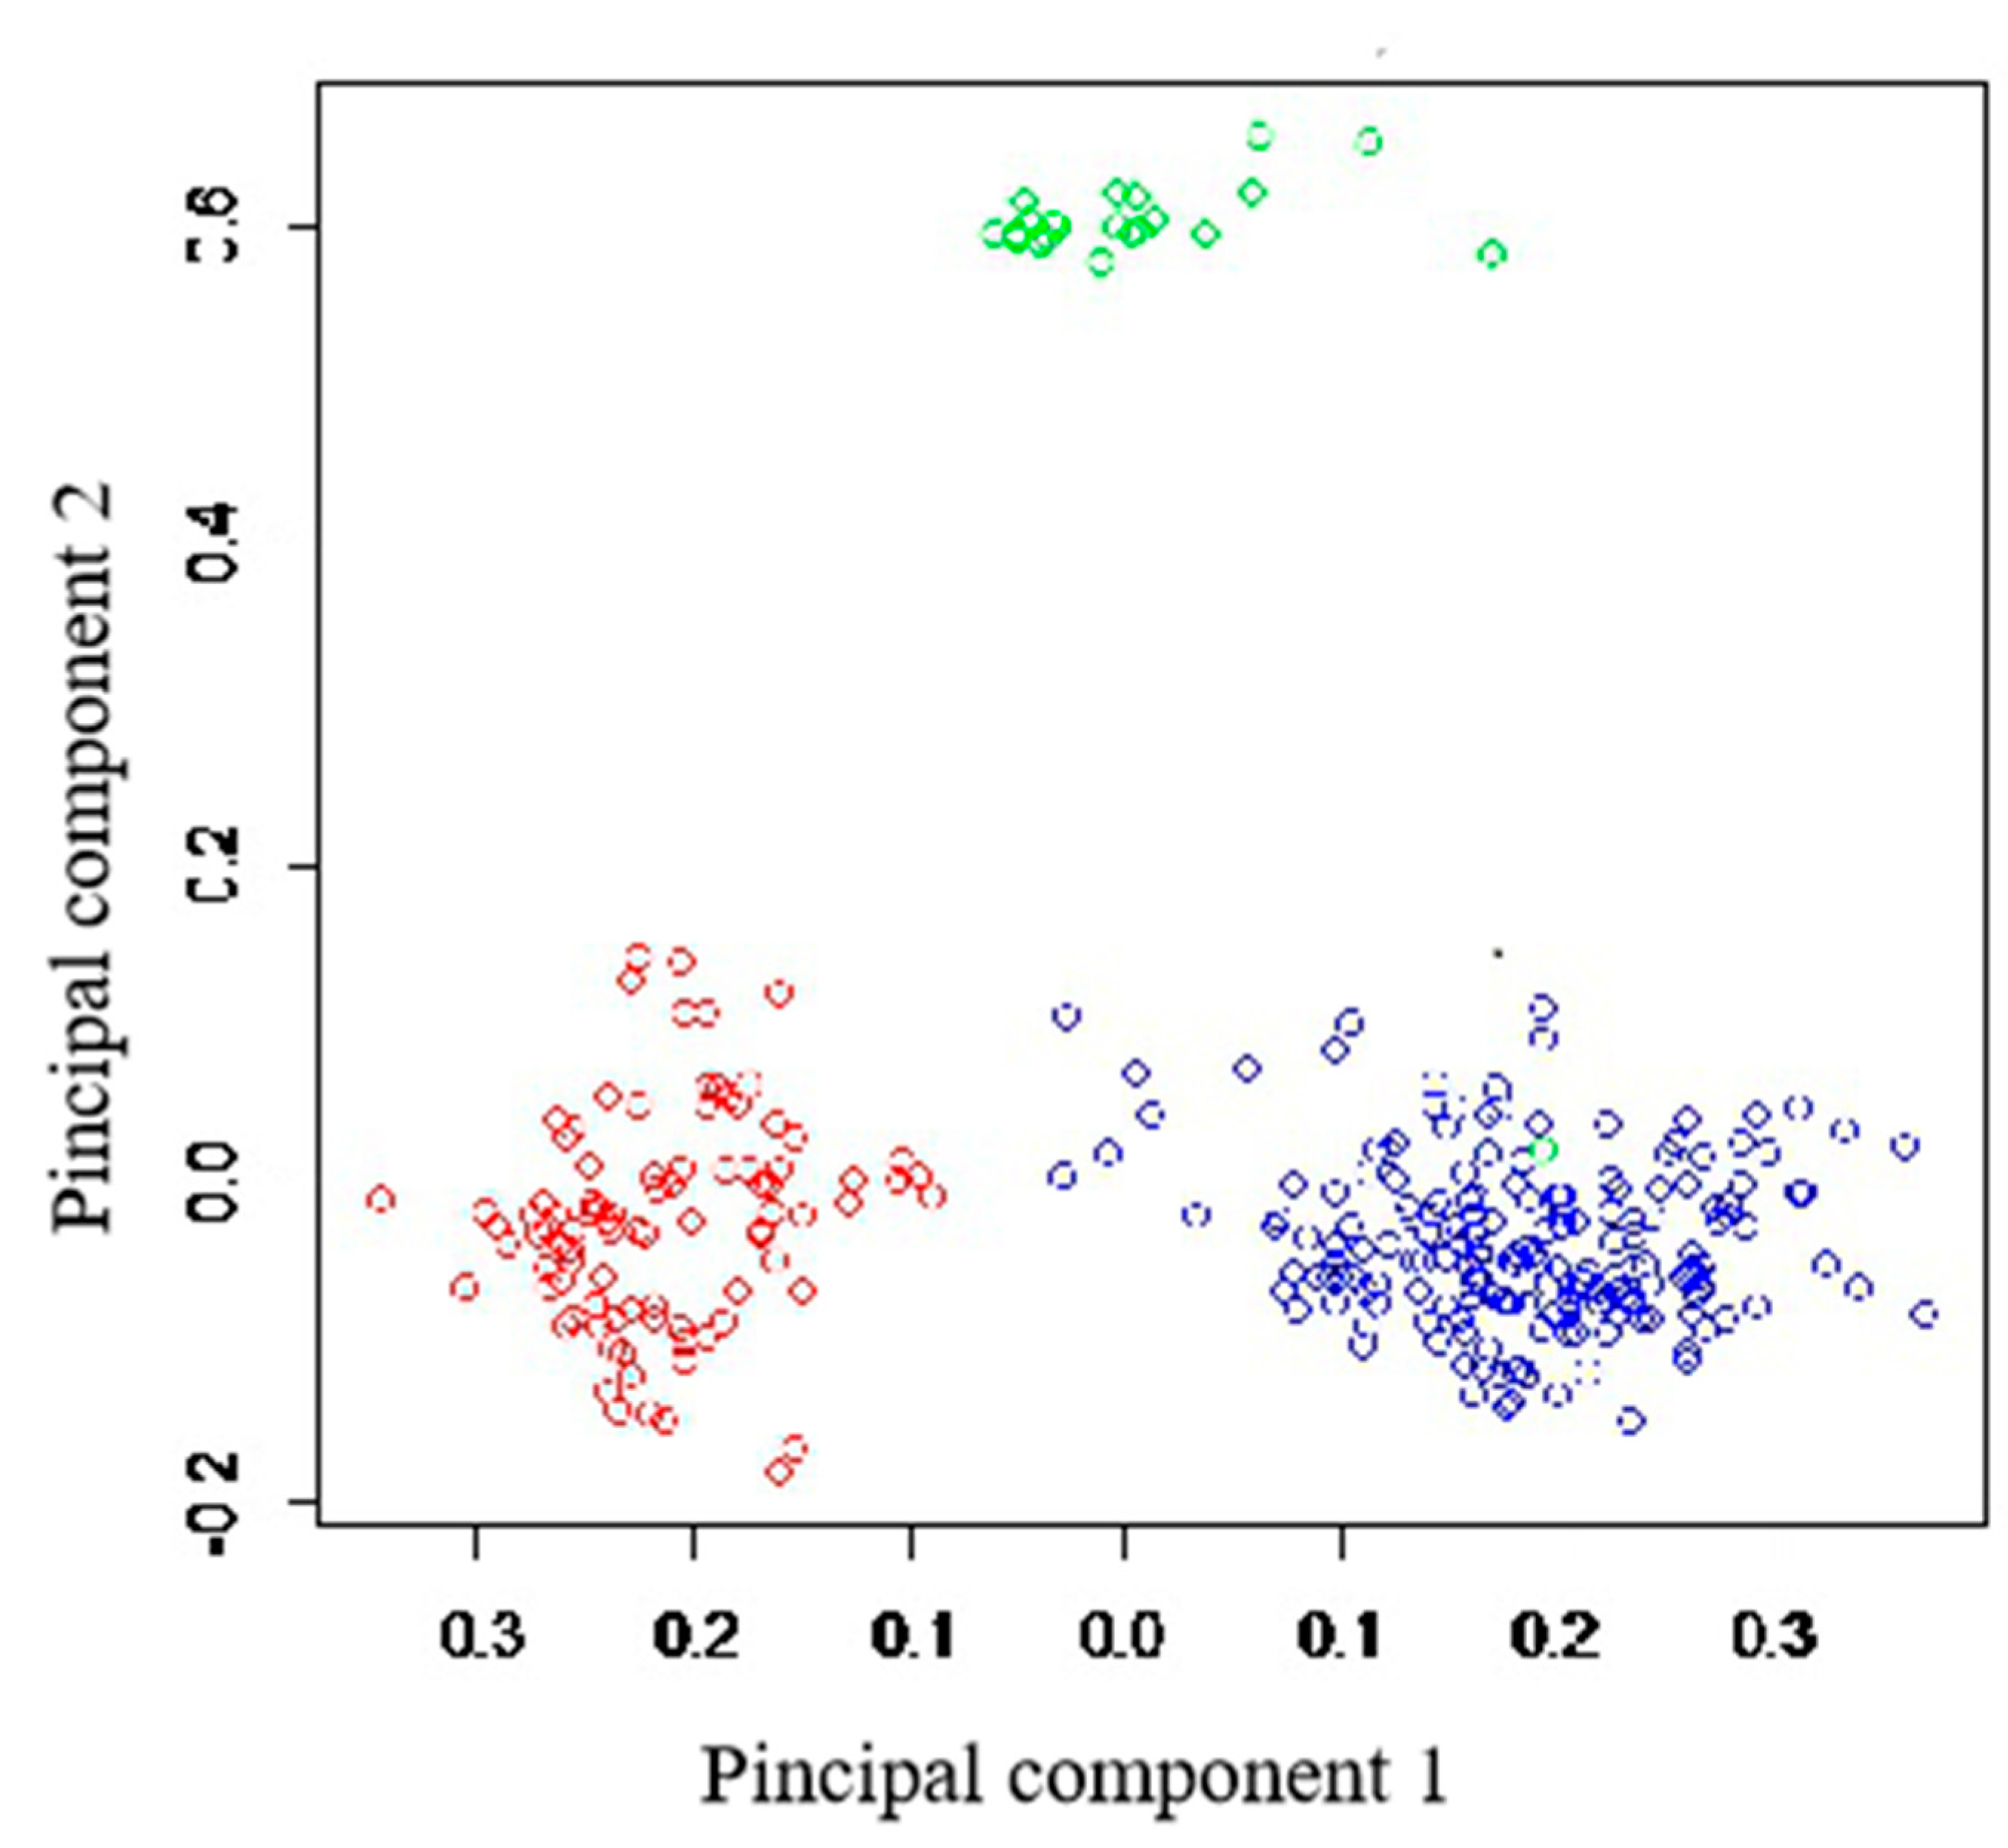
2.5. Population Genetic Structure

High genetic differentiation was observed among populations (overall RST = 0.353), ranging from 0.133 between invasive populations from Kashmir and Quebec, to 0.418 between Quebec native and invasive populations. These differences were best illustrated by the results of principal coordinate analysis (Figure 4). The P. australis plants separated into three groups: Kashmir invasive, Quebec natives, and Quebec invasive, which each formed one group (Figure 4).
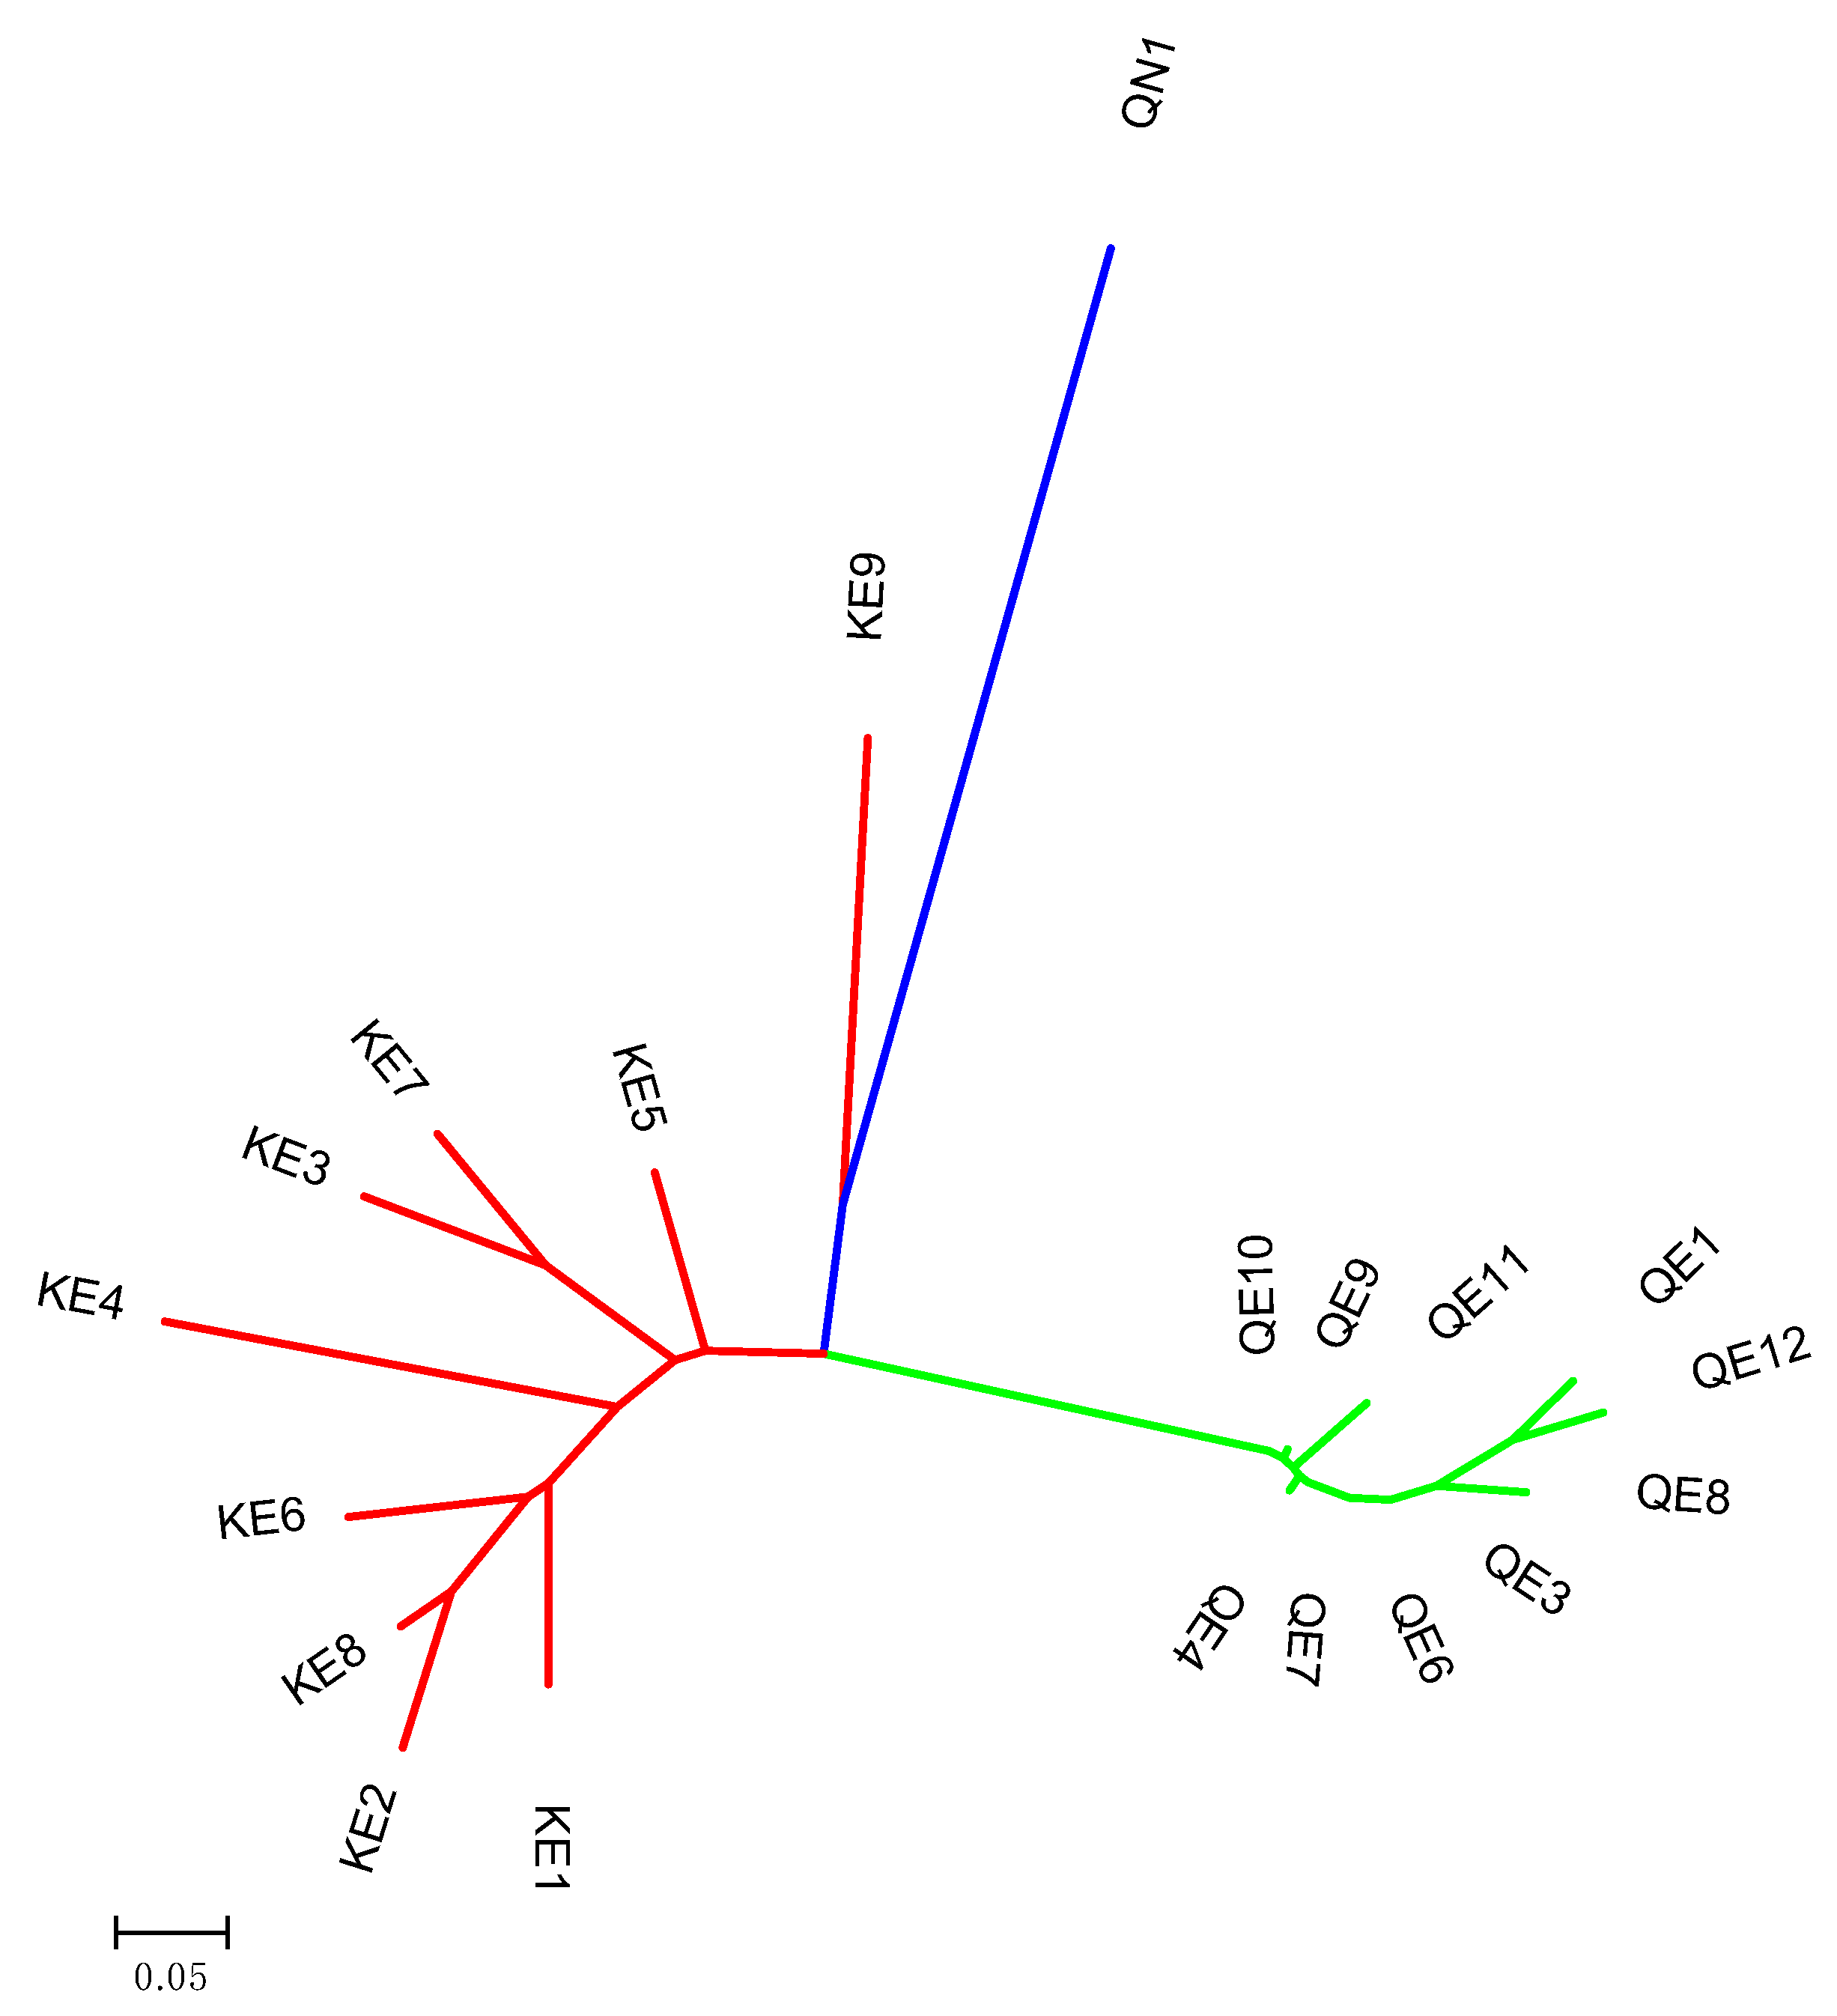
The phylogenetic tree (Figure 5) was congruent with principal coordinate analysis results (Figure 4), as the populations of native and non-native P. australis that were studied were found to be very structured. Clearly, ten populations belonging to Quebec invasive (QE1, QE2, QE4, QE6, QE7, QE8, QE9, QE10, QE11, and QE12) were grouped together, completely distant from the population of Quebec native (QN1; Figure 5). Kashmir invasive populations were clustered in the same group, whereas KE9 were close to QN1 population following by a sub-group containing height populations (KE1, KE2, KE3, KE4, KE5, KE6, KE7, and KE8; Figure 5).

2.6. RST- PST Comparisons

Among-population phenotypic differentiation estimates for plant height (0.23), plant stem diameter (0.25), and fresh and dry mass of flowers (0.12 and 0.14, respectively) were less than overall RST (0.35), whereas PST estimate for leaf width (0.39) and leaf length (0.41) exceeded the genetic differentiation at nine cpDNA microsatellite loci among the P. australis populations that were surveyed in the present study. PST estimate for internode length (0.33) was comparable with among-population RST estimate (0.35).

2.7. Relationships between Genetic and Geographic Distances

All the populations from both regions revealed a weak positive relationship between genetic distances and environmental variables (r2 = 0.389, p < 0.001). When Mantel test was calculated within each region it again showed a weak but significant correlation between the two variables in Quebec (r2 = 0.158, p ≤ 0.05) and non-significant correlation in Kashmir (r2 = 8.06 × 10⁻³, p = 0.5570).

3. Discussion

The behavior of P. australis in various lakes, wetlands, and other water bodies of Kashmir is that of a typical invader in terms of forming the monotypic stands, attaining great abundance, and outcompeting native species [43,44]. Previous studies that were carried out in 2018 [45] based on field observations reported this species at the stage V (widespread and dominant) on the stage-based hierarchical model (CM model) propounded by Colautti and MacIsaac [46]. Similarly, earlier studies conducted in 2007 [33] reported this species as a South American native and Shah et al. [32] in 2014 reported it as a European native based on published, web-based sources as well as phytogeographical distribution of this species, but substantial molecular evidence for the nativity of this species is lacking. Based on the above evidence, many authors declared that P. australis was introduced in India, especially in Kashmir Himalayan region [44,45]. There is hardly any study conducted in Kashmir, India, or elsewhere, that suggests native range of P. australis in this part (Kashmir Himalaya) of Asia. The present study aimed at increasing our understanding of the phenotypic and genetic diversity of invasive populations of P. australis in Kashmir and Quebec. Only one native P. australis population in Quebec was identified during field surveys on reported natural distribution of the species across Quebec province and all the populations from Kashmir turned out to be invasive as revealed by cpDNA PCR-RFLP analyses. Such findings indicate that invasive haplotypes are becoming more dominant in the natural distribution range of the species in the sites of study. This is the first study in India, especially in Kashmir Himalaya, that provides molecular evidence regarding the invasive status of P. australis in this region. Such successful invasion of alien haplotypes in their non-native range is due to the fact that invaders usually perform better than natives in terms of life-history traits such as mature plant size and fecundity, thereby reducing the size of, or even replacing, native populations [4,7]. Further studies in this direction need to be carried out by taking samples from a larger global range, including native European populations of P. australis, in order to provide greater understanding of the origin and phylogeography of this species.

3.1. Phenotypic Variation

Given the premise that the invasive populations perform better than native ones in terms of various growth-related traits, we found the highest values of seven growth-related traits of P. australis within invasive populations. These results are congruent with that of other studies [47,48,49], although DeVrie et al. [50] indicated that morphological characters cannot discriminate reliably between invasive and native P. australis individuals in North America. Further, local environment highly affects phenotypic traits in common reed [51], explaining the difficulty in differentiating invasive and native individuals from these traits. However, plasticity in common reed is trait-specific [51,52]. Similarly, Pysek et al. [53] compared the functional traits of 89 populations in a common garden experiment belonging to distinct clones of different origin: North America, Europe, Australia (two groups including native and invasive populations introduced from Europe), South Africa, and Far East. In general, both native and invasive populations with origins in Europe showed highest performance-related traits than other groups. North American native populations performed more poorly than both European-related groups and were similar in this respect to Australian and South African populations [53]. Invasive European populations in North America do suppress the native North American populations wherever growing in direct competition [54]. The weaker performance of Australian and South African populations in the Northern Hemisphere is due to weak genetic differences or environmental similarities [53].
Plant height plays an important role in invasiveness, as Crawley et al. [55] and Canavan et al. [56] found that tall-statured grasses harbor a useful functional trait for invasion success. In their review, Mozdzer et al. [57] clearly indicated that introduced and native P. australis lineages differ both physiologically and morphologically. Introduced plants are generally taller and occur in greater densities, which results in greater productivity in the introduced lineage in nearly every study.
In the present study, plant stem diameter appeared to be linked to invasiveness of P. australis, given that the highest mean values were recorded for invasive populations. Yet Muth and Pigliucci [58], in comparing six growth-related traits, found very little variation among introduced invasive and introduced non-invasive plant species within two genera of Asteraceae (Crepis and Centaurea), with respect to stem diameter. As our study included one native population, we suggest that any assumptions need to be confirmed with fine-scale studies over a broader distribution range of P. australis, taking into account an even larger number of populations.
Abundant flowering may also play an important role in reproductive success, which obviously influences propagule pressure and invasiveness. Our results that invasive plants in both regions significantly produce more flowers and seeds than native plants are quite striking. These traits can be taken as the indicator/s of plant invasiveness. In a survey of 46 native and 45 introduced populations of Solidago gigantea, Jakobs et al. [59] found that total plant biomass was larger for invasive than native plants. Some genetic studies have shown that abundant seed production and seed-based recruitment are more common in P. australis compared to dispersal by stolons and rhizomes [60,61,62]. Albert et al. [63], however, attributed the success of this invader in North America to a reproduction strategy combining both the advantages of generative and vegetative propagations.
Comparing the leaf characteristics of invasive and native populations showed that the former exhibit higher values for leaf area than the latter. Bimodal distribution observed for traits related to stem diameter, internode distance, leaf length, and width suggest that a major gene controls those four important characters related to leaf and stem sizes in P. australis. Although there was not significant among-population variation in leaf width, results from the present study revealed maximum leaf length and leaf width for invasive populations, while the lowest values were encountered in native population. Furthermore, variation in leaf width was very highly significant between haplotypes in the present study, with invaders appearing to perform better with respect to this quantitative trait as well. Successful invaders are characterized by a wider range of leaf areas and by greater phenotypic plasticity [64]. Several studies have shown that invasive species have higher resource capture-related traits and possess more efficient photosynthetic machinery compared to native or non-invasive species [11,65,66,67]. Invasiveness is strongly related to leaf traits that are associated with rapid C capture and net CO2 assimilation [68,69] and relative growth rate [70].

3.2. Characterization of Phenotypes

The characterization of among-haplotype variation could provide clues on co-selection of traits in case hitchhiking occurs [71]. Indeed, a group of characters may distinguish closely related taxa, which are geographically distant, because of genetic drift or hitchhiking. Similar effects are also observed when a major gene controls the characters of interest. Results of the present study revealed that at least stem diameter, leaf length, and width may undergo co-selection or the traits are under the control of the major gene. Genome-wide association studies in the species may provide more insights on the issue.

3.3. Genotypic Studies

After obtaining useful insights into phenotypic trait-based variations in native and invasive populations’ vis-à-vis invasiveness in P. australis, our objective was to confirm such variations at molecular level. Results from the present study indicate that in general, highest levels of genetic diversity are found in invasive populations, while the lowest levels of diversity are recorded in native population, consistent with [72]. The highest levels of genetic diversity in invasive populations may explain adaptability of invaders in non-native habitats [9,10]. The low levels of genetic diversity in the only one native population that was identified in the present study are congruent with the results of [73], which observed lower levels of genetic diversity in native P. australis populations than in invaders at many of cpDNA loci. This is contrary to what was observed by Zhao et al. [74], who reported highest genetic diversity among native Mexican populations of Solanum rostratum Dunal and significantly reduced diversity in invasive populations within the USA and China, using ten microsatellite markers. Since cpDNA PCR-RFLP haplotype identification analyses in the present study revealed only one native population, instead of five as thought on the basis of morphological variations, and all the other populations are exotic, it seems that invasion has either replaced the native populations or intraspecific hybridization might have occurred between native and introduced lineages of a species that has increased invasiveness and lead to the decline of native lineages [54]. We suggest that a broad-scale study including more continents than what has been done in our study, after identifying more native populations, be carried out to confirm or refute our findings.
Being a cryptic invader, P. australis has emerged as an important model system for understanding mechanisms of invasion. There have been few population-level studies to directly evaluate differences in genetic diversity, reproductive mode, and dispersal between native and non-native P. australis, particularly in western North America [62]. In view of the lack of any population genetics studies on P. australis in India, we have attempted here to assess its genetic diversity through allelic and population variation of microsatellite loci. It is noteworthy that the mean number of alleles per locus in the present study (A = 8.56) was comparable to the findings of Saltonstall [73] on European P. australis populations (A = 8.0), although it was greater than the average (A = 7.6) as reported by Paul et al. [75] on P. australis in the United Kingdom. In the present study, we most frequently came across tetraploidy and hexaploidy among regional groupings of invasive populations of P. australis that were collected across Quebec and Kashmir, although the native population in Quebec seems to be diploid. Hence, it appears that polyploidy might have played some role in invasiveness of this species. Clevering and Lissner [76] found that tetraploidy was the most common ploidy of P. australis in Europe and North America, while octaploids (8x) were predominated in Asia. Such results suggest that invasive plants are more likely to be polyploids, while native plants are more likely to be diploids as was reported in some other studies [77,78]. Pandit et al. [79] showed that invasive plant species are generally found to have high chromosome counts and to be polyploids, in contrast to rare species that are diploids and have lower ploidy ratios. In a related study, it was shown that the highly invasive plant species in Singapore were all polyploids [80], thereby indicating that polyploidy contributes to invasion success. Interestingly, invasive Kashmir and invasive Quebec populations of P. australis were more similar to one another, both in terms of the number of alleles and fragment size, than to the native Quebec population that showed unique numbers of alleles and fragment sizes. With an increased native population size, more differences might be seen. However, Saltonstall (2003a) [30] reported the same allelic variation among native P. australis, while highest allelic diversity was observed among introduced P. australis that were collected in North America.
Our results indicate that P. australis populations that were studied are structured, which is in agreement with Guo et al. [34]. While the latter study revealed the presence of substructures to delineate the population structure in common reed, Guo et al. [81] postulated that the climatic niche had shifted between the native and introduced populations of the invasive European lineage. The authors reported strong effects of geography and environment on the genetic structure of populations in the native range, but these effects were counteracted by human-related factors manifested through colonization of anthropogenic habitats in the introduced range. Another possible explanation of the substructures observed in our study may be borrowed from Albert et al. [63], who while investigating the reproduction of P. australis in eastern North America proposed that long-distance seed dispersal is imperative for common reed along roadsides and in marshes; whereas, plant fragments as well as seeds were shown to be important for dispersal to short distances along roads at least in the areas of its abundance. Further, robust reproductive strategy, both through sexual and asexual modes, was shown to mainly contribute to the invasive success of this species in North America. Our phylogenetic analysis easily identified three mains groups, with each group showing clear specificity in terms of the investigated traits.

3.4. Phenotypic vs. Genotypic Differentiation

Our results suggest that environmental conditions in Quebec and Kashmir are not as much contrasting to induce divergent selection on quantitative traits through strong local population pressures [82]. This is because there was no major variation in genetic structure between Quebec and Kashmir P. australis populations, and no significant phenotypic variation was recorded between Quebec and Kashmir populations, except for flower and seed dry mass. Such non-spatial geographic differences in phenotypic traits are not common and may be caused by probable multiple introductions [17,83]. However, difference in flower and seed dry mass between the regions indicates that there might be differential effect of selection on quantitative characters.
The among-population phenotypic divergence that was observed in this study regardless of region is not surprising and may be explained by several factors, including plasticity, genetic drift, and divergent selection. As RST differed to PST for six out of seven studied characters, divergent selection appears as the most probable cause of among-populations difference in quantitative traits [84]. No apparent physical barrier to gene flow existed between sampled populations within the region, suggesting that genetic barriers such as different ploidy levels or the high rate of local lateral vegetative propagation of the species may explain the reduced gene flow among populations. Results from the present study are in contrast with that of [30], which investigated patterns of differentiation in nine microsatellite loci in P. australis. Whether the observed phenotypic divergence in P. australis populations is heritable is not known. Investigating fine-scale local spatial invasions (i.e., within geographic regions) would certainly shed more light on the possible contributions of plasticity to patterns of among-population phenotypic variation in P. australis.
The RST-PST contrast is useful for evaluating the relative contributions of non-adaptive and adaptive processes in shaping quantitative traits. Local adaptation and evolutionary potential have been advocated as greatly influencing the outcomes of invasion by alien species [10,17]. Heritability estimates of the characters that were studied may provide clues on local adaptation. Results of the present study indicate local adaptation of invasive haplotypes for internode length, leaf length, and flower masses, indicating that these traits may influence invasion success in the species. On the other hand, isolation by distance or divergent selection are the main hypotheses that explain phenotypic divergence in nature within species [8]. As we observed a contrast between RST and PST estimates for six out of the seven traits that were investigated, we tested the correlation between genetic distances and geographical distances. Our results showed no or weak relationships between genetic and geographic distances in the regions that were surveyed. Thus, the hypothesis that could explain the phenotypic divergence observed between populations in traits that were investigated in our study is divergent selection for plant height, plant stem diameter, fresh and dry flower mass, leaf length, and leaf width coupled with local adaptation in internode length, leaf length, and flower masses. We also postulate that internode length variation between populations are explained by genetic drift. However, a large fine-scale study would confirm these findings.

4. Materials and Methods

4.1. Study Area and Target Species

The target species for the present study was P. australis. We specifically studied wild, alien invasive P. australis populations in the province of Quebec, Canada and Kashmir Himalaya, India (Figure 6 and Figure 7), in addition to five putative native populations of this species in Quebec that were assumed to be native. Information about nativity and distributional range of the species was obtained from web-based sources, such as the Germplasm Resource Information Network (GRIN; http://www.ars-grin.gov/), the United States Department of Agriculture (USDA Agricultural Research Service 2015 http://plants.usda.gov/ [85]), and the Integrated Taxonomic Information System (USDA Germplasm Resources Information Network https://doi.org/10.15482/USDA.ADC/1212393 [86]). However, information about the native populations in Quebec were obtained from the specimens of the target species that were stored in the two main herbaria of Quebec, viz., Louis-Marie Herbarium (QFA, Université Laval) and Marie-Victorin Herbarium (MT, Institut de recherche en biologie végétale, Université de Montréal), together with those held in the Kashmir University Herbarium (KASH), and the list of native populations provided by Lavoie et al. [87] onwards were also consulted.

4.2. Sampling Procedure

A total of 16 populations (Table 6) were investigated in Kashmir and Quebec for morphological traits, including five populations that were invasive to Kashmir; six putative populations that were invasive to Quebec, and five putative native populations in Quebec on the basis of morphometric traits [88]. Twenty-five individual plants, which were separated by at least 10 m from one another to increase the likelihood that they were distinct genets [62], were collected in each population. Morphological traits that were targeted in the present study included stem diameter, plant height, leaf length, leaf width, and internode length (Table 7). The status of populations (invasive or native) was recorded in the field based on morphological differences between plants [88].
A total of 20 populations were sampled in this study for genetic study, including nine populations from Kashmir and eleven populations from Quebec (Table 6). We designated only one population out of 20 populations as native, using cpDNA PCR-RFLP analysis. Collection sites in each region were separated by distances of 10–100 km. At each site, we collected one population, and, within each population, 25 individual plants were collected for molecular analysis. Fresh leaf samples (each about 1 cm2 in area) were collected in tubes with desiccant and kept frozen at −20 °C prior to DNA extraction. Genomic DNA from plant species was extracted using the CTAB method [89].

4.3. Genotyping

To verify whether P. australis individuals belonged to native or to introduced genotypes, a cpDNA PCR-RFLP analysis that had been developed by Saltonstall [41] was used. Briefly, two non-coding regions of the chloroplast genome [trnT (UGU)-trnL (UAA) and rbcL-psaI] were amplified using the primers described by Saltonstall [41]. PCR products were digested using the restriction enzyme RsaI for the trnLb region and HhaI for the rbcL region following the manufacturer’s protocol (Promega, Madison, WI). Restriction fragments were electrophoresed in ethidium bromide-stained 3% TAE agarose gels and visualized using UV light. We also searched for matches with a Blast tool provided by NCBI. To confirm the results, PCR products were sequenced on an ABI 16-capillary genetic analyzer 3130XL (Applied Biosystems, Foster City, CA, USA). Sequences were edited and aligned using BioEdit version 7.0.5 [90]. The BLASTn algorithm [91] was used to query GenBank (NCBI) to determine the closest P. austalis haplotype. Phylogenetic analyses were conducted using MEGA 7 software [92], and the Neighbour-Joining (NJ) method [93].
To assess the genetic diversity within and among populations of native and invasive P. australis across regions, we used a set of 9 cpDNA microsatellite loci, viz., PaGT-4, PaGT-8, PaGT-9, PaGT-11, PaGT-12, PaGT-13, PaGT-14, PaGT-16, and PaGT-22, which were developed by Saltonstall (Table 8) [30]. Amplifications were performed as two multiplexes and five single reactions, each in a total volume of 15 µl containing 50 ng of template DNA, 0.5 mM each of the two forward and reverse primers, 0.2mM dNTPs (Applied Biosystems, Life Technologies, New York, NY, USA), 1.5 mM MgCl2,1x PCR buffer (10 mMTris, pH 8.0, 50 m MKCl, and 50 mM ammonium sulphate; Sigma Aldrich, St. Louis, MO, USA), 0.5 mM Fluorochrome (Applied Biosystems, Life Technologies), and 1 unit of Taq DNA polymerase (Sigma-Aldrich). Multiplexes PCR employed an annealing temperature of 55 °C and amplified loci PaGT 4 with PaGT 14, and loci PaGT 8 with PaGT 13. Single PCR employed an annealing temperature of 55 °C for loci PaGT 9 and PaGT 12, and 56 °C for loci PaGT 11, PaGT 16, and PaGT 22. Single PCRs were subjected to the same reaction conditions as the multiplexes (Table 8).
Two PCR protocols with different annealing temperatures were used during this study (Table 8): (1) Amplification conditions were as follows: 94 °C for 3 min followed by 35 cycles of 94 °C for 30 s, 55 °C annealing for 30 s, 72 °C for 30 s, and a final extension of 72 °C for 5 min for loci PaGT 4 with PaGT 14, and loci PaGT 8 with PaGT 13, PaGT 9, and PaGT 12; (2) Amplification conditions were as follows: 94 °C for 4 min followed by 31 cycles of 94 °C for 45 s, 56 °C annealing for 2 min, 72 °C for 1 min, and a final extension of 72 °C for 2 min for loci PaGT 11, PaGT 16, and PaGT 22. Fragments were measured using an ABI PRISM 3130XL Analyzer (Applied Biosystems, Carlsbad, CA, USA) and scored using Gene mapper v4.0 software (Applied Biosystems).

4.4. Analysis of Phenotypic Data

Variance components were estimated in the Statistical Analysis System [94] with Proc Mixed using the restricted maximum likelihood analysis. Haplotype effects were fixed whereas region, population, and plant effects were assumed to be random, and data analyses were performed using the statistical model for a three-stage nested design [95]:
Yijkl = μ + τi + βj(k) + δ(ij)k + e(ijk)l
where Yijkl is the average value for the dependent variable for the ith region (Quebec or Kashmir), for the jth population nested in the ith region, for the kth haplotype (invasive or native) nested in the jth population and further in the ith region, and for the lth plant nested in the kth P. australis haplotype nested in the jth population further nested in the ith region; μ is the overall mean; τi, βj(k), δ(ij)k and e(ijk)l corresponded, respectively, to region effect (i.e., the between-region variance), to population effect (i.e., the among-population variance), to haplotype effect (i.e., the between-haplotype variance), and to plant effect (i.e., the within-population variance), the last term being the source of experimental error in the model. Post hoc multiple comparison of means was performed using Duncan Multiple Range Tests. PST values for each measured character were estimated using the following formula [22,96]:
PST = VAP/(VAP + 2VWP)
where VAP is the among-population variance and VWP the within-population variance.
To determine whether putative phenotypic differences are due to adaptive processes or not, an analogous of narrow-sense heritability (h2) estimate was computed as follows, as P. australis dispersal most often occurs through seeds than stolon and rhizomes [60,62]:
h2 = among-plant variance/total variance
Similarity among different P. australis populations and population groups was calculated using Euclidean distance performed on standardized variables [97], while hierarchical cluster analysis between populations was carried out on distance values using the R package pvclust [98]. We characterized haplotypes and plotted the phenotypic distribution for each trait using the R ggpubr program [99]. Principal components analysis (PCA) with phenotypic traits was applied to examine the pattern of phylogeographic groups, and how close they were to each other. PCA was performed using the Facto Mine R package [100].

4.5. Population Genetics Analyses

Given that P. australis plants sampled in this study were of different ploidy levels, descriptive statistics were performed using Polysat version 1.3 [101]. These statistics included the percentage of polymorphic loci (P), the mean number of alleles (A), the mean number of alleles per polymorphic locus (Ap), allelic richness (AR), and observed and expected heterozygosities (HO and HE) for each population [102], together with unbiased estimates of population differentiation for microsatellites (RST; [103]). Prior to analysis of molecular data, gametic disequilibrium verification between loci was performed using Fisher’s exact tests. Bruvo distances [104] were estimated between genotypes using Polysat version 1.3 and principal coordinates analysis was used to display population structure, using R package [105]. To measure the informative character of the SSR markers that were used in the present study, the polymorphism information contents (PIC) for each marker was calculated using as follows [106]:
PIC = 1 − Ʃi=1k Pi2
where k is the total number of alleles detected per locus and Pi the frequency of the allele i in all populations. Genetic similarity (GS) [107] was calculated as follows:
GS = 2Nij/(Ni + Nj)
where Nij is the number of fragments common to individuals i and j, and (Ni + Nj) is the total number of fragments in both individuals.
To assess the phylogenetic relationships between individuals, the distance matrix was computed as genetic distance (GD) among P. australis populations through the software microsatellite analyser (MSA) version 4.05, using the formula of Nei and Li [108], as follows:
GDxy = 1 − (2Nxy/Nx + Ny).
Where Nxy is the number of fragments common to individuals x and y, and (Nx + Ny) is the total number of fragments in both individuals.
Then, the phylogenetic tree was constructed using genetic distance (neighbor joining algorithm) of the 20 populations of P. australis using Phylip and Mega 6 software. Relationships between genetic and geographic distance were investigated using Mantel tests in the Isolation By Distance Web Service (IBDWS 3.23; [109]). Mantel Statistics was performed using 10,000 permutations to evaluate correlation between genetic and geographic distance.

5. Conclusions

In conclusion, it appears that invasive populations of P. australis exhibit better growth-related traits, especially fresh and dry mass of flowers and seeds. PCoA based on Bruvo distances clearly distinguished invasive and native populations from the sample regions. Highest levels of genetic diversity were found in invasive populations of P. australis in Kashmir Himalayan wetlands. The observed among-population phenotypic differences in the surveyed P. australis are explained by divergent selection, local adaptation, and genetic drift. Understanding the phylogeographic basis of such a diversity gradient remains an open challenge. Cluster and structure analysis delineated all populations of native and invasive P. australis from Quebec and Kashmir into five main groups, shedding some light on their evolutionary relationships. The important level of the genetic diversity reported in the present study should be considered in managing the native and invasive P. australis populations in Quebec and Kashmir. The results provide a first step for further investigations based on sampling from a larger global range, including native European populations of P. australis.

Author Contributions

This work is part of G.A.W.’s Ph.D. thesis research in the laboratories of M.A.S. and Z.A.R. at University of Kashmir, India and of D.P.K. at Université Laval, Canada. G.A.W. collected leaf materials in Kashmir and Quebec, performed laboratory work, and contributed to drafting the manuscript. M.A.S., Z.A.R. and D.P.K. conceived the project and contributed to the writing of the present manuscript. A.R.A. contributed to the collection of leaf samples in Quebec, analyzed data, and contributed to the writing of the present manuscript. H.T. contributed to statistical analysis and writing of the manuscript. Together, the authors revised and corrected the manuscript versions. All authors have read and agreed to the published version of the manuscript.

Funding

This work was financially supported by the DBT Indo-Canadian project No. BT/IN/IC-IMPACTS/30/MAS/2015-2016 to MAS and the joint IC-Impacts/DBT-Laval #01 to DPK.

Acknowledgments

The authors acknowledge the financial support of the Canadian Bureau for International Education (CBIE) in funding G.A.W. and a Natural Sciences and Engineering Research Council of Canada (NSERC) Discovery Grant to D.P.K. We thank Marie-Eve Beaulieu (Centre for Forest Research, Université Laval) for assistance in laboratory work and reading of previous drafts of the present manuscript. The grant to MAS under the DBT supported Indo-Canadian project No. BT/IN/IC-IMPACTS/30/MAS/2015-2016 and the joint IC-Impacts/DBT-Laval #01 grant to DK and MAS under IC-Impacts on ‘Biomonitoring of water quality in relation to human health using biosensors and nanoparticle based purification system’ are well acknowledged. We also thank Claude Lavoie (Université Laval) for providing the list of native population regions in Quebec.

Conflicts of Interest

The authors declare that they have no conflicts of interest.

Data Accessibility

The primer sequences (PaGT8-PaGT22) that were used in the present study have GenBank Accession Nos. AY230868-AY230876. We agree to deposit our data sequences to a public repository.

References

  1. Pimentel, D.; Zuniga, R.; Morrison, D. Update on the environmental and economic costs associated with alien-invasive species in the United States. Ecol. Econ. 2005, 52, 273–288. [Google Scholar] [CrossRef]
  2. Meyerson, L.A.; Mooney, H.A. Invasive alien species in an era of globalization. Front Ecol. Environ. 2007, 5, 199–208. [Google Scholar] [CrossRef]
  3. Callaway, R.M.; Maron, J.L. What have exotic plant invasions taught us over the past 20 years? Trends Ecol. Evol. 2006, 21, 369–374. [Google Scholar] [CrossRef] [PubMed]
  4. Rejmanek, M.; Richardson, D.M. What attributes make some plant species more invasive? Ecology 1996, 77, 1655–1661. [Google Scholar] [CrossRef]
  5. Ellstrand, N.C.; Schierenbeck, K.A. Hybridization as a stimulus for the evolution in plants? Proc. Nat. Acad. Sci. USA 2000, 97, 7043–7050. [Google Scholar] [CrossRef] [Green Version]
  6. Daehler, C.C. Performance comparisons of co-occurring native and invasive alien plants: Implications for conservation and restoration. Annu. Rev. Ecol. Syst. 2003, 34, 183–211. [Google Scholar] [CrossRef]
  7. Bossdorf, O.; Auge, H.; Lafuma, L.; Rogers, W.E.; Siemann, E.; Prati, D. Phenotypic and genetic differentiation between native and introduced plant populations. Oecologia 2005, 144, 1–11. [Google Scholar] [CrossRef]
  8. Funk, W.C.; Murphy, M.A. Testing evolutionary hypotheses for phenotypic divergence using landscape genetics. Mol. Ecol. 2010, 19, 427–430. [Google Scholar] [CrossRef] [PubMed]
  9. Maron, J.L.; Vila, M.; Bommarco, R.; Elmendorf, S.; Beardsley, P. Rapid evolution of an invasive plant. Ecol. Monogr. 2004, 74, 261–280. [Google Scholar] [CrossRef]
  10. Cano, L.; Escarre, J.; Fleck, I.; Blanco-Moreno, J.M.; Sans, F.X. Increased fitness and plasticity of an invasive species in its introduced range: A study using Senecio pterophorus. J. Ecol. 2008, 96, 468–476. [Google Scholar] [CrossRef]
  11. Van Kleunen, M.; Weber, E.; Fischer, M. A meta-analysis of trait differences between invasive and non-invasive plant species. Ecol. Lett. 2010, 13, 235–245. [Google Scholar] [CrossRef] [Green Version]
  12. Liao, H.; D’Antonio, C.M.; Chen, B.; Huang, Q.; Peng, S. How much do phenotypic plasticity and local genetic variation contribute to phenotypic divergences along environmental gradients in widespread invasive plants? A meta-analysis. Oikos 2016, 125, 907–917. [Google Scholar] [CrossRef]
  13. Forsman, A. Effects of genotypic and phenotypic variation on establishment are important for conservation, invasion and infection biology. Proc. Nat. Acad. Sci. USA 2014, 111, 302–307. [Google Scholar] [CrossRef] [Green Version]
  14. Leiblein-Wild, M.C.; Tackenberg, O. Phenotypic variation of 38 European Ambrosia artemisiifolia populations measured in a common garden experiment. Biol. Invasions 2014, 26, 2003–2015. [Google Scholar] [CrossRef] [Green Version]
  15. Monty, A.; Bizoux, J.P.; Escarré, J.; Mahy, G. Rapid plant invasions in distinct climates involves different sources of phenotypic variation. PLoS ONE 2013, 8, e55627. [Google Scholar] [CrossRef] [PubMed] [Green Version]
  16. Amsellem, L.; Noyer, J.L.; Le Bourgeois, T.; Hossaert-McKey, M. Comparison of genetic diversity of the invasive weed Rubus alceifolius Poir. (Rosaceae) in its native range and in areas of introduction, using amplified fragment length polymorphism (AFLP) markers. Mol. Ecol. 2000, 9, 443–455. [Google Scholar] [CrossRef]
  17. Lavergne, S.; Molofsky, J. Increased genetic variation and evolutionary potential drive the success of an invasive grass. Proc. Natl. Acad. Sci. USA 2007, 104, 3883–3888. [Google Scholar] [CrossRef] [Green Version]
  18. Tsutsui, N.D.; Suarez, A.V.; Holway, D.A.; Case, T.J. Reduced genetic variation and the success of an invasive species. Proc. Nat. Acad. Sci. USA 2000, 97, 5948–5953. [Google Scholar] [CrossRef] [PubMed] [Green Version]
  19. Sakai, A.K.; Allendorf, F.W.; Holt, J.S.; Lodge, D.M.; Molofsky, J.; With, K.A.; Baughman, S.; Cabin, R.J.; Cohen, J.E.; Ellstrand, N.C.; et al. The population biology of invasive species. Annu. Rev. Ecol. Syst. 2001, 32, 305–332. [Google Scholar] [CrossRef] [Green Version]
  20. Walker, N.F.; Hulme, P.E.; Hoelzel, A.R. Population genetics of an invasive species, Heracleum mantegazzianum: Implications for the role of life history, demographics and independent introductions. Mol. Ecol. 2003, 12, 1747–1756. [Google Scholar] [CrossRef]
  21. Genton, B.J.; Shykoff, J.A.; Giraud, T. High genetic diversity in French invasive populations of common ragweed, Ambrosia artemisiifolia, as a result of multiple sources of introduction. Mol. Ecol. 2005, 14, 4275–4285. [Google Scholar] [CrossRef] [PubMed]
  22. Spitze, K. Population structure in Daphnia obtusa–quantitative genetic and allozymic variation. Genetics 1993, 135, 367–374. [Google Scholar]
  23. Merilä, J. Quantitative trait and allozyme divergence in the greenfinch (Carduelis chloris, Aves: Fringillidae). Biol. J. Linn. Soc. 1997, 61, 243–266. [Google Scholar] [CrossRef]
  24. Bernatchez, L. Ecological theory of adaptive radiation: An empirical assessment from coregoninefishes (Salmoniformes). In Evolution Illuminated: Salmon and Their Relatives; Hendry, A.P., Stearns, S.C., Eds.; Oxford University Press: Oxford, UK, 2004; pp. 157–207. [Google Scholar]
  25. Lande, R. Neutral theory of quantitative genetic variance in an island model with local extinction and colonization. Evolution 1992, 46, 381–389. [Google Scholar] [CrossRef] [Green Version]
  26. Stapley, J.; Santure, A.W.; Dennis, S.R. Transposable elements as agents of rapid adaptation may explain the genetic paradox of invasive species. Mol. Ecol. 2018, 24, 2241–2252. [Google Scholar] [CrossRef] [PubMed]
  27. Wright, S. The interpretation of population structure by F-statistics with special regard to systems of mating. Evolution 1965, 19, 395–420. [Google Scholar] [CrossRef]
  28. Falconer, D.S.; Mackay, T.F.C. Introduction to Quantitative Genetics, 4th ed.; Longman: Essex, UK, 1996. [Google Scholar]
  29. Saltonstall, K. Cryptic invasion by a non-native genotype of Phragmites australis into North America. Proc. Nat. Acad. Sci. USA 2002, 99, 2445–2449. [Google Scholar] [CrossRef] [Green Version]
  30. Saltonstall, K. Microsatellite variation within and among North American lineages of Phragmites australis. Mol. Ecol. 2003, 12, 1689–1702. [Google Scholar] [CrossRef] [Green Version]
  31. Lambertini, C.; Gustafsson, M.H.G.; Frydenberg, J.; Lissner, J.; Speranza, M.; Brix, H. A phylogeographic study of the cosmopolitan genus Phragmites (Poaceae) based on AFLPs. Plant Syst. Evol. 2006, 258, 161–182. [Google Scholar] [CrossRef] [Green Version]
  32. Shah, M.A.; Reshi, Z. Characterization of alien aquatic flora of Kashmir Himalaya: Implications for invasion management. Trop. Ecol. 2012, 55, 143–157. [Google Scholar]
  33. Khuroo, A.A.; Rashid, I.; Reshi, Z.; Dar, G.H.; Wafai, B.A. The alien flora of Kashmir Himalaya. Biol. Invasions 2007, 9, 269–292. [Google Scholar] [CrossRef]
  34. Guo, W.-Y.; Lambertini, C.; Pyšek, P.; Meyerson, L.A.; Brix, H. Evolutionary mechanisms act differently in the native and introduced ranges of an invasive plant. Ecol. Evol. 2018, 8, 2440–2452. [Google Scholar] [CrossRef] [PubMed]
  35. Blossey, B. Phragmites: Common reed. Morphological differences between native and introduced genotypes. Cornell University Ecology and Management of Invasive Plants Program, Department of Natural Resources. 2012. Available online: http://www.invasiveplants.net/phragmites/morphology.htm (accessed on 15 June 2013).
  36. Saltonstall, K.; Peterson, P.M.; Soreng, R.J. Recognition of Phragmites australis subsp. americanus (Poaceae: Arundinoideae) in North America: Evidence from morphological and genetic analyses. Sida Contrib. Bot. 2004, 21, 683–692. [Google Scholar]
  37. Lambert, A.M.; Casagrande, R.A. Distribution of native and exotic Phragmites australis in Rhode Island. Northeast. Nat. 2006, 13, 551–560. [Google Scholar] [CrossRef]
  38. Lelong, B.; Lavoie, C.; Jodoin, Y.; Belzile, F. Expansion pathways of the exotic common reed (Phragmites australis): A historical and genetic analysis. Divers. Distrib. 2007, 13, 430–437. [Google Scholar] [CrossRef]
  39. Jodoin, Y.; Lavoie, C.; Villeneuve, P.; Theriault, M.; Beaulieu, J.; Belzile, F. Highways as corridors and habitats for the invasive common reed Phragmites australis in Quebec, Canada. J. Appl. Ecol. 2008, 45, 459–466. [Google Scholar] [CrossRef]
  40. Meadows, R.E.; Saltonstall, K. Distribution of native and introduced Phragmites australis in freshwater and oligohaline tidal marshes of the Delmarva peninsula and southern New Jersey. J. Torrey Bot. Soc. 2009, 134, 99–107. [Google Scholar] [CrossRef]
  41. Saltonstall, K. A rapid method for identifying the origin of North American Phragmites populations using RFLP analysis. Wetlands 2003, 23, 1043–1047. [Google Scholar] [CrossRef]
  42. Salstontall, K. A set of primers for amplification of noncoding regions of chloroplast DNA in the grasses. Mol. Ecol. Notes 2001, 1, 76–78. [Google Scholar] [CrossRef]
  43. Shah, M.A.; Reshi, Z.A.; Lavoie, C. Predicting plant invasiveness from native range size: Clues from Kashmir Himalaya. J. Plant Ecol. 2012, 5, 167–173. [Google Scholar] [CrossRef] [Green Version]
  44. Shah, M.A.; Callaway, R.M.; Shah, T.; Houseman, G.R.; Pal, R.W.; Xiao, S.; Rosche, C.; Reshi, Z.; Khasa, D.P.; Chen, S. Conyza canadensis suppresses plant diversity in its nonnative ranges but not at home: A transcontinental comparison. New Phytol. 2014, 202, 1286–1296. [Google Scholar] [CrossRef] [PubMed]
  45. Wani, G.A.; Shah, M.A.; Reshi, Z.A.; Dar, M.A. Polyploidy determines the stage of invasion: Clues from Kashmir Himalayan aquatic flora. Acta Physiol. Plant. 2018, 40, 58. [Google Scholar] [CrossRef]
  46. Colautti, R.I.; MacIsaac, H.J. A neutral terminology to define ‘invasive’ species. Divers. Distrib. 2004, 10, 135–141. [Google Scholar] [CrossRef]
  47. Meadows, R.E. Above Ground Competition between Native and Introduced Phragmites in Two Tidal Marsh Basins in Delaware. Master’s Thesis, Delaware State University, Dover, UK, 2006. [Google Scholar]
  48. Mozdzer, T.J.; Zieman, J.C. Ecophysiological differences between genetic lineages facilitate the invasion of non-native Phragmites australis in North American Atlantic coast wetlands. J. Ecol. 2010, 98, 451–458. [Google Scholar] [CrossRef]
  49. Mozdzer, T.J.; Megonigal, J.P. Jack-and-Master trait responses to elevated CO2 and N: A Comparison of native and introduced Phragmites australis. PLoS ONE 2012, 7, e42794. [Google Scholar] [CrossRef]
  50. DeVries, A.E.; Kowalski, K.P.; Bickford, W.A. Growth and Behavior of North American Microbes on Phragmites australis Leaves. Microorganisms 2020, 8, 690. [Google Scholar] [CrossRef]
  51. Ren, L.; Guo, X.; Liu, S.; Guo, W.; Wang, R.; Ye, S.; Lambertini, C.; Brix, H.; Eller, F. Intraspecific variation in Phragmites australis: Clinal adaptation of functional traits and phenotypic plasticity vary with latitude of origin. J. Ecol. 2020. [Google Scholar] [CrossRef]
  52. Bellavance, M.; Brisson, J. Spatial dynamics and morphological plasticity of common reed (Phragmites australis) and cattails (Typha sp.) in freshwater marshes and roadside ditches. Aquat. Bot. 2010, 93, 129–134. [Google Scholar] [CrossRef]
  53. Pyšek, P.; Skálová, H.; Čuda, J.; Guo, W.Y.; Doležal, J.; Kauzál, O.; Lambertini, C.; Pyšková, K.; Brix, H.; Meyerson, L.A. Physiology of a plant invasion: Biomass production, growth and tis-sue chemistry of invasive and native Phragmites australis populations. Preslia 2019, 91, 51–75. [Google Scholar] [CrossRef]
  54. Meyerson, L.A.; David, V.V.; Rebecca, N.B. Hybridization of invasive Phragmites australis with a native subspecies in North America. Biol. Invasions 2010, 12, 103–111. [Google Scholar] [CrossRef] [Green Version]
  55. Crawley, M.J.; Harvey, P.H.; Purvis, A. Comparative ecology of the native and alien floras of the British Isles. Philos. Trans. Biol. Sci. 1996, 351, 1251–1259. [Google Scholar]
  56. Canavan, S.; Meyerson, L.A.; Packer, J.G.; Pyšek, P.; Maurel, N.; Lozano, V.; Richardson, D.M.; Brundu, G.; Canavan, K.; Cicatelli, A.; et al. Tall-statured grasses: A useful functional group for invasion science. Biol. Invasions 2019, 21, 37–58. [Google Scholar] [CrossRef]
  57. Mozdzer, T.J.; Brisson, J.; Hazelton, E.L.G. Physiological ecology and functional traits of North American native and Eurasian introduced Phragmites australis lineages. AoB Plants 2013, 5, plt048. [Google Scholar] [CrossRef]
  58. Muth, N.Z.; Pigliucci, M. Traits of invasives reconsidered: Phenotypic comparisons of introduced invasive and introduced non-invasive plant species within two closely related clades. Am. J. Bot. 2006, 93, 188–196. [Google Scholar] [CrossRef] [PubMed]
  59. Jakobs, G.; Weber, E.; Edwards, P.J. Introduced plants of the invasive Solidago gigantea (Asteraceae) are larger and grow denser than conspecifics in the native range. Divers. Distrib. 2004, 10, 11–19. [Google Scholar] [CrossRef]
  60. Belzile, F.; Labbe, J.; Leblanc, M.C.; Lavoie, C. Seeds contribute strongly to the spread of the invasive genotype of the common reed (Phragmites australis). Biol. Invasions 2010, 12, 2243–2250. [Google Scholar] [CrossRef]
  61. McCormick, M.K.; Kettenring, K.M.; Baron, H.M.; Whigham, D.F. Spread of invasive Phragmites australis in estuaries with differing degrees of development: Genetic patterns, Allee effects and interpretation. J. Ecol. 2010, 98, 1369–1378. [Google Scholar] [CrossRef] [Green Version]
  62. Kettenring, K.M.; Mock, K.E. Genetic diversity, reproductive mode, and dispersal differ between the cryptic invader, Phragmites australis and its native conspecific. Biol. Invasions 2012, 12, 2489–2504. [Google Scholar] [CrossRef]
  63. Albert, A.; Brisson, J.; Belzile, F.; Turgeon, J.; Lavoie, C. Strategies for a successful plant invasion: The reproduction of Phragmites australis in north-eastern North America. J. Ecol. 2015, 103, 1529–1537. [Google Scholar] [CrossRef]
  64. Liao, Z.Y.; Scheepens, J.F.; Li, W.T.; Wang, R.F.; Zheng, Y.L.; Feng, Y.L. Biomass reallocation and increased plasticity might contribute to successful invasion of Chromolaena odorata. Flora 2019, 256, 79–84. [Google Scholar] [CrossRef]
  65. Feng, Y.-L.; Wang, J.-F.; Sang, W.-G. Biomass allocation, morphology and photosynthesis of invasive and non-invasive exotic species grown at four irradiance levels. Acta Oecol. 2007, 31, 40–47. [Google Scholar] [CrossRef]
  66. Pysek, P.; Richardson, D.M. Traits associated with invasiveness in allien plants. J. Biogeogr. 2007, 33, 2040–2050. [Google Scholar]
  67. Schlaepfer, D.R.; Edwards, P.; Billeter, R. Why only tetraploid Solidago gigantean (Asteraceae) became invasive: A common garden comparison of ploidy levels. Oecologia 2010, 163, 661–673. [Google Scholar] [CrossRef] [Green Version]
  68. Baruch, Z.; Goldstein, G. Leaf construction cost, nutrient concentration, and net CO2 assimilation of native and invasive species in Hawaii. Oecologia 1999, 121, 183–192. [Google Scholar] [CrossRef]
  69. Shipley, B. Net assimilation rate, specific leaf area and leaf mass ratio: Which is most closely correlated with relative growth rate: A meta-analysis. Funct. Ecol. 2006, 20, 565–574. [Google Scholar] [CrossRef]
  70. Rejmanek, M.; Richardson, D.M.; Higgins, S.I.; Pitcairn, M.J.; Grotkopp, E. Ecology of invasive plants: State of the art. In Invasive Alien Species: A New Synthesis; Mooney, H.A., Mack, R.N., McNeely, J.A., Neville, L.E., Schei, P.J., Waage, J.K., Eds.; Island Press: Washington, DC, USA, 2005; pp. 104–161. [Google Scholar]
  71. Qian, L.; Qian, W.; Snowdon, R.J. Haplotype hitchhiking promotes trait coselection in Brassica napus. Plant Biot. J. 2016, 14, 15781588. [Google Scholar]
  72. Plut, K.; Paul, J.; Ciotir, C.; Major, M.; Freeland, J.R. Origin of non-native Phragmites australis in North America, a common wetland invader. Fundam. Appl. Limnol. 2011, 179, 121–129. [Google Scholar] [CrossRef]
  73. Saltonstall, K. Genetic variation among North American populations of Phragmites australis: Implications for management. Estuaries 2003, 26, 444–451. [Google Scholar] [CrossRef]
  74. Zhao, J.; Solis-Montero, L.; Lou, A.; Vallejo-Marin, M. Population structure and genetic diversity of native and invasive populations of Solanum rostratum (Solanaceae). PLoS ONE 2013, 8, e79807. [Google Scholar] [CrossRef] [Green Version]
  75. Paul, J.; Kirk, H.; Freeland, J. Genetic diversity and differentiation of fragmented reed beds (Phragmites australis) in the United Kingdom. Hydrobiologia 2011, 665, 107–115. [Google Scholar] [CrossRef]
  76. Clevering, O.A.; Lissner, J. Taxonomy, chromosome numbers, clonal diversity and population dynamics of Phragmites australis. Aquat. Bot. 1999, 64, 185–208. [Google Scholar] [CrossRef]
  77. Lowry, E.; Lester, S.E. The biogeography of plant reproduction: Potential determinants of species’ range sizes. J. Biogeogr. 2006, 33, 1975–1982. [Google Scholar] [CrossRef]
  78. Te Beest, M.; Le Roux, J.J.; Richardson, D.M.; Brysting, A.K.; Suda, J.; Kubesova, M.; Pysek, P. The more the better? The role of polyploidy in facilitating plant invasions. Ann. Bot. 2012, 109, 19–45. [Google Scholar] [CrossRef] [PubMed] [Green Version]
  79. Pandit, M.K.; Pocock, M.J.O.; Kunin, W.E. Ploidy influences rarity and invasiveness in plants. J. Ecol. 2011, 99, 1108–1115. [Google Scholar] [CrossRef]
  80. Pandit, M.K.; Tan, H.T.W.; Bisht, M.S. Polyploidy in invasive plant species of Singapore. Bot. J. Linn. Soc. 2006, 151, 395–403. [Google Scholar] [CrossRef] [Green Version]
  81. Guo, W.-Y.; Lambertini, C.; Li, X.-Z.; Meyerson, L.A.; Brix, H. Invasion of Old World Phragmites australis in the New World: Precipitation and temperature patterns combined with human influences redesign the invasive niche. Global Chang. Biol. 2013, 19, 3406–3422. [Google Scholar] [CrossRef]
  82. McKay, J.K.; Latta, R.G. Adaptive population divergence: Markers, QTL and traits. Trends Ecol. Evol. 2002, 17, 285–291. [Google Scholar] [CrossRef]
  83. Kolbe, J.J.; Glor, R.E.; Schettino, L.R.; Lara, A.C.; Larson, A.; Losos, J.B. Multiple sources, admixture, and genetic variation in introduced Anolis lizard populations. Conserv. Biol. 2007, 21, 1612–1625. [Google Scholar] [CrossRef]
  84. Latta, R.G. Gene flow, adaptive population divergence and comparative population structure across loci. New Phytol. 2003, 161, 51–58. [Google Scholar] [CrossRef]
  85. (Dataset) USDA Agricultural Research Service. Germplasm Resources Information Network (GRIN). Ag Data Commons. 2015. Available online: https://doi.org/10.15482/USDA.ADC/1212393 (accessed on 23 February 2004).
  86. Integrated Taxonomic Information System [Online]. United States Department of Agriculture (Producer). 2002. Available online: http://www.itis.usda.gov/ (accessed on 23 February 2004).
  87. Lavoie, C.; Jean, M.; Delisle, F.; Letourneau, G. Exotic plant species of the St Lawrence River wetlands: A spatial and historical analysis. J. Biogeogr. 2003, 30, 537–549. [Google Scholar] [CrossRef]
  88. Hansen, D.L.; Lambertini, C.; Jampeetong, A.; Brix, H. Clone-specifics differences in Phragmites australis: Effects of ploidy level and geographic origin. Aquat. Bot. 2007, 86, 269–279. [Google Scholar] [CrossRef] [Green Version]
  89. Doyle, J.J.; Doyle, J.L. A rapid DNA isolation procedure for small quantities of fresh leaf tissue. Phytochem. Bull. 1987, 19, 11–15. [Google Scholar]
  90. BioEdit. Available online: http://www.mbio.ncsu.edu/BioEdit/bioedit.html/ (accessed on 10 January 2018).
  91. BLASTn. Available online: http://www.ncbi.nlm.nih.gov/BLAST/ (accessed on 11 January 2018).
  92. Tamura, K.; Stecher, G.; Peterson, D.; Filipski, A.; Kumar, S. MEGA6: Molecular Evolutionary Genetics Analysis version 6.0. Mol. Biol. Evol. 2013, 30, 2725–2729. [Google Scholar] [CrossRef] [PubMed] [Green Version]
  93. Saitou, N.; Nei, M. The neighbor-joining method a new method for reconstructing phylogenetic trees. Mol. Biol. Evol. 1987, 4, 406–425. [Google Scholar] [PubMed]
  94. SAS, Institute Inc. SAS 9.3 Software; SAS Institute: Cary, NC, USA, 2012. [Google Scholar]
  95. Montgomery, D.C. Design and Analysis of Experiments, 10th ed.; Wiley: New York, NY, USA, 2007; 688p. [Google Scholar]
  96. Raeymaekers, J.A.M.; van Houdt, J.K.J.; Larmuseau, M.H.D.; Geldof, S.; Volckaert, F.A.M. Divergent selection as revealed by PST and QTL-based FST in three-spined stickleback (Gasterosteus aculeatus) populations along a coastal-inland gradient. Mol. Ecol. 2007, 16, 891–905. [Google Scholar] [CrossRef] [PubMed]
  97. Legendre, P.; Legendre, L. Numerical Ecology, 2nd ed.; Elsevier: Amsterdam, The Netherlands, 1998. [Google Scholar]
  98. Suzuki, R.; Shimodaira, H. Pvclust: An R package for assessing the uncertainty in hierarchical clustering. Bioinformatics 2006, 22, 1540–1542. [Google Scholar] [CrossRef]
  99. ggpubr: “ggplot2” Based Publication Ready Plots. R Package Version 0.1 7. Available online: https://rpkgs.datanovia.com/ggpubr/ (accessed on 27 June 2020).
  100. Lę, S.; Josse, J.; Husson, F. FactoMine R: An R package for multivariate analysis. J. Stat. Softw. 2008, 25, 1–18. [Google Scholar] [CrossRef] [Green Version]
  101. Clark, L.V.; Jasieniuk, M. Polysat: An R package for polyploidy microsatellite analysis. Mol. Ecol. Resour. 2012, 11, 562–566. [Google Scholar] [CrossRef]
  102. Weir, B.S. Genetic Data Analysis II; Sinauer Associates: Sunderland, MA, USA, 1996; p. 445. [Google Scholar]
  103. Slatkin, M. A measure of population subdivision based on microsatellite allele frequencies. Genetics 1995, 139, 457–462. [Google Scholar]
  104. Bruvo, R.; Michels, N.K.; De Souza, T.G.; Schulen-Burg, H. A simple method for the calculation of microsatellite genotype distances irrespective of ploidy level. Mol. Ecol. 2004, 13, 2101–2106. [Google Scholar] [CrossRef]
  105. R Core Team. A Language and Environment for Statistical Computing; R Foundation for Statistical Computing: Vienna, Austria, 2016. [Google Scholar]
  106. Nei, M. Analysis of gene diversity in subdivided populations. Proc. Nat. Acad. Sci. USA 1973, 70, 3321–3323. [Google Scholar] [CrossRef] [Green Version]
  107. Dice, L.R. Measures of the amount of ecologic association between species. Ecology 1945, 26, 297–302. [Google Scholar] [CrossRef]
  108. Nei, M.; Li, W.H. Mathematical model for studying genetic variation in terms of endonucleases. Proc. Natl. Acad. Sci. USA 1979, 76, 5269–5273. [Google Scholar] [CrossRef] [PubMed] [Green Version]
  109. Jensen, J.L.; Bohonak, A.J.; Kelley, S.T. Isolationbydistance, web service. BMC Genet. 2005, 6, 13. [Google Scholar] [CrossRef] [Green Version]
Figure 1. Biplot analysis of the studied 16 groups of Phragmites australis plants from three environments (Kashmir invasive, Quebec invasive, and Quebec native) based on seven morphological traits.
Plants 09 01392 g001
Figure 2. Distribution of phenotypes for the plant height (upper left), stem diameter (upper right), leaf length (bottom left), and leaf width (bottom right) are represented by histogram based on the average phenotype value of each Phragmites plants across different environments.
Plants 09 01392 g002
Figure 3. Principal component analysis plot showing different haplotypes for 378 Phragmites plants based of seven phenotypic traits.
Plants 09 01392 g003
Figure 4. Principal coordinate analysis with Bruvo distances, based on molecular data displaying population structure of Kashmir and Quebec invasives and Quebec native Phragmites between principal component analysis (PCA) 1 and PCA 2 (Blue—Quebec invasive populations; Green—Quebec native population; Red—Kashmir invasive populations).
Plants 09 01392 g004
Figure 5. Phylogenetic tree of Phragmites australis populations in native and invasive ranges based on SSR markers using the neighbor-joining method. Colors on branches classified subpopulations, mainly differentiated by geographical origin and ranges.
Plants 09 01392 g005
Figure 6. Map of the study area showing the distribution of sampling sites in different aquatic habitats of Kashmir Himalaya.
Plants 09 01392 g006
Figure 7. Map of the study area showing the distribution of sampling sites in different habitats of Quebec, Canada.
Plants 09 01392 g007
Table 1. The summary statistics (mean and standard error (± SE)) of measured seven phenotypic traits of invasive and native species of Phragmites australis in 16 populations from Kashmir, India and Quebec, Canada (QN1 = native population from Quebec; QE = invasive population in Quebec; KE = invasive population in Kashmir).
PopulAtionPlant Height (cm) ± SEPlant Stem Diameter (mm) ± SEFresh Mass Flowers and Seeds (g) Per Plant ± SEDry Mass Flowers and Seeds (g) Per Plant ± SEInternodal Length (cm) Per Plant ± SELeaf Length (cm) ± SELeaf Width (cm) ± SE
QN1191.64 ± 30.388 cde5.06 ± 1.794 fg0.71 ± 0.594 h0.17 ± 0.102 f8.86 ± 2.69 h30.90 ± 3.453 fg1.94 ± 0.220 d
QE12135.20 ± 24.643 f5.27 ± 1.315 efg2.96 ± 2.44 fg1.61 ± 1.072 e12.52 ± 1.921 ef28.99 ± 6.632 g1.64 ± 0.377 fg
QE1176.39 ± 35.788 e6.22 ± 1.479 cd6.07 ± 2.929 bcd3.15 ± 1.443 bc16.16 ± 2.407 b33.48 ± 8.262 ef1.80 ± 0.317 def
QE3193.88 ± 22.643 cde5.84 ± 0.828 def6.29 ± 3.408 bcd3.49 ± 1.952 bc12.63 ± 2.383 ef28.56 ± 4.827 g1.32 ± 0.204 h
QE4230.74 ± 55.540 a6.73 ± 1.110 bc6.84 ± 3.155 abc3.64 ± 1.592 bc14.40 ± 1.854 cd46.80 ± 6.018 ab1.70 ± 0.257 efg
QE6212.44 ± 68.965 abc6.36 ± 0.970 cd3.84 ± 3.053 efg1.71 ± 1.527 e13.89 ± 2.577 cde46.52 ± 6.170 ab1.88 ± 0.212 de
QE7202.36 ± 37.629 cd6.29 ± 1.398 cd5.20 ± 3.428 cde2.99 ± 1.941 bc16.77 ± 2.266 ab42.50 ± 6.013 cd1.76 ± 0.235 def
QE8226.72 ± 34.632 ab6.85 ± 1.408 bc7.90 ± 4.116 ab3.91 ± 2.029 ab18.00 ± 3.749 a41.57 ± 4.219 d1.77 ± 0.218 def
QE9173.32 ± 26.353 e4.90 ± 1.034 g3.91 ± 1.981 efg1.88 ± 1.046 de7.54 ± 1.233 h34.13 ± 4.088 ef1.59 ± 0.279 fg
QE10176.46 ± 30.863 e6.05 ± 1.343 cde5.94 ± 4.227 bcd2.76 ± 1.933 cd10.89 ± 3.365 g34.81 ± 5.410 e1.50 ± 0.158 gh
QE11126.48 ± 23.901 f4.99 ± 0.937 g2.65 ± 2.049 g1.40 ± 1.111 e12.63 ± 2.383 ef28.56 ± 4.827 g1.32 ± 0.203 h
KE1206.56 ± 29.509 bcd7.24 ± 1.556 ab5.89 ± 2.507 cd3.40 ± 1.558 bc13.88 ± 2.850 cde41.74 ± 4.601 d3.00 ± 0.706 a
Means that are followed by the same letter in columns are not significantly different using Duncan’s Multiple Range Test; native population (QN1) in bold.
Table 2. Variance in Phragmites australis morphological characters from sixteen natural stands in Québec, Canada and Kashmir, India (SE = Standard Error).
Source of VariationPlant HeightPlant Stem DiameterFresh Mass of Flowers and SeedsDry Mass of Flowers and SeedsLeaf LengthInternodal LengthLeaf Width
Variance ± SEp-ValueVariance ± SEp-ValueVariance ± SEp-ValueVariance ± SEp-ValueVariance ± SEp-ValueVariance ± SEp-ValueVariance ± SEp-Value
Region0 0.965 ± 1.4580.25410.366 ± 1.092<0.370.37 ± 0.01<0.00131.5 ± 52.660.27660 0.69 ± 0.9890.242
Population (Region)730.06 ± 304.250.00820.371 ± 0.1740.01652.160 ± 1.0590.02070.577 ± 0.29<0.00138.83 ± 5.7540.0076.07 ± 2.4060.00580.0298 ± 0.02280.095
Haplotype (Population (Region))20.76 ± 0.00 0 0.140 ± 0 0.051 ± 0 0.0142 ± 0 0 0.0233 ± 0.002<0.001
Plant (Haplotype (Population (Region)))1227.30 ± 91.39<0.00010.555 ± 0.125<0.0017.846 ± 0.654<0.0011.743 ± 0.195<0.000127.55 ± 2.34<0.0016.08 ± 0.518<0.0010
Residual1.0096 1.123 ± 0 0.932 ± 0 0.879 ± 0 1.155 ± 0 0.884 ± 0 0.1144 ± 0.0085<0.001
PST0.23 0.25 0.12 0.14 0.41 0.33 0.39
h20.094 0.184 0.685 0.481 0.278 0.466 0
Table 3. Principal component analysis of seven Phragmites australis descriptors.
Eigen Vectors
Component NumberPC1PC2
Standard Deviation2.091.11
Proportion of Variance (%)61.8417.49
Cumulative Proportion (%61.8479.33
Eigen Values
Plant_height−0.33-0.02
Stem_diameter−0.45-0.22
Fresh_flowers−0.400.37
Dry_flowers−0.410.31
Internode_distance−0.300.48
Leaf_length−0.41-0.31
Leaf_width−0.31-0.62
Table 4. Microsatellite loci and allelic diversity measures in invasive and native Phragmites australis populations from Quebec, Canada and Kashmir, India.
LociAllele Size Range (bp)Number of Alleles PIC
KEQEQN1KEQEQN1
PaGT 4291–295293–2972851–31–310.8
PaGT 14191–209201–2081992–31–310.9
PaGT 8192–196194–1961961–31–210.7
PaGT 13225–229227–229227–2371–31–310.5
PaGT 9209–247209–2292312–41–21–20.9
PaGT 11160–166160–166160–1622–61–310.4
PaGT 22201–222190–226201–2151–41–31–20.9
PaGT 12183–189183–190183–1901–41–31–20.9
PaGT 16248–325275–3092821–41–410.9
Mean 0.8
PIC: Polymorphic information content; KE, QE, QN are invasive haplotype from Kashmir, invasive haplotype from Quebec, and native haplotype from Quebec, respectively.
Table 5. Population genetic diversity parameters estimated in 19 invasive Phragmites australis populations of Quebec (Canada) and Kashmir (India) and one native population of the species in Quebec, based on nine microsatellite markers.
PopnnPAApARHOHE
KE1241004.222.822.390.6930.595
KE22477.782.002.041.820.6890.434
KE32488.892.332.291.980.7150.511
KE4241003.332.632.160.7220.543
KE5241003.782.722.250.7370.577
KE6241004.563.372.540.7790.665
KE7241003.892.432.150.6410.543
KE8241003.783.102.40.7310.598
KE92466.672.112.171.810.5690.406
QE12488.893.562.162.060.3750.445
QE32488.892.441.791.810.4630.380
QE4241002.561.931.950.4950.441
QE62488.892.442.001.890.050.451
QE7241003.001.921.940.4630.408
QE82488.892.331.961.890.5090.445
QE92488.892.441.801.770.3930.354
QE10241002.782.071.930.3660.424
QE11241003.562.322.180.5790.521
QE122488.891.891.611.590.3210.291
QN12488.892.221.721.540.2280.204
Overall Mean 2492.78 8.564.162.000.5250.461
Abbreviations: Popn = population name; n = sample size; P = percentage of polymorphic loci; A = mean number of alleles per locus; Ap = mean number of alleles per polymorphic locus; AR = Allelic richness; HO = mean observed heterozygosity within populations; HE = mean expected heterozygosity within populations diver.
Table 6. Geographic locations of Phragmites australis populations that were sampled in a study assessing and comparing the phenotypic and genetic diversity of the species in Quebec and Kashmir (India) with their putative population type as identified by morphometric characters (KE: alien invasive haplotype from Kashmir (India); QE: alien invasive haplotype from Quebec (Canada); QN1: native haplotype from Quebec; * populations that were sampled for phenotypic study; ‡: populations that were sampled for genotypic study; a.s.l = above sea level).
RegionSite of CollectionPopulationTypeLatitude (N)LongitudeElevation (m a.s.l)
KashmirForshoreKE1 *invasive34°5′19″E 74°30′44″1597
AshaibaghKE2 *invasive34°4′11″E 74°30′5″1579
NageenKE3 *invasive34°3′51″E 74°29′59″1595
RangharstopKE4 *invasive34°3′46″E 74°29′15″1583
KuhumusWullarKE5 *invasive34°12′1″E 74°21′35″1580
SaderkotewullarKE6 invasive34°13′40″E 74°27′43″1578
ShalimarKE7 invasive34°50′5″E 74°30′52″1583
Dal LakeKE8 invasive34°37′19″E 74°30′57″1585
GanderbalKE9 invasive34°8′9″E 74°27′57″1572
QuebecLa PocatièreQE1 *invasive47°20′27″W 70°5′41″6.7
St GrégoireQE3 *invasive46°14′27″W 72°33′6″32.3
Ange - GardienQE4 *invasive45°21′49″W 72°55′50″97
EastmanQE6 *invasive45°17′53″W 72°18′32″273
PrincevilleQE7 *invasive46°11′45″W 71°54′40″123.7
BernièreQE8 *invasive46°41′47″W 71°18′13″76.8
Lac St FrancoisQN1 Native45°2′29″W 74°27′47″47
Lac St LouisQE9 invasive45°23′57″W 73°45′43″28.6
Parc Louis RacineQE10 invasive45°30′54″W73°18′16″20.3
Sablière ColetteQE11 invasive45°54′36″W73°10′35″8
La PocatièreQE12 invasive47°20′27″W70°5′46″6.7
Table 7. Traits measured and methods that were used in a study aimed at investigating the phenotypic and genetic diversity of P. australis in Kashmir and Quebec.
TraitsMethod Used
Stem diameterStem diameter was determined by measuring stem circumference at 25 cm above the ground surface using a metre tape graduated in 0.1 cm increments.
Plant heightPlant height was measured from soil surface to the apical node of the tallest shoot in each plant using measuring ruler tape.
Leaf length and leaf widthLeaf length and leaf width were measured at 2 cm from the axil of leaf using plastic measuring scale. These measurements were taken six times per individual plant
Internode lengthInternode length was measured (±1 mm) from top to bottom of the plant using plastic measuring scale. These measurements were taken six times per individual plant
Fresh mass of flowers and seedsFlowers and seeds from the entire seed heads were cut off from each individual plant were sampled to measure fresh mass flowers and seeds using a portable electronic scale that was graduated to 0.001 g (Mitutoyo, Japan)
Dry mass of flowers and seedsThe collected flowers and seeds were oven-dried at 70 °C for 3 to 4 days to determine the biomass of entire seed head from individual plant using a portable electronic scale that was graduated to 0.001 g
Table 8. Microsatellite loci optimized for population genetics analysis.
ConditionsLoci1 Primer Sequences (5′–R′)DyesPCR
Protocol Tested
Ta(°C)
Multiplex 1PaGT 4 F: TGCTCCCTGCCAGTTTCTTGVICMcCormick et al. (2010) [61]55
 R: TATCCACCCTTCGAAGGCAC
PaGT 14 F: GTTGCAGCAAGTATTTGGVICIdem55
 R: CAAGCATTCTAGTAGTAGC
Multiplex 2PaGT 8 F: TCTGAACATAATCCTGGTGGFAMIdem55
 R: TCTGTGTGAAGCAGTTCTGC
PaGT 13 F: CTCATGCATCACTTCACAGGFAMIdem56
 R: ACACGGACCTAACATCAACC
Simplex 1PaGT 9 F: CCATGTGTTAATGTTGTCCPETIdem55
R: ATTGAATCCACACGTTTCCG
Simplex 2PaGT 11F CAACTCCGTGAATGACATGCNEDBelzile et al. (2010) [60]56
R: CAGTTTGTGCACTAATGGAC
Simplex 3PaGT 22F: TTGAGTGCCTGGTGTATTCGVICIdem56
R AAGCTTCTGTCATGGAACCG
Simplex 4PaGT 12F: CTTCCTAGGTCAGTATCATCCPETMcCormick et al. (2010) [61]55
R: GTGGCAGCTGATTGATTTGG
Simplex 5PaGT 16F: ACCAATCAGTCAGACTAGCCFAMIdem56
R: GTTCTCATGTTGGAGAAGCC
1 Primer sequences were obtained from Saltonstall (2003a) [30].
Publisher’s Note: MDPI stays neutral with regard to jurisdictional claims in published maps and institutional affiliations.

