Article

In Silico Analyses of Autophagy-Related Genes in Rapeseed (Brassica napus L.) under Different Abiotic Stresses and in Various Tissues

1
Department of Agricultural Biotechnology, Payame Noor University (PNU), Tehran P.O. Box 19395-4697, Iran
2
Department of Biotechnology, Faculty of Agricultural Sciences, University of Guilan, Rasht P.O. Box 41635-1314, Iran
3
Nuclear Agriculture Research School, Nuclear Science and Technology Research Institute (NSTRI), Karaj P.O. Box 31485498, Iran
4
Resistance Induction and Bioprotection of Plants Unit (RIBP)—EA4707, SFR Condorcet FR CNRS 3417, University of Reims Champagne-Ardenne, Moulin de la Housse, CEDEX 2, BP 1039, 51687 Reims, France
*
Author to whom correspondence should be addressed.
Plants 2020, 9(10), 1393; https://doi.org/10.3390/plants9101393
Submission received: 2 October 2020 / Revised: 14 October 2020 / Accepted: 15 October 2020 / Published: 20 October 2020
(This article belongs to the Special Issue The Impacts of Abiotic Stresses on Plant Development)

Abstract

:
The autophagy-related genes (ATGs) play important roles in plant growth and response to environmental stresses. Brassica napus (B. napus) is among the most important oilseed crops, but ATGs are largely unknown in this species. Therefore, a genome-wide analysis of the B. napus ATG gene family (BnATGs) was performed. One hundred and twenty-seven ATGs were determined due to the B. napus genome, which belongs to 20 main groups. Segmental duplication occurred more than the tandem duplication in BnATGs. Ka/Ks for the most duplicated pair genes were less than one, which indicated that the negative selection occurred to maintain their function during the evolution of B. napus plants. Based on the results, BnATGs are involved in various developmental processes and respond to biotic and abiotic stresses. One hundred and seven miRNA molecules are involved in the post-transcriptional regulation of 41 BnATGs. In general, 127 simple sequence repeat marker (SSR) loci were also detected in BnATGs. Based on the RNA-seq data, the highest expression in root and silique was related to BnVTI12e, while in shoot and seed, it was BnATG8p. The expression patterns of the most BnATGs were significantly up-regulated or down-regulated responding to dehydration, salinity, abscisic acid, and cold. This research provides information that can detect candidate genes for genetic manipulation in B. napus.

1. Introduction

Autophagy consists of transferring the cargo into vacuole in plants, lysosomes, and animals and subsequently, decomposition [1]. In general, there are two types of autophagic processes, including macroautophagy and microautophagy [2]. Macroautophagy is a basic route for the decomposition of substrates using special double-membrane vesicles, called autophagosomes, to trap the materials [3]. Microphagy is a non-selective decomposition process in which the substances are directly decomposed by the lysosomes in animals or vacuoles in plants [4]. More than 36 types of autophagy-related genes (ATG) were already characterized, more than half of them encode core autophagy proteins and are conserved in the most studying organisms, including plants [5]. The most ATGs are involved in decomposition processes, but they also contributed to biosynthesis processes. In plants, there research about the role of these genes in growth, development, and responding to environmental stresses [6,7,8,9]. The ATG gene family is composed of several subfamilies in which ATG4 and ATG8 subfamilies have generally more members than other subfamilies in yeast, animals, and plants [10,11]. The plants are constantly exposed to environmental changes, which can be considered as biotic and abiotic stressors when they are too strong. Many molecular and physiological mechanisms are involved in plants’ tolerance to environmental stresses. The abiotic stresses include cold, heat, drought, salinity, nutrient deficiencies, heavy metal toxicity, and oxidative stress. Many parts of the world encounter the drought and salinity conditions limiting the crop yields. Abiotic stresses can increase the level of reactive oxidative species (ROS) in plants, which can be reduced by autophagy [12]. It is known that ATG18a, ATG10b, and ATG8 are involved in responding to the salinity and drought stresses in Arabidopsis, rice, and wheat, respectively [13,14,15]. Likewise, the autophagosome formation was immediately induced under salinity conditions in atg2 and atg7 Arabidopsis mutants, which displayed a hypersensitive phenotype [9]. The overexpression of many-core ATGs improves plant growth under abiotic stresses [16,17]. It has been reported that the destruction of ATG in Arabidopsis resulted in the accelerated leaf senescence [18]. Under normal conditions, the basal level of autophagy requires to maintain cellular homeostasis [19]. Although ATG mutants in the model plants such as Arabidopsis thaliana, Oryza sativa, and Zea mays can complete their life cycle, they have impaired in growth or stress response compared to wild-type plants [20]. It has been reported that ATG genes, in addition to playing a role in plant stress response, are involved in other plant biological processes such as nutrient metabolism, nutrient recycling, lipid metabolism, root development, aging, reproductive development, and crop yield [21,22]. Surveying the expression pattern of Arabidopsis ATGs in tissues and developmental stages indicated the specific and different functions of these genes in multiple tissues and cells [23]. For instance, ATG8 is involved in developing the endosperm in maize and its expression increases from 18 to 30 days after pollination [24]. During the leaf senescence, the expression of 15 Arabidopsis ATGs is induced [25]. Likewise, during the seed development of Arabidopsis, all ATGs are already expressed in siliques [26]. ATG genes also play an important role in productivity and yield. For instance, rice ATG7 knockout line caused the abnormal development of anther, spikelet sterility, decreased nitrogen efficiency, premature senescence leaf, and finally reduced the yield [27,28]. Autophagy plays an important role in the plant’s response to nutrient starvation, and the expression of ATGs is induced under carbon or nitrogen starvation. Maize plants with mutations in ATG12 (atg12) have normal growth similar to wild-type plants under control conditions but, in nitrogen starvation conditions, stopped seedling growth, premature senescence leaf, and reduced seed production mutant plants have been observed [29].
Rapeseed (Brassica napus L.) is one of the most important oilseed crops in the world and is an allopolyploid due to the hybridization of B. rapa (2n = 2x = 20) and B. oleracea (2n = 2x = 18). This plant is used as one of the healthiest edible oils due to its high content of unsaturated fatty acids and proteins. B. napus oil contains omega-3, essential vitamins, and minerals [30]. B. napus are used as an excellent species for the genetic and molecular studies of development and adaptation to stresses such as heavy metals stress due to its outstanding features, including rapid growth, high biomass, accumulation of heavy metals in the stem without showing any symptoms. B. napus is also a good candidate for phytoremediation [31,32]. This plant is relatively cold and salinity tolerant. However, spring frost can cause serious damage and kill B. napus seedlings, followed by a severe reduction in yield [33]. Identifying the abiotic stress-responsive genes in B. napus can increase our knowledge to improve commercial B. napus cultivars and increase its tolerance to abiotic stresses such as cold and salinity. Although the genome of many plants is known, ATGs were studied in a few plants, including Arabidopsis [34], O. sativa [35], Nicotiana tabacum [36], Z. mays [29], Capsicum annuum [37], Setaria italica [38], Musa acuminate [39], Vitis vinifera [12], Citrus sinensis [40], and Ricinus communis [41]. Further investigations are necessary to characterize these genes in the various plant species to increase our knowledge about ATGs in plants. Therefore, in the present study, identification, evolutionary relationship, duplication, and selection pressure, exon–intron structure, promoter analysis, transcript-targeted miRNA, and simple sequence repeat markers (SSRs) prediction, RNA-seq data analysis, codon usage, and gene ontology of the BnATGs genes were investigated.

2. Results

2.1. The Identification of B. napus ATG Genes

To identify the ATG genes in the B. napus genome, the BLASTP program was applied using the query sequence of Arabidopsis [42], C. Sinensis [40], V. vinifera [12], and O. sativa [35] ATG proteins against the B. napus genome database [43]. One hundred and twenty-seven genes were determined after omitting the sequences without ATG domains (Supplementary Table S1). All BnATGs were grouped due to their specific domains and numbered based on the chromosomal locus except the ATG2 subfamily, which was not identified. All identified BnATGs were encoded by gene families, including 26 members for BnATG8, 24 members for BnATG18, 11 members for BnATG1, eight members for each of the BnATG20 and BnVTI12, six members for the BnATG11, five members for each BnATG4, BnATG14, and BnATG101, four members for each of the BnATG3, BnATG5, BnATG6, and BnATG13, three members for each of the BnATG9, BnATG12, and BnTOR, and two members for each BnATG7, BnATG10, BnATG16, BnVPS15, and BnVPS34. The physicochemical analysis of BnATGs was carried out using the ProtParam tool. The length of protein sequences encoded by these 127 BnATGs ranged from 93 amino acids of BnATG12b to 2478 amino acids of BnTORc. The molecular weight (MW) of BnATG proteins ranged from 10.29 to 278.5 kDa with the isoelectric points (pI) varying from 4.63 to 9.74 (Supplementary Table S1). Due to the prediction of subcellular localization, BnATGs have activity in nucleus, cytoplasm, chloroplast, mitochondria, plasma membrane, and extracellular space (Supplementary Table S1). The diversity in length and location of BnATG proteins indicates their diverse functions in various cellular processes.

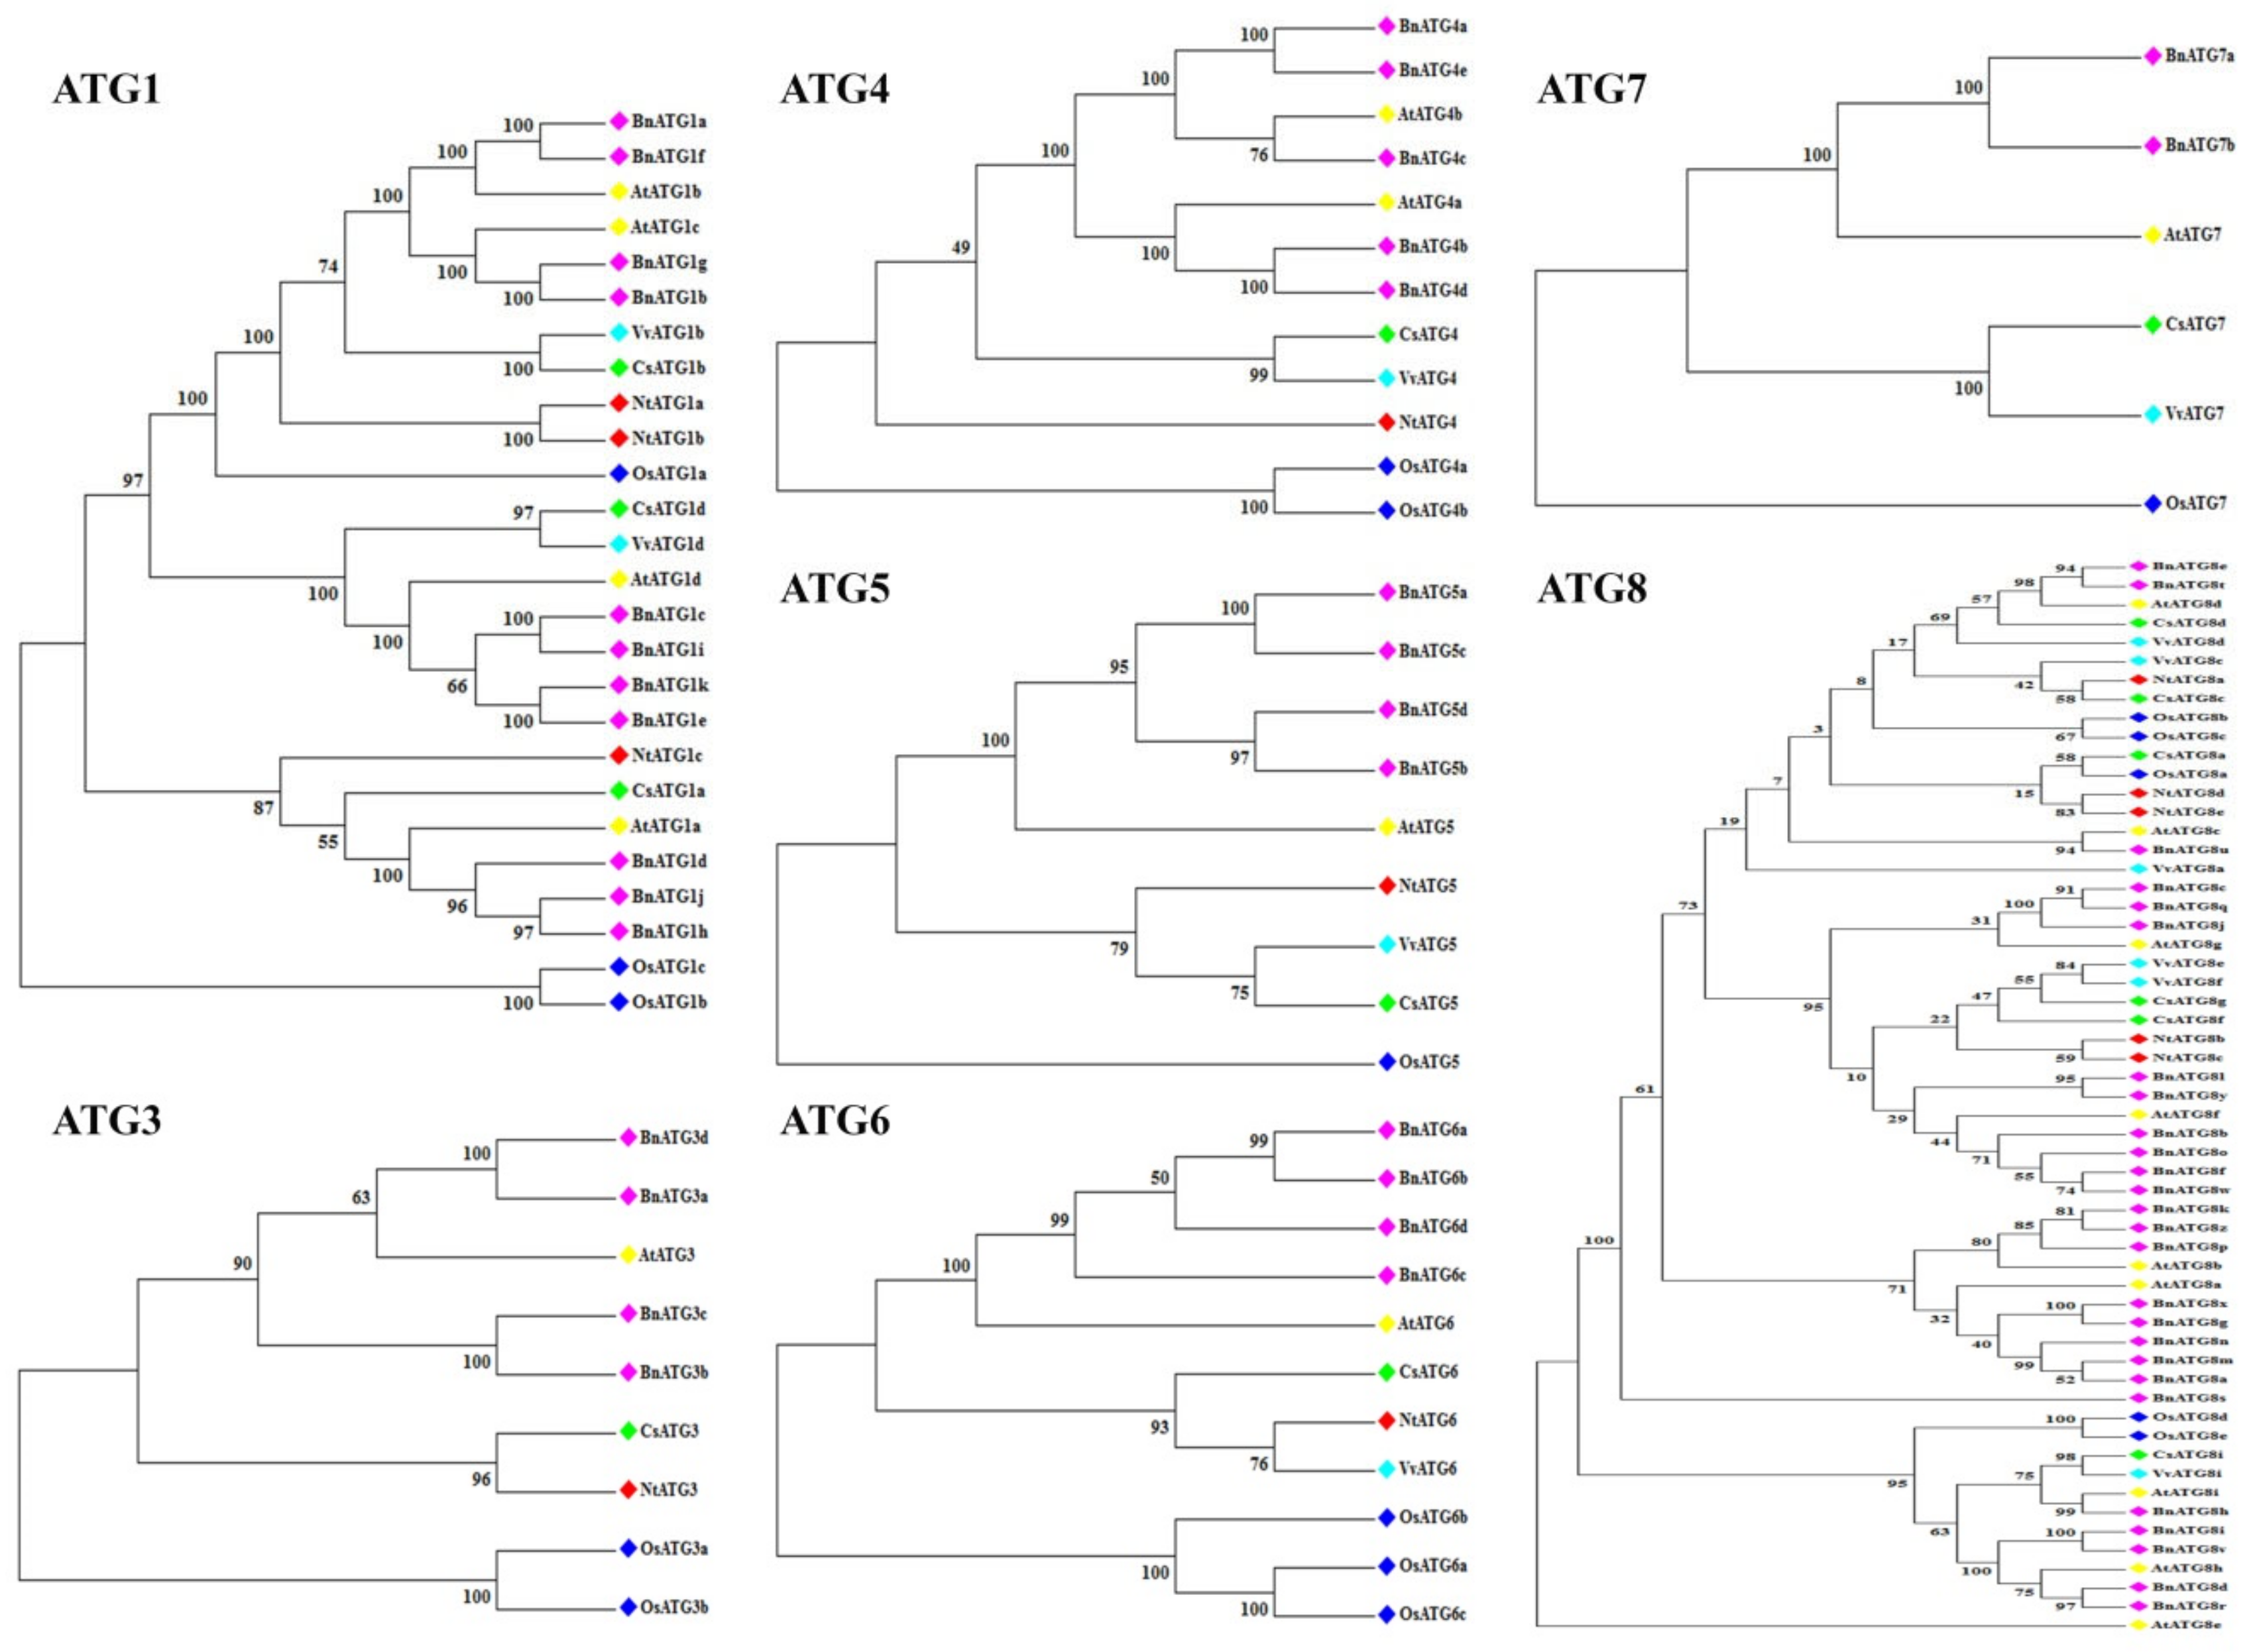
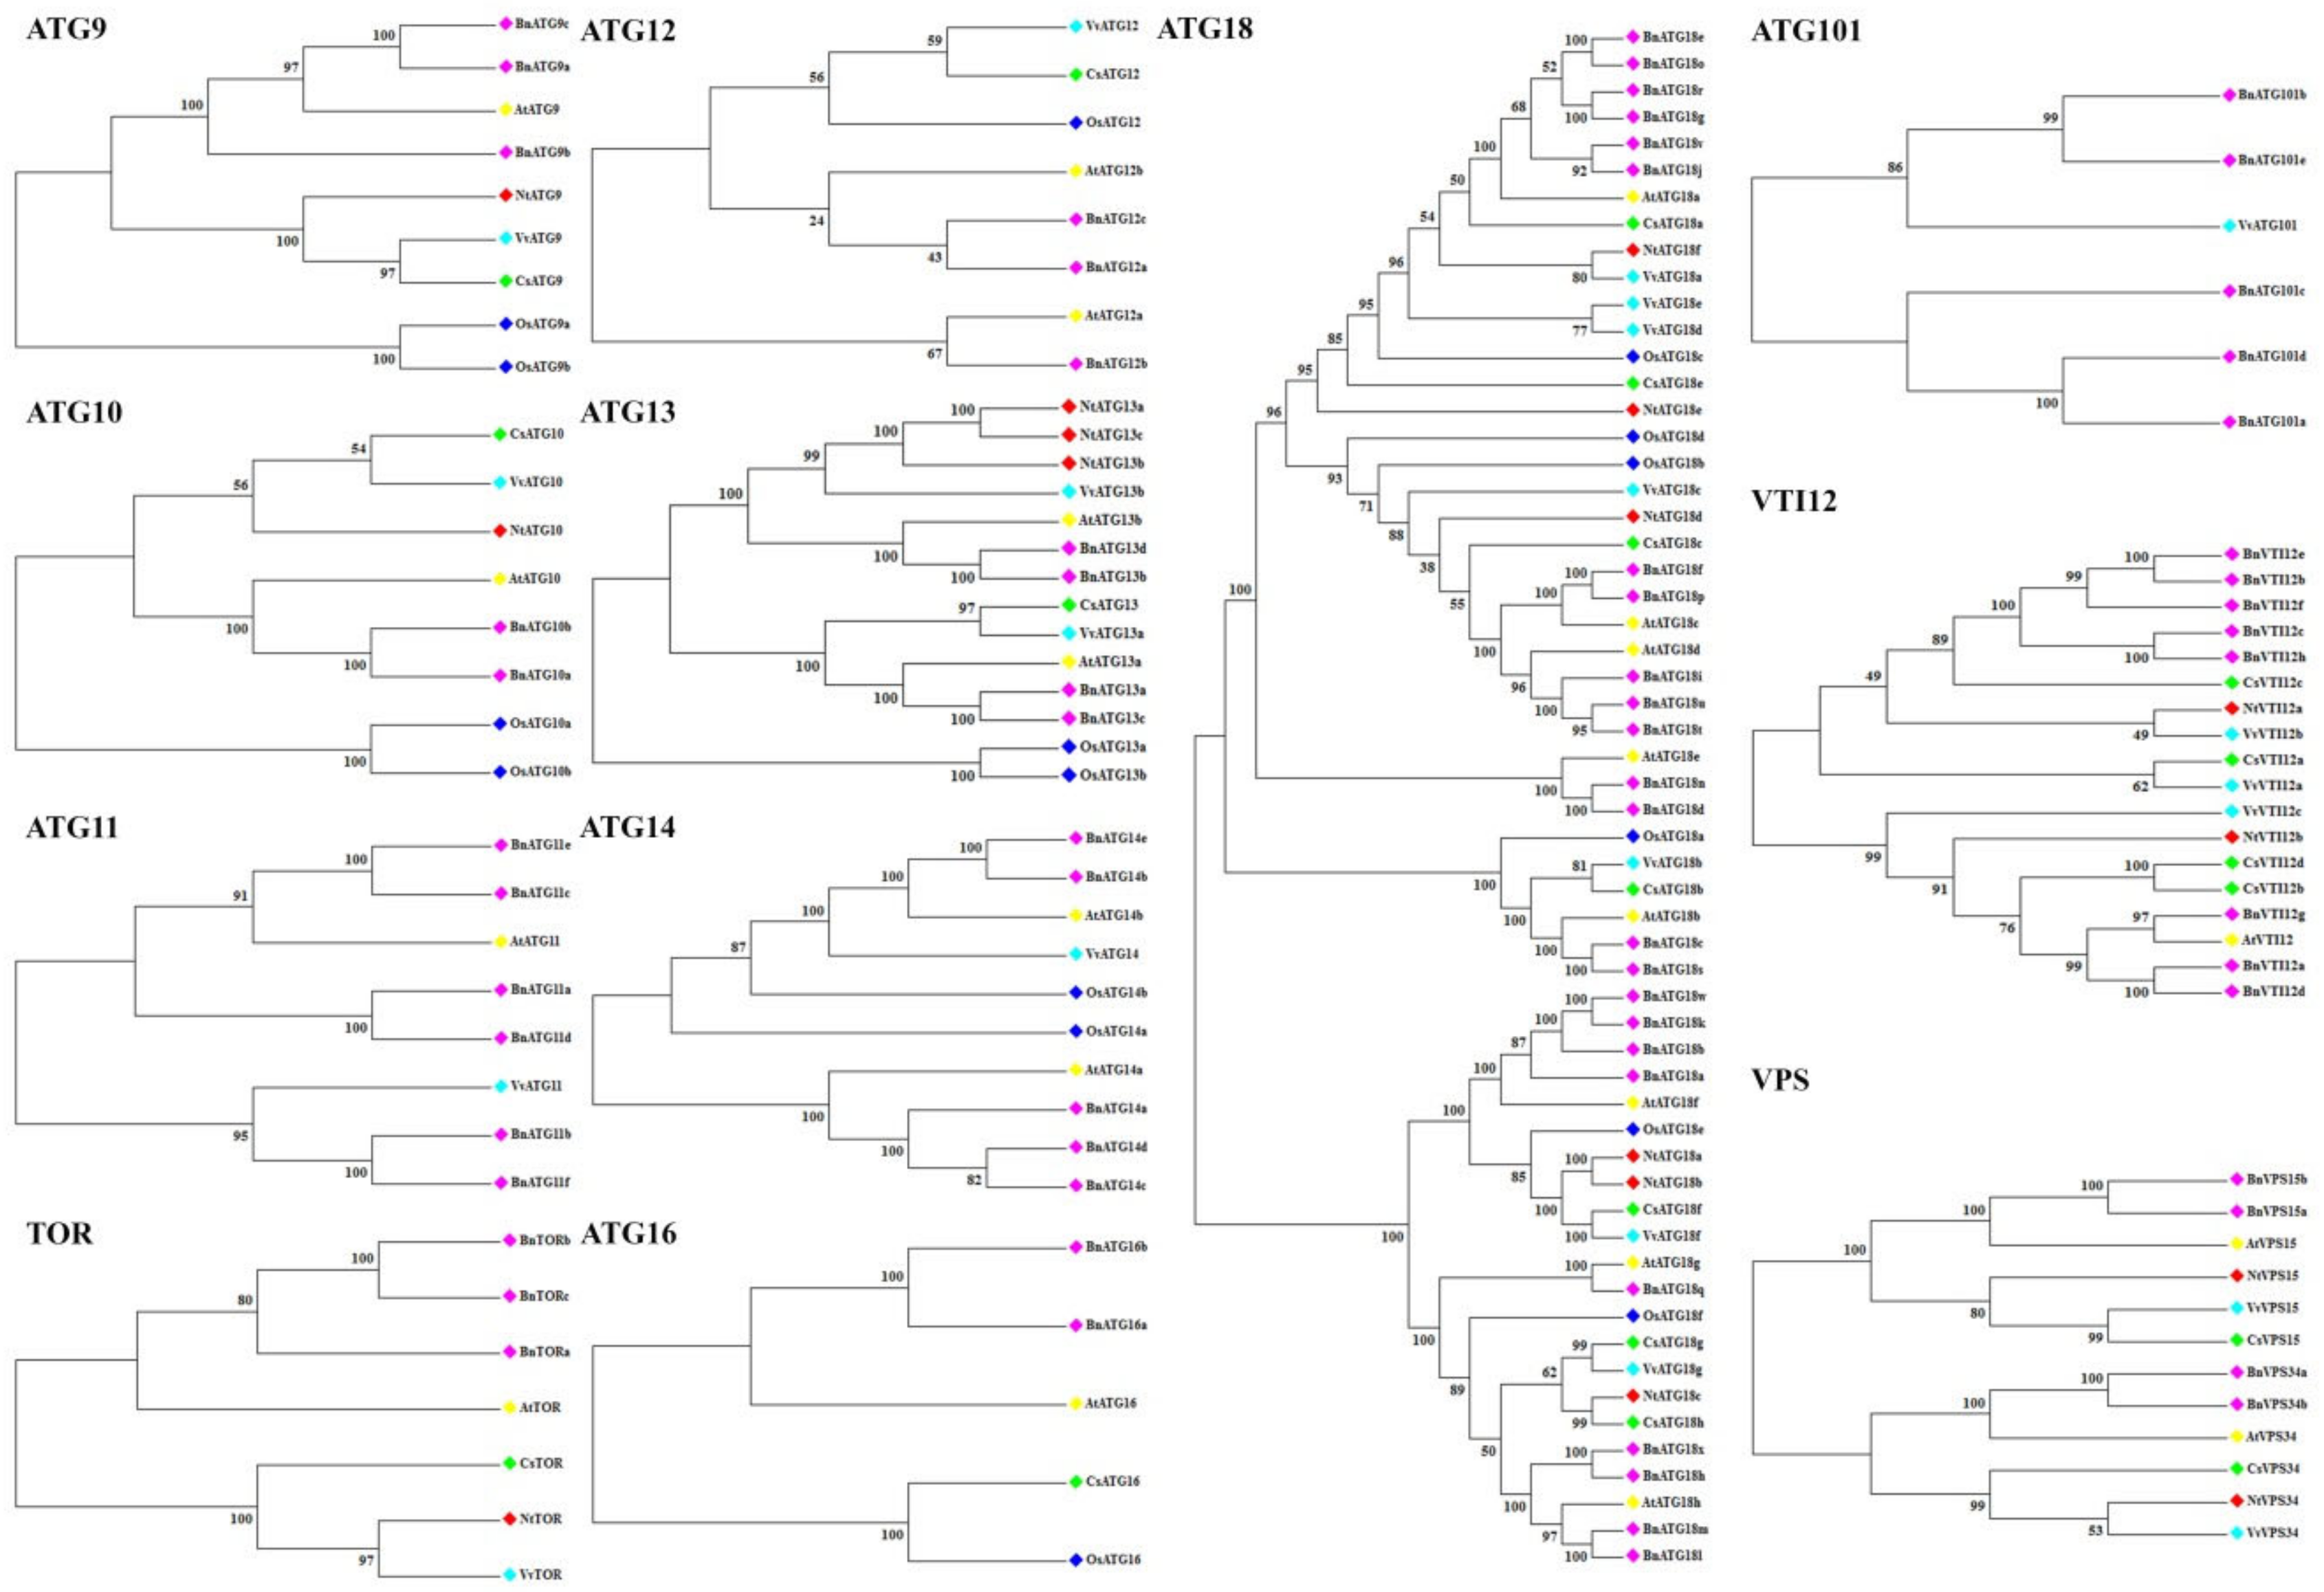
2.2. The Phylogenetic Analysis of B. napus ATG Gene Family

A neighbor-joining phylogenetic tree was constructed to assess the relationship of B. napus ATG proteins. The results indicated that each ATGs had high similarity to their counterparts in Arabidopsis thaliana (At), Citrus sinensis (Cs), Oryza sativa (Os), Vitis vinifera (Vv), and Nicotiana tabacum (Nt) (Figure 1 and Figure 2). Almost in all ATGs, OsATGs were clustered separating from the dicot clades. All BnATGs were clustered in different branches due to the existence of multiple isoforms except BnATG6–7, BnATG10, BnATG16, and BnTOR. Therefore, it can be suggested that they may have different functions in the same subfamily.

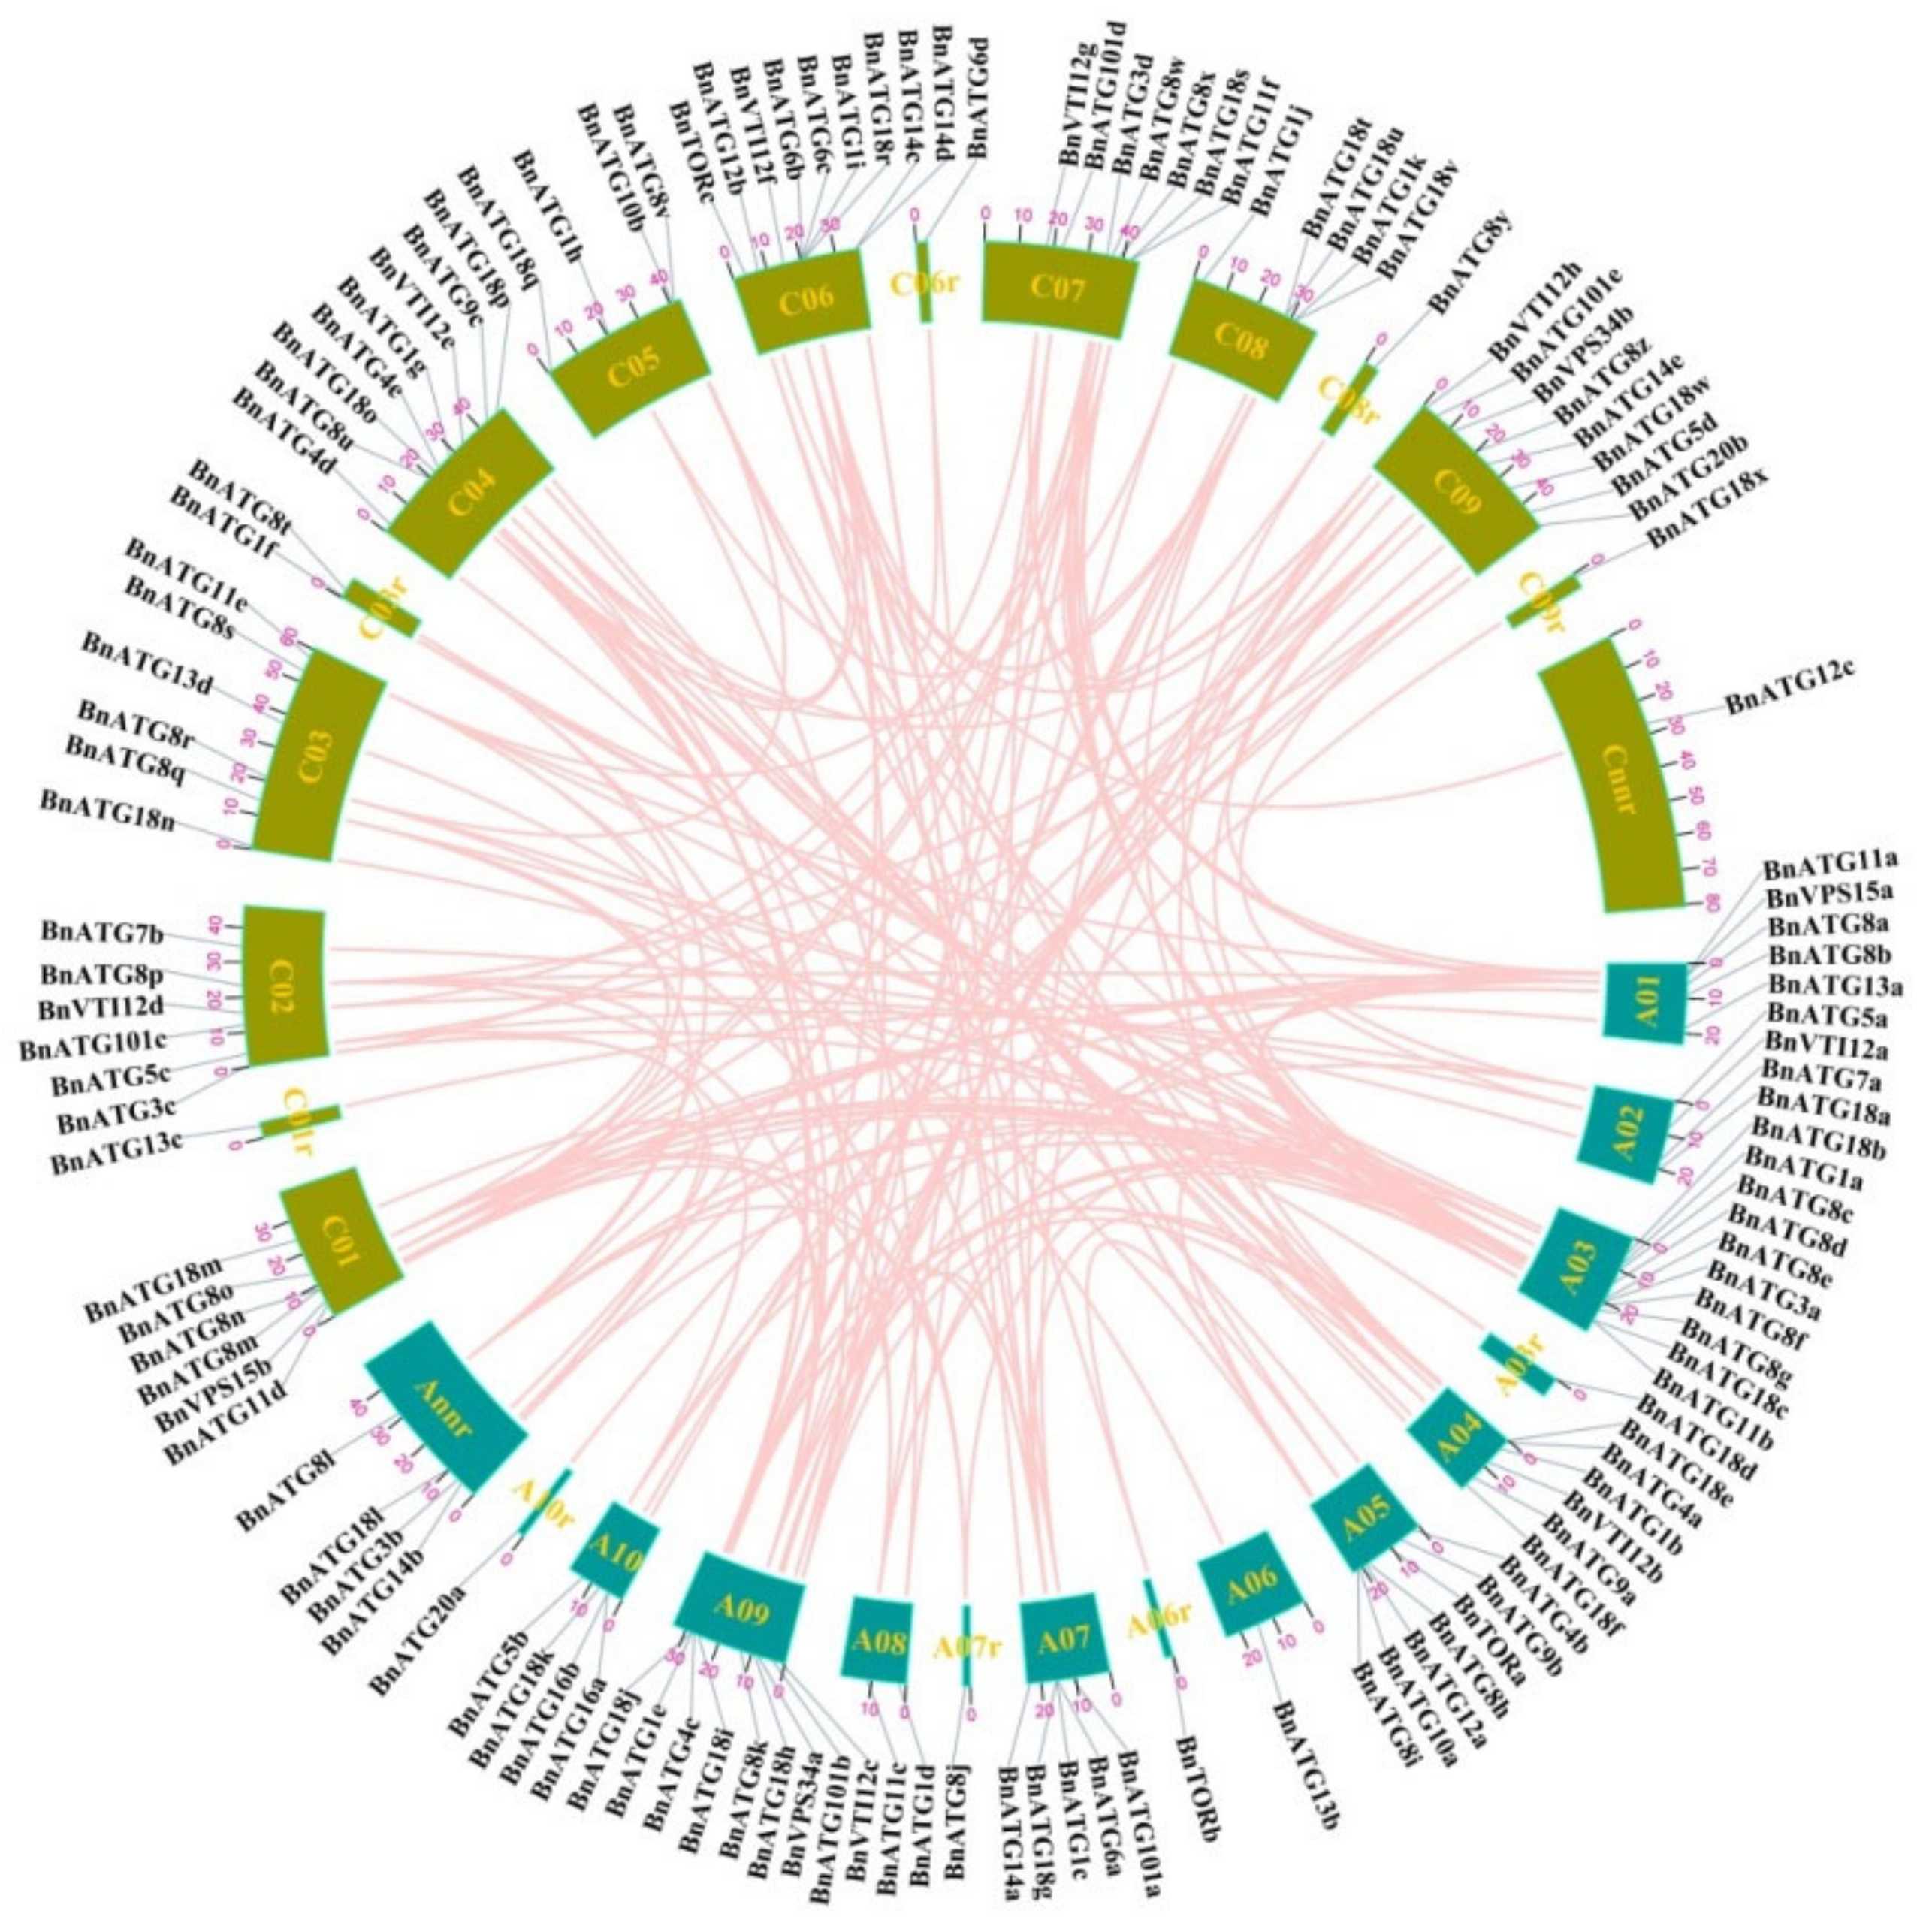
2.3. Gene Location, Duplication, and Selection Pressure of BnATGs

Based on Figure 3, the chromosomal distribution of 127 BnATGs was uneven. Chromosome (Chr) A03, A09, C05, and C09 contained the highest number of BnATGs, whereas on ChA06, A6_random, A7_random, A10_random, C01_random, C06_random, C08_random, and C09_random, only one gene has been determined related to BnATG13b, BnTORb, BnATG8j, BnATG20d, BnATG13c, BnATG6d, BnATG8y, and BnATG18x, respectively. Based on gene duplication analysis, segmental duplication has occurred more than tandem duplication in the B. napus ATG gene family (Supplementary Table S2). Only five pairs of BnATG genes (BnATG6b/BnATG6c (ChC06), BnATG8n/BnATG8m (ChC01), BnATG14c/BnATG14d (ChC06), BnATG16a/BnATG16b (ChA01), and BnATG18u/BnATG18t (ChC08)) revealed tandem repeats; thus, the role of segmental duplication in the expansion of the BnATG family is more important than tandem duplication. The Ka/Ks ratio of 165 paired genes was measured to show the selection pressure among duplicated genes (Supplementary Table S2). Ka/Ks was <1 for the most of paired genes, suggesting a negative selection to maintain their function during the evolution of B. napus plants. For three duplicated pairs (BnATG16a/16d, BnATG8m/BnATG8a, and BnATG18g/BnATG18r), the Ka/Ks ratio was >1, indicating a positive selection, leading to their different functions due to these mutations during the evolutionary process.

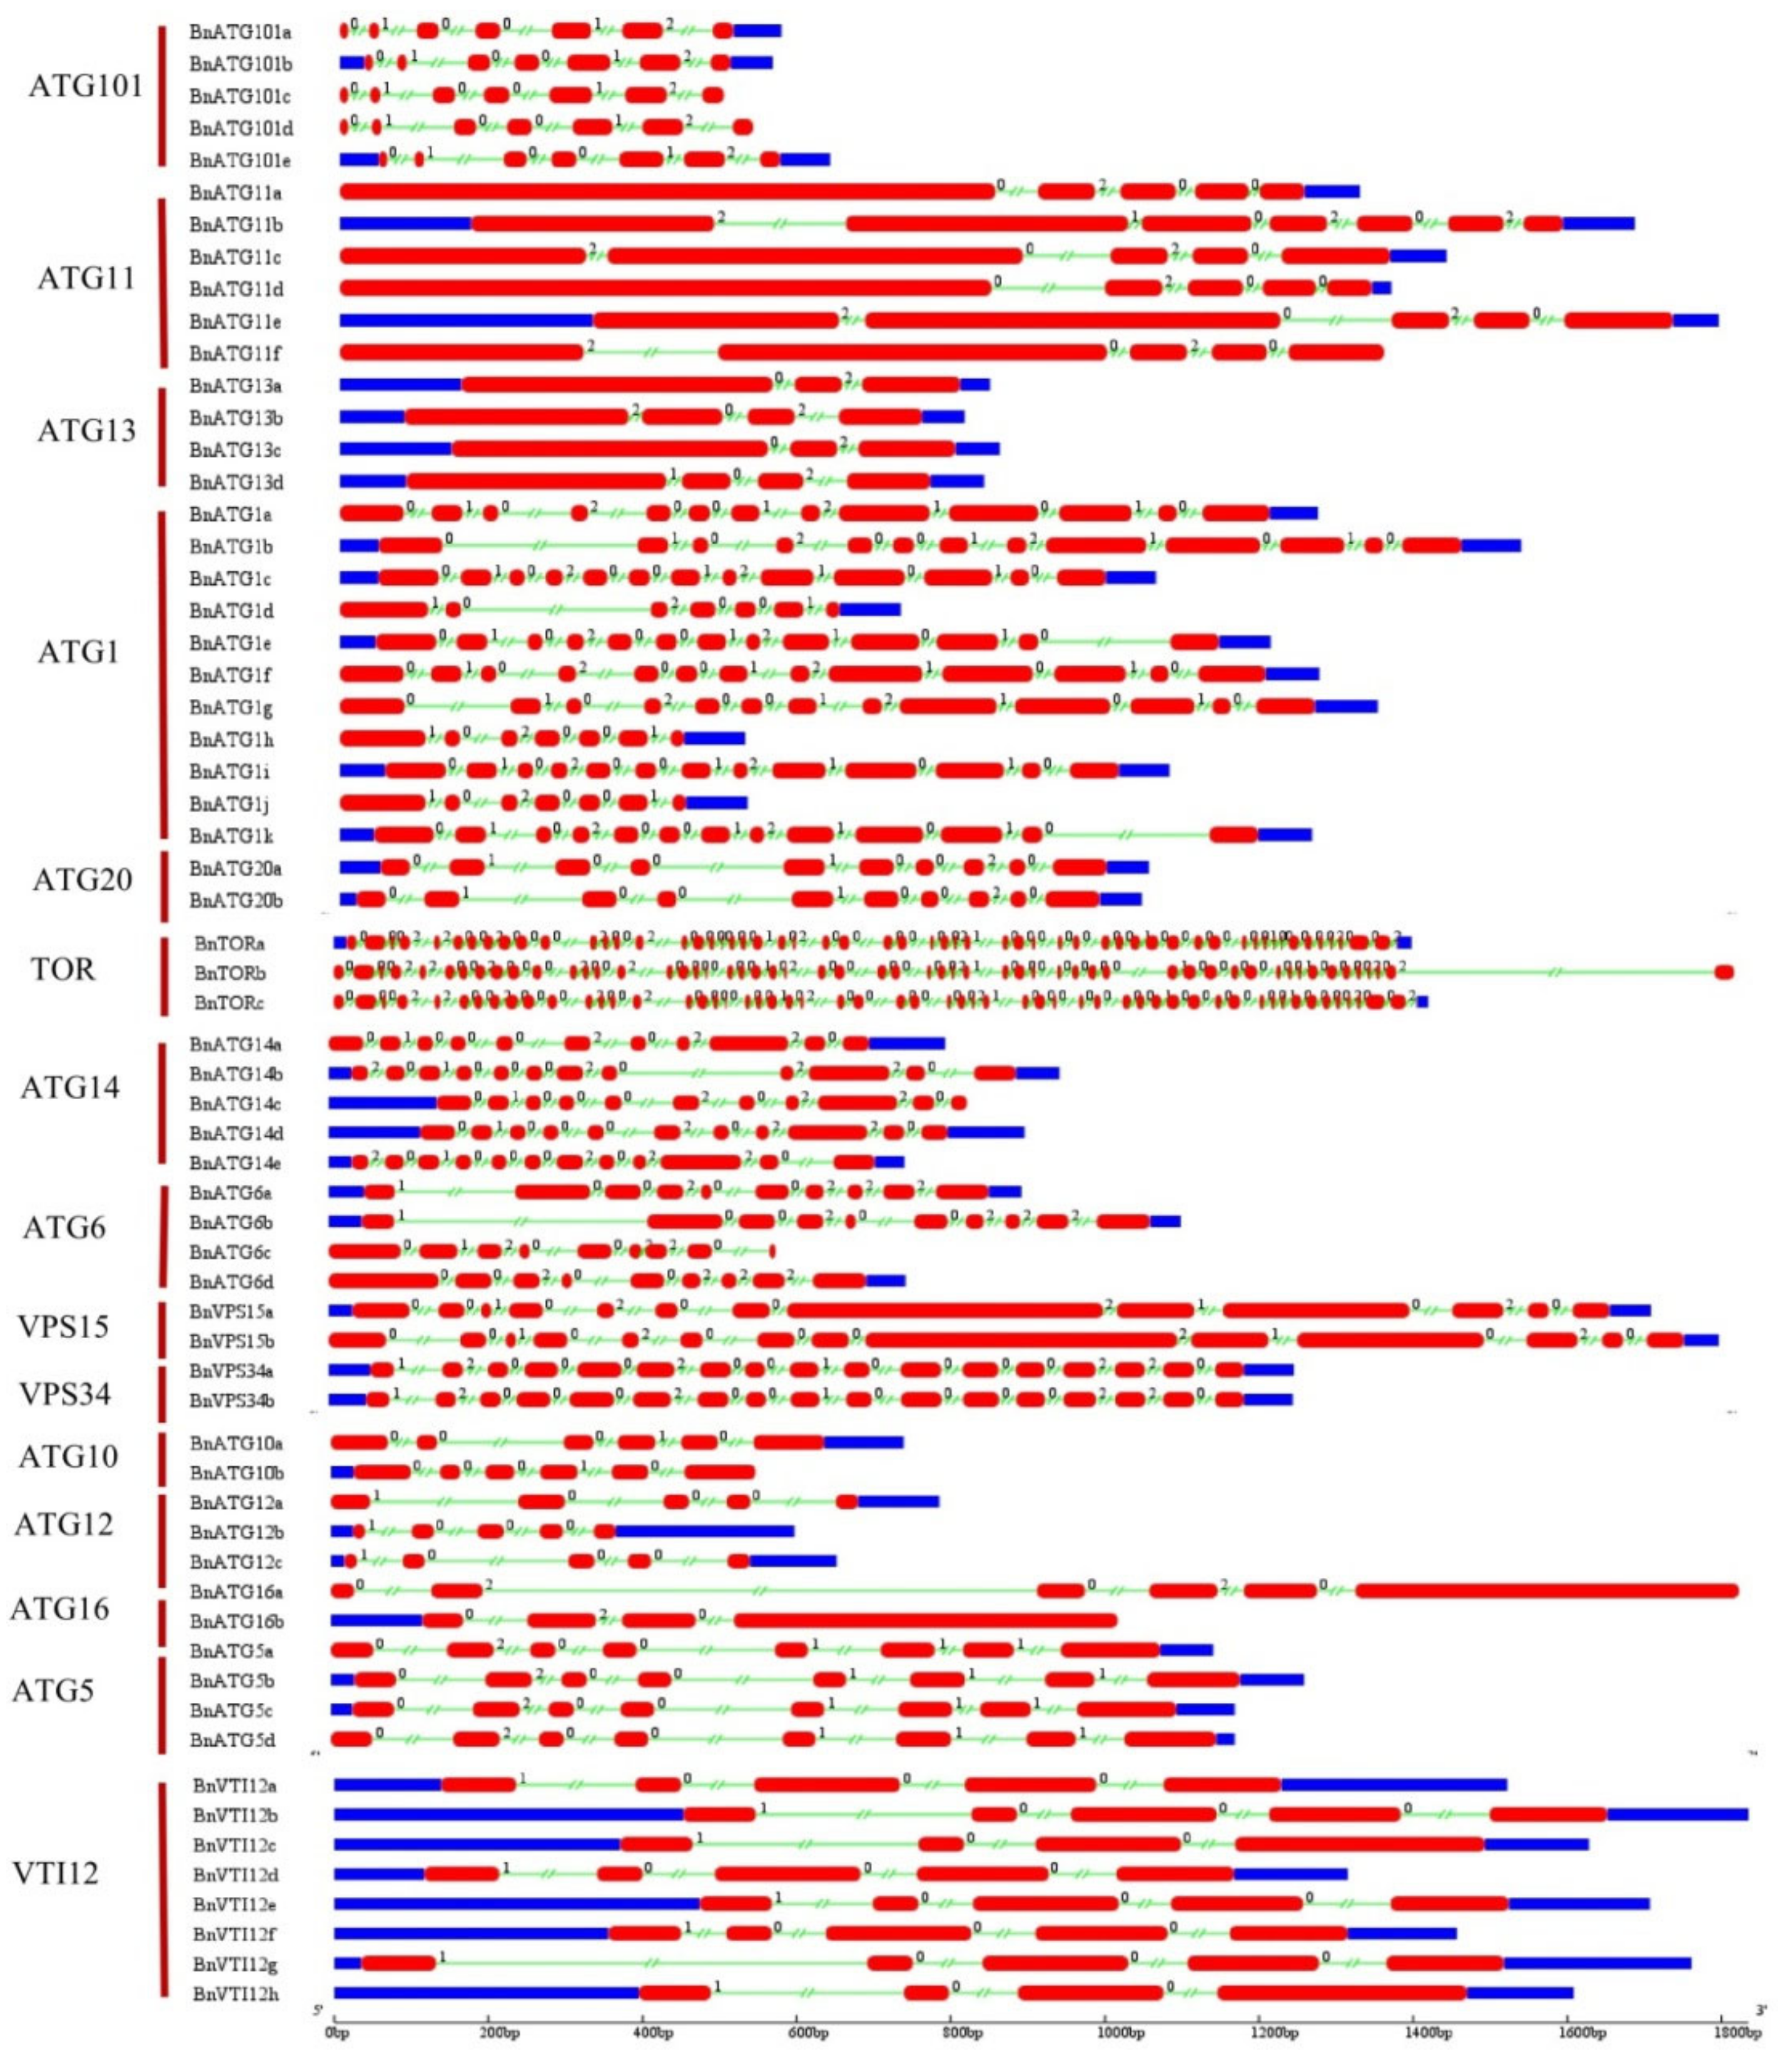
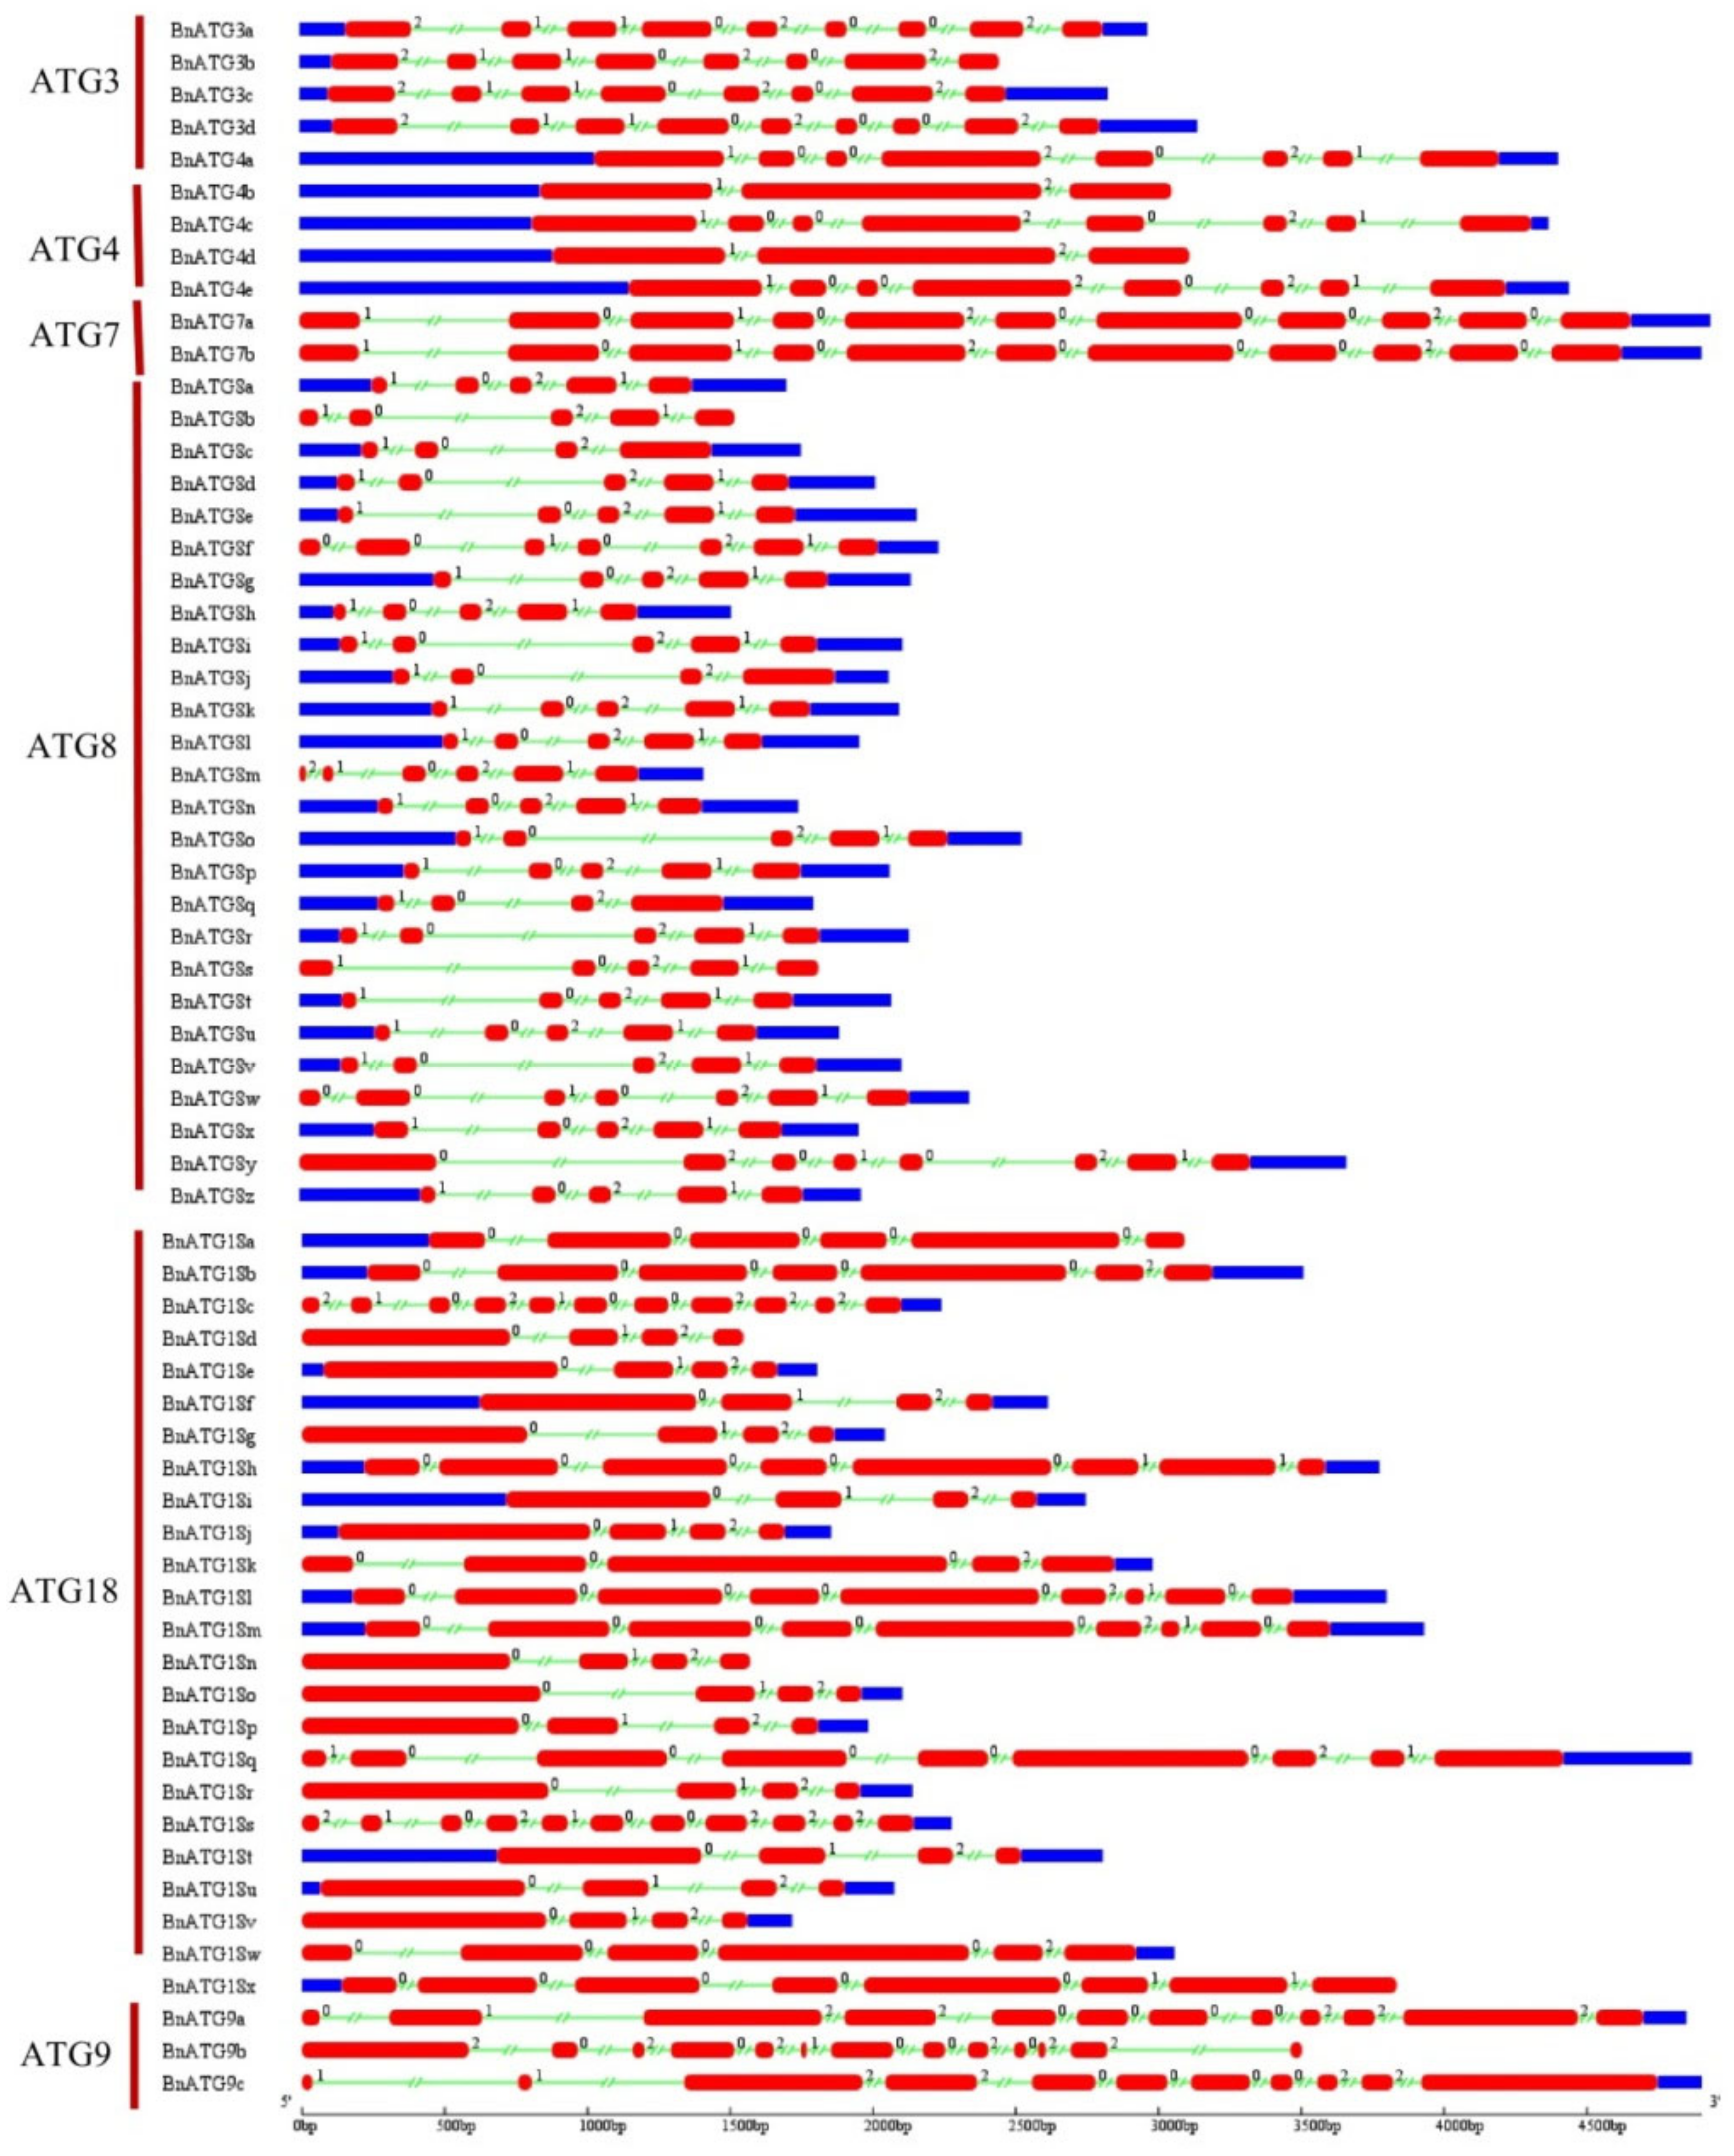
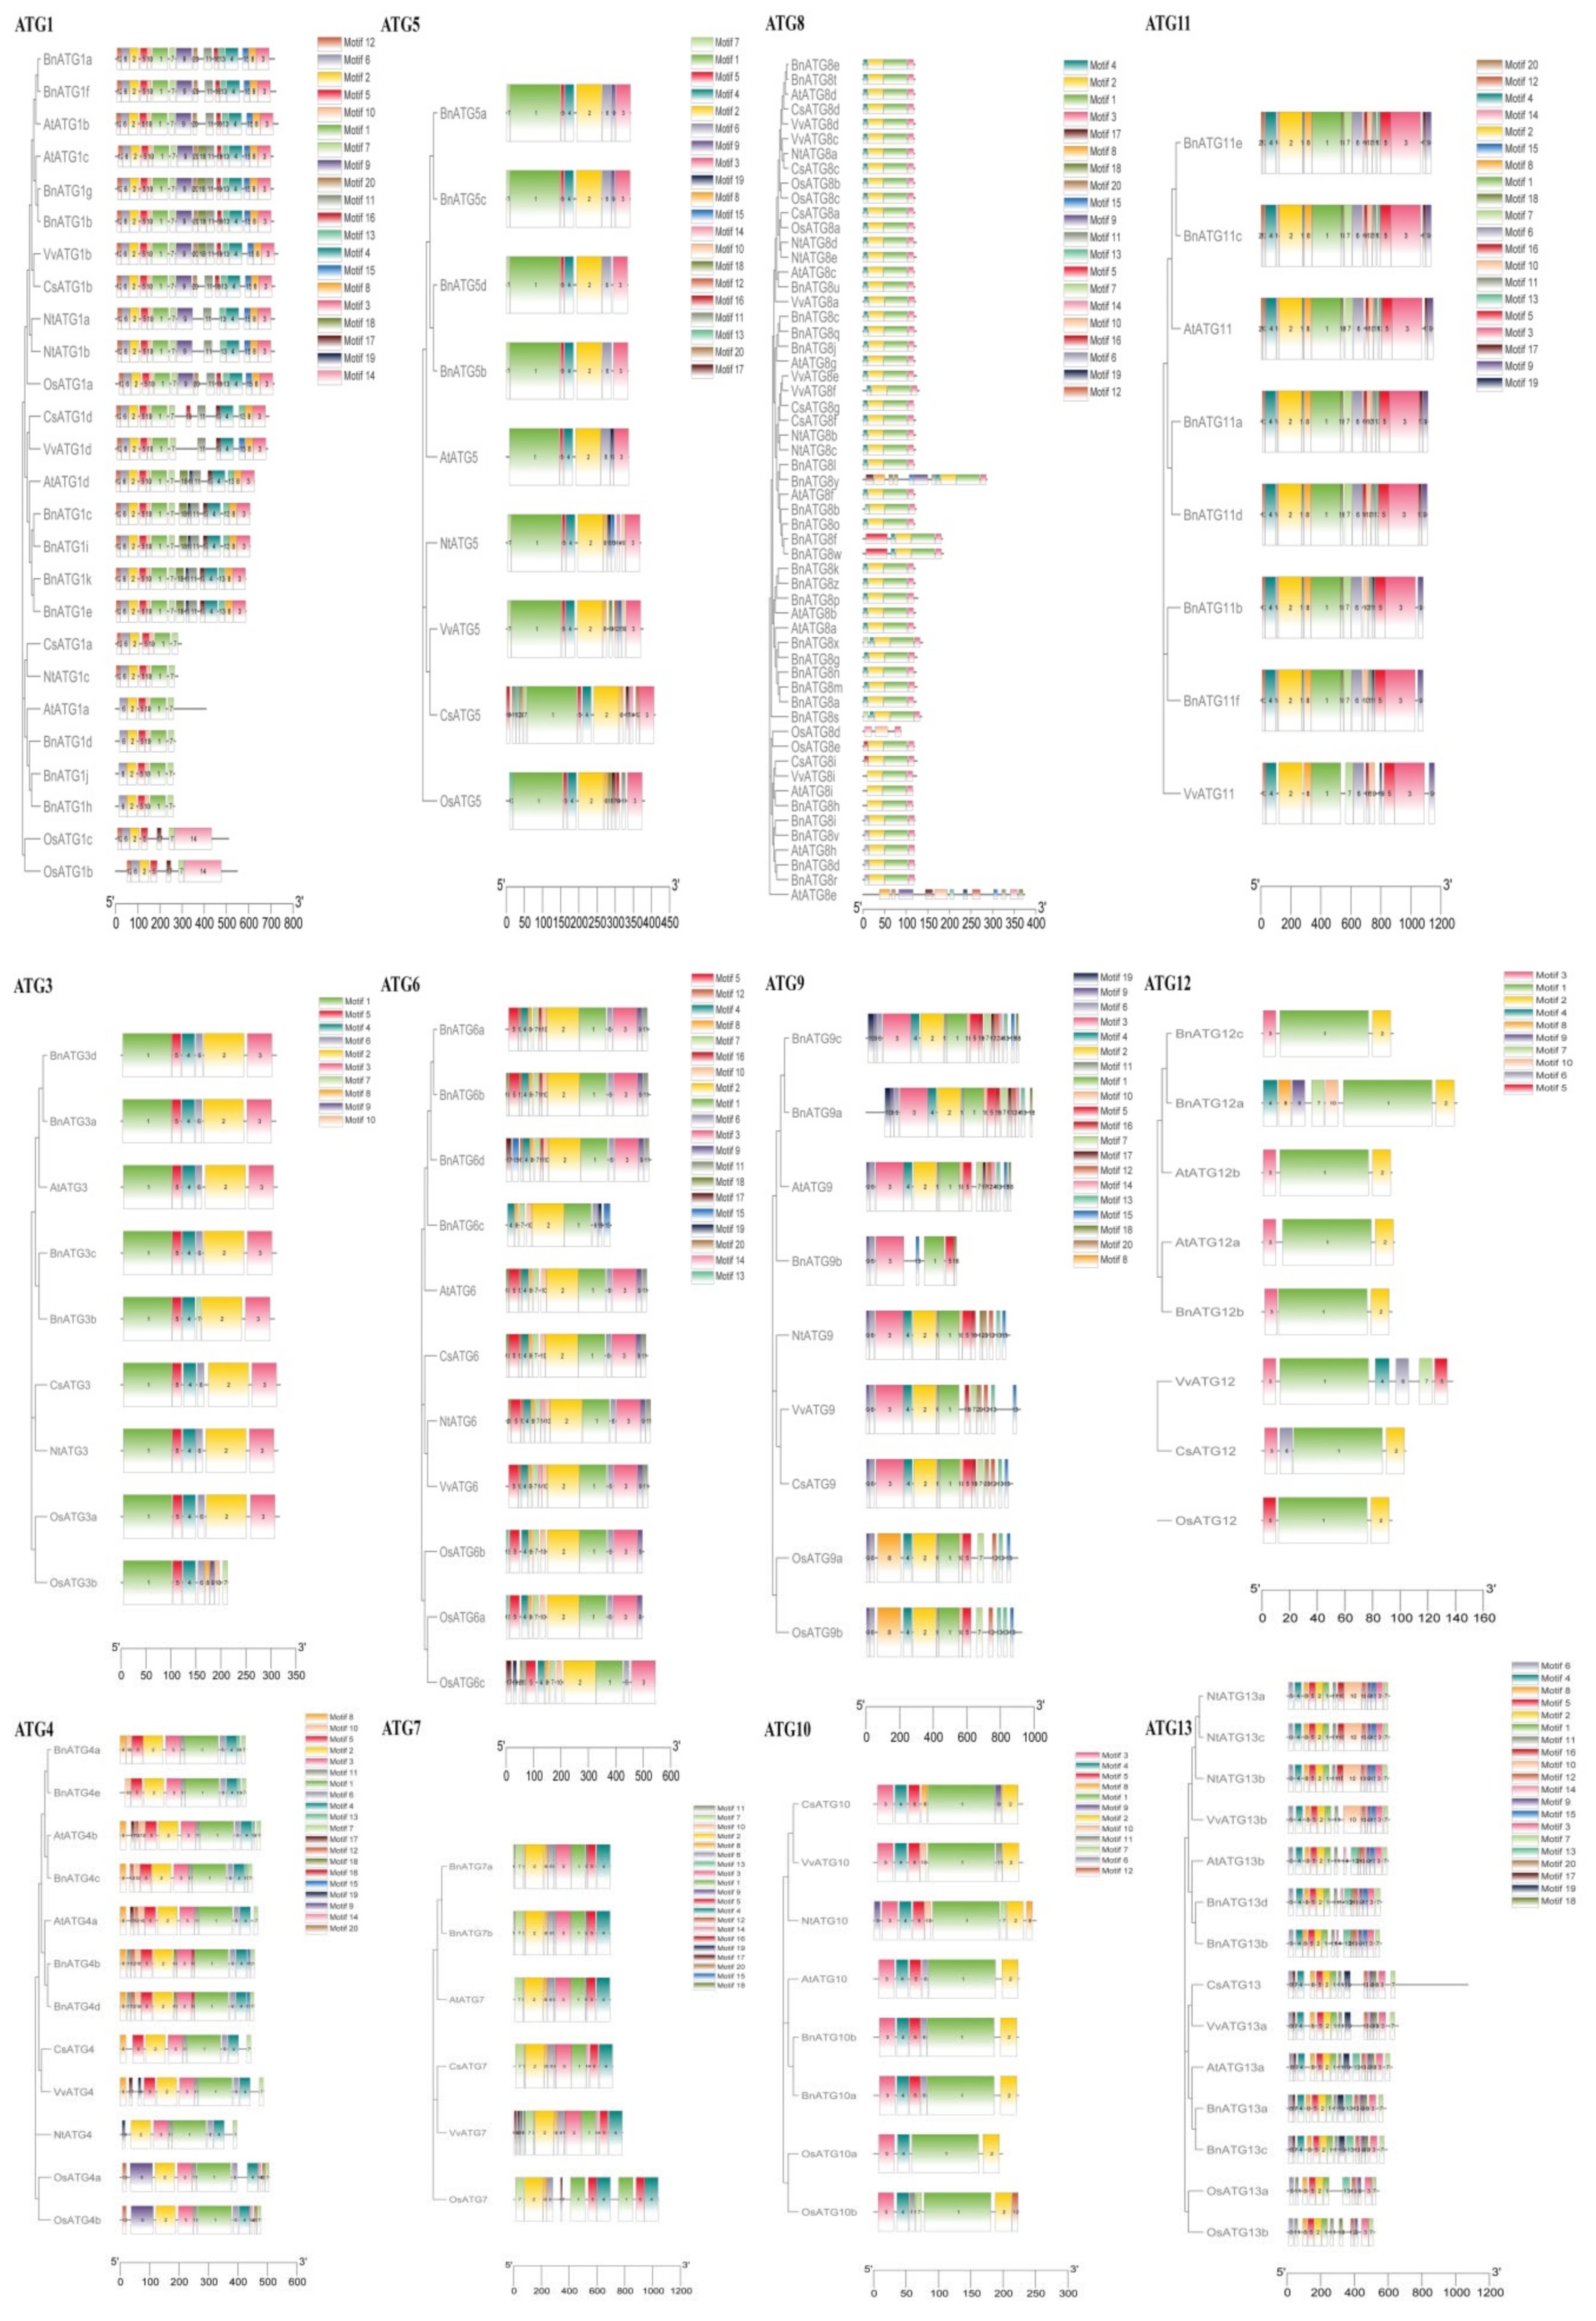
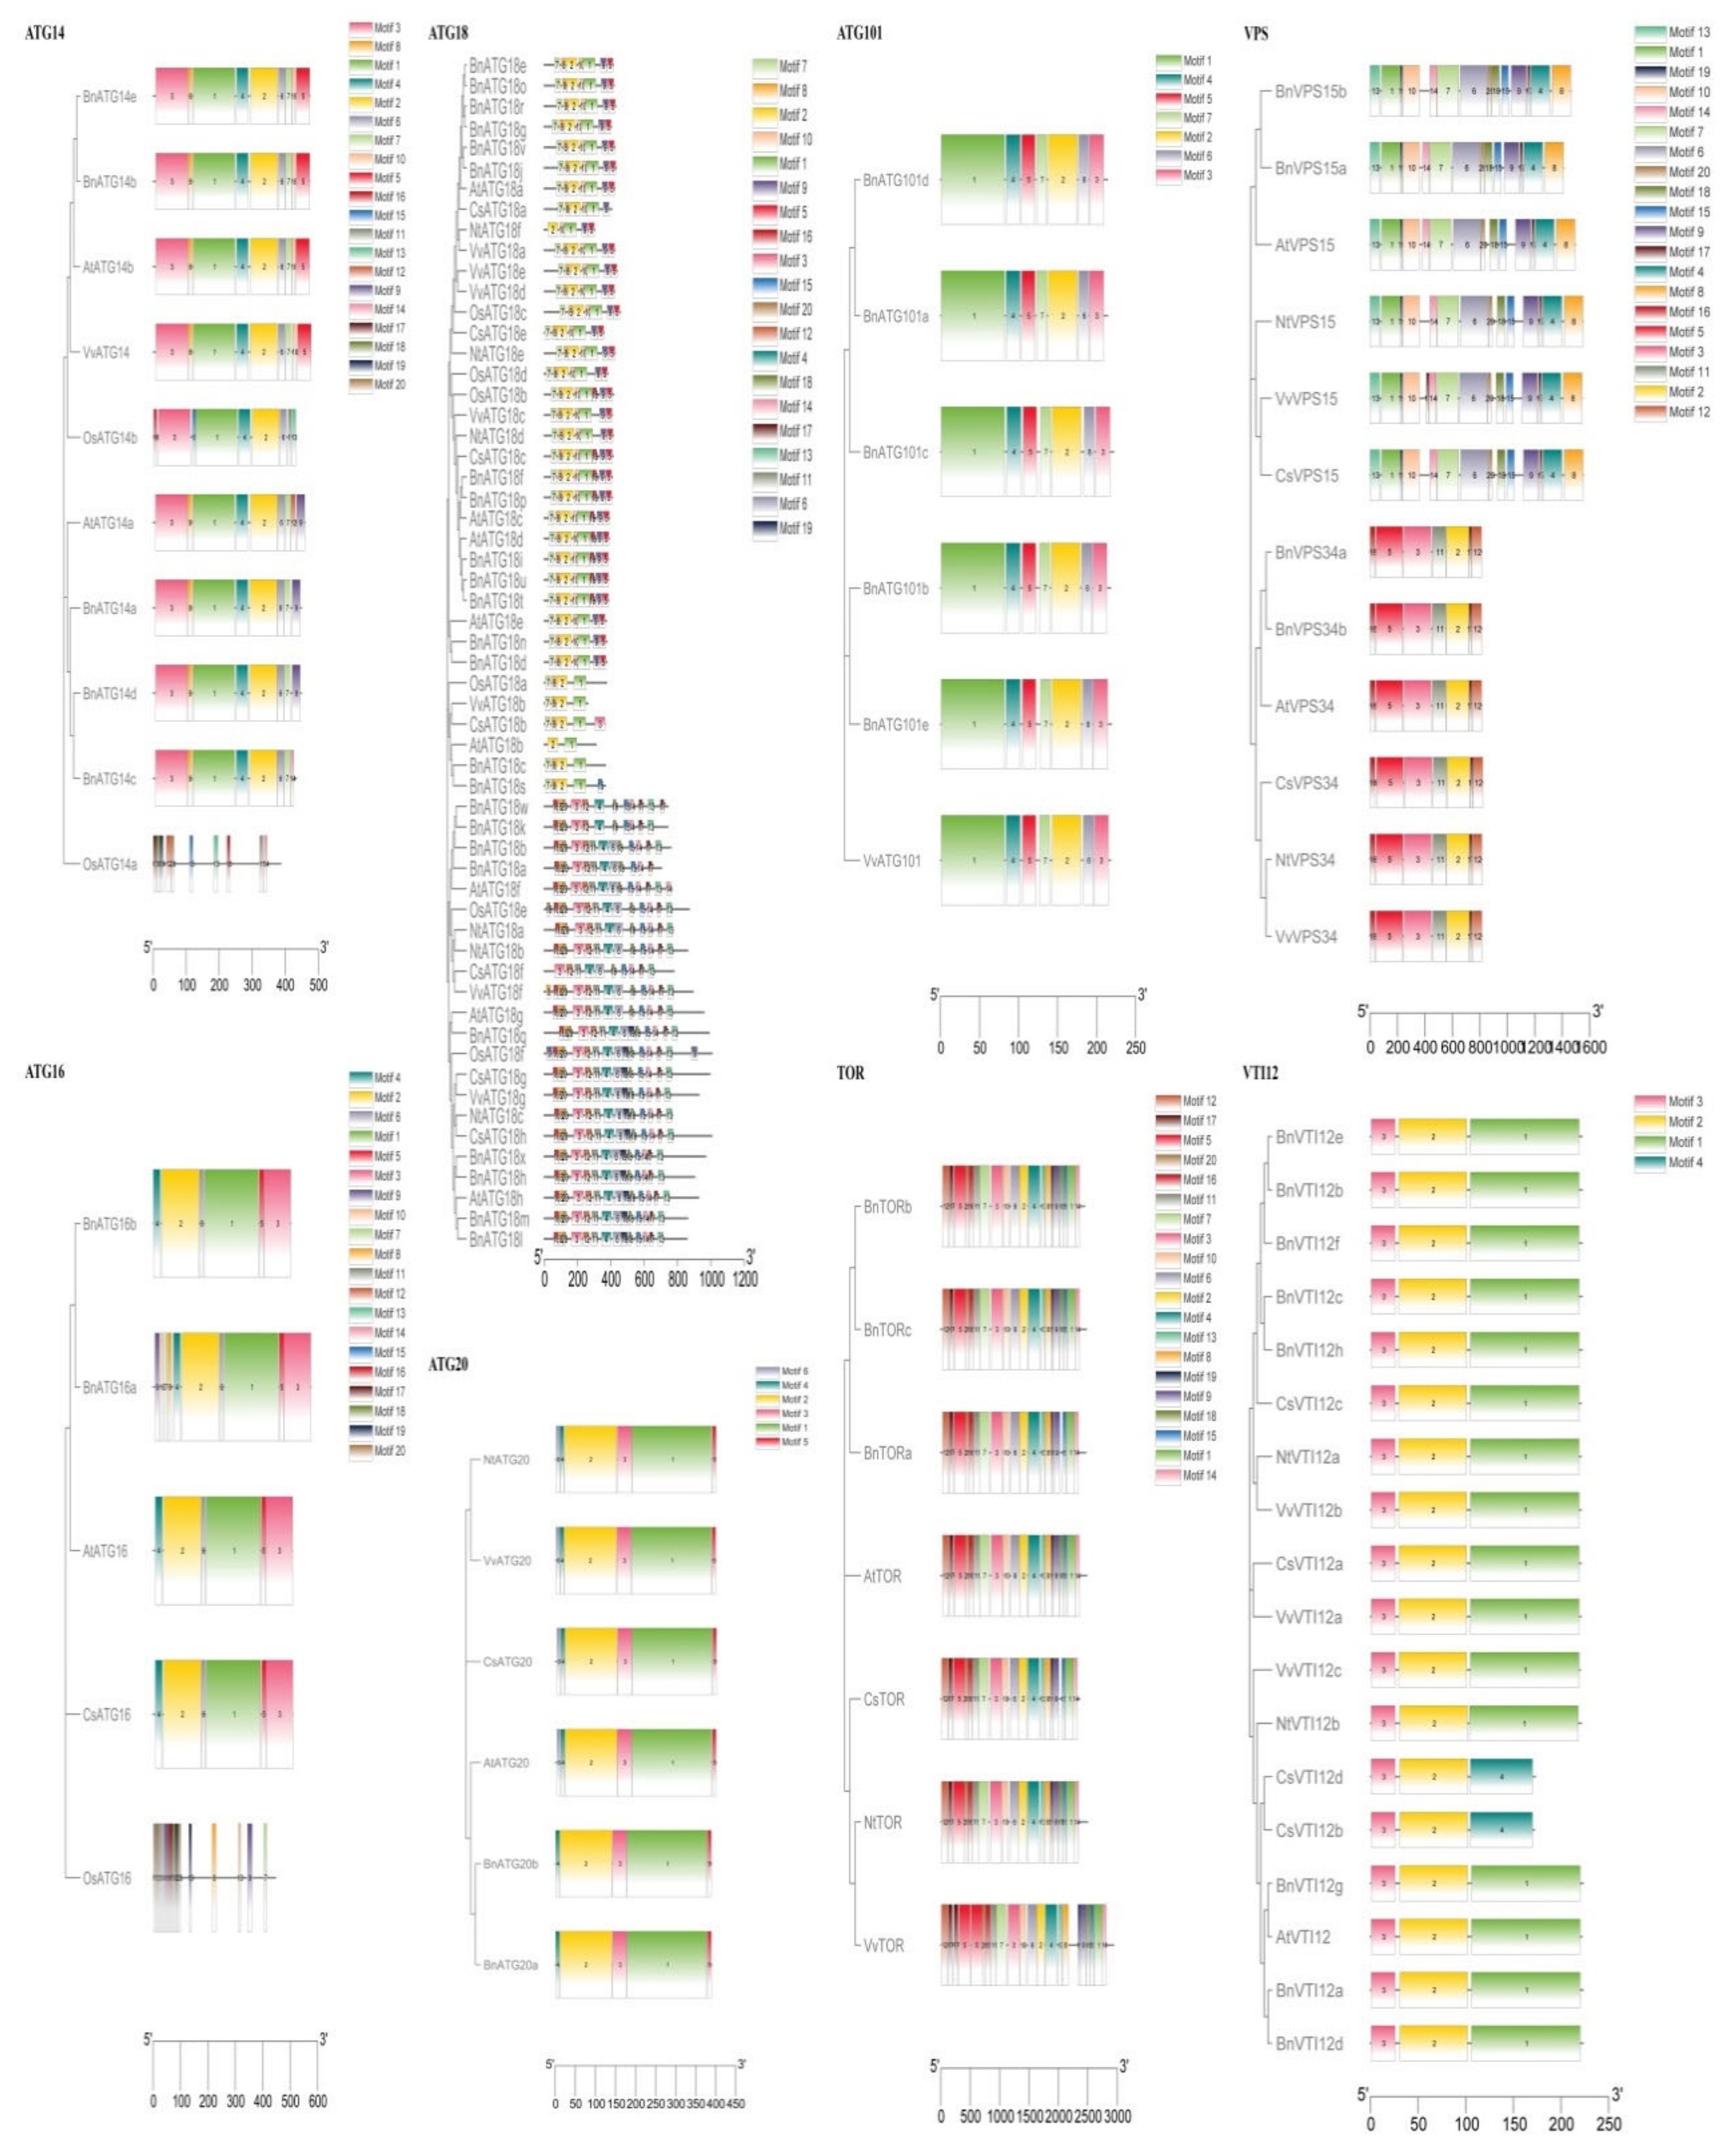
2.4. The Exon–Intron Structure and Conserved Motifs of B. napus ATGs

Considering the exon–intron structure analysis of BnATG, two to 56 introns exhibited a high structural diversity among the ATG subfamilies (Figure 4 and Figure 5). BnTORb exhibited the longest intron. For the B. napus ATG gene family, three intron splicing phases were observed, including zero, one, and two, which resulted from splicing after the codon’s third, first, and second nucleotide, respectively [44]. Most of BnATGs had all three splicing phases except BnATG10, BnATG12, BnVTI12, and BnATG16. BnATGs had three to 17 exons, whereas three genes named BnTORa–c had 55 and 56 exons. All of BnATGs contained introns, but some had no untranslated region, including BnATG6c, BnATG8b, BnATG9b, BnATG11f, BnATG16a, BnATG18d, BnATG18n, BnATG101c-d, and BnTORb. The number of exons was similar in each ATG group. For instance, the BnATG5, BnATG10, BnATG12, and BnATG20 revealed 8, 6, 5, and 10 exons, respectively. The diversity in the number of exons in some subfamilies indicated selective pressure to achieve different functions during plant evolution [45]. The similar exon–intron structure among A and C homologous copies showed that the homologous genes maintained their function during B. napus evolution. The intron splicing phases for each group were similar. BnATG1, BnATG3, BnATG4 (except BnATG4b and BnATG4d with splicing phases zero and two), BnATG5, BnATG6 (except BnATG6d with splicing phases zero and two), BnATG7, BnATG8, BnATG9, BnATG14, BnATG15, BnATG34, BnTOR, and BnATG101 subfamilies revealed all three intron splicing phases. Likewise, in the BnATG18 subfamily, all three splicing phases were observed except BnATG18a, BnATG18b, BnATG18k, and BnATG18w genes with splicing phases zero and two, BnATG18b and BnATG18x with splicing phases zero and one, and BnATG18a with only splicing phase zero. BnATG11 (except BnATG11b with all three intron splicing phases) and BnATG16 subfamilies demonstrated splicing phases zero and two whereas BnATG10, BnATG20 (except BnATG20b with all three intron splicing phases), and BnVTI12 subfamilies showed splicing phases zero and one. To detect conserving motifs in BnATG proteins, Multiple Em for Motif Elicitation (MEME) was used (Figure 6 and Figure 7). Twenty motifs were nearly identified in almost all subfamilies, but the lowest number of motifs was observed in the BnVIT12 subfamily with four motifs, followed by ATG20 subfamily with six motifs. The main BnATGs conserved domains were Pkinase_Tyr, Autophagy_act_C, ATG, APG, WD40, BCAS3, Vps, PX, Peptidase_C54, PI3_PI4_kinase, and V-SNARE (Supplementary Table S3).

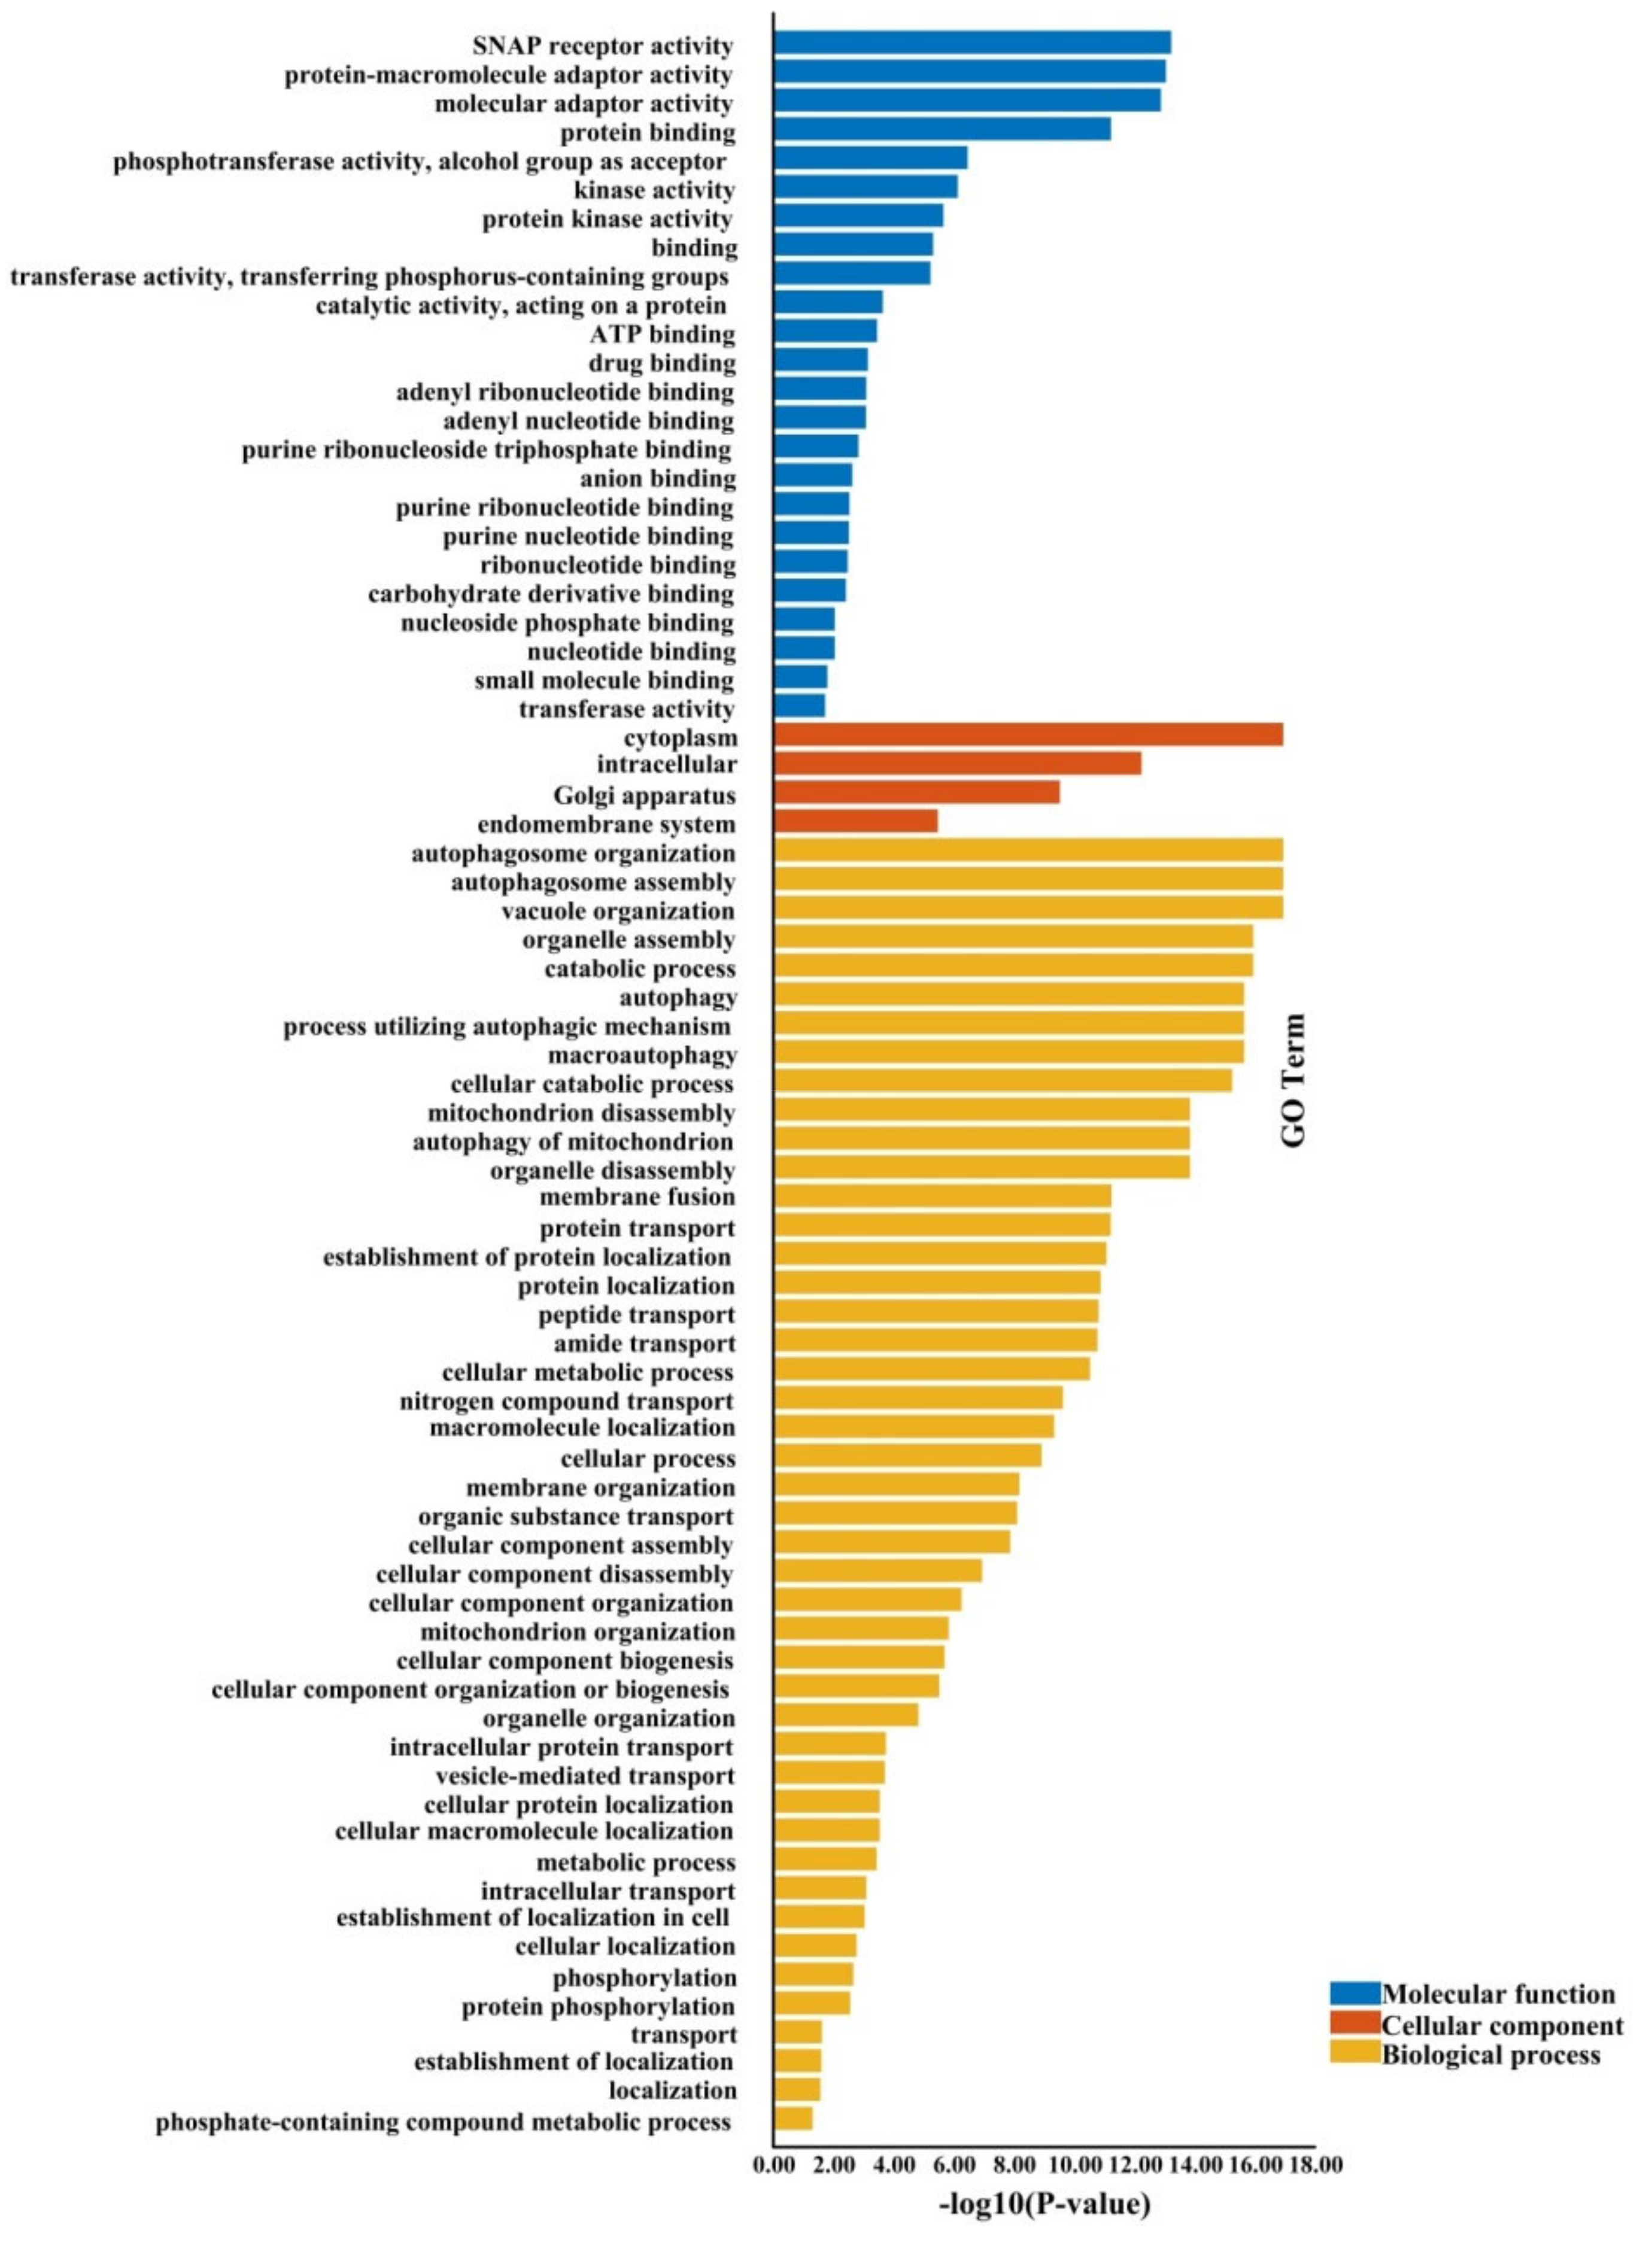
2.5. The Gene Ontology Annotations and Cis-Regulatory Elements of BnATGs

The gene ontology (GO) annotations of 127 BnATGs proteins were determined using TBtools [46] due to GO terms (Figure 8, Supplementary Table S4). Considering Figure 8, BnATGs are involved in the various biological processes, molecular functions, and cellular components. As excepted, most of BnATGs are predicted to the function in autophagy-related processes including autophagosome organization (13 BnATGs), autophagosome assembly (13), vacuole organization (13), organelle assembly (13), catabolic process (52), autophagy (52), a process utilizing autophagic mechanism (52), macroautophagy (13), and cellular catabolic process (52). Moreover, the cellular component prediction indicated that rapeseed ATGs were primarily localized in the intracellular (45), which was followed by cytoplasm (43). BnATGs in the molecular function category were mainly involved in protein binding (39), soluble N-ethylmaleimide-sensitive factor attachment protein (SNAP) receptor activity (8), protein-macromolecule adaptor activity (8), and macromolecule adaptor activity (8).
To better evaluate the biological function of BnATGs, 1.5 Kb upstream of their transcriptional start codon (ATG) was examined using the PlantCare database to find cis-acting elements (Supplementary Table S5). A total of 91 cis-elements were found in the B. napus ATG gene family, which can regulate gene expression responding to five groups, including regulatory elements, light, developmental stages, phytohormones, and environmental stresses. The highest frequency of cis-elements was related to Myb (87.40%), followed by MYC (82.67%), ARE (76.37%), and G-box (70.07%). The lowest frequency of cis-acting regulatory elements was also related to re2f-1 (only in BnVPS15b), NON (only in BnVPS15a), L-box (only in BnATG5d), HD-Zip3 (only in BnATG1h), GATT-motif (only in BnATG14a), CAG-motif (only in BnATG1h), Box II-like sequence (only in BnATG5d), AUXRE (only in BnATG18p), and 4cl-CMA1b (only in BnATG18m). Eight hundred and sixty-three stress-responsive elements were found in BnATGs, indicating that they might have a potential function to regulate the B. napus response to various stresses. Likewise, 41, 22, 5, and 3 cis-regulatory elements were found in BnATGs related to meristem, endosperm, shoot, and seed, respectively (Supplementary Table S5). Due to the promoter analysis results, the BnATGs could have a potential function in different processes, including B. napus growth, development, and response to various environmental stresses.

2.6. The Prediction of Simple Sequence Repeats (SSRs) in BnATGs

137 SSRs were detected in 73 out of 127 BnATG genes (Table 1). Most genes had a single SSR except BnATG9a (7 SSRs), BnATG9c (6 SSRs), BnATG101c (5 SSRs), BnTORa (5 SSRs), BnATG1b (4 SSRs), BnATG6a (3 SSRs), BnATG11b (3 SSRs), BnATG18a (3 SSRs), BnTORb (3 SSRs), BnATG18l (4 SSRs), BnATG8l (3 SSRs), BnATG8q (3 SSRs), BnATG18x (3 SSRs), BnATG20b (3 SSRs), BnATG101d (3 SSRs), BnVTI12b (3 SSRs), BnATG1a (2 SSRs), BnATG1f (2 SSRs), BnATG1i (2 SSRs), BnATG5a (2 SSRs), BnATG8c (2 SSRs), BnATG8d (2 SSRs), BnATG8h (2 SSRs), BnATG8j (2 SSRs), BnATG8y (2 SSRs), BnATG11a (2 SSRs), BnATG13a (2 SSRs), BnATG13d (2 SSRs), BnATG18m (2 SSRs), BnATG20a (2 SSRs), BnATG101e (2 SSRs), BnTORc (2 SSRs), BnVPS15a (2 SSRs), BnVPS15b (2 SSRs), and BnVTI12f (2 SSRs). The highest frequency was related to tri-nucleotide repeats (62 SSRs), which were followed by tetra-nucleotide repeats (40 SSRs), di-nucleotide repeats (21 SSRs), penta-nucleotide repeats (11 SSRs), and hexa-nucleotide repeats (3 SSRs).

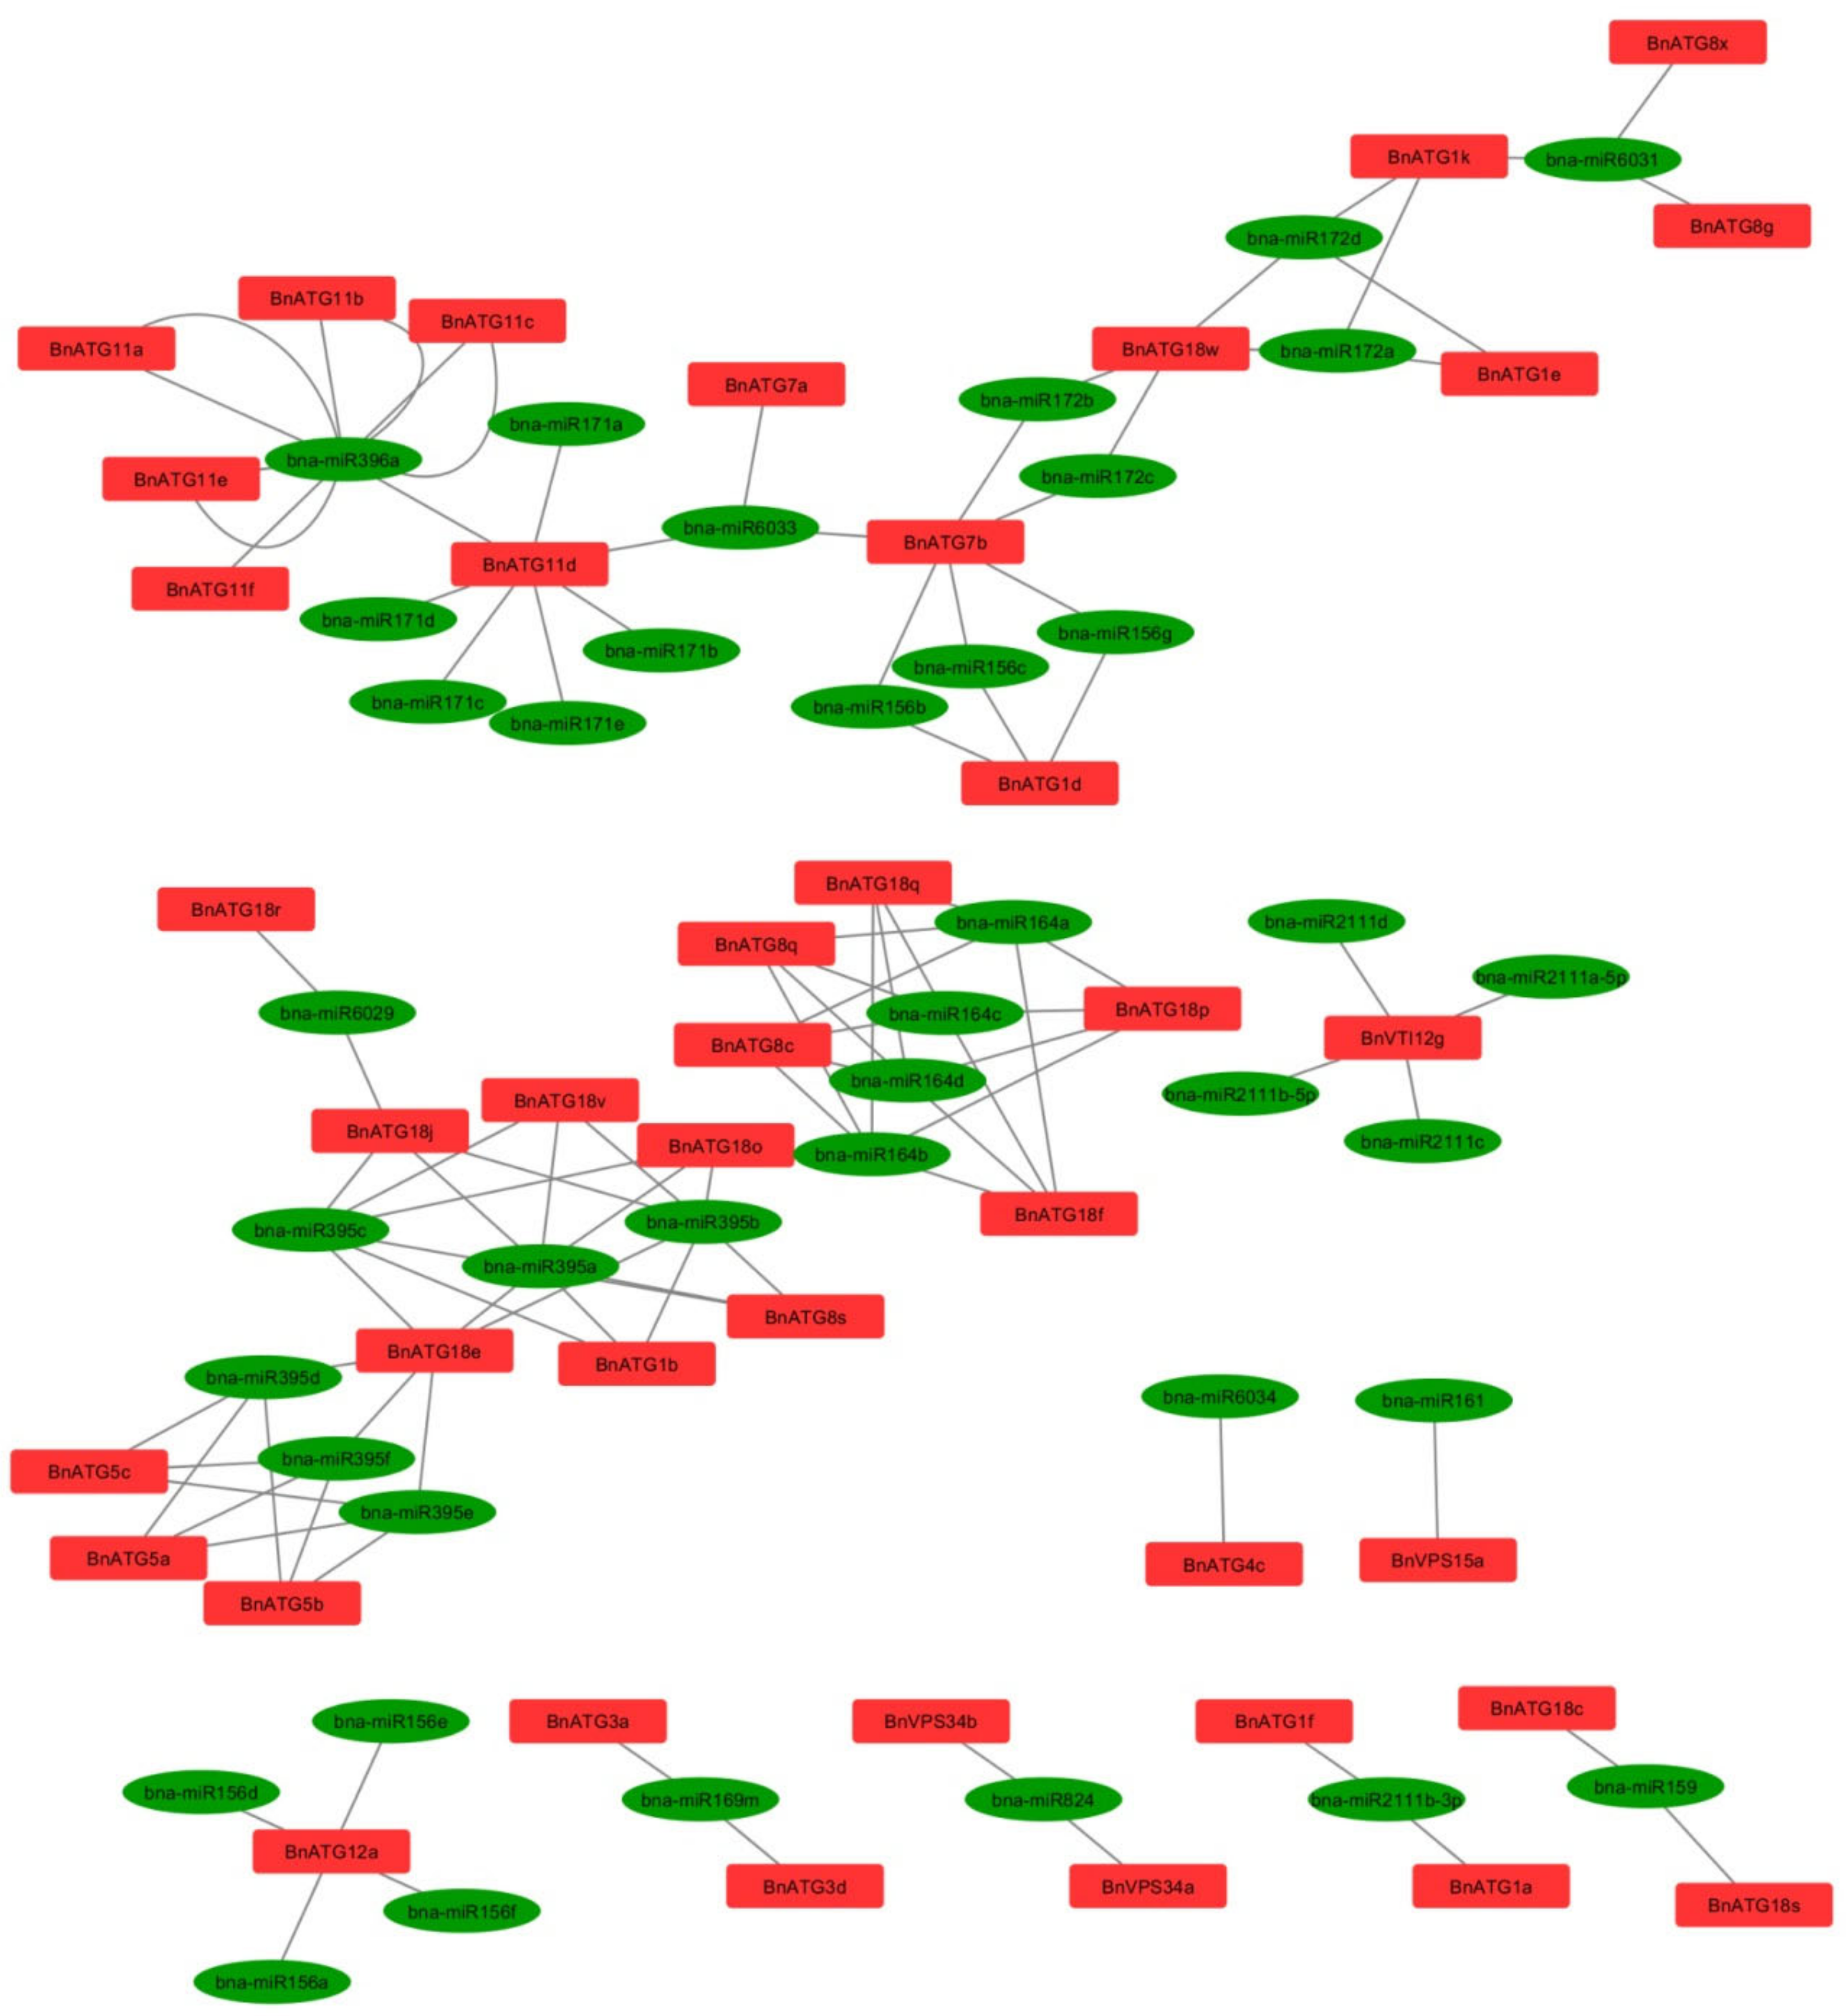
2.7. BnATG-Targeted miRNAs Prediction

Due to the present results, 107 miRNAs for 41 BnATGs targets were identified (Figure 9 and Supplementary Table S6). miRNA’s relationship with their targets was not one by one, and many of them targeted the same gene. For example, BnATG11d transcript was co-targeted by seven miRNAs named bna-miR171a, bna-miR171b, bna-miR171c, bna-miR171d, bna-miR171e, and bna-miR6033. In contrast, one miRNA was predicted to target multiple transcripts, such as bna-miR395a, which can suppress the expression of BnATG18e, BnATG18j, BnATG18o, BnATG18v, BnATG1b, and BnATG8s.

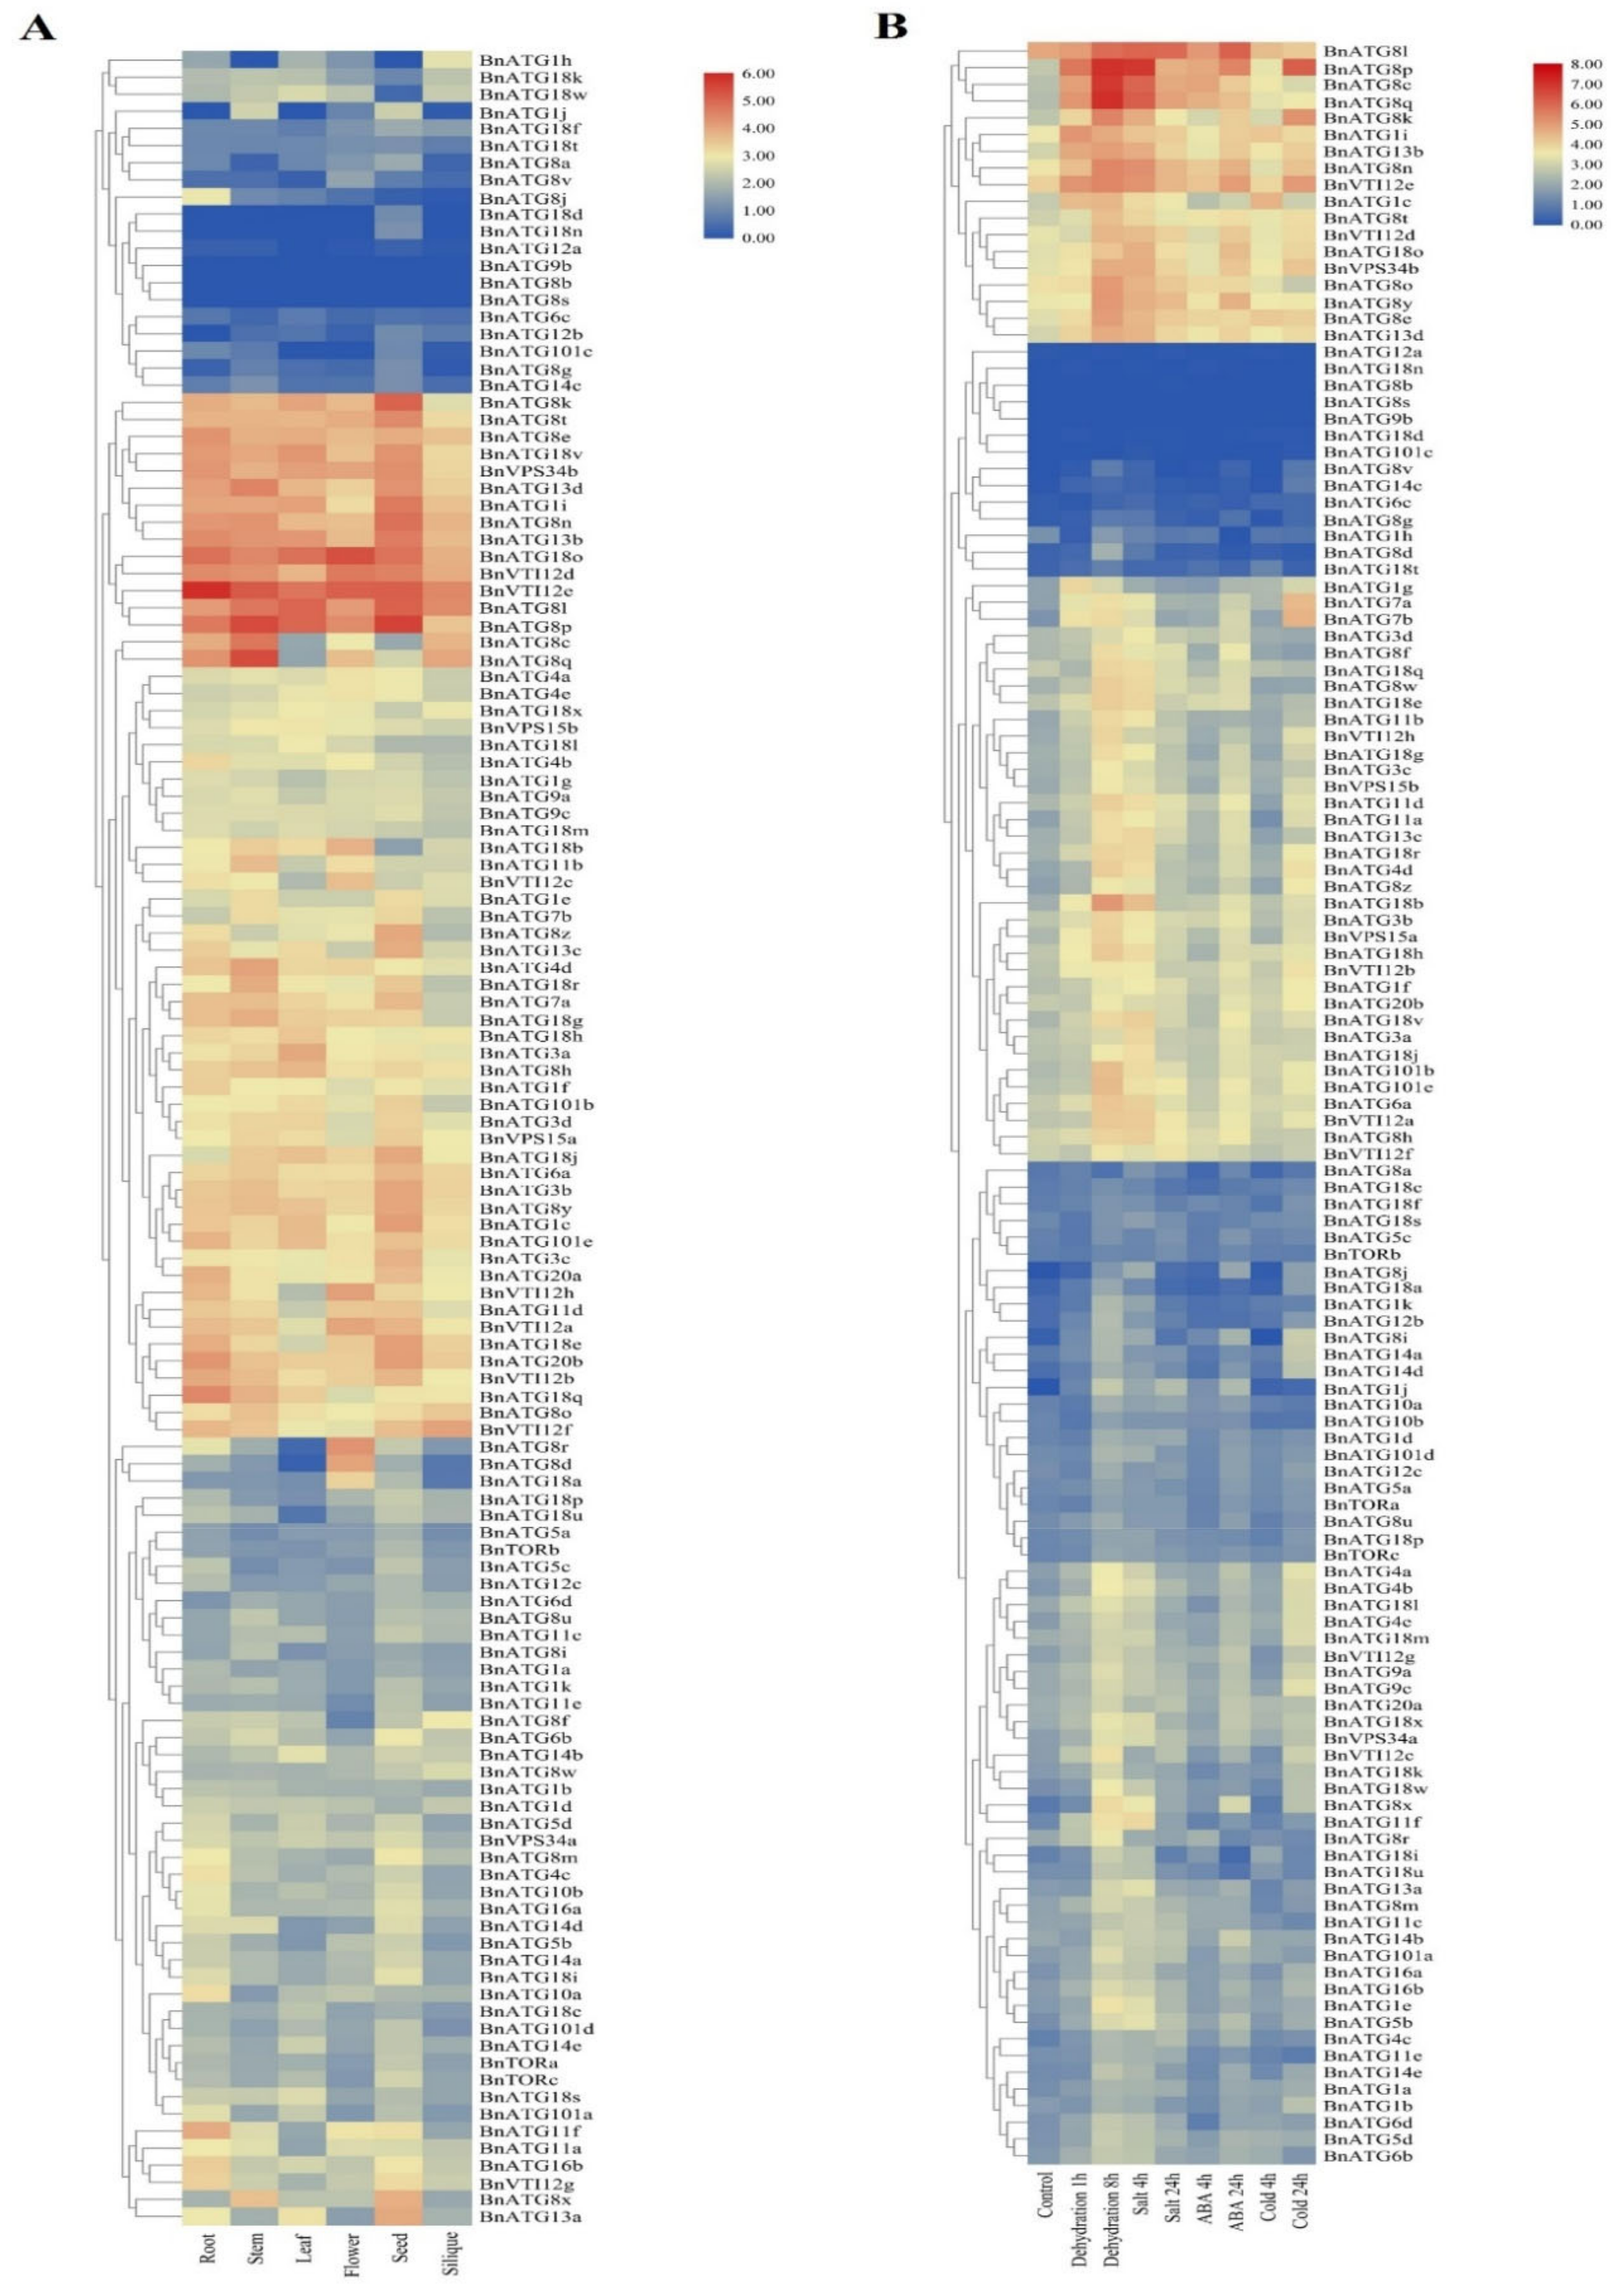
2.8. The Expression Analysis of BnATGs at Various Developmental Stages

The RNA-seq datasets of Zhang et al. [47] were analyzed to identify differentially expressed ATG genes in roots, stems, leaves, flowers, seeds, and siliques in B. napus under normal and stress conditions (Figure 10A). Most of the BnATGs were induced in the flowering development, while BnATG8b, BnATG8s, BnATG18n, BnATGd, BnATGb, and BnATG101c were repressed in this stage. Moreover, all BnATGs indicated low-to-high expression in all tissues of B. napus, whereas BnATG1h (in stem and seed), BnATG1j (in root and leaf), BnATG12b (in root), BnATG18d, BnATG18n (in all tissues except seed), and BnATG101c (in leaf and flower) showed no obvious expression.

2.9. The Expression Profile of BnATGs under Abiotic Stresses

The RNA-seq datasets of Zhang et al. [47] for B. napus related to salt, cold, dehydration, and Abscisic acid (ABA) treatments were analyzed. The results (Figure 10B) indicated that the expression of autophagy genes depends on the stress type. For instance, BnATG818b expression was up-regulated under dehydration (after 8 h) and salt stresses (after 4 h), while it showed a moderate-to-low expression under other abiotic stresses. The highest gene expression response to dehydration (after 1 h) was related to BnATG8p (increased by 2.74 folds compared to control), while the highest expression in response to dehydration after 8 h was related to BnATG8q.
Furthermore, we found that BnATG8p expression was up-regulated in response to all abiotic stresses. Indeed, the expression of BnATG8p was 2.59, 1.70, 2.00, and 2.26 higher compared to control under dehydration (after 8 h), salinity (after 24 h), ABA (after 24 h), and cold (after 24 h) treatments, respectively. Under dehydration treatment, the expression of all BnATGs was increased, whereas the expression of BnATG8a and BnATG12a was reduced, and the expression of BnATG8b, BnATG8s, BnATG9b, and BnATG101c unchangeably remained. After 24 h under salinity stress, the expression of the majority of BnATGs was up-regulated except BnATG8s, BnATG8v, BnATG9b, BnATG18n, and BnATG101c, which exhibited a steady expression. Likewise, except BnATG8b, BnATG8s, and BnATG9b genes, which showed no expression, the level of BnATGs transcripts increased in response to ABA treatment. Down-regulated expression of BnATG1h, BnATG8d, BnATG8v, BnATG10b, BnATG12a, BnATG18c, BnATG18i, BnATG18k, BnATG18s, BnATG18u, and BnVTI12f genes was also found. The results of expression analysis were similar in the case of ABA and cold treatments except for BnATG3d, BnATG6b, BnATG8f, BnATG8h, BnATG8l, BnATG8m, BnATG8o, BnATG8w, BnATG10a, BnATG11c, BnATG11e, BnATG18q, BnATG18t, BnATG18u, BnATG101a, and BnTORb genes, which exhibited a down-regulation under cold stress and up-regulation under ABA treatment (Supplementary Table S7).

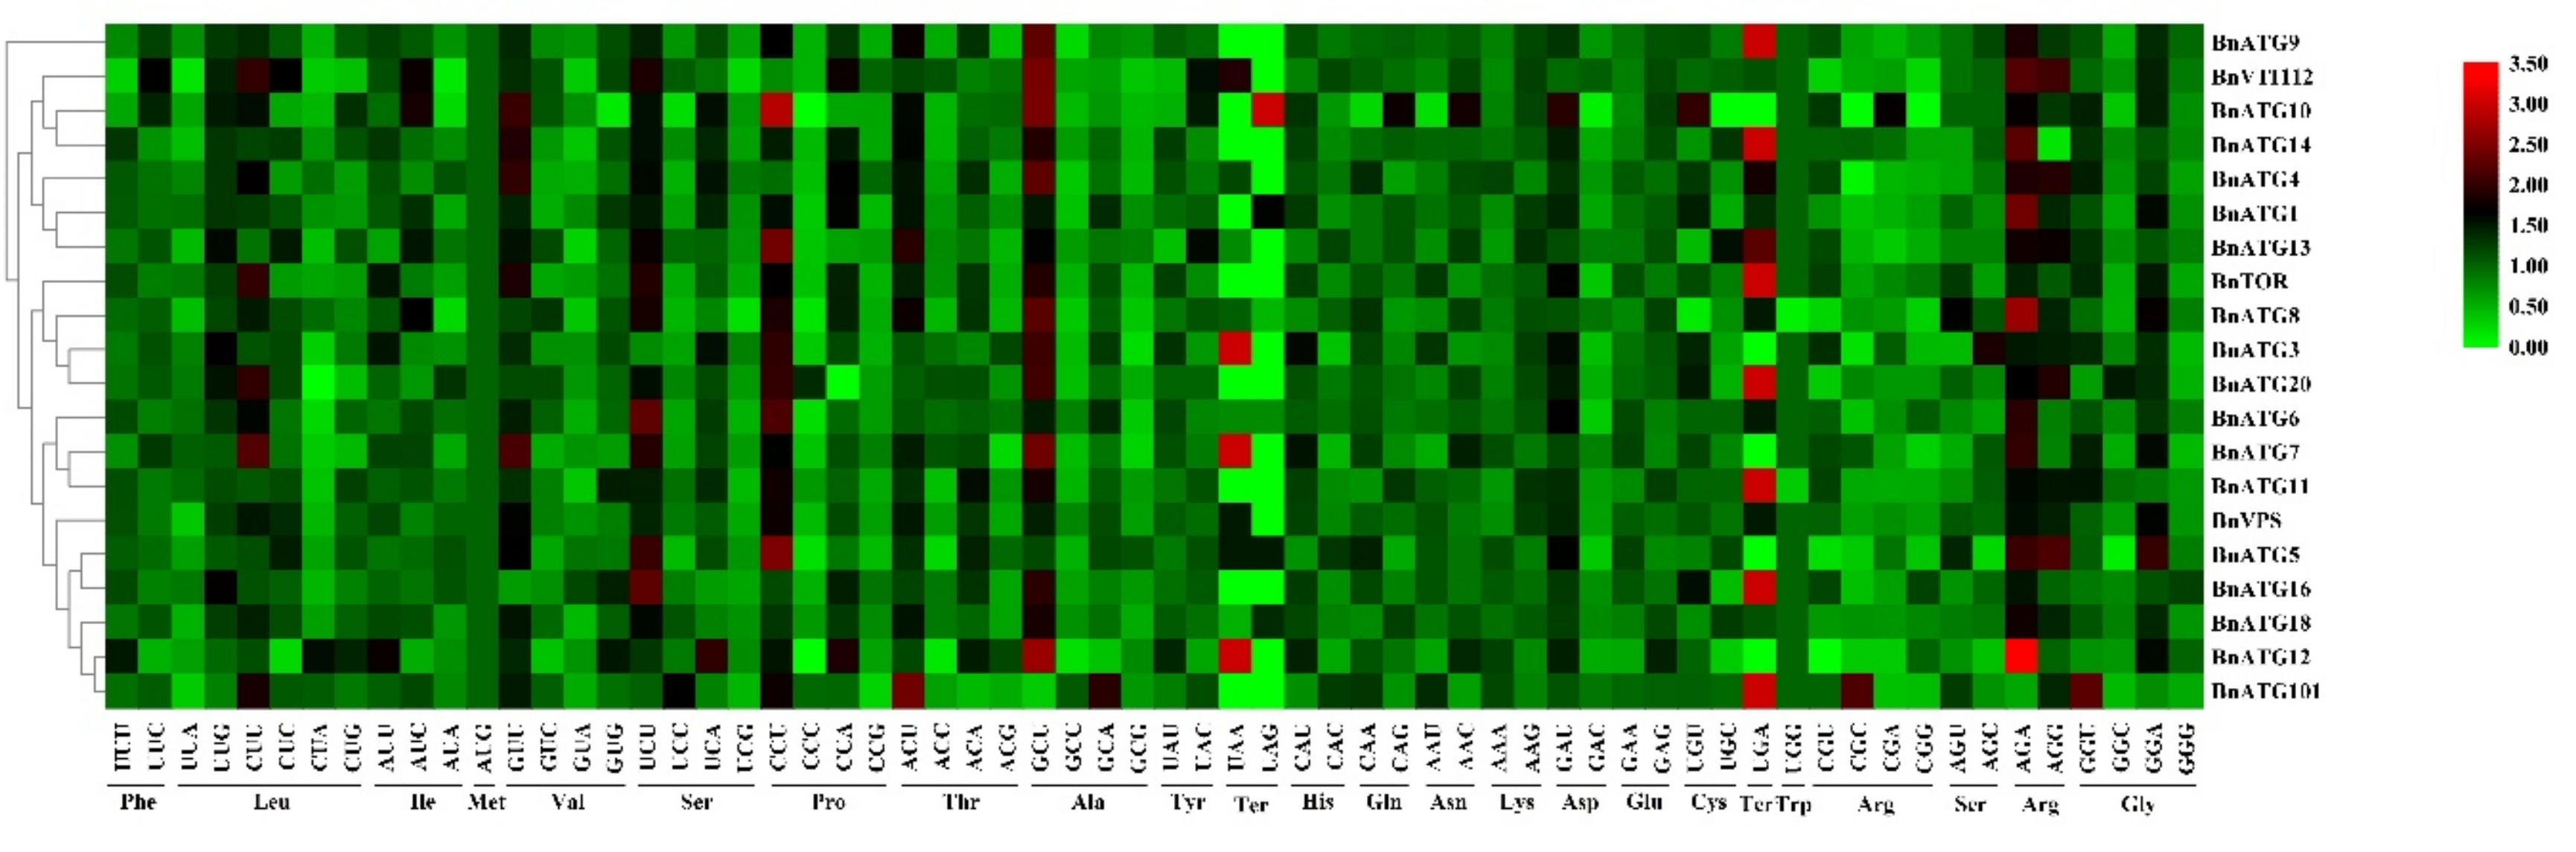
2.10. The Codon Usage Bias Analysis of BnATGs

The results of codon usage bias analysis of BnATG are presented in Supplementary Table S8. The GC value for studying genes was in the range of 0.38–0.55, and the GC3s value was calculated to be between 0.32 and 0.66. Due to the significant correlation between GC and GC3, the mutation is the main factor in the formation of codons. Indeed, if the correlation between these two parameters is significant, the mutation is the main factor in the formation of codons. If there had been no correlation between GC and GC3s, the main factor in codon formation would have been a natural selection [48]. codon adaptation index (CAI) is usually used to predict the expression levels of genes, which was in the range of 0.17–0.28 in BnATGs. The closeness of CAI to 1 implies a stronger codon preference and higher gene expression.
A relative synonymous codon usage (RSCU) > 1 shows that the codons are applied more than other synonymous, an RSCU = 1 indicates no preference for codons, and if RSCU < 1, the codons are rarely used by genes [49]. There are 32 codons in BnVPS34; 31 codons in BnATG1, BnATG9, and BnATG11; 30 codons in BnATG3, BnATG5, BnATG7, BnATG8, and BnATG14; 29 codons in BnVTI12; 28 codons in BnATG16, BnATG20, BnATG101, and BnTOR; 27 codons in BnATG4, BnATG6, BnATG10, and BnATG13; and 26 codons in BnATG12 with RSCU > 1, showing that these codons are the preferred codons for each gene subfamily. The higher RSCU values showed more frequent codons for each subfamily shown in red, while the lower RSCU value is indicated in green color (Figure 11). As shown in Figure 11, BnATGs were classified into three clusters based on the RSCU value, including cluster I (BnATG9), cluster II (BnATG1, BnATG4, BnATG10, BnATG14, BnATG13, and BnVTI12), and cluster III (BnTOR, BnVPS, BnATG101, BnATG3, BnATG5, BnATG6, BnATG7, BnATG8, BnATG11, BnATG12, BnATG16, BnATG18, and BnATG20). Each cluster showed a similar codon preference.

3. Discussion

In present study, a total of 20 core ATGs (ATG1, ATG3–4, ATG6–14, ATG16, ATG18, ATG20, ATG101, VPS15, VPS34, TOR, and VTI12) including 127 members of ATG gene family were identified in B. napus, which is considerably greater than the number of ATG genes in Z. mays (45 genes) [29], Arabidopsis (40 genes) [42], S. italica (37 genes) [38], V. vinifera (35 genes) [12], C. sinensis (35 genes) [40], O. sativa (33 genes) [35], M. acuminate (32 genes) [39], N. tabacum (30 genes) [36], and C. annuum (29 genes) [37]. The ATG2 subfamily was not identified in the B. napus. Due to the number of identified ATGs in plants, it can be concluded that there is no significant relationship between genome size and the number of genes. For instance, foxtail millet and tobacco have 37 and 30 ATG genes, respectively, while the genome size of these two plants is 490 Mb and 4.5 Gb, respectively. The segmental and tandem duplications can affect the formation of gene families. Therefore, the observed difference in the number of identified ATGs may be related to the duplication during plant evolution. The identified BnATGs were categorized into ATG1/13 kinase complex, PI3K complex, ATG9/2/18 complex, ubiquitin-like ATG8, and PE conjugation pathway, ubiquitin-like ATG12, and ATG5 conjugation pathway, and SNARE groups (Supplementary Table S1). BnATG8, BnATG18, and BnATG1 had multiple copies compared to other core BnATGs with 26, 24, and 11 members, respectively. The uneven distribution of ATGs has already been observed in rice [35], grapevine [12], and wheat [50]. The BnATGs were widely distributed in B. napus genome, which can be related to its different ancestors. Studying the gene duplication events is necessary to better understand the expansion of the gene family and the role of genes. In the present survey, both segmental (96.96%) and tandem (3.04%) duplications resulted in the generation of multiple copies of ATG genes in B. napus. The Ka/Ks ratios of the most duplicated BnATGs were <1 except for three duplicated gene pairs (BnATG16a/16d, BnATG8m/BnATG8a, and BnATG18g/BnATG18r) with Ka/Ks > 1 and two duplicated gene pairs (BnATG1h, BnATG1j, and BnATG18u/BnATG18t) with no Ka/Ks value due to the same sequence. It is well known that the alterations in the coding region of duplicated genes during the evolution resulted in different functions associated with amino acid substitution or divergence in exon–intron structure [51]. In general, the importance of the functional role of ATGs in B. napus was determined due to the strong purifying selection in the BnATG gene family.
Considering the phylogenetic tree, a close relation of BnATGs with their counterparts was observed, which related to their sequence conservation and similar function. All members of ATG subfamilies showed similar motif distribution, suggesting that the protein structure was conserved in each subfamily. The phylogenetic distribution of B. napus ATG proteins were associated with their motif compositions. BnATG1 subfamily had common motifs 1–2, 5–7, and 10. The difference among the motif compositions of BnATG1a/BnATG1f and BnATG1g/BnATG1b was only the existence of motif 18 in BnATG1g/BnATG1b cluster. Likewise, BnATG1c/BnATG1i/BnATG1k/BnATG1e cluster was separated from the two clusters mentioned above due to the lack of motifs 9 and 20 and the existence of motifs 13 and 17. The BnATG1d/BnATG1j/BnATG1h cluster was completely separated from other BnATG1s due to the lack of motifs 3–4, 8–9, and 11–20. BnATG5s, BnATG7s, BnATG11s, BnATG20s, BnATG101s, BnTORs, and BnVIT12s demonstrated the same motif contents for each subfamily, while the BnATG4b/BnATG4d cluster of BnATG4 subfamily had specific motifs 15, 16, and 18; thus, it clustered in a separated clade. The BnATG6 subfamily, BnATG6c was separated from other BnATGs due to the lack of common motifs 3, 5, 9, 11–12, and 16. BnATG8s were clustered into three clades due to their evolutionary relationships which are similar to their motif contents (Figure 1). Clade I contained motifs 1–4 except for BnATG8o/BnATG8w with motif 5 and BnATG8y with motifs 8–9, 15, 17–18, and 20. The motif contents of clade II were similar to clade I (motifs 1–4) except for BnATG8x and BnATG8s with motif 7. The clade III members contained motifs 1–3, and 6 except for BnATG8h with the lack of motif 6. BnATG9b had only motifs 1, 3, 5–6, 9, 15, and 18; thus, its cluster was separated from other BnATG9s. The difference between BnATG13d/BnATG13b cluster and BnATG13a/BnATG13c clusters was related to the existence of motifs 17–19 in the second cluster. The BnATG14e/BnATG14b cluster was also separated from the BnATG14a/BnATG14d/BnATG14c cluster due to the existence of motifs 5 and 16. BnATg18s were clustered into III groups. Common motifs of Clade I were 1, 2, 5, and 7–10, while clade II contained motifs 1, 2, and 7–8. Likewise, special motifs 3–4, 8, 12–18, and 20 were detected in clade III. BnVPS34 subfamily was completely separated from the BnVPS15 subfamily due to the different motif compositions. Exon–intron structure and splicing phase are important factors in the evolution of gene families [52]. Intron phase 0 and 1 showed the highest and high conservations, respectively, while intron phase 2 indicates the lowest conservation [53,54]. The rate of phases zero and one in all subfamilies including BnATG1 (84.21%), BnATG3 (60%), BnATG4 (66.66), BnATG5 (89.28%), BnATG6 (55.88%), BnATG7 (80%), BnATG8 (74.31%), BnATG9 (56.25%), BnATG10 (100%), BnATG12 (100%), BnATG14 67.3%), BnATG16 (62.5%), BnATG18 (76.06%), BnATG20 (88.8%), BnVTI12 (100%), BnTOR (85.54%), BnATG101 (83.33%), BnVPS15 (76%), and BnVPS34 (75%) was higher than phase two except for BnATG11 (50%) and BnATG13 (50%), which ascertained the low diversity in the structure of these genes and high conservation in protein function of the BnATG family.
SSRs are short tandem repeats of a simple motif of 1–6 nucleotides, reported to play a significant role in controlling gene expression [55]. In the current paper, tri-nucleotide repeats (45.25%) were higher than other SSRs. The type of dominant SSRs is taxon-dependent, which varies in different plant species, and in general, the frequency of AT repeats is higher in dicot than monocots [56]. In future research, SSR polymorphisms in BnATGs may be suitable to select the genotypes with higher levels of resistance to abiotic stresses using marker-assisted selection techniques.
miRNAs are a group of 19–24 bp non-coding small RNAs, playing significant roles in plant growth and response to the environmental stresses through post-transcriptional changes [57]. Therefore, bioinformatics methods have helped predict the target of miRNAs in the shortest possible time. In BnATG1, BnATG3, BnATG4, BnATG5, BnATG8, BnATG12, BnATG18, BnVPS15, and BnVTI12 subfamilies, six (BnATG1a-b, BnATG1e-f, and BnATG1k), two (BnATG3a and BnATG3d), one (BnATG4c), five (BnATG5a-c), five (BnATG8c, BnATG8g, BnATG8q, BnATG8s, and BnATG8x), one (BnATG12a), 11 (BnATG18c-f, BnATG18j18o-s, and BnATG18v-w), one (BnVPS15a), and one (BnVTI12g) transcripts were targeted by B. napus miRNAs, respectively. Although no target was found in BnATG6, BnATG9, BnATG10, BnATG13, BnATG14, BnATG16, BnATG101, and BnTOR subfamilies, all members of BnATG11, BnATG7, and BnVPS34 were targeted by miRNAs. mir156 is essential to regulate plant transition time from a juvenile to an adult in the vegetative phase [58]. Therefore, it was shown that miR172 is involved in regulating flowering time [59,60]. miR159, miR169, and miR395 play a role in the regulation of seed germination, response to salinity stress, and sulfate starvation, respectively [61,62,63]. Likewise, miR61 and miR171 are down-regulated under salinity and up-regulated under drought conditions in B. napus, respectively [64]. miR164 and miR396 are involved in seed germination and response to abiotic stresses [65,66,67], and miR824 is progressively accumulated in response to heat exposure [68]. miR2111 is important in response to phosphorus deprivation, which is ascertained in B. napus [69]. Finally, miR6029 is necessary for fatty acid biosynthesis during B. napus seed development [70].
Considering promoter analysis, the highest number of stress-responsive elements was observed in BnATG8r with 12 of 20 stress-related cis-elements. The existence of regulatory elements associated with response to stresses, light, and hormones indicates that BnATGs are involved in the plant response to various stresses and biological processes. Likewise, GO annotation found that most BnATGs are included in the biological process, most of which are related to stress conditions response. The presence of different regulatory elements, involved in various biological processes, in the promoter of BnATG genes and post-transcriptional regulation of these genes by miRNAs show the complex and precise mechanism regulating the expression of these genes that leads to the various functions of BnATGs.
An analysis of the expression profile data published by Zhang et al. [47] indicated that the expression profile of genes helps to determine their function. The expression analysis indicated that most BnATGs are involved in B. napus development and response to abiotic stresses, which is in line with previous researches [9,40,42]. For instance, BnATG1c, BnATG1i, BnATG3a-d, BnATG6a, BnATG7a, BnATG8e, BnATG8l, BnATG8n, BnATG8k, BnATG8t, BnATG8p, BnATG8x, BnATG8y, BnATG8z, BnATG13a-d, BnATG18e, BnATG18o, BnATG18v, BnATG20a-b, Bnvps34b, BnVTI12a-b, and BnVTI12d-f revealed a high level of transcripts in seed, suggesting that they may be involved in the regulation of seed development. RNA-seq data analysis revealed that the ATG gene expression, in response to abiotic stresses, depends on the stress type and duration. These findings are inconsistent with those of Shangguan et al. [12]. For example, BnATG18b and BnVTI12 genes were up-regulated by salt after 4 h of treatment, while they were repressed after 24 h under salinity condition. Considering the present study, the expression level of BnATG8p and BnATG8q was the highest among other BnATGs under dehydration conditions after 1 and 8 h, respectively. Likewise, the expression of BnATG8p and BnATG8l was the highest under salinity and ABA treatment. The transcript levels of BnATG1c and BnATG8p were also higher than other BnATGs in response to cold stress after 4 h and 24 h, respectively. These results indicated the potential key role of these genes in B. napus response to abiotic stresses, which can be used in future research to develop stress-resistant cultivars. The BnATGs exhibited different expression patterns, even in the same subfamily. For instance, in the BnATG8 subfamily, BnATG8l, BnATG8n, BnATG8p, and BnATG8q were significantly up-regulated by dehydration, while no obvious changes in BnATG8s and BnATG8v expression was observed. In general, the expression of the BnATG8 subfamily under all abiotic stresses was higher than other subfamilies, which is the following results obtained in Arabidopsis [38], foxtail millet [50], and wheat [38,50,71]. ATG8 is a ubiquitin-like protein conjugated to phosphatidylethanolamine (PE) catalyzed by ATG7, ATG3, and ATG12-ATG5 complex [72]. ATG8-PE complex is essential for autophagosome formation through the membrane connection and remodeling [73]. The expression of ATG8 in wheat and Arabidopsis increases plant tolerance to osmotic stress [13,74]. The expression of GmATG8c in Arabidopsis and SiATG8a in rice also improved plant tolerance to nitrogen deficiency [38,75]. Likewise, ATG8 showed a response to leaf senescence due to nitrate conditions in barley [76].
In this study, the factors involved in codon usage bias (CUB), including expression level, GC value, and mutation were investigated. CUB index varies among genes in each genome. Effective codon number (ENC) value was used to evaluate the effective codon number between 20 and 61.20 [77]. In this study, the ENC value was between 43.8 and 61, indicating that there are various synonymous codons among studying genes. Highly expressed genes have a higher codon preference with higher CAI and lower NC values. However, the genes with low expression have more types of rare codons; thus, they have a lower codon preference and a lower CAI but a higher NC. BnATG8p, BnATG8q, and BnATG8l genes, which had higher expression under different abiotic stresses, revealed almost higher CAI and relatively lower NC. Most of the BnATGs showed GC content < 0.5, indicating that B. napus ATGs have no perceptible preference for GC nucleotides. Only 12.59% of BnATGs revealed GC3s value > 0.5, indicating that codons with A/T end are preferred.

4. Materials and Methods

4.1. In Silico Identification of BnATG Genes

To determine the BnATG gene family in B. napus, related protein sequences in Arabidopsis [42], O. sativa [35], C. sinensis [40], N. tabacum [36], and V. vinifera [12] were obtained from Phytozome 12.1.6 database [78]. Then, the protein sequence of ATG genes related to the mentioned plants was used to identify BnATG genes in the BRAD database [43] using the BlastP algorithm (E.Value < 1e−5) [41]. The existence of ATGs domains in the obtained sequences was assessed using HMMscan databases [79]. Sequences without ATG domains were deleted, and the remaining genes were classified into different ATG groups based on the specific domain of each group. The genes were named by first adding Bn (Brassica napus), and then adding the name of the group and the English letters based on the chromosomal location of the genes. Molecular weight (MW), length, and theoretical isoelectric points (pI) of B. napus ATGs were calculated using the ProtParam tool of the ExPASY database [80]. To identify the cellular localization of proteins, subCELlular LOcalization (CELLO) has been applied [81].

4.2. Phylogenetic Analysis of B. napus ATG Gene Family

Full-length protein sequence alignment of B. napus, Arabidopsis, rice, sweet orange, tobacco, and the grapevine was handled using ClustalX 2.0.8 program to evaluate the evolutionary relationships of the ATG gene family. A phylogenetic tree of ATG proteins with 1000 bootstraps [82] constructed using MEGA 7 [83] by the neighbor-joining (NJ) method.

4.3. Chromosome Localization, Gene Duplication, and Selection Pressure

ATGs location on B. napus chromosomes was obtained from the Brassica database (BRAD) database [43]. Genes with a maximum interval of 10 genes on the same chromosome were regarded as tandem duplication [84]. Two criteria are considered to recognize segmental duplication, including more than 80% identification of the aligned region and more than 80% alignment coverage compared to the longer genes [85]. DnaSP ver. 5 software [86] was applied to compute the substitution rates of non-synonymous (Ka) per synonymous (Ks) of the duplicated genes to determine the type of selection pressure. The location of genes on chromosomes and the duplication relationship among them were presented using TBtools [46].

4.4. Exon–Intron Structure and Conserved Motifs

The gene structure of BnATGs was assessed using a gene structure display server (GSDS 2.0) [87]. This server evaluates the genomic DNA sequence of each gene based on its coding sequence and presents the exon, intron, 3′-UTR, 5′-UTR, and intron phase of the gene. Multiple Em for Motif Elicitation (MEME 5.0.5) was used to identify the conserved motifs of the ATG gene family [88]. A limit of 20 motifs, and minimum and maximum motifs length were 10 and 200, respectively.

4.5. Gene Ontology Annotations and Cis-Regulatory Element Identification

To investigate the functional role of ATGs in B. napus biology, gene ontology (GO) analysis was performed using TBtools [46]. Three levels of GO classification, including molecular functions, biological processes, and cellular components, were applied to present genes. An amount of 1.5 kb upstream of the initiation codon of ATG genes was retrieved from the Ensemble Plants database [89], and cis-acting regulatory elements were identified using PlantCare [90]. Only cis-elements with scores ≥ 6 were examined.

4.6. The Prediction of Simple Sequence Repeats (SSR) Markers and BnATG-Targeted miRNAs

SSR markers were detected in BnATG genes using the BatchPrimer3v1.0 server [91]. In the psRNATarget database, CD sequences of them were examined by considering default parameters to find BnATG-targeted miRNAs. The relationship between BnATGs and identified miRNA molecules was visualized using Cytoscape software [92].

4.7. Analysis of Previously Published B. napus RNA-Seq Data

Transcript data for silique, stem, leaf, flower, and root tissues as well as salinity (200 mM), ABA (25 μM), and cold (4C) stresses at 4 and 24 h after treatment and dehydration stress at 1 and 8 h after treatment are related to the study of Zhang et al. [47]. These data are available with the project ID CRA001775 at [93]. Initial quality analysis was performed on FastQ files using FastQC software [94], then preprocessing of raw sequence data was conducted and low quality reads, adapter sequences, and duplicate mapping reads were filtered using Trimmomatic on Linux [95]. The preprocessed FastQ files were aligned to the Brassica napus reference genome using STAR [96]. The counts obtained from STAR normalized to transcript per million (TPM). Log2 (TPM + 1) used to generate the heatmap utilizing TBtools [46]. Clustering the data was performed using the Pearson correlation coefficient and the complete linkage method.

4.8. Codon Usage Bias Analysis

The sequences were evaluated for the frequency of optimal codons (FOP), GC content, GC content at the third site position of codon (GC3s), codon adaptation index (CAI), effective codon number (ENC), and relative synonymous codon usage (RSCU) for the BnATGs using CodonW 1.4.2 [97]. Statistical analysis was performed using Excel software. Clustering the data was performed using the Pearson correlation coefficient and the complete linkage method using TBtools [46].

5. Conclusions

In recent years, bioinformatics tools have been used to identify important genes in increasing plant tolerance to biotic and abiotic stresses. On the other hand, autophagy-related genes have important roles in plant growth, development, and responding to environmental stresses. Therefore, in the present study, 127 BnATGs were detected using bioinformatics tools in rapeseed. The reason for expanding this gene family was the tandem and segmental duplications. Ka/Ks for most of the paired genes were <1, indicating a negative selection during the evolution of B. napus plants to maintain their function. Promoter analysis showed hormone- and stress-responsive elements in the BnATGs promoters, which is in line with gene ontology results suggesting their role in various plant biological processes. Likewise, the expression patterns of BnATGs ascertained their roles in different tissues under various environmental stresses in B. napus, which can be applied to develop stress-resistant cultivars in future studies. Besides, the mutation was the main factor in the formation of BnATGs codons. In addition, they are more likely to have A/T at the 3′ end of their codons. This study was performed to detect the molecular evolution and the possible function of BnATGs, and it has provided useful information about BnATGs for future studies.

Supplementary Materials

The following are available online at https://www.mdpi.com/2223-7747/9/10/1393/s1, Table S1: Features of rapeseed ATG proteins, ATG1/13 kinase complex, PI3K complex, ATG9/2/18 complex, ubiquitin-like ATG8, and PE conjugation pathway, ubiquitin-like ATG12, and ATG5 conjugation pathway, and SNARE groups shown in yellow, green, gray, red, blue, and pink colors, respectively; Table S2: Ka/Ks analysis of the BnATG duplicated paired genes, positive selection, segmental, and tandem duplications shown in yellow, blue, and green colors, respectively; Table S3: ATG protein domain. The existence of ATGs domains in the Arabidopsis, O. sativa, C. sinensis, N. tabaccum, and V. vinifera sequences was assessed using HMMscan databases; Table S4: Gene annotations of BnATGs, biological process, cellular component, and molecular function are shown in yellow, brown, and blue colors, respectively; Table S5: List of cis-acting elements in BnATGs promoters, cell-cycle- and tissue-specific, hormone-responsive, light-responsive, regulatory, stress-responsive, and unknown function elements are shown in red, yellow, blue, brown, green, and gray colors, respectively; Table S6: Putative BnATGs-targeted miRNA; Table S7: RNA-seq data analysis of BnATGs, the color boxes indicate expression values, the lowest (blue), medium (Pale goldenrod), and the highest (red); Table S8: Relative synonymous codon usage analysis (RSCU) of BnATGs.

Author Contributions

Conceptualization, C.J., A.A. and E.M.E.; methodology, E.M.E.; software, A.A. and E.M.E.; validation, C.J. and A.A.; formal analysis, M.K.; investigation, E.M.E., and A.A. resources, A.A.; data curation, Z.H. and A.A.; writing—original draft preparation, Z.H. and E.M.E.; writing—review and editing, C.J. and M.K.; visualization, A.A. and E.M.E.; supervision, C.J. and M.K.; project administration, M.K. All authors have read and agreed to the published version of the manuscript.

Funding

This research received no external funding.

Conflicts of Interest

The authors declare no conflict of interest.

References

  1. Li, F.; Vierstra, R.D. Autophagy: A multifaceted intracellular system for bulk and selective recycling. Trend. Plant Sci. 2012, 17, 526–537. [Google Scholar] [CrossRef] [PubMed]
  2. Klionsky, D.J.; Meijer, A.J.; Codogno, P.; Neufeld, T.P.; Scott, R.C. Autophagy and p70S6 Kinase. Autophagy 2005, 1, 59–61. [Google Scholar] [CrossRef] [PubMed] [Green Version]
  3. Wen, X.; Klionsky, D.J. An overview of macroautophagy in yeast. J. Mol. Biol. 2016, 428, 1681–1699. [Google Scholar] [CrossRef] [PubMed] [Green Version]
  4. Li, W.-W.; Li, J.; Bao, J. Microautophagy: Lesser-known self-eating. Cell. Mol. Life Sci. 2011, 69, 1125–1136. [Google Scholar] [CrossRef] [PubMed]
  5. Avin-Wittenberg, T.; Baluška, F.; Bozhkov, P.V.; Elander, P.H.; Fernie, A.R.; Galili, G.; Hassan, A.; Hofius, D.; Isono, E.; Le Bars, R.; et al. Autophagy-related approaches for improving nutrient use efficiency and crop yield protection. J. Exp. Bot. 2018, 69, 1335–1353. [Google Scholar] [CrossRef] [PubMed] [Green Version]
  6. Chen, L.; Liao, B.; Qin-Fang, C.; Xie, L.-J.; Huang, L.; Tan, W.-J.; Zhai, N.; Yuan, L.-B.; Zhou, Y.; Yu, L.-J.; et al. Autophagy contributes to regulation of the hypoxia response during submergence in Arabidopsis thaliana. Autophagy 2015, 11, 2233–2246. [Google Scholar] [CrossRef] [PubMed] [Green Version]
  7. Guiboileau, A.; Yoshimoto, K.; Soulay, F.; Bataillé, M.-P.; Avice, J.-C.; Masclaux-Daubresse, C. Autophagy machinery controls nitrogen remobilization at the whole-plant level under both limiting and ample nitrate conditions in Arabidopsis. New Phytol. 2012, 194, 732–740. [Google Scholar] [CrossRef] [PubMed]
  8. Li, W.-W.; Chen, M.; Zhong, L.; Liu, J.-M.; Xu, Z.-S.; Li, L.-C.; Zhou, Y.-B.; Guo, C.-H.; Ma, Y.-Z. Overexpression of the autophagy-related gene SiATG8a from foxtail millet (Setaria italica L.) confers tolerance to both nitrogen starvation and drought stress in Arabidopsis. Biochem. Biophys. Res. Commun. 2015, 468, 800–806. [Google Scholar] [CrossRef] [PubMed]
  9. Luo, L.; Zhang, P.; Zhu, R.; Fu, J.; Su, J.; Zheng, J.; Wang, Z.; Wang, D.; Gong, Q. Autophagy Is Rapidly Induced by Salt Stress and Is Required for Salt Tolerance in Arabidopsis. Front. Plant Sci. 2017, 8, 1459. [Google Scholar] [CrossRef] [Green Version]
  10. Slobodkin, M.R.; Elazar, Z. The Atg8 family: Multifunctional ubiquitin-like key regulators of autophagy. Essays Biochem. 2013, 55, 51–64. [Google Scholar] [CrossRef] [PubMed] [Green Version]
  11. Yoshimoto, K.; Hanaoka, H.; Sato, S.; Kato, T.; Tabata, S.; Noda, T.; Ohsumi, Y. Processing of ATG8s, Ubiquitin-Like Proteins, and Their Deconjugation by ATG4s Are Essential for Plant Autophagy. Plant Cell 2004, 16, 2967–2983. [Google Scholar] [CrossRef] [PubMed]
  12. Shangguan, L.; Fang, X.; Chen, L.; Cui, L.; Fang, J. Genome-wide analysis of autophagy-related genes (ARGs) in grapevine and plant tolerance to copper stress. Planta 2018, 247, 1449–1463. [Google Scholar] [CrossRef] [PubMed]
  13. Kuzuoğlu-Öztürk, D.; Yalcinkaya, O.C.; Akpınar, B.A.; Mitou, G.; Korkmaz, G.; Gozuacik, D.; Budak, H.; Akpinar, B.A. Autophagy-related gene, TdAtg8, in wild emmer wheat plays a role in drought and osmotic stress response. Planta 2012, 236, 1081–1092. [Google Scholar] [CrossRef] [PubMed]
  14. Liu, Y.; Xiong, Y.; Bassham, D.C. Autophagy is required for tolerance of drought and salt stress in plants. Autophagy 2009, 5, 954–963. [Google Scholar] [CrossRef] [Green Version]
  15. Shin, J.-H.; Yoshimoto, K.; Ohsumi, Y.; Jeon, J.-S.; An, G. OsATG10b, an autophagosome component, is needed for cell survival against oxidative stresses in rice. Mol. Cells 2009, 27, 67–74. [Google Scholar] [CrossRef]
  16. Minina, E.A.; Moschou, P.N.; Vetukuri, R.R.; Sanchez-Vera, V.; Cardoso, C.; Liu, Q.; Elander, P.H.; Dalman, K.; Beganovic, M.; Yilmaz, J.L.; et al. Transcriptional stimulation of rate-limiting components of the autophagic pathway improves plant fitness. J. Exp. Bot. 2018, 69, 1415–1432. [Google Scholar] [CrossRef]
  17. Wang, P.; Sun, X.; Jia, X.; Ma, F. Apple autophagy-related protein MdATG3s afford tolerance to multiple abiotic stresses. Plant Sci. 2017, 256, 53–64. [Google Scholar] [CrossRef]
  18. Hanaoka, H.; Noda, T.; Shirano, Y.; Kato, T.; Hayashi, H.; Shibata, D.; Tabata, S.; Ohsumi, Y. Leaf Senescence and Starvation-Induced Chlorosis Are Accelerated by the Disruption of an Arabidopsis Autophagy Gene. Plant Physiol. 2002, 129, 1181–1193. [Google Scholar] [CrossRef] [Green Version]
  19. Islam, S.; Proshad, R.; Kormoker, T.; Tusher, T.R. Autophagy-mediated Nutrient Recycling and Regulation in Plants: A Molecular View. J. Plant Biol. 2019, 62, 307–319. [Google Scholar] [CrossRef]
  20. Klionsky, D.J.; Abdelmohsen, K.; Abe, A.; Abedin, J.; Abeliovich, H.; Arozena, A.A.; Adachi, H.; Adams, C.M.; Adams, P.D.; Adeli, K.; et al. Guidelines for the use and interpretation of assays for monitoring autophagy 3rd ed. Autophagy 2016, 12, 1–222. [Google Scholar] [CrossRef] [Green Version]
  21. Tang, J.; Bassham, D.C. Autophagy in crop plants: What’s new beyond Arabidopsis? Open Biol. 2018, 8, 180162. [Google Scholar] [CrossRef] [PubMed] [Green Version]
  22. Su, T.; Li, X.; Yang, M.; Shao, Q.; Zhao, Y.; Ma, C.; Wang, P. Autophagy: An Intracellular Degradation Pathway Regulating Plant Survival and Stress Response. Front. Plant Sci. 2020, 11, 164. [Google Scholar] [CrossRef] [PubMed] [Green Version]
  23. Li, S.; Yan, H.; Mei, W.; Tse, Y.C.; Wang, H. Boosting autophagy in sexual reproduction: A plant perspective. New Phytol. 2020, 226, 679–689. [Google Scholar] [CrossRef] [PubMed]
  24. Chung, T.; Suttangkakul, A.; Vierstra, R.D. The ATG Autophagic Conjugation System in Maize: ATG Transcripts and Abundance of the ATG8-Lipid Adduct Are Regulated by Development and Nutrient Availability. Plant Physiol. 2008, 149, 220–234. [Google Scholar] [CrossRef] [PubMed] [Green Version]
  25. Breeze, E.; Harrison, E.; McHattie, S.; Hughes, L.; Hickman, R.; Hill, C.; Kiddle, S.; Kim, Y.-S.; Penfold, C.A.; Jenkins, D.; et al. High-Resolution Temporal Profiling of Transcripts during Arabidopsis Leaf Senescence Reveals a Distinct Chronology of Processes and Regulation. Plant Cell 2011, 23, 873–894. [Google Scholar] [CrossRef] [Green Version]
  26. Di Berardino, J.; Marmagne, A.; Berger, A.; Yoshimoto, K.; Cueff, G.; Chardon, F.; Masclaux-Daubresse, C.; Reisdorf-Cren, M. Autophagy controls resource allocation and protein storage accumulation in Arabidopsis seeds. J. Exp. Bot. 2018, 69, 1403–1414. [Google Scholar] [CrossRef] [Green Version]
  27. Kurusu, T.; Koyano, T.; Hanamata, S.; Kubo, T.; Noguchi, Y.; Yagi, C.; Nagata, N.; Yamamoto, T.; Ohnishi, T.; Okazaki, Y.; et al. OsATG7 is required for autophagy-dependent lipid metabolism in rice postmeiotic anther development. Autophagy 2014, 10, 878–888. [Google Scholar] [CrossRef]
  28. Wada, S.; Hayashida, Y.; Izumi, M.; Kurusu, T.; Hanamata, S.; Kanno, K.; Kojima, S.; Yamaya, T.; Kuchitsu, K.; Makino, A.; et al. Autophagy Supports Biomass Production and Nitrogen Use Efficiency at the Vegetative Stage in Rice. Plant Physiol. 2015, 168, 60–73. [Google Scholar] [CrossRef] [Green Version]
  29. Li, F.; Chung, T.; Pennington, J.G.; Federico, M.L.; Kaeppler, H.F.; Kaeppler, S.M.; Otegui, M.S.; Vierstra, R.D. Autophagic Recycling Plays a Central Role in Maize Nitrogen Remobilization. Plant Cell 2015, 27, 1389–1408. [Google Scholar] [CrossRef] [Green Version]
  30. Zomorodian, A.; Kavoosi, Z.; Momenzadeh, L. Determination of EMC isotherms and appropriate mathematical models for canola. Food Bioprod. Process. 2011, 89, 407–413. [Google Scholar] [CrossRef]
  31. Selvam, A.; Wong, J.W. Cadmium uptake potential of Brassica napus cocropped with Brassica parachinensis and Zea mays. J. Hazard. Mater. 2009, 167, 170–178. [Google Scholar] [CrossRef]
  32. Wang, B.; Liu, L.; Gao, Y.; Chen, J. Improved phytoremediation of oilseed rape (Brassica napus) by Trichoderma mutant constructed by restriction enzyme-mediated integration (REMI) in cadmium polluted soil. Chemosphere 2009, 74, 1400–1403. [Google Scholar] [CrossRef] [PubMed]
  33. Fiebelkorn, D.; Rahman, M. Development of a protocol for frost-tolerance evaluation in rapeseed/canola (Brassica napus L.). Crop. J. 2016, 4, 147–152. [Google Scholar] [CrossRef] [Green Version]
  34. Bassham, D.C.; Laporte, M.; Marty, F.; Moriyasu, Y.; Ohsumi, Y.; Olsen, L.J.; Yoshimoto, K. Autophagy in Development and Stress Responses of Plants. Autophagy 2006, 2, 2–11. [Google Scholar] [CrossRef] [PubMed]
  35. Xia, K.; Liu, T.; Ouyang, J.; Wang, R.; Fan, T.; Zhang, M. Genome-Wide Identification, Classification, and Expression Analysis of Autophagy-Associated Gene Homologues in Rice (Oryza sativa L.). DNA Res. 2011, 18, 363–377. [Google Scholar] [CrossRef] [PubMed] [Green Version]
  36. Zhou, X.-M.; Zhao, P.; Wang, W.; Zou, J.; Cheng, T.-H.; Peng, X.-B.; Sun, M.-X. A comprehensive, genome-wide analysis of autophagy-related genes identified in tobacco suggests a central role of autophagy in plant response to various environmental cues. DNA Res. 2015, 22, 245–257. [Google Scholar] [CrossRef] [PubMed] [Green Version]
  37. Ezhai, Y.; Eguo, M.; Ewang, H.; Elu, J.; Eliu, J.; Ezhang, C.; Egong, Z.-H.; Lu, M.-H. Autophagy, a Conserved Mechanism for Protein Degradation, Responds to Heat, and Other Abiotic Stresses in Capsicum annuum L. Front. Plant Sci. 2016, 7, 131. [Google Scholar] [CrossRef] [Green Version]
  38. Li, W.; Chen, M.; Wang, E.; Hu, L.; Hawkesford, M.J.; Zhong, L.; Chen, Z.; Xu, Z.; Li, L.; Zhou, Y.; et al. Genome-wide analysis of autophagy-associated genes in foxtail millet (Setaria italica L.) and characterization of the function of SiATG8a in conferring tolerance to nitrogen starvation in rice. BMC Genom. 2016, 17, 797. [Google Scholar] [CrossRef] [Green Version]
  39. Wei, Y.; Liu, W.; Hu, W.; Liu, G.; Wu, C.; Liu, W.; Zeng, H.; He, C.; Shi, H. Genome-wide analysis of autophagy-related genes in banana highlights MaATG8s in cell death and autophagy in immune response to Fusarium wilt. Plant Cell Rep. 2017, 36, 1237–1250. [Google Scholar] [CrossRef]
  40. Fu, X.-Z.; Zhou, X.; Xu, Y.-Y.; Hui, Q.-L.; Chang-Pin, C.; Li-Li, L.; Peng, L.-Z. Comprehensive Analysis of Autophagy-Related Genes in Sweet Orange (Citrus sinensis) Highlights Their Roles in Response to Abiotic Stresses. Int. J. Mol. Sci. 2020, 21, 2699. [Google Scholar] [CrossRef] [Green Version]
  41. Han, B.; Xu, H.; Feng, Y.; Xu, W.; Cui, Q.; Liu, A. Genomic Characterization and Expressional Profiles of Autophagy-Related Genes (ATGs) in Oilseed Crop Castor Bean (Ricinus communis L.). Int. J. Mol. Sci. 2020, 21, 562. [Google Scholar] [CrossRef] [PubMed] [Green Version]
  42. Han, S.; Yu, B.; Wang, Y.; Liu, Y. Role of plant autophagy in stress response. Protein Cell 2011, 2, 784–791. [Google Scholar] [CrossRef] [PubMed] [Green Version]
  43. Cheng, F.; Liu, S.; Wu, J.; Fang, L.; Sun, S.; Liu, B.; Li, P.; Hua, W.; Wang, X. BRAD, the genetics and genomics database for Brassica plants. BMC Plant Biol. 2011, 11, 136. [Google Scholar] [CrossRef] [PubMed] [Green Version]
  44. Sharp, P.A. Speculations on RNA splicing. Cell 1981, 23, 643–646. [Google Scholar] [CrossRef]
  45. Altenhoff, A.M.; Studer, R.A.; Robinson-Rechavi, M.; Dessimoz, C. Resolving the Ortholog Conjecture: Orthologs Tend to Be Weakly, but Significantly, More Similar in Function than Paralogs. PLoS Comput. Biol. 2012, 8, e1002514. [Google Scholar] [CrossRef] [Green Version]
  46. Chen, C.; Chen, H.; He, Y.; Xia, R. TBtools, a toolkit for biologists integrating various biological data handling tools with a user-friendly interface. BioRxiv 2018, 289660. [Google Scholar] [CrossRef]
  47. Zhang, Y.; Ali, U.; Zhang, G.; Yu, L.; Fang, S.; Iqbal, S.; Li, H.; Lu, S.; Guo, L. Transcriptome analysis reveals genes commonly responding to multiple abiotic stresses in rapeseed. Mol. Breed. 2019, 39, 158. [Google Scholar] [CrossRef]
  48. Sueoka, N.; Kawanishi, Y. DNA G+C content of the third codon position and codon usage biases of human genes. Gene 2000, 261, 53–62. [Google Scholar] [CrossRef]
  49. Sharp, P.M.; Tuohy, T.M.; Mosurski, K.R. Codon usage in yeast: Cluster analysis clearly differentiates highly and lowly expressed genes. Nucl. Acids Res. 1986, 14, 5125–5143. [Google Scholar] [CrossRef]
  50. Yue, W.; Nie, X.; Cui, L.; Zhi, Y.; Zhang, T.; Du, X.; Song, W. Genome-wide sequence and expressional analysis of autophagy Gene family in bread wheat (Triticum aestivum L.). J. Plant Physiol. 2018, 229, 7–21. [Google Scholar] [CrossRef]
  51. Xu, G.; Guo, C.; Shan, H.; Kong, H. Divergence of duplicate genes in exon-intron structure. Proc. Natl. Acad. Sci. USA 2012, 109, 1187–1192. [Google Scholar] [CrossRef] [PubMed] [Green Version]
  52. Wang, G.-M.; Yin, H.; Qiao, X.; Tan, X.; Gu, C.; Wang, B.-H.; Cheng, R.; Wang, Y.-Z.; Zhang, S.-L. F-box genes: Genome-wide expansion, evolution and their contribution to pollen growth in pear (Pyrus bretschneideri). Plant Sci. 2016, 253, 164–175. [Google Scholar] [CrossRef] [PubMed]
  53. Bai, C.; Sen, P.; Hofmann, K.; Ma, L.; Goebl, M.; Harper, J.; Elledge, S.J. SKP1 Connects Cell Cycle Regulators to the Ubiquitin Proteolysis Machinery through a Novel Motif, the F-Box. Cell 1996, 86, 263–274. [Google Scholar] [CrossRef] [Green Version]
  54. Dinant, S.; Clark, A.M.; Zhu, Y.; Vilaine, F.; Palauqui, J.-C.; Kusiak, C.; Thompson, G.A. Diversity of the Superfamily of Phloem Lectins (Phloem Protein 2) in Angiosperms. Plant Physiol. 2003, 131, 114–128. [Google Scholar] [CrossRef] [PubMed] [Green Version]
  55. Haasl, R.J.; Payseur, B.A. Microsatellites as targets of natural selection. Mol. Biol. Evol. 2012, 30, 285–298. [Google Scholar] [CrossRef] [Green Version]
  56. Qin, Z.; Wang, Y.; Wang, Q.; Li, A.; Hou, F.; Zhang, L. Evolution Analysis of Simple Sequence Repeats in Plant Genome. PLoS ONE 2015, 10, e0144108. [Google Scholar] [CrossRef] [PubMed]
  57. Wang, Z.; Qiao, Y.; Zhang, J.; Shi, W.; Zhang, J. Genome wide identification of microRNAs involved in fatty acid and lipid metabolism of Brassica napus by small RNA and degradome sequencing. Gene 2017, 619, 61–70. [Google Scholar] [CrossRef] [PubMed]
  58. Wu, G.; Park, M.Y.; Conway, S.R.; Wang, J.-W.; Weigel, D.; Poethig, R.S. The Sequential Action of miR156 and miR172 Regulates Developmental Timing in Arabidopsis. Cell 2009, 138, 750–759. [Google Scholar] [CrossRef] [Green Version]
  59. Chuck, G.; Cigan, A.M.; Saeteurn, K.; Hake, S. The heterochronic maize mutant Corngrass1 results from overexpression of a tandem microRNA. Nat. Genet. 2007, 39, 544–549. [Google Scholar] [CrossRef]
  60. Zhao, L.; Kim, Y.; Dinh, T.T.; Chen, X. miR172 regulates stem cell fate and defines the inner boundary of APETALA3 and PISTILLATA expression domain in Arabidopsis floral meristems. Plant J. 2007, 51, 840–849. [Google Scholar] [CrossRef] [Green Version]
  61. Jones-Rhoades, M.W.; Bartel, D.P. Computational Identification of Plant MicroRNAs and Their Targets, Including a Stress-Induced miRNA. Mol. Cell 2004, 14, 787–799. [Google Scholar] [CrossRef] [PubMed]
  62. Nonogaki, H. MicroRNA Gene Regulation Cascades During Early Stages of Plant Development. Plant Cell Physiol. 2010, 51, 1840–1846. [Google Scholar] [CrossRef] [Green Version]
  63. Zhao, B.; Ge, L.; Liang, R.-Q.; Li, W.; Ruan, K.; Lin, H.; Jin, Y. Members of miR-169 family are induced by high salinity and transiently inhibit the NF-YA transcription factor. BMC Mol. Biol. 2009, 10, 29. [Google Scholar] [CrossRef] [PubMed] [Green Version]
  64. Jian, H.; Wang, J.; Wang, T.; Wei, L.; Li, J.; Liu, L. Identification of Rapeseed MicroRNAs Involved in Early Stage Seed Germination under Salt and Drought Stresses. Front. Plant Sci. 2016, 7, 658. [Google Scholar] [CrossRef] [PubMed] [Green Version]
  65. Liu, H.-H.; Tian, X.; Li, Y.-J.; Wu, C.-A.; Zheng, C.-C. Microarray-based analysis of stress-regulated microRNAs in Arabidopsis thaliana. RNA 2008, 14, 836–843. [Google Scholar] [CrossRef] [PubMed] [Green Version]
  66. Nakashima, K.; Takasaki, H.; Mizoi, J.; Shinozaki, K.; Yamaguchi-Shinozaki, K. NAC transcription factors in plant abiotic stress responses. Biochim. Biophys. Acta (BBA) Bioenerg. 2012, 1819, 97–103. [Google Scholar] [CrossRef] [PubMed]
  67. Zhang, J.; Zhang, S.; Han, S.; Li, X.; Tong, Z.; Qi, L. Deciphering Small Noncoding RNAs during the Transition from Dormant Embryo to Germinated Embryo in Larches (Larix leptolepis). PLoS ONE 2013, 8, e81452. [Google Scholar] [CrossRef]
  68. Szaker, H.M.; Darkó, É.; Medzihradszky, A.; Janda, T.; Liu, H.-C.; Charng, Y.-Y.; Csorba, T. miR824/AGAMOUS-LIKE16 Module Integrates Recurring Environmental Heat Stress Changes to Fine-Tune Poststress Development. Front. Plant Sci. 2019, 10, 10. [Google Scholar] [CrossRef]
  69. Pant, B.D.; Musialak-Lange, M.; Nuc, P.; May, P.; Buhtz, A.; Kehr, J.; Walther, D.; Scheible, W.-R. Identification of Nutrient-Responsive Arabidopsis and Rapeseed MicroRNAs by Comprehensive Real-Time Polymerase Chain Reaction Profiling and Small RNA Sequencing. Plant Physiol. 2009, 150, 1541–1555. [Google Scholar] [CrossRef] [Green Version]
  70. Wang, J.; Jian, H.; Wang, T.; Wei, L.; Li, J.; Li, C.; Liu, L. Identification of microRNAs Actively Involved in Fatty Acid Biosynthesis in Developing Brassica napus Seeds Using High-Throughput Sequencing. Front. Plant Sci. 2016, 7, 1570. [Google Scholar] [CrossRef] [Green Version]
  71. Sláviková, S.; Shy, G.; Yao, Y.; Glozman, R.; Levanony, H.; Pietrokovski, S.; Elazar, Z.; Egalili, G. The autophagy-associated Atg8 gene family operates both under favourable growth conditions and under starvation stresses in Arabidopsis plants. J. Exp. Bot. 2005, 56, 2839–2849. [Google Scholar] [CrossRef] [PubMed]
  72. Bu, F.; Yang, M.; Guo, X.; Huang, W.; Chen, L. Multiple Functions of ATG8 Family Proteins in Plant Autophagy. Front. Cell Dev. Biol. 2020, 8, 466. [Google Scholar] [CrossRef] [PubMed]
  73. Nakatogawa, H.; Ichimura, Y.; Ohsumi, Y. Atg8, a Ubiquitin-like Protein Required for Autophagosome Formation, Mediates Membrane Tethering and Hemifusion. Cell 2007, 130, 165–178. [Google Scholar] [CrossRef] [PubMed] [Green Version]
  74. Slavikova, S.; Ufaz, S.; Avin-Wittenberg, T.; Levanony, H.; Egalili, G. An autophagy-associated Atg8 protein is involved in the responses of Arabidopsis seedlings to hormonal controls and abiotic stresses. J. Exp. Bot. 2008, 59, 4029–4043. [Google Scholar] [CrossRef] [Green Version]
  75. Xia, T.; Xiao, D.; Liu, N.; Chai, W.; Gong, Q.; Wang, N.N. Heterologous Expression of ATG8c from Soybean Confers Tolerance to Nitrogen Deficiency and Increases Yield in Arabidopsis. PLoS ONE 2012, 7, e37217. [Google Scholar] [CrossRef]
  76. Avila-Ospina, L.; Marmagne, A.; Soulay, F.; Masclaux-Daubresse, C. Identification of Barley (Hordeum vulgare L.) Autophagy Genes and Their Expression Levels during Leaf Senescence, Chronic Nitrogen Limitation and in Response to Dark Exposure. Agronomy 2016, 6, 15. [Google Scholar] [CrossRef] [Green Version]
  77. He, H.; Liang, G.; Lu, S.; Wang, P.; Liu, T.; Ma, Z.; Zuo, C.; Sun, X.; Chen, B.; Mao, J. Genome-Wide Identification and Expression Analysis of GA2ox, GA3ox, and GA20ox Are Related to Gibberellin Oxidase Genes in Grape (Vitis Vinifera L.). Genes 2019, 10, 680. [Google Scholar] [CrossRef] [Green Version]
  78. Goodstein, D.M.; Shu, S.; Howson, R.; Neupane, R.; Hayes, R.D.; Fazo, J.; Mitros, T.; Dirks, W.; Hellsten, U.; Putnam, N.; et al. Phytozome: A comparative platform for green plant genomics. Nucleic Acids Res. 2011, 40, D1178–D1186. [Google Scholar] [CrossRef]
  79. Finn, R.D.; Bateman, A.; Clements, J.; Coggill, P.; Eberhardt, R.Y.; Eddy, S.R.; Heger, A.; Hetherington, K.; Holm, L.; Mistry, J.; et al. Pfam: The protein families database. Nucleic Acids Res. 2013, 42, D222–D230. [Google Scholar] [CrossRef] [Green Version]
  80. Artimo, P.; Jonnalagedda, M.; Arnold, K.; Baratin, D.; Csardi, G.; De Castro, E.; Duvaud, S.; Flegel, V.; Fortier, A.; Gasteiger, E.; et al. ExPASy: SIB bioinformatics resource portal. Nucleic Acids Res. 2012, 40, W597–W603. [Google Scholar] [CrossRef]
  81. Yu, C.-S.; Chen, Y.-C.; Lu, C.-H.; Hwang, J.-K. Prediction of protein subcellular localization. Proteins Struct. Funct. Bioinform. 2006, 64, 643–651. [Google Scholar] [CrossRef]
  82. Felsenstein, J. Confidence Limits on Phylogenies: An Approach Using the Bootstrap. Evolution 1985, 39, 783. [Google Scholar] [CrossRef]
  83. Kumar, S.; Stecher, G.; Tamura, K. MEGA7: Molecular Evolutionary Genetics Analysis Version 7.0 for Bigger Datasets. Mol. Biol. Evol. 2016, 33, 1870–1874. [Google Scholar] [CrossRef] [PubMed] [Green Version]
  84. Wei, K.; Pan, S.; Li, Y. Functional Characterization of Maize C2H2 Zinc-Finger Gene Family. Plant Mol. Biol. Rep. 2015, 34, 761–776. [Google Scholar] [CrossRef]
  85. Wu, C.; Ding, X.; Ding, Z.; Tie, W.; Yan, Y.; Wang, Y.; Yang, H.; Hu, W. The Class III Peroxidase (POD) Gene Family in Cassava: Identification, Phylogeny, Duplication, and Expression. Int. J. Mol. Sci. 2019, 20, 2730. [Google Scholar] [CrossRef] [Green Version]
  86. Librado, P.; Rozas, J. DnaSP v5: A software for comprehensive analysis of DNA polymorphism data. Bioinformatics 2009, 25, 1451–1452. [Google Scholar] [CrossRef] [Green Version]
  87. Hu, B.; Jin, J.; Guo, A.-Y.; Zhang, H.; Luo, J.; Gao, G. GSDS 2.0: An upgraded gene feature visualization server. Bioinformatics 2014, 31, 1296–1297. [Google Scholar] [CrossRef] [Green Version]
  88. Bailey, T.L.; Williams, N.; Misleh, C.; Li, W.W. MEME: Discovering and analyzing DNA and protein sequence motifs. Nucleic Acids Res. 2006, 34, W369–W373. [Google Scholar] [CrossRef]
  89. Howe, K.L.; Contreras-Moreira, B.; De Silva, N.; Maslen, G.; Akanni, W.; Allen, J.; Alvarez-Jarreta, J.; Barba, M.; Bolser, D.M.; Cambell, L.; et al. Ensembl Genomes 2020—enabling non-vertebrate genomic research. Nucleic Acids Res. 2019, 48, D689–D695. [Google Scholar] [CrossRef] [Green Version]
  90. Lescot, M. PlantCARE, a database of plant cis-acting regulatory elements and a portal to tools for in silico analysis of promoter sequences. Nucleic Acids Res. 2002, 30, 325–327. [Google Scholar] [CrossRef]
  91. You, F.M.; Huo, N.; Gu, Y.Q.; Luo, M.-C.; Ma, Y.; Hane, D.; Lazo, G.R.; Dvorák, J.; Anderson, O.D. BatchPrimer3: A high throughput web application for PCR and sequencing primer design. BMC Bioinform. 2008, 9, 1–13. [Google Scholar] [CrossRef] [Green Version]
  92. Shannon, P.; Markiel, A.; Ozier, O.; Baliga, N.S.; Wang, J.T.; Ramage, D.; Amin, N.; Schwikowski, B.; Ideker, T. Cytoscape: A Software Environment for Integrated Models of Biomolecular Interaction Networks. Genome Res. 2003, 13, 2498–2504. [Google Scholar] [CrossRef] [PubMed]
  93. Available online: https://digd.big.ac.cn/ (accessed on 18 October 2020).
  94. Andrews, S. FastQC: A Quality Control Tool for High Throughput Sequence Data; Babraham Bioinformatics, Babraham Institute: Cambridge, UK, 2010; Available online: http://www.bioinformatics.babraham.ac.uk/projects/fastqc (accessed on 18 October 2020).
  95. Bolger, A.M.; Lohse, M.; Usadel, B. Trimmomatic: A flexible trimmer for Illumina sequence data. Bioinformatics 2014, 30, 2114–2120. [Google Scholar] [CrossRef] [PubMed] [Green Version]
  96. Dobin, A.; Gingeras, T.R. Mapping RNA-seq Reads with STAR. Curr. Protoc. Bioinform. 2015, 51, 11–14. [Google Scholar] [CrossRef] [Green Version]
  97. Peden, J.F. Analysis of Codon Usage. Ph.D. Thesis, Department of Genetics, University of Nottingham, Nottingham, UK, 1999. [Google Scholar]
Figure 1. Phylogenetic relationships of BnATG1-BnATG8 proteins from Brassica napus (Bn), Arabidopsis thaliana (At), Citrus sinensis (Cs), Oryza sativa (Os), Vitis vinifera (Vv), and Nicotiana tabacum (Nt). The tree was constructed using MEGA 7 by the neighbor-joining (NJ) method with 1000 bootstraps. The names with pink rhombus are B. napus ATGs.
Plants 09 01393 g001
Figure 2. Phylogenetic relationships of BnATG9-BnATG114, BnATG16, BnATG18, BnVTI12, BnTOR, BnVPs15, BnVPS334, and BnVTI12 from Brassica napus (Bn), Arabidopsis thaliana (At), Citrus sinensis (Cs), Oryza sativa (Os), Vitis vinifera (Vv), and Nicotiana tabacum (Nt). The tree was constructed using MEGA 7 by the neighbor-joining (NJ) method with 1000 bootstraps. The names with pink rhombus are B. napus ATGs.
Plants 09 01393 g002
Figure 3. Chromosomal locations of B. napus autophagy-related genes. The location of genes on chromosomes and the duplication relationship between them were presented using TBtools. Chromosomes are represented by colored boxes. Pink curves connecting the genes indicate duplications.
Plants 09 01393 g003
Figure 4. The exon–intron structure of ATG1, ATG5–6, ATG10–14, ATG16, and ATG18 in B. napus. Exons and introns were represented by red boxes and green lines, respectively. The exon–intron structure of the BnATGs was determined using a gene structure display server (GSDS).
Plants 09 01393 g004
Figure 5. The exon–intron structure of ATG3–4, ATG7–9, VPS15, VPS34, VTI12, and TOR in B. napus. Exons and introns were represented by red boxes and green lines, respectively. The exon–intron structure of the BnATGs was determined using a gene structure display server (GSDS).
Plants 09 01393 g005
Figure 6. The conserved motifs of the BnATG1–13. Motifs were detected using the Multiple Em for Motif Elicitation (MEME) online tool. Different motifs are presented in different colors.
Plants 09 01393 g006
Figure 7. The conserved motifs of the BnATG14–18, BnATG101, BnTOR, BnVPS, and BnVTI12. Motifs were detected using the MEME online tool. Different motifs are presented in different colors.
Plants 09 01393 g007
Figure 8. Gene ontology (GO) annotations of ATG genes in B. napus. GO analysis performed using TBtools.
Plants 09 01393 g008
Figure 9. An miRNA-gene network based on interactions between miRNAs and BnATGs. Green ellipses represent miRNAs and red rectangles denote genes.
Plants 09 01393 g009
Figure 10. The expression pattern of BnATG genes (A) in different tissues, (B) under diverse abiotic stresses. The color boxes indicate expression values, the lowest (blue), medium (Pale goldenrod), and the highest (red). The heatmap was generated using log10 (TPM + 1) values.
Plants 09 01393 g010
Figure 11. Heat map of relative synonymous codon usage analysis (RSCU) values of BnATGs. The color boxes indicate RSCU values, the lowest (green), and the highest (red) usage of codons. The heatmap was generated using TBtools.
Plants 09 01393 g011
Table 1. Simple sequence repeats detected in BnATGs.
Gene IDCountMotifGene IDCountMotif
BnATG1a2(GGTT)3, (ATC)4BnATG13a2(AAC)4, (TCC)4
BnATG1b4(ATTT)3, (TC)7, (GGA)4, (GGC)4BnATG13b1(TCT)4
BnATG1c1(GATG)3BnATG13d2(GAT)4, (TCT)5
BnATG1f2(GGTT)3, (ATC)4BnATG14a1(AC)6
BnATG1g1(ATTT)3BnATG14c1(AC)6
BnATG1i2(GATG)3, (TTTG)3BnATG14e1(GGAAC)3
BnATG3d1(GAG)5BnATG16a1(TGATT)3
BnATG4c1(GAAGA)3BnATG16b1(TTTGA)6
BnATG4d1(TCTA)3BnATG18a3(TTCC)4, (TCT)4, (GGA)5
BnATG5a2(CTTT)3, (CCT)5BnATG18b1(GCA)4
BnATG5b1(AGA)7BnATG18e1(CTC)4
BnATG5c1(TTTC)3BnATG18g1(GGT)4
BnATG6a3(GAA)4, (TG)10, (GT)7BnATG18h1(TTTTAT)3
BnATG6b1(GAA)4BnATG18i1(CAG)5
BnATG6c1(GAA)4BnATG18l4(GAT)4, (AGC)5, (ATG)4, (TTC)4
BnATG6d1(GAA)4BnATG18m2(GAT)6, (TTC)4
BnATG7a1(TTTC)3BnATG18r1(CTC)4
BnATG8c2(TTTG)3, (TTC)4BnATG18x3(ATG)4, (CAT)4, (TTC)5
BnATG8d2(TATTT)3, (TTG)5BnATG20a2(AAC)4, (TC)7
BnATG8h2(ATTCA)3, (GTT)4BnATG20b3(ATA), (TC)7, (AAC)4
BnATG8j2(TCT)5, (AT)12BnATG101b1(TCG)4
BnATG8k1(TTTGA)3BnATG101c5(TGGCCT)3, (CTA)6, (TTTA)4, (GATG)3, (CCAT)3
BnATG8l3(AAGC)3, (TTGA)3, (TTCT)4BnATG101d3(CCAT)3, (AT)7, (TTC)4
BnATG8o1(TA)8BnATG101e2(TCT)4, (TC)6
BnATG8p1(CTT)4BnTORa5(TTTA)3, (TC)7, (CT)8, (TC)8, (CTTT)3
BnATG8q3(TTTG)3, (TC)7, (TTC)4BnTORb3(TCTT)3, (AT)9, (ATT)4
BnATG8r1(TTG)6BnTORc2(TATTT)3, (TTA)5
BnATG8y2(AAGC)4, (AT)7BnVPS15a2(TTTC)3, (TTTG)3
BnATG9a7(TCAAT)5, (CT)10, (CTC)4, (GAG)5, (GAT)5, (AAGA)3, (GTTA)3BnVPS15b2(TTTC)3, (TTTG)3
BnATG9c6(TCAAT)4, (CT)10, (GAT)4, (TATT)3, (AAGA)3, (GTTA)3BnVPS34a1(TA)7
BnATG10a1(CGGCAG)3BnVPS34b1(TC)6
BnATG11a2(TTCT)3, (TTTA)5BnVTI12a1(AAG)6
BnATG11b3(TTAT)3, (AGA)6, (AAC)4BnVTI12b3(CCTT)3, (AAT)5, (TCA)4
BnATG11c1(ATC)4BnVTI12d1(AAG)5
BnATG11e1(AT)6BnVTI12e1(CCTT)4
BnATG11f1(AAC)7BnVTI12f2(ATAC)3, (CTT)4
BnATG12a1(TTTGT)3
Publisher’s Note: MDPI stays neutral with regard to jurisdictional claims in published maps and institutional affiliations.

