Ovarian Transcriptomic Analysis Reveals Differential Expression Genes Associated with Cell Death Process after Selection for Ovulation Rate in Rabbits


Abstract
:Simple Summary
Abstract
1. Introduction
2. Materials and Methods
2.1. Ethics Statement
2.2. Animals and Experimental Design
2.3. Total RNA Extraction and Transcriptome Analysis
3. Results
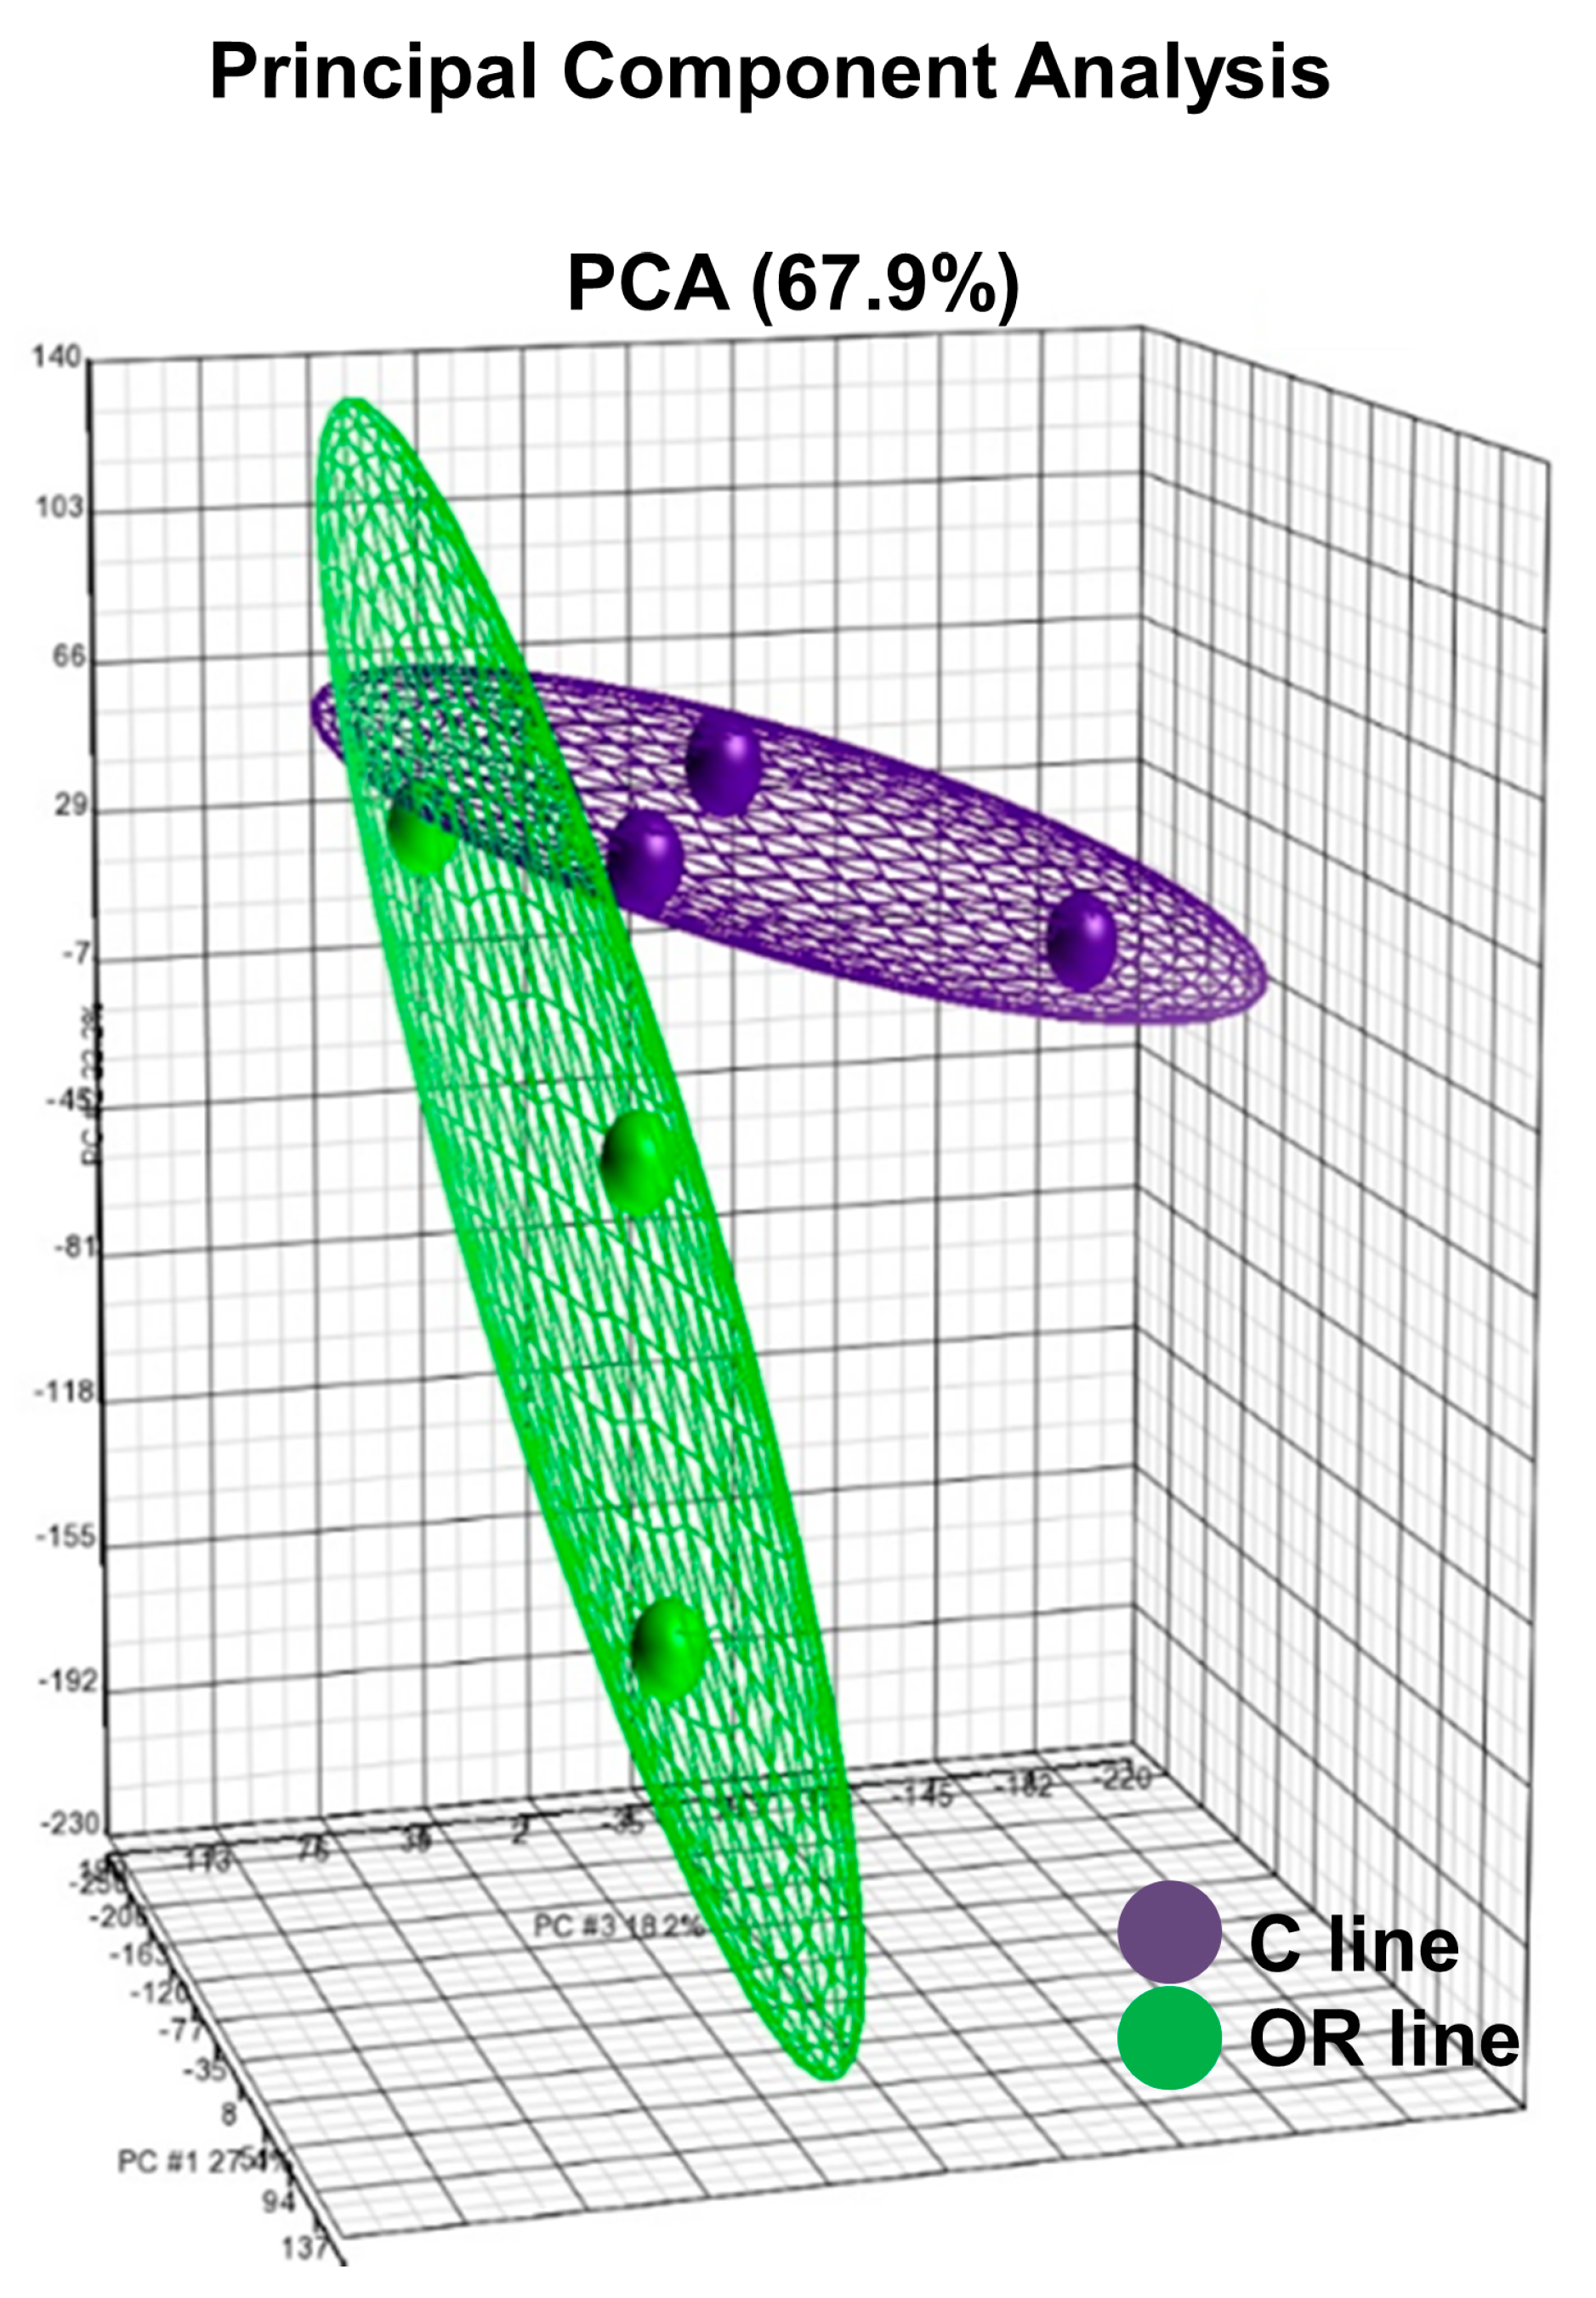
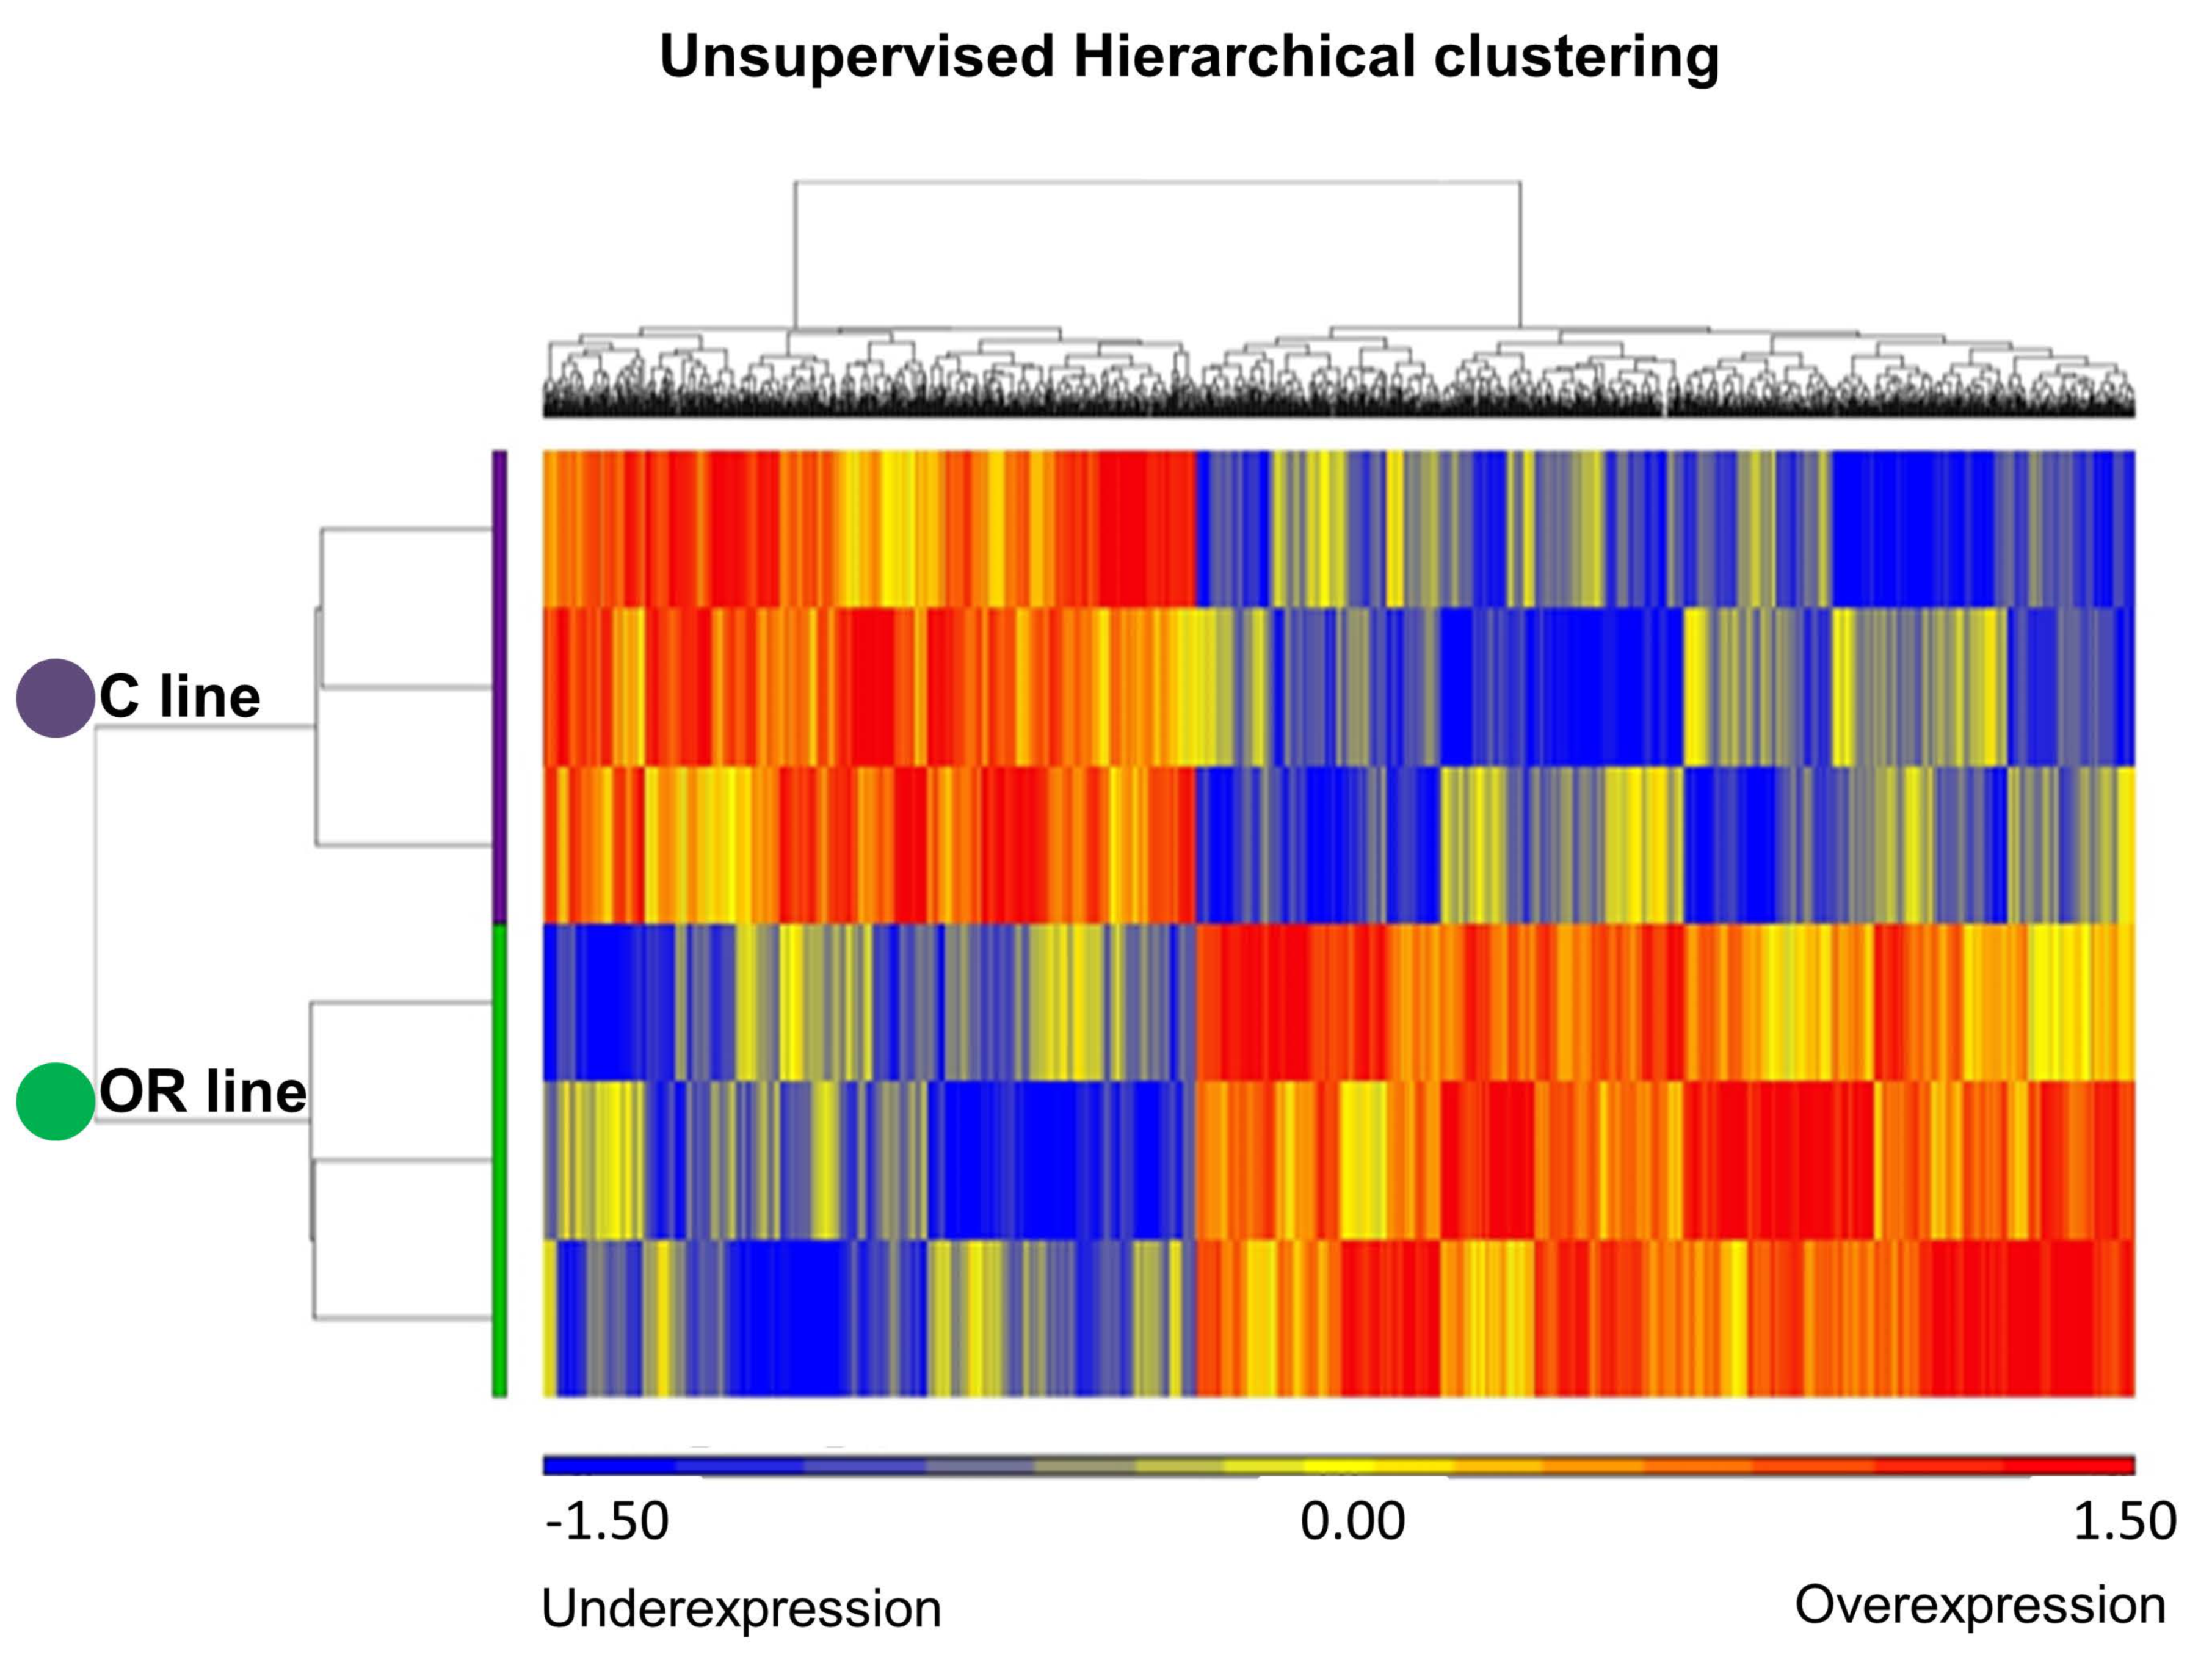
3.1. Transcriptome Profile Analysis in Ovarian Tissue
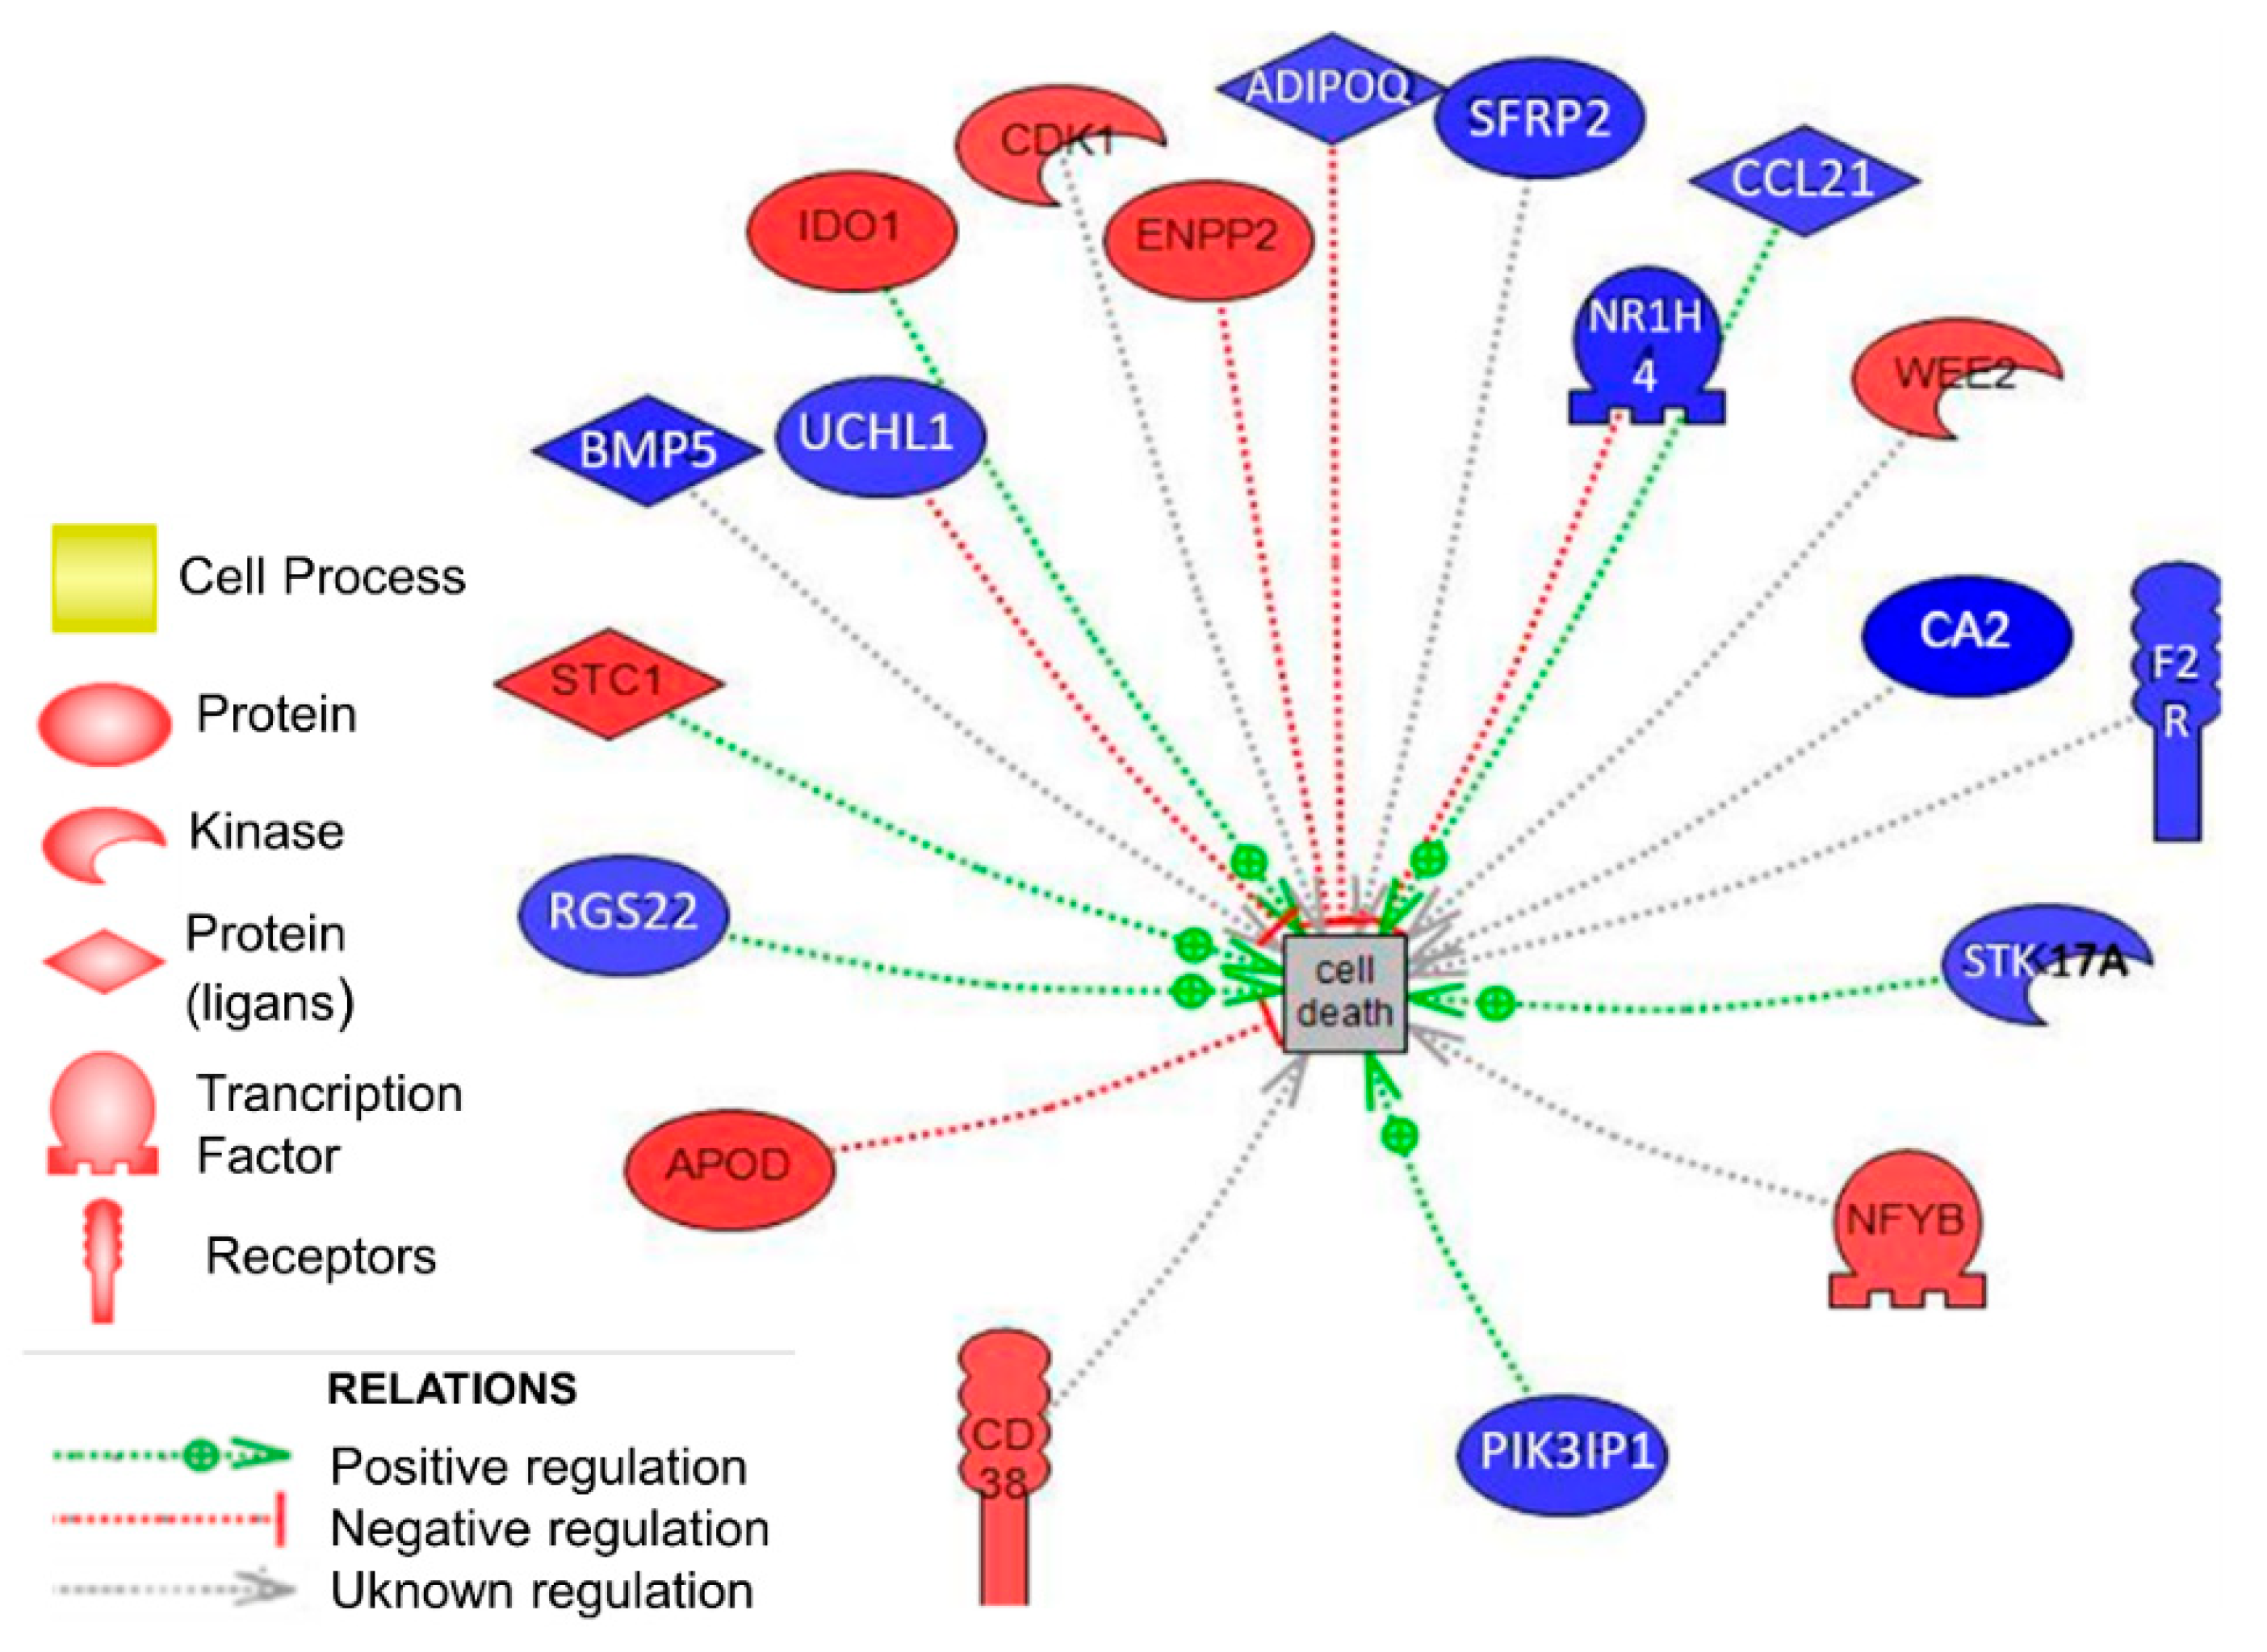
3.2. Biological Analysis in Ovarian Tissue
4. Discussion
5. Conclusions
Supplementary Materials
Author Contributions
Funding
Conflicts of Interest
References
- Laborda, P.; Mocé, M.L.; Blasco, A.; Santacreu, M.A. Selection for ovulation rate in rabbits: Genetic parameters and correlated responses on survival rates1. J. Anim. Sci. 2012, 90, 439–446. [Google Scholar] [CrossRef] [PubMed]
- Laborda, P.; Mocé, M.L.; Santacreu, M.A.; Blasco, A. Selection for ovulation rate in rabbits: Genetic parameters, direct response, and correlated response on litter size1. J. Anim. Sci. 2011, 89, 2981–2987. [Google Scholar] [CrossRef] [PubMed] [Green Version]
- Laborda, P.; Santacreu, M.A.; Blasco, A.; Mocé, M.L. Selection for ovulation rate in rabbits: Direct and correlated responses estimated with a cryopreserved control population1. J. Anim. Sci. 2012, 90, 3392–3397. [Google Scholar] [CrossRef] [PubMed]
- Cunningham, P.J.; England, M.E.; Young, L.D.; Zimmerman, D.R. Selection for ovulation rate in swine: Correlated response in litter size and weight. J. Anim. Sci. 1979, 48, 509–516. [Google Scholar] [CrossRef] [PubMed] [Green Version]
- Rosendo, A.; Druet, T.; Gogué, J.; Bidanel, J.P. Direct responses to six generations of selection for ovulation rate or prenatal survival in Large White pigs. J. Anim. Sci. 2007, 85, 356–364. [Google Scholar] [CrossRef] [PubMed]
- Johnson, R.K.; Zimmerman, D.R.; Kittok, R.J. Selection for components of reproduction in swine. Livest. Prod. Sci. 1984, 11, 541–558. [Google Scholar] [CrossRef]
- Leymaster, K.A.; Christenson, R.K. Direct and correlated responses to selection for ovulation rate or uterine capacity in swine. J. Anim. Sci. 2000, 78 (Suppl. 1), 68. [Google Scholar]
- Rodrigues, P.; Limback, D.; McGinnis, L.K.; Plancha, C.E.; Albertini, D.F. Oogenesis: Prospects and challenges for the future. J. Cell. Physiol. 2008, 216, 355–365. [Google Scholar] [CrossRef]
- Geisert, R.D.; Schmitt, R.A.M. Early embryonic survival in the pig: Can it be improved? J. Anim. Sci. 2002, 80, E54–E65. [Google Scholar] [CrossRef]
- Krisher, R.L. The effect of oocyte quality on development. J. Anim. Sci. 2004, 82 (Suppl. 13), E14–E23. [Google Scholar] [CrossRef]
- Cartuche, L.; Pascual, M.; Gómez, E.A.; Blasco, A. Economic weights in rabbit meat production. World Rabbit Sci. 2014, 22, 165. [Google Scholar] [CrossRef]
- Khalil, M.H.; Al-Saef, A.M. Methods, criteria, techniques and genetic responses for rabbit selection: A review. In Proceedings of the 9th World Rabbit Congress, Verona, Italy, 10–13 June 2008; pp. 1–22. [Google Scholar]
- Laborda, P.; Santacreu, M.A.; García, E.; Mocé, E.; Mocé, M.L. Oocyte glutathione concentration in a rabbit line selected for ovulation rate. In Proceedings of the 9th World Rabbit Congress, Verona, Italy, 10–13 June 2008; pp. 375–379. [Google Scholar]
- Zuelke, K.A.; Jeffay, S.C.; Zucker, R.M.; Perreault, S.D. Glutathione (GSH) concentrations vary with the cell cycle in maturing hamster oocytes, zygotes, and pre-implantation stage embryos. Mol. Reprod. Dev. 2003, 64, 106–112. [Google Scholar] [CrossRef] [PubMed]
- Tiwari, M.; Prasad, S.; Tripathi, A.; Pandey, A.N.; Ali, I.; Singh, A.K.; Shrivastav, T.G.; Chaube, S.K. Apoptosis in mammalian oocytes: A review. Apoptosis 2015, 20, 1019–1025. [Google Scholar] [CrossRef]
- Gerritsen, M.E.; Wagner, G.F. Stanniocalcin: No Longer Just a Fish Tale. Vitam. Hormon. 2005, 70, 105–135. [Google Scholar] [CrossRef]
- Jepsen, M.R.; Kløverpris, S.; Bøtkjær, J.A.; Wissing, M.L.; Andersen, C.Y.; Oxvig, C. The proteolytic activity of pregnancy-associated plasma protein-A is potentially regulated by stanniocalcin-1 and -2 during human ovarian follicle development. Hum. Reprod. 2016, 31, 866–874. [Google Scholar] [CrossRef] [PubMed] [Green Version]
- Darcy, C.J.; Davis, J.S.; Woodberry, T.; McNeil, Y.R.; Stephens, D.P.; Yeo, T.W.; Anstey, N.M. An observational cohort study of the kynurenine to tryptophan ratio in sepsis: Association with impaired immune and microvascular function. PLoS ONE 2011, 6. [Google Scholar] [CrossRef] [Green Version]
- Wirthgen, E.; Tuchscherer, M.; Otten, W.; Domanska, G.; Wollenhaupt, K.; Tuchscherer, A.; Kanitz, E. Activation of indoleamine 2,3-dioxygenase by LPS in a porcine model. Innate Immun. 2014, 20, 30–39. [Google Scholar] [CrossRef]
- Mohib, K.; Guan, Q.; Diao, H.; Du, C.; Jevnikar, A.M. Proapoptotic activity of indoleamine 2,3-dioxygenase expressed in renal tubular epithelial cells. Am. J. Physiol. Ren. Physiol. 2007, 293. [Google Scholar] [CrossRef] [Green Version]
- Fallarino, F.; Grohmann, U.; Vacca, C.; Bianchi, R.; Orabona, C.; Spreca, A.; Fioretti, M.C.; Puccetti, P. T cell apoptosis by tryptophan catabolism. Cell Death Differ. 2002, 9, 1069–1077. [Google Scholar] [CrossRef]
- Wang, Q.; Zhang, M.; Ding, Y.; Wang, Q.; Zhang, W.; Song, P.; Zou, M.H. Activation of NAD(P)H oxidase by Tryptophan-derived 3-Hydroxykynurenine accelerates endothelial apoptosis and dysfunction in Vivo. Circ. Res. 2014, 114, 480–492. [Google Scholar] [CrossRef] [Green Version]
- Fangxuan, L.; Rupeng, Z.; Shixia, L.; Juntian, L. IDO1: An important immunotherapy target in cancer treatment. Int. Immunopharmacol. 2017, 47, 70–77. [Google Scholar]
- Hill, M.; Pereira, V.; Chauveau, C.; Zagani, R.; Remy, S.; Tesson, L.; Mazal, D.; Ubillos, L.; Brion, R.; Ashgar, K.; et al. Heme oxygenase-1 inhibits rat and human breast cancer cell proliferation: Mutual cross inhibition with indoleamine 2,3-dioxygenase. FASEB J. 2005, 19, 1957–1968. [Google Scholar] [CrossRef] [PubMed]
- Lieuallen, K. Cystatin B-deficient mice have increased expression of apoptosis and glial activation genes. Hum. Mol. Genet. 2001, 10, 1867–1871. [Google Scholar] [CrossRef] [PubMed]
- Pajaniappan, M.; Glober, N.K.; Kennard, S.; Liu, H.; Zhao, N.; Lilly, B. Endothelial cells downregulate apolipoprotein D expression in mural cells through paracrine secretion and Notch signaling. Am. J. Physiol. Heart Circ. Physiol. 2011, 301. [Google Scholar] [CrossRef] [Green Version]
- Duffy, D.M.; Ko, C.; Jo, M.; Brannstrom, M.; Curry, T.E. Ovulation: Parallels With Inflammatory Processes. Endocr. Rev. 2019, 40, 369–416. [Google Scholar] [CrossRef] [PubMed] [Green Version]
- Liu, C.; Liu, Y.; Liu, Y.; Wu, D.; Luan, Z.; Wang, E.; Yu, B. Ser 15 of WEE1B is a potential PKA phosphorylation target in G2/M transition in one-cell stage mouse embryos. Mol. Med. Rep. 2013, 7, 1929–1937. [Google Scholar] [CrossRef]
- Seung, J.H.; Chen, R.; Paronetto, M.P.; Conti, M. Wee1B is an oocyte-specific kinase involved in the control of meiotic arrest in the mouse. Curr. Biol. 2005, 15, 1670–1676. [Google Scholar] [CrossRef] [Green Version]
- Nakanishi, M.; Ando, H.; Watanabe, N.; Kitamura, K.; Ito, K.; Okayama, H.; Miyamoto, T.; Agui, T.; Sasaki, M. Identification and characterization of human Wee1B, a new member of the Wee1 family of Cdk-inhibitory kinases. Genes Cells 2000, 5, 839–847. [Google Scholar] [CrossRef]
- Oh, J.S.; Susor, A.; Conti, M. Protein tyrosine kinase wee1B is essential for metaphase II exit in mouse oocytes. Science 2011, 332, 462–465. [Google Scholar] [CrossRef] [Green Version]
- Castedo, M.; Perfettini, J.L.; Roumier, T.; Kroemer, G. Cyclin-dependent kinase-1: Linking apoptosis to cell cycleand mitotic catastrophe. Cell Death Differ. 2002, 9, 1287–1293. [Google Scholar] [CrossRef] [Green Version]
- Golsteyn, R.M. Cdk1 and Cdk2 complexes (cyclin dependent kinases) in apoptosis: A role beyond the cell cycle. Cancer Lett. 2005, 217, 129–138. [Google Scholar] [CrossRef]
- Gu, L.; Zheng, H.; Murray, S.A.; Ying, H.; Jim Xiao, Z.X. Deregulation of Cdc2 kinase induces caspase-3 activation and apoptosis. Biochem. Biophys. Res. Commun. 2003, 302, 384–391. [Google Scholar] [CrossRef]
- Sandal, T.; Stapnes, C.; Kleivdal, H.; Hedin, L.; Døskeland, S.O. A novel, extraneuronal role for cyclin-dependent protein kinase 5 (CDK5): Modulation of cAMP-induced apoptosis in rat leukemia cells. J. Biol. Chem. 2002, 277, 20783–20793. [Google Scholar] [CrossRef] [PubMed] [Green Version]
- Oh, J.S.; Susor, A.; Schindler, K.; Schultz, R.M.; Conti, M. Cdc25A activity is required for the metaphase II arrest in mouse oocytes. J. Cell Sci. 2013, 126, 1081–1085. [Google Scholar] [CrossRef] [Green Version]
- Orciani, M.; Trubiani, O.; Guarnieri, S.; Ferrero, E.; Di Primio, R. CD38 is constitutively expressed in the nucleus of human hematopoietic cells. J. Cell. Biochem. 2008, 105, 905–912. [Google Scholar] [CrossRef]
- Partidá-Sánchez, S.; Rivero-Nava, L.; Shi, G.; Lund, F.E. CD38: An ecto-enzyme at the crossroads of innate and adaptive immune responses. In Crossroads between Innate and Adaptive Immunity. Advances in Experimental Medicine and Biology; Katsikis, P.D., Schoenberger, S.P., Pulendran, B., Eds.; Springer: Boston, MA, USA, 2007; Volume 590, pp. 171–183. [Google Scholar] [CrossRef]
- Wang, L.F.; Miao, L.J.; Wang, X.N.; Huang, C.C.; Qian, Y.S.; Huang, X.; Wang, X.L.; Jin, W.Z.; Ji, G.J.; Fu, M.; et al. CD38 deficiency suppresses adipogenesis and lipogenesis in adipose tissues through activating Sirt1/PPARγ signaling pathway. J. Cell. Mol. Med. 2018, 22, 101–110. [Google Scholar] [CrossRef] [PubMed]
- Sun, L.; Iqbal, J.; Zaidi, S.; Zhu, L.L.; Zhang, X.; Peng, Y.; Moonga, B.S.; Zaidi, M. Structure and functional regulation of the CD38 promoter. Biochem. Biophys. Res. Commun. 2006, 341, 804–809. [Google Scholar] [CrossRef] [PubMed]
- Uche, U.U.; Piccirillo, A.R.; Kataoka, S.; Grebinoski, S.J.; D’Cruz, L.M.; Kane, L.P. PIK3IP1/TrIP restricts activation of T cells through inhibition of PI3K/Akt. J. Exp. Med. 2018, 215, 3165–3179. [Google Scholar] [CrossRef] [Green Version]
- Chu, K.Y.; Li, H.; Wada, K.; Johnson, J.D. Ubiquitin C-terminal hydrolase L1 is required for pancreatic beta cell survival and function in lipotoxic conditions. Diabetologia 2012, 55, 128–140. [Google Scholar] [CrossRef] [Green Version]
- Xiang, T.; Li, L.; Yin, X.; Yuan, C.; Tan, C.; Su, X.; Xiong, L.; Putti, T.C.; Oberst, M.; Kelly, K.; et al. The ubiquitin peptidase UCHL1 induces G0/G1 cell cycle arrest and apoptosis through stabilizing p53 and is frequently silenced in breast cancer. PLoS ONE 2012, 7. [Google Scholar] [CrossRef] [Green Version]
- Kabuta, T.; Mitsui, T.; Takahashi, M.; Fujiwara, Y.; Kabuta, C.; Konya, C.; Tsuchiya, Y.; Hatanaka, Y.; Uchida, K.; Hohjoh, H.; et al. Ubiquitin C-terminal hydrolase L1 (UCH-L1) acts as a novel potentiator of cyclin-dependent kinases to enhance cell proliferation independently of its hydrolase activity. J. Biol. Chem. 2013, 288, 12615–12626. [Google Scholar] [CrossRef] [PubMed] [Green Version]
- Koyanagi, S.; Hamasaki, H.; Sekiguchi, S.; Hara, K.; Ishii, Y.; Kyuwa, S.; Yoshikawa, Y. Effects of ubiquitin C-terminal hydrolase L1 deficiency on mouse ova. Reproduction 2012, 143, 271–279. [Google Scholar] [CrossRef] [PubMed] [Green Version]
- Susor, A.; Liskova, L.; Toralova, T.; Pavlok, A.; Pivonkova, K.; Karabinova, P.; Lopatarova, M.; Sutovsky, P.; Kubelka, M. Role of Ubiquitin C-Terminal Hydrolase-L1 in Antipolyspermy Defense of Mammalian Oocytes1. Biol. Reprod. 2010, 82, 1151–1161. [Google Scholar] [CrossRef] [Green Version]
- Yao, Y.W.; Shi, Y.; Jia, Z.F.; Jiang, Y.H.; Gu, Z.; Wang, J.; Aljofan, M.; Sun, Z.G. PTOV1 is associated with UCH-L1 and in response to estrogen stimuli during the mouse oocyte development. Histochem. Cell Biol. 2011, 136, 205–215. [Google Scholar] [CrossRef]
- Boelte, K.C.; Gordy, L.E.; Joyce, S.; Thompson, M.A.; Yang, L.; Lin, P.C. Rgs2 mediates pro-angiogenic function of Myeloid derived suppressor cells in the tumor microenvironment via upregulation of MCP-1. PLoS ONE 2011, 6. [Google Scholar] [CrossRef]
- Siller-Matula, J.M.; Schwameis, M.; Blann, A.; Mannhalter, C.; Jilma, B. Thrombin as a multi-functional enzyme: Focus on in vitro and in vivo effects. Thromb. Haemost. 2011, 106, 1020–1033. [Google Scholar] [CrossRef]
- Zania, P.; Kritikou, S.; Flordellis, C.S.; Maragoudakis, M.E.; Tsopanoglou, N.E. Blockade of angiogenesis by small molecule antagonists to protease-activated receptor-1: Association with endothelial cell growth suppression and induction of apoptosis. J. Pharmacol. Exp. Ther. 2006, 318, 246–254. [Google Scholar] [CrossRef] [Green Version]
- Van Blerkom, J.; Antczak, M.; Schrader, R. The developmental potential of the human oocyte is related to the dissolved oxygen content of follicular fluid: Association with vascular endothelial growth factor levels and perifollicular blood flow characteristics. Hum. Reprod. 1997, 12, 1047–1055. [Google Scholar] [CrossRef]
- Michalakis, K.G.; Segars, J.H. The role of adiponectin in reproduction: From polycystic ovary syndrome to assisted reproduction. Fertil. Steril. 2010, 94, 1949–1957. [Google Scholar] [CrossRef] [PubMed] [Green Version]
- Čikoš, Š. Adiponectin and Its Receptors in Preimplantation Embryo Development. Vitam. Horm. 2012, 90, 211–238. [Google Scholar] [CrossRef]
- Richards, J.S.; Liu, Z.; Kawai, T.; Tabata, K.; Watanabe, H.; Suresh, D.; Kuo, F.T.; Pisarska, M.D.; Shimada, M. Adiponectin and its receptors modulate granulosa cell and cumulus cell functions, fertility, and early embryo development in the mouse and human. Fertil. Steril. 2012, 98. [Google Scholar] [CrossRef] [Green Version]
- Monget, P.; Chabrolle, C.; Dupont, J. Tissu adipeux, nutrition et reproduction: Quel lien? [Adipose tissue, nutrition and reproduction: What is the link?]. Bull. Acad. Natl. Med. 2008, 192, 637–647. [Google Scholar] [PubMed]
- Dos Santos, E.; Pecquery, R.; de Mazancourt, P.; Dieudonné, M.N. Adiponectin and Reproduction. In Vitamins & Hormones; Academic Press Inc.: Cambridge, MA, USA, 2012; Volume 90, pp. 187–209. [Google Scholar] [CrossRef]
- Lagaly, D.V.; Aad, P.Y.; Grado-Ahuir, J.A.; Hulsey, L.B.; Spicer, L.J. Role of adiponectin in regulating ovarian theca and granulosa cell function. Mol. Cell. Endocrinol. 2008, 284, 38–45. [Google Scholar] [CrossRef] [PubMed]
- Palin, M.F.; Bordignon, V.V.; Murphy, B.D. Adiponectin and the Control of Female Reproductive Functions. Vitam. Horm. 2012, 90, 239–287. [Google Scholar] [CrossRef]
- Wickham, E.P.; Tao, T.; Nestler, J.E.; McGee, E.A. Activation of the LH receptor up regulates the type 2 adiponectin receptor in human granulosa cells. J. Assist. Reprod. Genet. 2013, 30, 963–968. [Google Scholar] [CrossRef] [Green Version]
- Chappaz, E.; Albornoz, M.S.; Campos, D.; Che, L.; Palin, M.F.; Murphy, B.D.; Bordignon, V. Adiponectin enhances in vitro development of swine embryos. Domest. Anim. Endocrinol. 2008, 35, 198–207. [Google Scholar] [CrossRef]
- Elis, S.; Coyral-Castel, S.; Freret, S.; Cognié, J.; Desmarchais, A.; Fatet, A.; Rame, C.; Briant, E.; Maillard, V.; Dupont, J. Expression of adipokine and lipid metabolism genes in adipose tissue of dairy cows differing in a female fertility quantitative trait locus. J. Dairy Sci. 2013, 96, 7591–7602. [Google Scholar] [CrossRef]
- Bovolenta, P.; Esteve, P.; Ruiz, J.M.; Cisneros, E.; Lopez-Rios, J. Beyond Wnt inhibition: New functions of secreted Frizzled-related proteins in development and disease. J. Cell Sci. 2008, 121, 737–746. [Google Scholar] [CrossRef] [Green Version]
- Arslanoglu, S.; Bertino, E.; Tonetto, P.; De Nisi, G.; Ambruzzi, A.M.; Biasini, A.; Profeti, C.; Spreghini, M.R.; Moro, G.E.; Moro, G.E. Guidelines for the establishment and operation of a donor human milk bank. J. Matern. Neonatal Med. 2010, 23, 1–20. [Google Scholar] [CrossRef]
- Lin, C.T.; Lin, Y.T.; Kuo, T.F. Investigation of mRNA Expression for Secreted Frizzled-Related Protein 2 (sFRP2) in Chick Embryos. J. Reprod. Dev. 2007, 53, 801–810. [Google Scholar] [CrossRef] [Green Version]
- Jaatinen, R.; Bondestam, J.; Raivio, T.; Hildén, K.; Dunkel, L.; Groome, N.; Ritvos, O. Activation of the Bone Morphogenetic Protein Signaling Pathway Induces Inhibin β B -Subunit mRNA and Secreted Inhibin B Levels in Cultured Human Granulosa-Luteal Cells. J. Clin. Endocrinol. Metab. 2002, 87, 1254–1261. [Google Scholar] [CrossRef] [PubMed] [Green Version]
- De Gottardi, A.; Dumonceau, J.M.; Bruttin, F.; Vonlaufen, A.; Morard, I.; Spahr, L.; Rubbia-Brandt, L.; Frossard, J.L.; Dinjens, W.N.M.; Rabinovitch, P.S.; et al. Expression of the bile acid receptor FXR in Barrett’s esophagus and enhancement of apoptosis by guggulsterone in vitro. Mol. Cancer 2006, 5. [Google Scholar] [CrossRef] [Green Version]
- Claudy, A.L. La vascularisation cutanée. Angiogénèse. Structure et fonction des cellules endothéliales. [Cutaneous vascularization. Angiogenesis. Structure and function of endothelial cells]. Ann. Dermatol. Venereol. 1991, 118, 61–68. [Google Scholar] [PubMed]
- Lutwak-mann, C. Carbonic anhydrase in the female reproductive tract; occurrence, distribution and hormonal dependence. J. Endocrinol. 1955, 13, 26–38. [Google Scholar] [CrossRef] [PubMed]


| Biological Processes | Number of Genes | Enrichment p-Value |
|---|---|---|
| Multicellular organismal development | 55 | 1.81 × 10⁻¹⁰ |
| Cell differentiation | 43 | 8.80 × 10⁻¹⁰ |
| Signal transduction | 99 | 1.72 × 10−09 |
| Synaptic transmission | 29 | 8.25 × 10−09 |
| Apoptotic process | 40 | 3.18 × 10−08 |
| Positive regulation of cell proliferation | 29 | 3.50 × 10−07 |
| Transmembrane transport | 34 | 6.37 × 10−07 |
| Positive regulation of transcription, DNA-templated | 31 | 7.15 × 10−07 |
| Positive regulation of I-kappaB kinase-NF-kappaB signaling | 14 | 9.55 × 10−07 |
| Cell Process Pathways | Number of Genes | Enrichment p-Value |
|---|---|---|
| Apoptosis | 10 | 3.63 × 10−03 |
| Melanogenesis | 40 | 4.90 × 10−03 |
| Translation Control | 54 | 5.51 × 10−03 |
| Actin Cytoskeleton Regulation | 31 | 1.74 × 10−02 |
| Thromboxane Receptor—“CREB signaling” | 8 | 2.71 × 10−02 |
| Chromosome Condensation | 3 | 3.96 × 10−02 |
| Lipoyl-protein complex biosynthesis II | 2 | 4.17 × 10−02 |
| Lipoyl-protein complex biosynthesis I | 2 | 4.17 × 10−02 |
| Cleavage of Lamina in Apoptosis | 3 | 4.35 × 10−02 |
| Histone Phosphorylation | 9 | 4.43 × 10−02 |
| Gene Symbol | Gene Name | p-Value | Fold Change |
|---|---|---|---|
| STC1 | Stanniocalcin 1 | 1.11 × 10−02 | 1.90 |
| IDO1 | Indoleamine 2.3-dioxygenase 1 | 8.58 × 10−03 | 1.89 |
| APOD | Apolipoprotein D | 4.76 × 10−02 | 1.88 |
| ENPP2 | Ectonucleotide pyrophosphatase/phosphodiesterase 2 | 2.76 × 10−02 | 1.78 |
| WEE2 | WEE1 homolog 2 (S. pombe) | 4.26 × 10−02 | 1.62 |
| CDK1 | Cyclin-dependent kinase 1 | 4.09 × 10−02 | 1.55 |
| CBFB | Core-binding factor. beta subunit | 4.20 × 10−02 | 1.53 |
| CD38 | CD38 molecule | 3.75 × 10−02 | 1.52 |
| RGS22 | Regulator of G-protein signaling 22 | 2.69 × 10−02 | −1.53 |
| STK17A | Serine/threonine kinase 17a | 1.77 × 10−02 | −1.54 |
| ADIPOQ | Adiponectin. C1Q and collagen domain containing | 1.77 × 10−02 | −1.57 |
| CCL21 | Chemokine (C-C motif) ligand 21 | 3.56 × 10−02 | −1.64 |
| UCHL1 | Ubiquitin carboxyl-terminal esterase L1 | 2.84 × 10−02 | −1.69 |
| F2R | Coagulation factor II (thrombin) receptor | 1.80 × 10−02 | −1.70 |
| PIK3IP1 | Phosphoinositide-3-kinase interacting protein 1 | 4.65 × 10−02 | −1.77 |
| SFRP2 | Secreted frizzled-related protein 2 | 2.20 × 10−02 | −1.88 |
| BMP5 | Bone morphogenetic protein 5 | 3.72 × 10−02 | −1.97 |
| NR1H4 | Nuclear receptor subfamily 1 group H member 4 | 1.31 × 10−02 | −2.03 |
| CA2 | Carbonic anhydrase II | 2.81 × 10−02 | −2.75 |
Publisher’s Note: MDPI stays neutral with regard to jurisdictional claims in published maps and institutional affiliations. |
© 2020 by the authors. Licensee MDPI, Basel, Switzerland. This article is an open access article distributed under the terms and conditions of the Creative Commons Attribution (CC BY) license (http://creativecommons.org/licenses/by/4.0/).
Share and Cite
Serna-García, M.; Peiró, R.; Serna, E.; Santacreu, M.A. Ovarian Transcriptomic Analysis Reveals Differential Expression Genes Associated with Cell Death Process after Selection for Ovulation Rate in Rabbits. Animals 2020, 10, 1924. https://doi.org/10.3390/ani10101924
Serna-García M, Peiró R, Serna E, Santacreu MA. Ovarian Transcriptomic Analysis Reveals Differential Expression Genes Associated with Cell Death Process after Selection for Ovulation Rate in Rabbits. Animals. 2020; 10(10):1924. https://doi.org/10.3390/ani10101924
Chicago/Turabian StyleSerna-García, Marta, Rosa Peiró, Eva Serna, and María Antonia Santacreu. 2020. "Ovarian Transcriptomic Analysis Reveals Differential Expression Genes Associated with Cell Death Process after Selection for Ovulation Rate in Rabbits" Animals 10, no. 10: 1924. https://doi.org/10.3390/ani10101924