


Abstract
Substrate deformation affects the behaviour of many cell types, including bone, skeletal muscle and endothelial cells. Nowadays, in vitro tests are widely employed to study the mechanotransduction induced by substrate deformation. The aim of in vitro systems is to properly reproduce the mechanical stimuli sensed by the tissue in the cellular microenvironment. Accurate strain measurement and control is therefore necessary to ensure the cell senses the proper strain for the entire treatment. Different types of in vitro systems are commercially available or can be custom-designed; however, none of these devices performs a real-time measurement of the induced strains. In this study, we proposed a uniaxial strain device for in vitro cell stimulation with an innovative real-time strain control. The system was designed to induce sinusoidal waveform stimulation in a huge range of amplitude and frequency, to three silicone chambers stretched by a linear actuator. The real-time strain measurement and control algorithm is based on an optical tracking method implemented in LabVIEW 2015, and it is able to adapt the input amplitude to the linear motor, if necessary, hanging the stimulation signal for about 120 ms. Validation of the strain values measured during the real-time tracking algorithm was carried out through a comparison with the digital image correlation (DIC) technique. We investigated the influence of number of reference points and image size on the algorithm accuracy. Experimental results showed that the tracking algorithm allowed for a real-time measurement of membrane longitudinal strains with a relative error of 0.3%, on average, in comparison to the strains measured with DIC in post-processing analysis. We showed a high homogeneity of the strain pattern on the entire chamber base for different stimulation conditions. Finally, as proof of concept, we employed the uniaxial strain device to induce substrate deformation in a human osteosarcoma cell line (SaOS-2). The experimental results showed a consistent change in cell shape in response to the mechanical strain.
Export citation and abstract BibTeX RIS

Original content from this work may be used under the terms of the Creative Commons Attribution 4.0 license. Any further distribution of this work must maintain attribution to the author(s) and the title of the work, journal citation and DOI.
1. Introduction
Mechanical stimulations play a critical role in the homeostasis and development of a variety of cells and tissues. Several studies have demonstrated how mechanical forces affect bone resorption and formation [1, 2], organ morphogenesis [3], skeletal muscle differentiation and organisation [4], as well as the development of the central nervous system [5]. Cells are capable of sensing mechanical stimuli and converting them into biological responses through a process known as mechanotransduction [6–8]. The capability to convert mechanical signals into biochemical responses allows the cell rapid adaptation to physical changes occurring in the environment [9, 10]. Because of the in vivo environment complexity, in terms of biological and mechanical factors, several studies have relied on the use of in vitro systems to investigate cell response to mechanical stimulations [11, 12]. The aim of these systems is to recreate the conditions required to engender mechanotransduction in a more controlled cell culture system. However, it has to be remarked that tissue-level strains must be amplified at cellular level to properly reproduce the in vivo mechanotransduction signalling [13, 14].
One of the most common mechanical stimuli which cells are subjected to is substrate strain, and it is determined by physical events depending on the different cell microenvironment. For instance, pulsatile blood pressure, originating from the heart and driving blood circulation throughout the cardiovascular system, induces circumferential stretch on the vessel wall, producing an internal deformation on the vascular endothelial cells [15]. Furthermore, gravity and compressive force generated by muscle contraction during locomotion or training result in small deformation of the bone extracellular matrix [16]. In addition, skeletal and cardiac muscles are exposed to mechanical strain, and their ability to properly respond to mechanical loads is critical in the development and maintenance of the tissues [17]. In view of this, in vitro cell strain devices are fundamental for a better understanding of cell mechanotransduction [18–20]. These devices are based on the stretching of polydimethylsiloxane (PDMS) chambers, in which the cells to be tested are seeded. To guarantee that the strains induced on the chamber bottom are properly transmitted to the cells, the PDMS is usually functionalised (e.g. by treating it with collagen) accordingly to the cell type to be tested. Substrate functionalisation, in fact, allows binding extracellular matrix proteins, providing a favourable terrain for cell adhesion, thus preventing cell decoupling from the substrate during cell stretching [21].
Currently, a few cell-stretching devices are commercially available, such as Flexcell (Flexcell International Corporation, Hillsborough, NC, USA), Strex cell (Strex Inc.) and ElectroForce (Bose Corporation) systems, and several studies have been carried out with the mechanical characterisation of the strain profile. The membrane strain field [22, 23] and membrane strain homogeneity [24] have been studied for the Flexcell apparatus, while the inhomogeneous strain distribution has been measured for the Strex cell device [25]. However, these devices have several constraints that limit their diffusion in research. They are costly to purchase and maintain and have limited functional capabilities, since they are built to work in a specific range of stimulation parameters (waveform, frequency and amplitude). To overcome these issues, various types of custom-made stretch systems have been recently proposed. Clark et al [26] developed a strain device based on a linear stepper motor and validated it by applying cyclic uniaxial strains to skeletal muscle myoblasts cultured on a silicone sheet substrate. Similarly, Atcha et al [27] devised a low-cost stretching system consisting of a programmable servomotor, and used it to induce cyclic uniaxial strain on macrophages and cardiomyocytes. On the other hand, Richardson et al [28] fabricated a device capable of subjecting cells to biaxial stretch via radial deformation of circular elastomeric membranes. Finally, the study of Seriani et al [29] showed the development of a strain system based on a variable-stroke cam–lever–tappet mechanism that induces uniaxial strain on PDMS membranes.
It has to be remarked that in all the above-reported devices the local strain values are not monitored during the test. Instead, the measurement and control of induced strain is crucial to ensure that the cells are subjected to the proper mechanical stimulus for the entire treatment duration. At present, real-time strain measurements are based on the use of electric resistance gauges, thermoelectric, piezoelectric, electromagnetic or acoustic sensors [29–32], and are mainly employed for monitoring structural conditions to guarantee operational safety. Nevertheless, most of them are considered as embedded sensors or attached sensors, and their use introduces some limitations, such as the modification of the mechanical properties of a specimen, leading to systematic errors. To date, to the best of the authors' knowledge, no stretching devices allow for real-time monitoring of substrate deformation during cell testing.
Within this context, in this study we propose a custom-made uniaxial strain device for in vitro cell stimulation based on an innovative real-time strain measurement and control system. The real-time algorithm was implemented in LabVIEW 2015 and consists of an optical tracking method for local strain measurement and a closed loop for input amplitude optimisation. A validation of the strain values measured during the real-time tracking algorithm was carried out through a comparison with the digital image correlation (DIC) method. Indeed, even if DIC has also been proposed in the literature for real-time strain measurements [31–34], the use of a tool developed in LabVIEW allowed us to synchronise the real-time strain measurement with the linear actuator motion, to obtain control of the induced strain. Moreover, most DIC applications to real-time strain measurements concern the development of optical extensometers, and have been tested to capture small strains, or strains in quasi-static applications. On the contrary, our application required the measurement of quite large (up to 7%) and dynamic strains. In addition, the use of DIC for real-time strain measurements was based on complex systems, which cannot be employed in our particular application, where the use of live cells is involved and a control strategy is necessary to continuously change the strains induced by the silicone substrate.
After the strain device characterisation was carried out, we proceeded with a proof of concept of cell stretching. The proposed device was used to mechanically stretch a human osteoblast-like cell line, and the cell morphology was studied to assess changes in the shape as a consequence of the stretching treatment.
2. Materials and methods
2.1. Development of the uniaxial strain system
The stretching device was designed to induce sinusoidal deformations in the range of 0.5%–7% and 0.5 Hz–2 Hz, so to test a huge variety of cells, including bone, skeletal muscle and endothelial cells [15, 26, 35, 36]. In addition, the device was designed to have compact size and mass to be easily moved and placed under a microscope, for real-time strain control, or inside an incubator for long treatments. All the materials were chosen accordingly: plexiglass and aluminium guaranteed low mass and the possibility to be sterilised by ultraviolet light.
The device is composed of a linear actuator (Zaber, NA11B16-T4), a stepper motor controller (Zaber, X-MCB2), two linear slide rails, two plexiglass supports, one fixed and one connected to the linear actuator, and an aluminium base. The experimental system is completed by a stereomicroscope (Nikon, SMZ800 N) incorporated with a high-frequency camera (Basler, acA2040-180 Km) and a personal computer equipped with a NI PCIe1433 frame grabber (National Instruments, Austin, TX, USA), as shown in figure 1(a). The device allows stretching three silicone culture chambers (STB-CH- 04; Strex) simultaneously (figure 1(b)). The chambers are commercially available and are composed of a silicone elastomer PDMS that creates a special flexible thin membrane (100–200 μm). Software was developed in LabVIEW 2015 to set all the control parameters; namely the amplitude, frequency and duration of the displacement signal. The entire structure was allocated below the stereomicroscope to measure the local deformation induced on the silicone chambers through optical image correlation methods. The optical distortion induced by the lens of the SMZ800 N stereomicroscope has been previously evaluated [37], and was found to be 0.3% on average for horizontal and vertical directions at 1X and 4X magnification. Notably, the thin membrane thickness did not interfere with optical measurements.
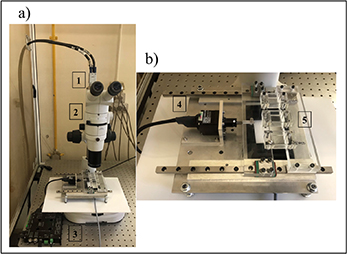
Figure 1. The uniaxial strain device. (a) Experimental system: 1. High-frequency camera, 2. Stereomicroscope, 3. Motor controller. (b) Planar structure for cell stretching: 4. Linear actuator, 5. Silicone stretch chambers.
Download figure:
Standard image High-resolution imageIn order to allow the strain measurements, a random speckle pattern was preliminarily made on the silicone chamber surface by using black paint spray. The main properties that describe the speckle pattern were evaluated, obtaining a value of coverage factor, the ratio of the grey pixels over the entire number of pixels, of about 60%, and an average particle diameter size of 2 ± 2 pixels.
2.2. Real-time strain measurement and control system
The real-time strain measurement and control system was implemented in LabVIEW 2015, using the up-to-date version of a Motion Estimation virtual instrument (VI), 'IMAQ Optical Flow', to capture the silicone base deformation. This VI is based on the evaluation of the motion observed in a sequence of images. In particular, it computes the change in location of a set of reference points (pixels) between two consecutive image frames using the pyramid-based Lucas and Kanade algorithm. Briefly, this algorithm assumes that the flow is basically constant in a local neighbourhood of the pixel under consideration, and it uses the least squares criterion to solve the basic optical flow equations for all the pixels in that neighbourhood [38]. The control system was developed with the aim of obtaining a fast but accurate measurement of the longitudinal strain occurring on the silicone chamber during the entire test, in order to adapt the amplitude of the linear actuator accordingly in a closed-loop circuit. A schematic of the control system is shown in figure 2.
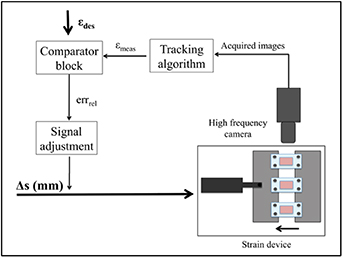
Figure 2. Schematic of the real-time strain measurement and control system.
Download figure:
Standard image High-resolution imageThe input parameters to the control software are the linear actuator peak-to-peak displacement (Δs), the chamber desired longitudinal strain ( des
) and the relative error (errrel_acc
) that can be accepted. During the test, images of the stretched chamber are acquired and processed by the optical tracking algorithm. The algorithm tracks the position of the points selected by the user all through the acquired images, measuring the actual locations. The percentage deformation value between the two points at any time is calculated as follows:
des
) and the relative error (errrel_acc
) that can be accepted. During the test, images of the stretched chamber are acquired and processed by the optical tracking algorithm. The algorithm tracks the position of the points selected by the user all through the acquired images, measuring the actual locations. The percentage deformation value between the two points at any time is calculated as follows:
where δp1 and δp2 are the locations, in the stretching direction, of the first and second points, respectively, and L0 is their initial distance (namely 350 pixels). The relative error (errrel ) between the desired and measured deformations is calculated as follows:
If the absolute value of the relative error is higher than the value of the accepted relative error (errrel_acc ), the algorithm modifies the peak-to-peak input amplitude to the linear actuator as follows:

where n is the iteration number, α is a multiplicative factor imposed equal to 0.2 in accordance with preliminary experiments and (1 + α · errrel ) is higher or lower than 1 if the measured deformation is lower or higher than the desired one, respectively. An accepted relative error of 5% has been fixed for the closed-loop control system.
On the basis of this recursive control algorithm, the whole real-time system operation is made up of two different parts. In the first part, seeking, the software aims at capturing the optimal peak-to-peak amplitude entering the linear actuator to obtain the desired strain value on the silicone chamber, while in the second part, monitoring, the algorithm performs a real-time monitoring of the strain induced on the membrane only from time to time, according to the operator's needs. In detail, in the first part, the tracking algorithm measures the strains occurring in the chamber during each signal period and compares the measured error with the accepted error without interrupting the control signal. If the relative error is higher than the accepted value, the algorithm stops the movement of the linear actuator at the end of the following period, modifies the input amplitude and immediately starts the stimulation again. As a result of this, in the seeking part it is plausible that the movement is interrupted every two cycles. The first part ends when the measured strain is lower than the desired one. At this point, the treatment begins according to the duration imposed through the software. During this second part, the local longitudinal strain is measured more rarely, only to double-check the relative error. It has to be noted that some treatments might last up to 24 h; the measurement of local strains could therefore be done more rarely to avoid system memory overflow, also according to the cell type. If necessary, the amplitude Δs supplied to the linear actuator is modified by using the same logic employed in the seeking part.
The optical tracking algorithm correlation speed was evaluated by computing the time needed for one single matching between two consecutive images and, in parallel, we proceeded with a measurement of the effectiveness of the optical tracking method in relation to the image size and the number of reference points. Indeed, the final aim was to find an optimal compromise between the measurement accuracy and the processing time. The tracking algorithm was in fact employed to have a fast measurement of the longitudinal strain to be used for real-time control, and its accuracy was verified through a comparison with DIC measurements in a post-processing analysis. As for the correlation speed measurement, six image sizes (2040 × 2040 pixels, 2040 × 1020 pixels, 1020 × 1020 pixels, 1020 × 510 pixels, 510 × 510 pixels and 510 × 50 pixels) were evaluated and, for each of them, the algorithm was tested to track a different number of points, namely 2, 4, 6, 8 and 10. The tests were then repeated 15 times for the 30 combinations of image size and pairs of points, which were kept fixed for each image size. As for the accuracy measurements, we performed a series of tests stretching three silicone chambers with a 1 Hz sinusoidal signal for eight peak-to-peak strain amplitude values, namely 0.5%, 1%, 2%, 3%, 4%, 5%, 6% and 7%. The images were acquired with a frequency of 100 fps and an optical magnification of 0.5×. As representative of the limit conditions, we considered the largest and the smallest image size (2040 × 2040 pixels and 510 × 50 pixels), and for each of them we measured the strain occurring between two single points and five pairs of points. For both image sizes, the two single points were placed along the longitudinal axis symmetrically with respect to the central vertical axis and 350 pixels apart (see figure 3(b)). When needed, the other four pairs of points (always 350 pixels apart from each other) were equally distributed along the vertical axis of the chamber with respect to the vertical dimension of the image.

Figure 3. Examples of the silicone stretch chamber employed for the tests. (a) Entire chamber (about 1818 × 1818 pixels) with the speckle pattern on the base. (b) Part of the image (510 × 50 pixels) used by the tracking algorithm. The two reference points are located on the centre axis of the image along the stretching direction, symmetrically to the transverse central axis, and are 350 pixels apart from each other; scale: 5:1. (c) Stretch chamber with the ROI (1050 × 1050 pixels - 11 × 11 nodes) used for DIC.
Download figure:
Standard image High-resolution imageThe capability of the seeking part of the real-time strain system to reach the optimal peak-to-peak amplitude was evaluated by a series of tests performed starting from different initial displacements of the linear actuator. The desired strain (des
) was set to 1% for a 1 Hz stretching signal and the accepted relative error (errrel_acc
) was imposed at 5%. The optimal amplitude corresponding to the desired strain was estimated to be about 0.2 mm with some preliminary experiments. Eight different values of the initial linear actuator displacement were tested, namely 0.1 mm, 0.125 mm, 0.15 mm, 0.175 mm, 0.225 mm, 0.25 mm, 0.275 mm and 0.3 mm, and for each of them the searching procedure was repeated five times. Of note, four values matched with an initial strain lower than the desired one, and four with an initial strain greater, and the tests were performed in a pseudo random order. For each test we analysed the number of iterations needed by the seeking part to reach the optimal amplitude with a relative error (errrel
) lower than the accepted one.
2.3. Validation of the tracking method and characterisation of the membrane strain field
After having demonstrated that the shortest correlation time of the tracking algorithm occurred for two single points and an image size of 510 × 50 pixels, and that no difference in the accuracy of the optical tracking method arises for the number of points to be correlated and the image size, as shown below in the Results section, we proceeded to evaluate whether the strains measured in these strict conditions were representative of the strains developed in the entire silicone membrane. The strains measured with the tracking algorithm were therefore compared with the measurements obtained through the use of a global DIC algorithm previously proposed by our department [39]. The correlation algorithm is based on the processing of digital image sequences, returning a full evaluation of the strains. Briefly, the processing procedure uses a non-linear least-squares fitting performed globally, on the whole image, and simultaneously across several images. The first image is taken as the undeformed image reference and it is divided into a fixed and regular grid of square elements. In order to associate a square sub-image with each element of the subsequent deformed image, the algorithm resamples the deformed image on a distorted pixel grid: a bilinear shape function and a bicubic interpolation scheme are used to locate the new sampling points and to estimate the grey level of the resampled pixels, respectively.
Of note, the strain values obtained with the tracking method were first compared with the average values of the longitudinal strain obtained with DIC. Subsequently, an evaluation of the longitudinal strain homogeneity was also performed. It has to be remarked that to obtain an accurate measurement of the longitudinal strain over the entire silicone membrane a huge number of nodes must be correlated through DIC, making this method applicable only in post-processing.
Figure 3(a) shows an example of the entire silicone stretch chamber in which we highlighted the area employed to set the two reference points (two single pixels) for real-time strain measurement. This region has a size of 510 × 50 pixels and is chosen in the centre of the silicone chamber; the two reference points were placed along the longitudinal axis (stretching direction), symmetrically with respect to the central vertical axis and 350 pixels apart along the stretching direction. A series of preliminary experiments were aimed at determining the possible sources of error and the response of the optical algorithm in dynamic conditions. First, since the pixel placement is related to the determination of the chamber's edges from the operator, we evaluated how a change in the location of the reference points of ± 10 pixels for both the longitudinal and axial directions affected the measured strains. The results showed that the relative error calculated between the strains measured for the two central points and those measured in the other tested conditions was always lower than 2%. Subsequently, to evaluate the error induced by the optical algorithm when tracking the reference points for a long cyclic treatment, we tracked four points placed on the tip of the linear actuator, which was asked to reproduce a sinusoidal movement for 15 min, under two different conditions (0.5% and 7% at 1 Hz). The results showed that the tracking algorithm reproduced the imposed movement with an average relative error of 5.5% and 3.7% for the smaller and the bigger displacement, respectively. Moreover, the coefficient of variation computed over the entire test was found to be always lower than 1% and 0.2% for the two conditions, respectively. Of note, we did not correct the average relative error (as in [40]) since the aim of this work was focused on the strains occurring on the base chamber. The error correction has been therefore directly performed with reference to this variable (with comparison to the DIC results).
Figure 3(c) shows the region of interest (ROI, red grid in figure) employed for DIC, which has a total size of 1050 × 1050 pixels and is divided into 10 × 10 subsets. The DIC algorithm computes the strain occurring for each of the 121 nodes. Of note, a ROI of 1050 × 1050 pixels basically covers the entire silicone chamber excluding the parts where the side effects are expected to be more relevant.
Validation tests were carried out stretching three silicone chambers with a 1 Hz sinusoidal signal for eight different values of peak-to-peak strain amplitude, in the range mainly employed for in vitro testing: 0.5%, 1%, 2%, 3%, 4%, 5%, 6% and 7%. Each test was 10 s long. The camera frame rate was set at 100 fps and, in order to focus the entire base of the stretch chamber with the maximum image resolution (2040 × 2040 pixels), we employed an optical magnification of 0.5× accordingly to the pixel size of the camera (5.5 μm × 5.5 μm). After that, we performed a linear regression between the imposed strains and the strains measured through the tracking method and between the imposed strains and the strains resulting from DIC. To take into account the noise induced by the two optical methods we added the strain values measured at 0% strain to the measurements performed at the strain values reported above. In order to compare the strain values obtained with the tracking method and the average strain over the entire membrane obtained by DIC, the percentage relative error was calculated as follows:
where μt and μDIC are the strains estimated by linear regression for the optical tracking algorithm and for the DIC method, respectively.
Finally, the strain distribution was quantified in the whole ROI of the stretch chambers, 1050 × 1050 pixels divided into 11 × 11 nodes, to evaluate membrane homogeneity. The mean value and the standard deviation among all the selected nodes were analysed. Homogeneity tests were carried out stretching the chamber with a 2 s sinusoidal signal at three different frequencies (0.5 Hz, 1 Hz and 2 Hz) and two imposed strain values (0.5% and 7%), almost representing the minimum and maximum deformation values in the range of use of the in vitro strain device. Of note, to ensure tensile conditions for the entire treatment, the stretching signal included a constant stretch equal to 10% of the amplitude. The resulting signal was therefore composed of a constant load of 0.05% plus a periodic signal of 0.5%, and of a constant load of 0.7% plus a periodic signal of 7% for the two tested conditions. Of note, for a comprehensive analysis of the substrate strain homogeneity we employed a ROI representative of the entire chamber. Nevertheless, we performed a series of preliminary experiments to evaluate the influence of the ROI size and number of nodes on the homogeneity results. In a first test, the distance among the nodes was kept constant and three ROI dimensions were considered: 1050 × 1050 pixels divided into 11 × 11 nodes, and two sub-parts of 630 × 630 pixels and 315 × 315 pixels with the residual number of nodes, namely 7 × 7 nodes and 3 × 3 nodes, respectively. In a second test, we kept fixed the ROI size, 1050 × 1050 pixels, and measured the strain occurring in the stretch chamber for three different numbers of nodes: 11 × 11, 7 × 7 and 3 × 3. Also for these tests the chamber was stretched with a sinusoidal signal at 0.5 Hz, 1 Hz and 2 Hz for two imposed strain values (0.5% and 7%).
2.4. Cell culture
Human osteosarcoma cell line SaOS-2 (catalog no. HTL01001), an osteoblast-like cell line [41], was purchased from Banca Biologica and Cell Factory (IRCCS Azienda Ospedaliera Universitaria San Martino-IST, Genova, Italy). SaOS-2 was grown in Petri dishes with Dulbecco's modified Eagle's medium (DMEM; Euroclone) supplemented with 10% fetal bovine serum (FBS) and 100 units/ml penicillin/streptomycin (Euroclone) and maintained at 37 °C in 5% CO2 for 5 d. Before cells were seeded on the surface, the stretch chamber was sterilised by autoclave and then coated with a nano-film of collagen-I, the most abundant protein in the bone matrix. One millilitre of collagen-I at 10 μg/ml was added and incubated at 37 °C in 5% CO2 for 4 h [21, 42] to favour bone cell adhesion on silicone substrate. At the end of the coating procedure, the excess liquid was removed and the chamber was allowed to dry overnight. Following sterilisation by ultraviolet exposure, cells were seeded at 50 000 cells cm−2 in the chamber and left to spread for 24 h at 37 °C in 5% CO2.
2.5. Experimental test and cellular analysis
To prove that the cells seeded in the silicone chambers were capable of responding to the strains induced through the use of the proposed device, we proceeded with two preliminary experiments. First, the cells were slowly (f = 0.05 Hz) stretched from the initial condition (0.1% pre-stretch as described above) to the final condition of 1% stretch. During this test we focused on a few single cells to evaluate their morphological changes at the end of the stretch.
Subsequently, we proceeded with the simulation of a real treatment by subjecting the cells to a deformation of 1% of the silicone chamber, starting from a pre-stretched condition of 0.1%, for 15 min at 1 Hz. All these stretching parameters were chosen as representative of in vivo substrate strain in osteoblastic cells [36]. The aim of this test was to evaluate the average changes occurring in the cells' shape during real treatment. Notably, since a functionalisation treatment with collagen-I was performed to favour bone cell adhesion on the silicone substrate as described above, we proceeded with a series of preliminary experiments to confirm that the strains measured on the silicone base, i.e. the values employed to deeply characterise the entire system, were in agreement with the values measured on the collagen nano-film. In detail, a speckle pattern was printed below the silicone chamber base and on the collagen-I layer. The chamber was stretched with a 1 Hz sinusoidal input at 1% for 5 s by tracking the speckle on the chamber base, and the average longitudinal strain field measured on the chamber base and on the collagen-I layer were compared. The results showed an agreement between the two average strains higher than 99%. The homogeneity of the strain field on the collagen film was also in complete agreement with that of the silicone chamber base, thus confirming that the collagen-I nano-layer does not alter the strain transmission from the silicon chamber to the cells.
For cell analysis, phase contrast images were acquired with an inverted microscope (Nikon, Eclipse TS 100) and a digital camera (Nikon, DS-Fi2). During the first test we compared the cells' shape in the stretched condition with that in the pre-stretched one, with reference to the very same cells (n = 5); in the second test we compared the average shape of the cell culture (n = 36) at the end of the treatment with the initial one. The cell shape was computed with ImageJ software; the outline of each cell was depicted by the user (as shown in figure 4(a)), and the best-fitting ellipse was then obtained by the software, as shown in figure 4(b). Cell roundness was computed as the ratio of the minor axis to the major axis, thus expressing the degree to which the cell shape differs from that of a circle. Of note, even if a cell's shape is usually different from that of a pure ellipse, this procedure is commonly used in experimental biology to evaluate cell response to mechanical stimuli [27, 43, 44].

Figure 4. Example of how the ImageJ software fits an ellipse to an outlined cell. Representative image of SaOS-2 cells seeded on the collagen-I coated silicone substrate in pre-stretched condition. (a) Cell outline depicted by the user. (b) Fitted ellipse on the cell.
Download figure:
Standard image High-resolution image2.6. Statistical analysis
All the statistical analyses were carried out with GraphPad Prism 6.0 and differences were considered significant when p < 0.05.
The computation time of the tracking algorithm is shown as the mean ± standard deviation (SD) of 15 independent repetitions calculated for one single matching and for 30 combinations of image sizes and pairs of reference points. A repeated-measures two-way analysis of variance (ANOVA) was performed assuming the image size and the number of reference points as fixed factors, followed by a multiple comparison test to look for differences in the measured time.
The strains measured by the tracking algorithm are shown as the mean ± SD of three independent repetitions calculated for eight strain values and for four combinations of image sizes and pairs of points. The linear relationship between the strain imposed and the strain measured by the tracking algorithm was assessed by linear regression with the p-value fixed at 0.05. A repeated-measures two-way ANOVA was performed assuming the imposed strain and the tracking conditions (number of points or image size) as fixed factors, followed by the multiple comparison test to look for differences in the measured strains.
The number of iterations and the relative errors obtained by the seeking part of the real-time system are shown as the mean ± SD of five independent repetitions calculated for eight values of the initial linear actuator displacement. A one-way ANOVA was performed, followed by multiple comparison tests to look for differences in the number of iterations and relative errors; once for the initial amplitudes lower than the optimal amplitude, and once for the initial amplitudes higher than the optimal one.
The linear relationship between the strain imposed and the strain measured with the tracking algorithm and with DIC was assessed by linear regression with the p-value fixed at 0.05.
The Mann–Whitney test was used to look for significant differences in cell roundness, major axis and minor axis.
3. Results and discussion
3.1. Real-time strain measurement system
Figure 5(a) shows the computation time needed by the tracking algorithm to measure the strains between two single images as a function of image size and number of reference points. As expected, two-way ANOVA showed a reduction in computation time for decreasing size (p < 0.0001) and number of reference points (p < 0.0001). In particular, a post hoc test showed that regardless of the number of reference points, a significant decrease in the computation time occurred when working with the smallest image size tested (510 × 50 pixels) compared with all the others. Figure 5(b) shows the computation time measured for the optimal image size of 510 × 50 pixels for all the reference points. The results showed a significant decrease in the computational time for 6, 8 and 10 points compared to 2 points. Furthermore, even if not statically significant, a lower average computation time (0.27 ms ± 0.04 ms) was measured when considering two single points than when using four reference points (0.31 ms ± 0.06 ms).
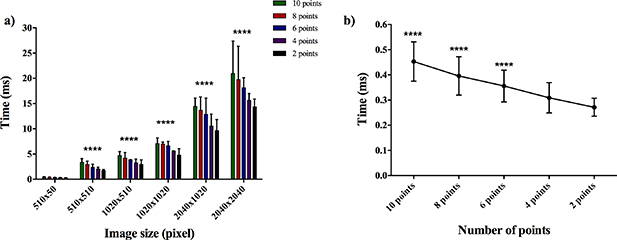
Figure 5. Computation time for the optical tracking algorithm. Data are mean ± SD. n = 15. (a) Time calculated by varying the number of reference points and the image size. ****p < 0.0001 vs 510 × 50 pixels. (b) Time for 510 × 50 pixel image size by varying the number of reference points.****p < 0.0001 vs 2 points.
Download figure:
Standard image High-resolution imageFigure 6 shows the strain values measured by the optical tracking algorithm for the different numbers of reference points and image sizes tested, for the eight values of selected strain. The linear regression tests showed values of R2 higher than 0.99 for all four tracking conditions (image size and number of reference points). As expected, two-way ANOVA revealed a significant difference for the imposed strain factor. On the other hand, no significant difference (p = 0.90) was shown for the tracking conditions factor, which includes changes in both image size and number of reference points. Tukey's multiple comparison test also showed no significant difference between each combination of tested conditions (image size and number of reference points) for all the strain values imposed.

Figure 6. Strain values measured by the optical tracking algorithm in the four conditions for different image size and number of reference points. Data are mean ± SD. n = 3.
Download figure:
Standard image High-resolution imageTaken all together, these results allowed us to choose the optimal working condition for the tracking algorithm in terms of low computational time, without affecting the accuracy of the measurements: two single points for an image size of 510 × 50 pixels. It is important to underline that, since the computational times were calculated for one single matching, the whole time for each iteration of the tracking algorithm depends on the frame rate of the camera, which, in turn, depends on the stimulation signal frequency.
Table 1 shows the number of iterations needed to reach the desired strain during the seeking part, as well as the final relative error, when the convergence of the algorithm was tested by starting from eight different conditions. As expected, one-way ANOVA analysis revealed a significant difference (p < 0.0001) in the number of iterations needed to reach the desired strain when the initial amplitude was both lower and higher than the optimal one. As for the relative error obtained at the end of the seeking part of the algorithm, statistical analysis did not show any significant difference either for initial amplitudes lower than the optimal one or for initial amplitudes greater than the optimal one.
Table 1. Number of iterations and relative errors needed to reach the desired strain in the seeking part of the real-time system. Data are mean ± SD. n = 5.
| Initial amplitude (mm) | 0.1 | 0.125 | 0.15 | 0.175 | 0.225 | 0.25 | 0.275 | 0.3 |
|---|---|---|---|---|---|---|---|---|
| No. of iterations | \,\,\,18.0 ± 0.0 | \,\,14.4 ± 0.9 | \,\,13.0 ± 0.0 | 9.8 ± 1.1 | 7.2 ± 0.5 | 9.0 ± 0.0 | 10.8 ± 0.8 | 11.6 ± 1.4 |
| Relative error (errrel ) (%) | \,\,3.3 ± 0.8 | 3.8 ± 0.5 | 2.8 ± 1.1 | 2.9 ± 0.7 | −3.7 ± 0.8 | −4.2 ± 0.5 | \,\,\,−3.2 ± 0.9 | \,\,\,−3.6 ± 0.8 |
Figure 7 shows an example of one searching test of the real-time tracking algorithm in which the starting value of the linear actuator displacement was equal to 0.3 mm. The desired strain (εdes ) was set to 1% for a 1 Hz stretching signal. Figure 7(a) shows the displacement of the linear actuator during the seeking part. It is possible to note that, after two periods of stretching, the algorithm interrupted for about 120 ms. This is the time needed by the algorithm to create the image memory allocations for the new images to be acquired and to set up the new control parameters. Figure 7(b) shows the relative percentage error between the desired and the measured deformation for each algorithm iteration. After nine iterations the relative error became lower than 5%, the accepted relative error value imposed in advance. Subsequently, the algorithm entered the monitoring part, as described in the 'Real-time strain measurement and control system' section. Of note, the test shown in figure 7 was performed starting from a peak-to-peak displacement quite far from the optimal one on purpose. Nonetheless, the algorithm needed 19 s to set the optimal input amplitude, a value that can be considered negligible with respect to the treatment duration, always higher than 15 min and up to 24 h in several cases.

Figure 7. Example of a searching test of the real-time tracking algorithm, starting from a peak-to-peak displacement higher than the optimal one. (a) Displacement of the linear actuator. (b) Percentage relative error on measured strain.
Download figure:
Standard image High-resolution image3.2. Characterisation of the membrane strain
The linear regression tests performed for the results obtained through the tracking algorithm in the optimal conditions previously obtained (two points and an image size of 510 × 50 pixels), and for the DIC employed to correlate images of 1050 × 1050 pixels, showed values of R2 always higher than 0.99 in the strain values measured by the DIC method as well as in the optical tracking algorithm. This result confirmed a linear relationship between the strain imposed and the strain measured by DIC as well as the strain imposed and the strain measured by the tracking algorithm. According to these results, the percentage relative error (see equation (4)) was calculated in order to validate the strains measured with the optical tracking method with reference to the average strain of the entire chamber, measured by the DIC technique. The results showed that the tracking algorithm always overestimated the strains measured with DIC, with a relative error almost constant for all the imposed strains (5.6% on average), as displayed in figure 8. After correcting this systematic error, the strain values obtained with the tracking method showed a relative error lower than 0.3% compared to the strain measured over the whole silicone chamber with DIC.

Figure 8. Linear regressions for the strain values measured by the DIC technique and the optical tracking algorithm.
Download figure:
Standard image High-resolution imageFigure 9 shows the mean and SD of the strains measured for all the nodes selected on the larger dimension of the tested ROIs, representative of the whole chamber, 1050 × 1050 pixels divided into 11 × 11 nodes. The experimental results pointed out a strain pattern highly homogeneous in the entire ROI in all the tested conditions.
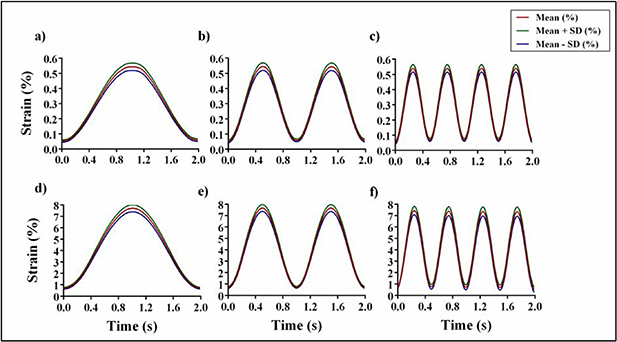
Figure 9. Mean values and SD among all the nodes selected in the ROI of the stretch chamber of dimension 1050 × 1050 pixels divided into 11 × 11 nodes. The tests were performed for six different combinations of frequency and amplitude. (a) 0.5% at 0.5 Hz; (b) 0.5% at 1 Hz; (c) 0.5% at 2 Hz; (d) 7% at 0.5 Hz; (e) 7% at 1 Hz; (f) 7% at 2 Hz.
Download figure:
Standard image High-resolution imageTable 2 displays the mean value and SD of the strains measured between the nodes for two specific conditions: at the first peak and the first trough of the stimulation signals. As expected, for all the tests, the difference between the signal amplitude, namely the peak value minus the trough value, and the theoretic input strain (0.5% or 7%) was smaller than the relative error (5%) imposed.
Table 2. Homogeneity analysis of the stretch chamber at the first peak and the first trough of the signal shown as mean ± SD.
| Peak strain (%) | Trough strain (%) | |
|---|---|---|
| 0.5% at 0.5 Hz | 0.543 ± 0.024 | 0.058 ± 0.009 |
| 0.5% at 1 Hz | 0.544 ± 0.025 | 0.058 ± 0.009 |
| 0.5% at 2 Hz | 0.539 ± 0.025 | 0.062 ± 0.010 |
| 7% at 0.5 Hz | 7.715 ± 0.305 | 0.708 ± 0.074 |
| 7% at 1 Hz | 7.676 ± 0.302 | 0.729 ± 0.075 |
| 7% at 2 Hz | 7.431 ± 0.365 | 0.765 ± 0.195 |
Interestingly, the results obtained by varying the ROI size and the number of nodes revealed a small trend toward lower strain values when increasing the ROI size, while no differences were noted when increasing the number of nodes (data not shown). As expected, by increasing the number of nodes the SD increased as well; as a matter of fact, the use of a low number of nodes did not allow us to perform a comprehensive evaluation of the strain homogeneity over the entire surface. It is worth noting that the SDs obtained for the entire ROI and shown in figure 9 and table 1 are quite low, and contain the variations of the nodes over the entire ROI, thus including also any sub-ROI in the chamber.
3.3. Cellular analysis
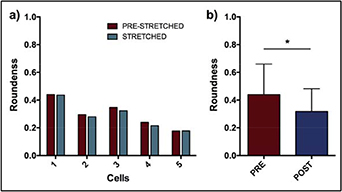
Figure 10(a) shows the roundness of the five cells focused at the beginning and at the end of the 1% stretch. The results showed that all of them encountered a decrease (or no change) in the roundness value, expressing a lengthening of their shape when maintained in the 1% stretched condition. Figure 10(b) shows the average roundness of the cultured cells after 15 min of 1%, 1 Hz treatment. The results showed that the cultured cells showed, on average, a significant (p < 0.05) reduction of 18% of their roundness value. In particular, the major axis encountered a trend toward larger values after the treatment, and the minor axis a significant reduction of 16% on average (p < 0.05; data not shown). All these data confirmed that the cells seeded on the silicone chambers stretched by our device are capable of sensing the substrate deformation, and, as a result of this, encountered a change in their morphology.
Figure 10. (a) Roundness values of five SaOS-2 cells in pre-stret-ched and stretched condition. (b) Average roundness value of cultured SaOS-2 cells after the treatment in comparison to initial condition. n = 36, *p < 0.05.
Download figure:
Standard image High-resolution image
4. Conclusions
In this paper, we developed an in vitro device for measuring uniaxial strain substrate deformation with an innovative real-time strain measurement and control system. To accurately approach the study of mechanotransduction following cell substrate deformation in vitro, real-time measurement of the induced strain is crucial to ensure the proper mechanical stimulus acting on the cells. The uniaxial strain device proposed in this study allows stretching three silicone chambers simultaneously in the range of 0.5%–7% and 0.5 Hz–2 Hz, to test a huge variety of cells; for example, bone, skeletal muscle and endothelial cells. The real-time strain measurement and control was developed in LabVIEW 2015 by using an optical tracking algorithm. The use of a tool developed in LabVIEW allowed us to synchronise the various components of the entire setup (i.e. the image acquisition, the motion of the linear actuator and the real-time strain system) and to integrate the control strategy to continuously change the strain induced on the silicone substrate. The effectiveness of the optimal tracking algorithm was evaluated by computing the correlation speed between two consecutive images and by analysing the measurement accuracy given different conditions (image size and number of reference points). The optimal correlation time was found to be 0.27 ms ± 0.04 ms for a size of 510 × 50 pixels with two single reference points. The algorithm was also demonstrated to converge to the desired value for initial amplitudes lower and higher than the optimal one. To validate the real-time strain measurements, the strains measured with the real-time tracking algorithm were compared with those obtained from DIC, allowing compensation of the systematic error. After systematic error correction, the strain values measured with the tracking algorithm showed a relative error lower than 0.3% compared with DIC values. The use of DIC also allowed evaluation of the strain homogeneity of the entire substrate. Finally, we performed a series of tests to evaluate the efficacy of the proposed device on cell cultures. Our results showed that SaOS-2 human osteosarcoma cells significantly changed their shape in response to substrate deformation.