Transport and Behavior of Microplastics Emissions From Urban Sources in the Baltic Sea
 Gerald Schernewski1,2*
  Hagen Radtke1
  Rahel Hauk1
  Christian Baresel3 Mikael Olshammar3 Robert Osinski1
  Sonja Oberbeckmann1
- 1Leibniz Institute for Baltic Sea Research, Rostock, Germany
- 2Marine Research Institute, Klaipėda University, Klaipėda, Lithuania
- 3IVL Swedish Environmental Research Institute, Stockholm, Sweden
Urban sources, wastewater treatment plants (WWTPs), untreated wastewater (not connected to WWTPs), and especially combined sewer overflow systems (CSS) including stormwater are major pathways for microplastics in the aquatic environment. We compile microplastics emission data for the Baltic Sea region, calculate emissions for each pathway and develop emission scenarios for selected polymer types, namely polyethylene (PE)/polypropylene (PP) and the polyester polyethylene terephthalate (PET). PE/PP and PET differ with respect to their density and can be regarded as representative for large groups of polymers. We consider particles between 20–500 μm with varying shapes. The emission scenarios serve as input for 3D-model simulations, which allow us to estimate transport, behavior, and deposition in the Baltic Sea environment. According to our model results, the average residence time of PET and PE/PP in the Baltic Sea water body is about 14 days. Microplastics from urban sources cause average concentrations of 1.4 PE/PP (0.7 PET) particles/m2 sea surface (20–500 μm size range) in the Baltic Sea during summer. Average concentrations of PET, resulting from urban sources, at the sea floor are 4 particles/m2 sediment surface during summer. Our model approach suggests that accumulation at the shoreline is the major sink for microplastic with annual coastal PE/PP and PET accumulation rates of up to 108 particles/m each near emission hot-spots and in enclosed and semi-closed systems. All concentrations show strong spatial and temporal variability and are linked to high uncertainties. The seasonality of CSS (including stormwater) emissions is assessed in detail. In the south-eastern Baltic, emissions during July and August can be up to 50% of the annual CSS and above 1/3 of the total annual microplastic emissions. The practical consequences especially for monitoring, which should focus on beaches, are discussed. Further, it seems that PET, PE/PP can serve as indicators to assess the state of pollution.
Introduction
In the United Nations Environment Programme, marine litter is defined as “persistent, manufactured or processed solid material that is discarded, disposed of, or abandoned in the marine and coastal environment1.” Marine litter is regarded as a global concern, affecting seas and oceans worldwide and causing environmental, economic, and aesthetic problems. Marine litter is commonly separated into macro- (> 25 mm), meso- (5–25 mm), and micro-litter (< 5 mm). The most important fraction of marine litter is plastics and especially microplastics (MP) is of major concern (GESAMP, 2016). The European Union Marine Strategy Framework Directive (MSFD 2008/56/EC) addresses this problem and has the aim to “ensure that properties and quantities of marine litter do not cause harm to the coastal and marine environment.” As a consequence, the state-of-pollution of the marine environment has to be assessed, environmental targets and associated indicators have to be developed, major emission sources have to be identified and quantified and effective measures leading to reductions in marine litter pollution have to be tested (JRC, 2011).
Sources for microplastics in the environment are primary microplastics in cosmetic and cleansing products entering wastewater systems, emissions through accidental spills and during the life cycle of a product (clothing, tires) as well as secondary microplastics arising from the fragmentation and degradation of meso- and macroplastics. Plastics enter the marine environment via riverine systems, coastlines, from vessels and platforms or the atmosphere (GESAMP, 2016). Since human activities are the source for microplastics, wastewater is considered as a major emission pathway (e.g., Mintenig et al., 2016; Ziajahromi et al., 2016; Kay et al., 2018; Prata, 2018). For untreated wastewater, high microplastic concentrations between 101–104 particles/L are reported (Gatidou et al., 2019; Sun et al., 2019), but municipal wastewater treatment plants (WWTPs) are efficient in removing microplastics (Carr et al., 2016; Talvitie et al., 2017; Gies et al., 2018). For WWTPs in the Baltic Sea region, Baresel and Olshammar (2019) assume, depending on their treatment stages, a microplastics retention between 85 and 98%. Despite this relatively good overall removal efficiency, WWTPs are still considered as a major microplastic emission pathway in the Baltic Sea region because of the high wastewater quantities treated (Baresel and Olshammar, 2019).
Combined sewer overflow water, that consists of storm water and untreated wastewater can be another major source of microplastics, even though overflow events happen rarely. For the Baltic Sea region, Baresel and Olshammar (2019) conclude that the annual discharge of microplastics from sewer overflows can be in the same magnitude as from treated wastewater. In addition, poorly known emissions result from untreated wastewater as a consequence of technical failures or capacity limitations at the WWTPs and the sewer system (Magnusson et al., 2016; Dris et al., 2018). In the Baltic Sea region wastewater and stormwater drainage systems are often separated. However, wash off during intensive precipitation can cause high plastic concentrations in stormwater and represent another important emission pathway for the aquatic environment. For example, in the water of seven Danish urban and highway storm water ponds, microplastics concentrations between 0.5 and 23 particles/L were found (Liu et al., 2019).
Objectives of our study are to (a) compile emission scenarios from urban sources for the selected representative polymer types polyethylene/polypropylene (PE/PP) and polyethylene terephthalate (PET) into the entire Baltic Sea (b) perform 3D-model simulations on transport, behavior, and deposition in the Baltic Sea environment and (c) assess the practical consequences and implications for policies and the development of a microplastic monitoring. We consider microplastics with a size between 20 and 500 μm and varying shapes. We take into account the emissions from three pathways, namely WWTP, combined sewer overflow systems (CSS) including urban stormwater runoff as well as untreated wastewater (not connected to WWTPs).
Materials and Methods
Plastic Polymers and Properties
According to Geyer et al. (2017) the amount of non-fiber plastics manufactured worldwide since 1950 is about 7300 Mt compared to fibers with 1000 Mt. Fibers usually consist of polyester, polyamide, and acryl and are mainly used for clothing. The largest groups in total non-fiber plastics production are PE (36%), PP (21%), polyvinyl chloride (PVC, 12%), and PET(< 10%). 42% of all non-fiber plastics, mainly PE, PP, and PET, is used for packaging, e.g., plastic bags, plastic films, and bottles. 19% of all non-fiber plastics, mainly PVC, is used in the building and construction sector, e.g., for pipes, doors and windows.
The density of plastics (artificial polymers) is an important parameter that determines its transport, behavior and deposition in the aquatic environment. According to the density, we separate floating and sinking polymer types. The group of floating polymers includes low and high density PE (0.915–0.97 g/cm3 density) and PP (0.89–0.92 g/cm3 density). The group of sinking polymers covers rigid PVC (1.3–1.45 g/cm3 density) and PET (1.38 g/cm3 density). The most common polyester fibers are made of PET. Acrylic and polyamide fibers have a density of only 1.18 g/cm3 and 1.14 g/cm3, respectively. According to Sun et al. (2019) PP, PE, and PET are the most abundant polymers in WWTPs.
In literature, the PE/PP and polyester (PET) fraction of the total microplastics particles in stormwater and raw wastewater varies in a wide range (e.g., Kang et al., 2018), but both are usually in the same order of magnitude (e.g., Liu et al., 2019; Olesen et al., 2019; Sun et al., 2019). Kooi and Koelmans (2019) provide the shares most common microplastics polymer types in the aquatic environment: PE 25%, PET 16.5%, and PP (14%). Based on literature (Talvitie et al., 2015; Murphy et al., 2016; Lares et al., 2018; Simon et al., 2018; Wolff et al., 2019; Long et al., 2019), review papers (Kang et al., 2018; Gatidou et al., 2019; Sun et al., 2019) and taking into account the data quality assessment by Koelmans et al. (2019), we calculated an average minimum of 511 and an average maximum of 18,196 PE/PP particles/m3 raw wastewater and an average minimum of 119 and an average maximum of 21,967 PE/PP particles/m3 in stormwater. Based on Murphy et al. (2016); Long et al. (2019) and Wolff et al. (2019) we calculated an average minimum of 401 and an average maximum of 14,492 PET particles/m3 raw wastewater and stormwater. The average minimum and average maximum are based on the lower and upper concentrations reported in the literature. In our simulation scenarios, we applied the average maximum concentrations.
Beside its density, the floating and sinking behavior of microplastics is influenced by particle size and shape. For one simulation, we separated the size classes 20–200 and 200–500 μm and, based on data in Ziajahromi et al. (2017), assumed that 90% of microplastics in WWTPs belongs to the size class 20–200 μm. According to a comprehensive review by Sun et al. (2019), we separated microplastics into fibers and particles and assumed that fibers have an average proportion of 50%. All other shapes are considered as (spherical) particles.
Microplastics Emission Calculations
Model simulations about the transport, behavior and deposition of microplastics in the aquatic environment require the concentrations of microplastics in and the amount of discharge water as model input. CSS, which are common in urban areas of the Baltic Sea region, collect surface water runoff, domestic sewage, and industrial wastewater. Baresel and Olshammar (2019) compiled data about and quantified the amount of sewage water for 3,525 WWTPs in the Baltic Sea region. As average microplastics removal efficiency in WWTPs depending on the treatment technology we used 85% for primary treatment, 90% for secondary treatment, 95% for tertiary treatment (N and P removal), 97% for sand-filtration and 98% for micro-filtration. For details see Baresel and Olshammar (2019). The concentrations of each polymer in influent sewage water, the waste water discharge and the removal efficiency of each WWTP allowed the quantification of the annual microplastics-discharge from WWTPs into the river systems of the Baltic Sea region. We complemented missing data for single WWTPs based on country specific average amounts of wastewater per person and day as well as taking into account the country specific percentage of the population connected to WWTPs.
In CSS, sanitary sewer overflows take place, where untreated wastewater is discharged from a sanitary sewer into the aquatic environment. Usually this happens due to a temporary insufficient hydraulic capacity after heavy precipitation. Baresel and Olshammar (2019) assumed that in the Baltic Sea region, weather related sanitary sewer overflow accounts for 1.5% of the total WWTP inflow. This value was applied and for seasonal overflow calculations, we assumed that this is equivalent to 1.5% of the time of the year. We assumed that sanitary sewer overflows resulting from technical problems are included in the 1.5%. Separated sewer systems (SSS) collect storm water and wastewater in separated systems. In these systems storm water is always released into the aquatic environment usually without treatment. For the Baltic Sea region reliable numbers about the water discharge from SSS are lacking. We assume that SSS have a share of 50% in the Baltic Sea region. SSS emissions are not treated as separate pathway but are integrated into CSS emissions.
Sanitary sewer overflows are a result of heavy rains, which do not have the same likelihood throughout the year and differ regionally in the Baltic Sea region. To reflect realistic conditions, the emissions were calculated on a monthly basis for each WWTP. For each WWTP, daily precipitation amounts were extracted from the German Weather Service (DWD) 3-h forecasts. For the years 2009–2016, output of the LME model was used, and for the years 2017–2018 the predictions originate from the ICON model. The resulting daily time series over 10 years was created by adding large-scale and convective rainfall predicted by the model. Solid precipitation (snow) was neglected because we assumed, that snow and snow melt plays only a minor role for sanitary sewer overflows. For each WWTP, we identified the 98.5% percentile, meaning the amount of rain which is exceeded on 1.5% of the days only. We then attributed the rainfall on those days to the calendar month to create a monthly climatology of heavy rainfall at each WWTP. The resulting seasonal pattern describes the monthly likelihood of sewer overflow at each WWTP. The total annual microplastics emissions were allocated to the single months according to their overflow likelihood.
Our model approach allows a scaling of the plastic polymer concentrations in the environment, by post-processing the simulation results. This means the absolute concentrations emitted via each pathway, polymer type and size class potentially can be adjusted if new insights or better field data are available. This is possible as long as the relative spatio-temporal emission pattern remains the same.
Model Approach
The modeling approach follows Osinski and Radtke (2020). We use the uncertainties in ensembles of regional reanalyses (UERRA) high-resolution atmospheric reconstruction, provided by sveriges meteorologiska och hydrologiska institut (SMHI), to drive both a third-generation wave model (WAVEWATCH 3) and a hydrodynamic model for the Baltic Sea general estuarine transport model (GETM). Both models have a horizontal resolution of one nautical mile. A microplastics transport module is integrated online into the hydrodynamic model following Osinski et al. (2020). The wave model provides wave properties required for the calculation of bottom shear stress, and the hydrodynamic model provides the current field used for the passive transport of the particles, which are represented in an Eulerian framework as a concentration per grid cell. The size, density, and shape of the particles determine the vertical velocity relative to the ambient water and the critical shear stress for the resuspension. The actual shear stress at each time step is calculated from the bottom current velocity and the significant wave height which is provided from the wave model. Settled particles are re-suspended when the actual shear stress exceeds the critical value. Tidal currents are generally taken into account, but do not play a role because the Baltic Sea is micro-tidal with a tidal range of a few centimeters only.
Sinking velocities are determined from the Stokes parameterization assuming a spherical shape. For each size class, we use the lower size limit as the particle diameter assumed for the Stokes formula, since (a) smaller particles typically have a higher abundance and (b) deviations of larger particles from the spherical shape would cause a reduction in the vertical velocity, such that they would behave like smaller spherical ones in this sense. The critical shear stress is calculated from the Shields curve (Shields, 1936). Exception are fibers, for which we chose the empirically determined parameterizations by Waldschläger and Schüttrumpf (2019a) for the sinking velocity and Waldschläger and Schüttrumpf (2019b) for the critical shear stress. The restriction of our approach to the 20–500 μm size class results from model limitations. Large PET particles show a higher sinking velocity and the faster transfer from one vertical model layer to the next one cannot be resolved with the applied model calculation time steps and would cause model instability. The actual values used for sinking velocity and critical shear stress are given in the online supplement.
Beach accumulation is parameterized as follows: Particles entering a grid cell adjacent to a land cell are immediately removed from the model and counted as beached. An exception are those grid cells acting as a source, such as rivers, here we do not assume beach accumulation. A possible resuspension and further transport of the particles is neglected. The model simulations covered 2 years, the period from March 2016 until February 2017. Additional 2 months before were used for model spin-up.
Scenarios for PP/PE and PET
Spatially resolved microplastics emission scenarios serve as model input. The emission takes place at the land/sea interface. Every (sub-)scenario serves as input for one model run. Scenarios 1 and 2 assume constant daily microplastics emissions during the year. Scenario 1 deals with PE/PP, takes into account the 20–500 μm microplastics size fraction and considers emissions from treated wastewater (WWTP effluents; sub-scenario 1.1), untreated wastewater from populations not connected to WWTPs (sub-scenario 1.2) and CSS (including both stormwater and untreated wastewater; sub-scenario 1.3).
Scenario 2 focusses on PET but assumes different size classes and particle shapes. Similar to scenario 1, the sub-scenarios 2.1–2.3 take into account the 20–500 μm microplastics size fraction and emission separated into WWTPs, untreated wastewater and CSS including stormwater. Sub-scenarios 2.4–2.6 assume the emissions from all three urban emission sources but distinguish the size fractions 20–200 and 200–500 μm and separate fiber and spherical shaped particles.
Scenario 3 deals with PE/PP and the 20–500 μm microplastics size fraction but is restricted to emissions from CSS including stormwater. CSS emissions are resolved on a monthly basis according to spatio-temporal distribution of heavy rain events. Every scenario is simulated separately.
Results
Spatio-Temporal Emission Pattern to the Baltic Sea
The calculated PE/PP emissions from the three urban sources, namely treated wastewater, untreated wastewater (not connected to WWTPs) and CSS (always including stormwater) into the entire Baltic Sea are presented in Figures 2A–D. The compiled dataset shows for PE/PP, that CSS are the most important emission source followed by treated and untreated wastewater (Figure 2F). Large rivers are the major pollution pathway followed by coastal cities. In Germany, Denmark, Sweden, and Finland practically 100% of the population is connected to WWTPs and the average cleaning efficiency is around 95%. In the south-eastern countries Poland, Lithuania, Latvia, Estonia, and Russia, between 78 and 100% are connected to WWTPs as well, but the cleaning efficiency on average is lower (85%). As a consequence, the WWTP emissions from these countries are relatively high. Since in most of these countries not all wastewater is treated, microplastics emissions with untreated wastewater are relatively high in the south-eastern Baltic, as well. Especially Kaliningrad and St. Petersburg regions (Russia) are hot-spot in this respect. CSS systems are common in many countries and high emissions take place all around the Baltic, despite the fact that sewer overflow and stormwater events are usually taking place only during a few days per year.
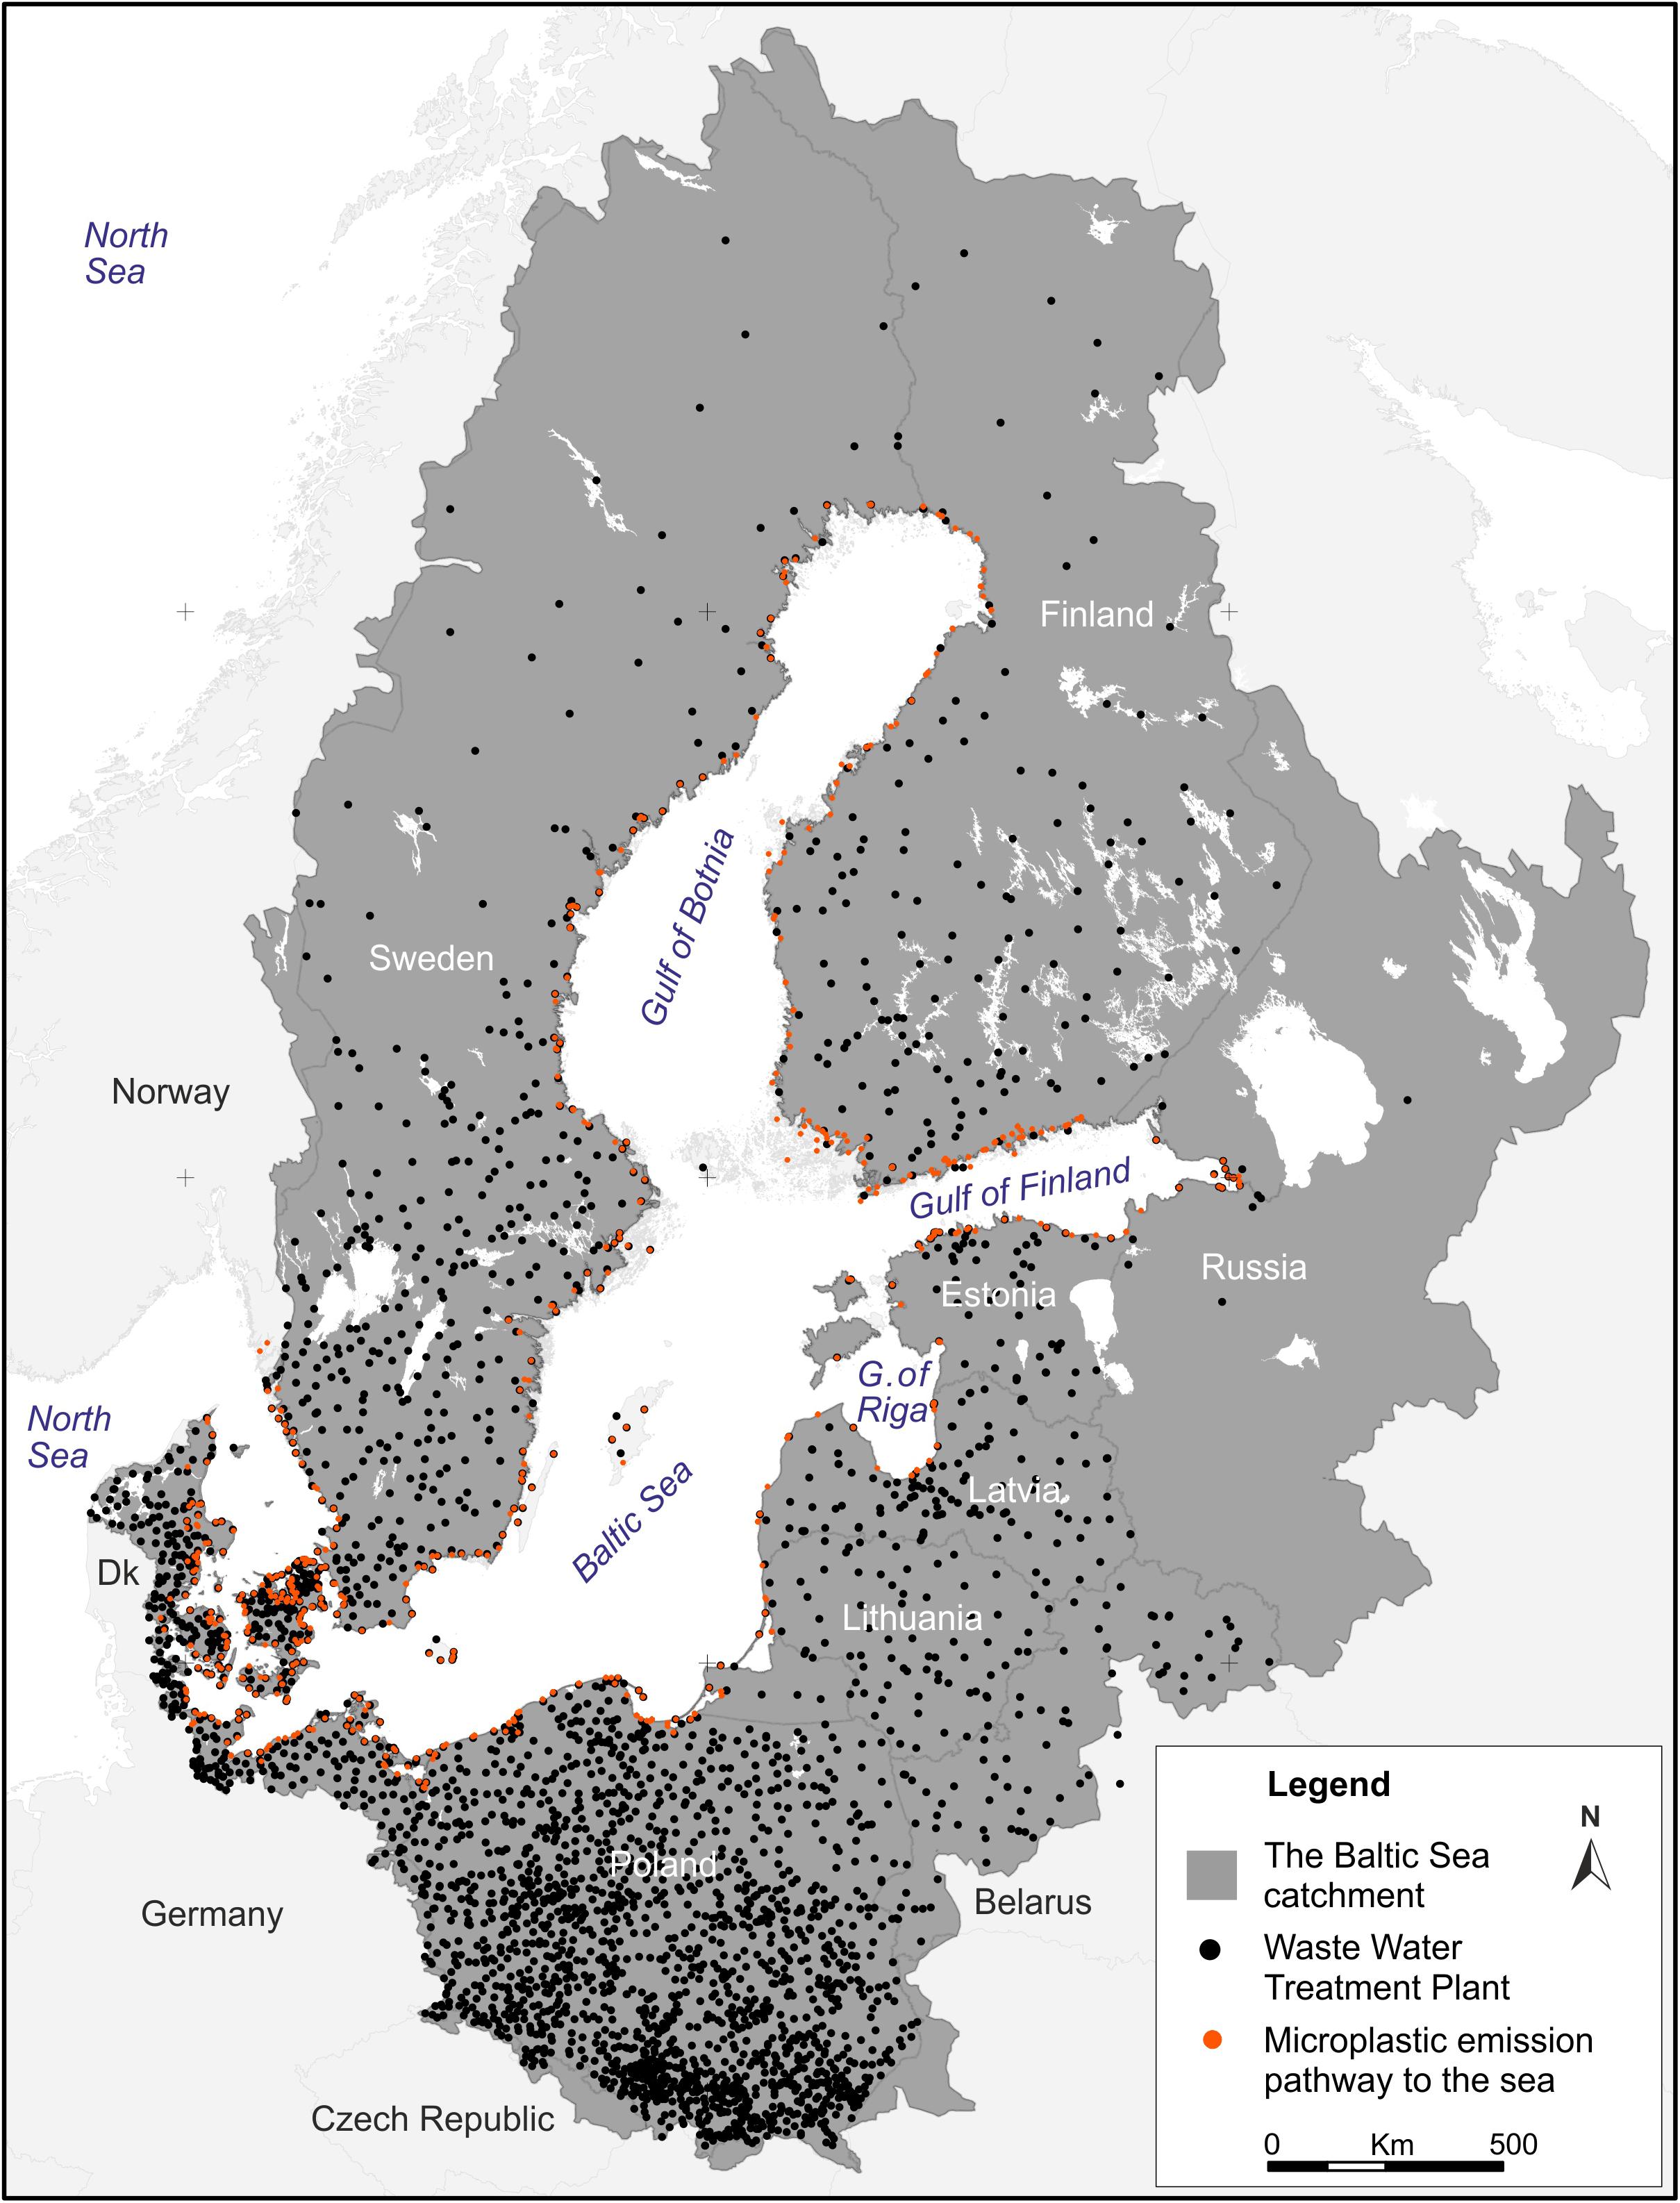
Figure 1. Location of the about 3500 wastewater treatment plants (WWTPs) in the Baltic Sea catchment (black dots) and microplastics emission pathways/points (rivers and direct discharge) to the Baltic Sea.
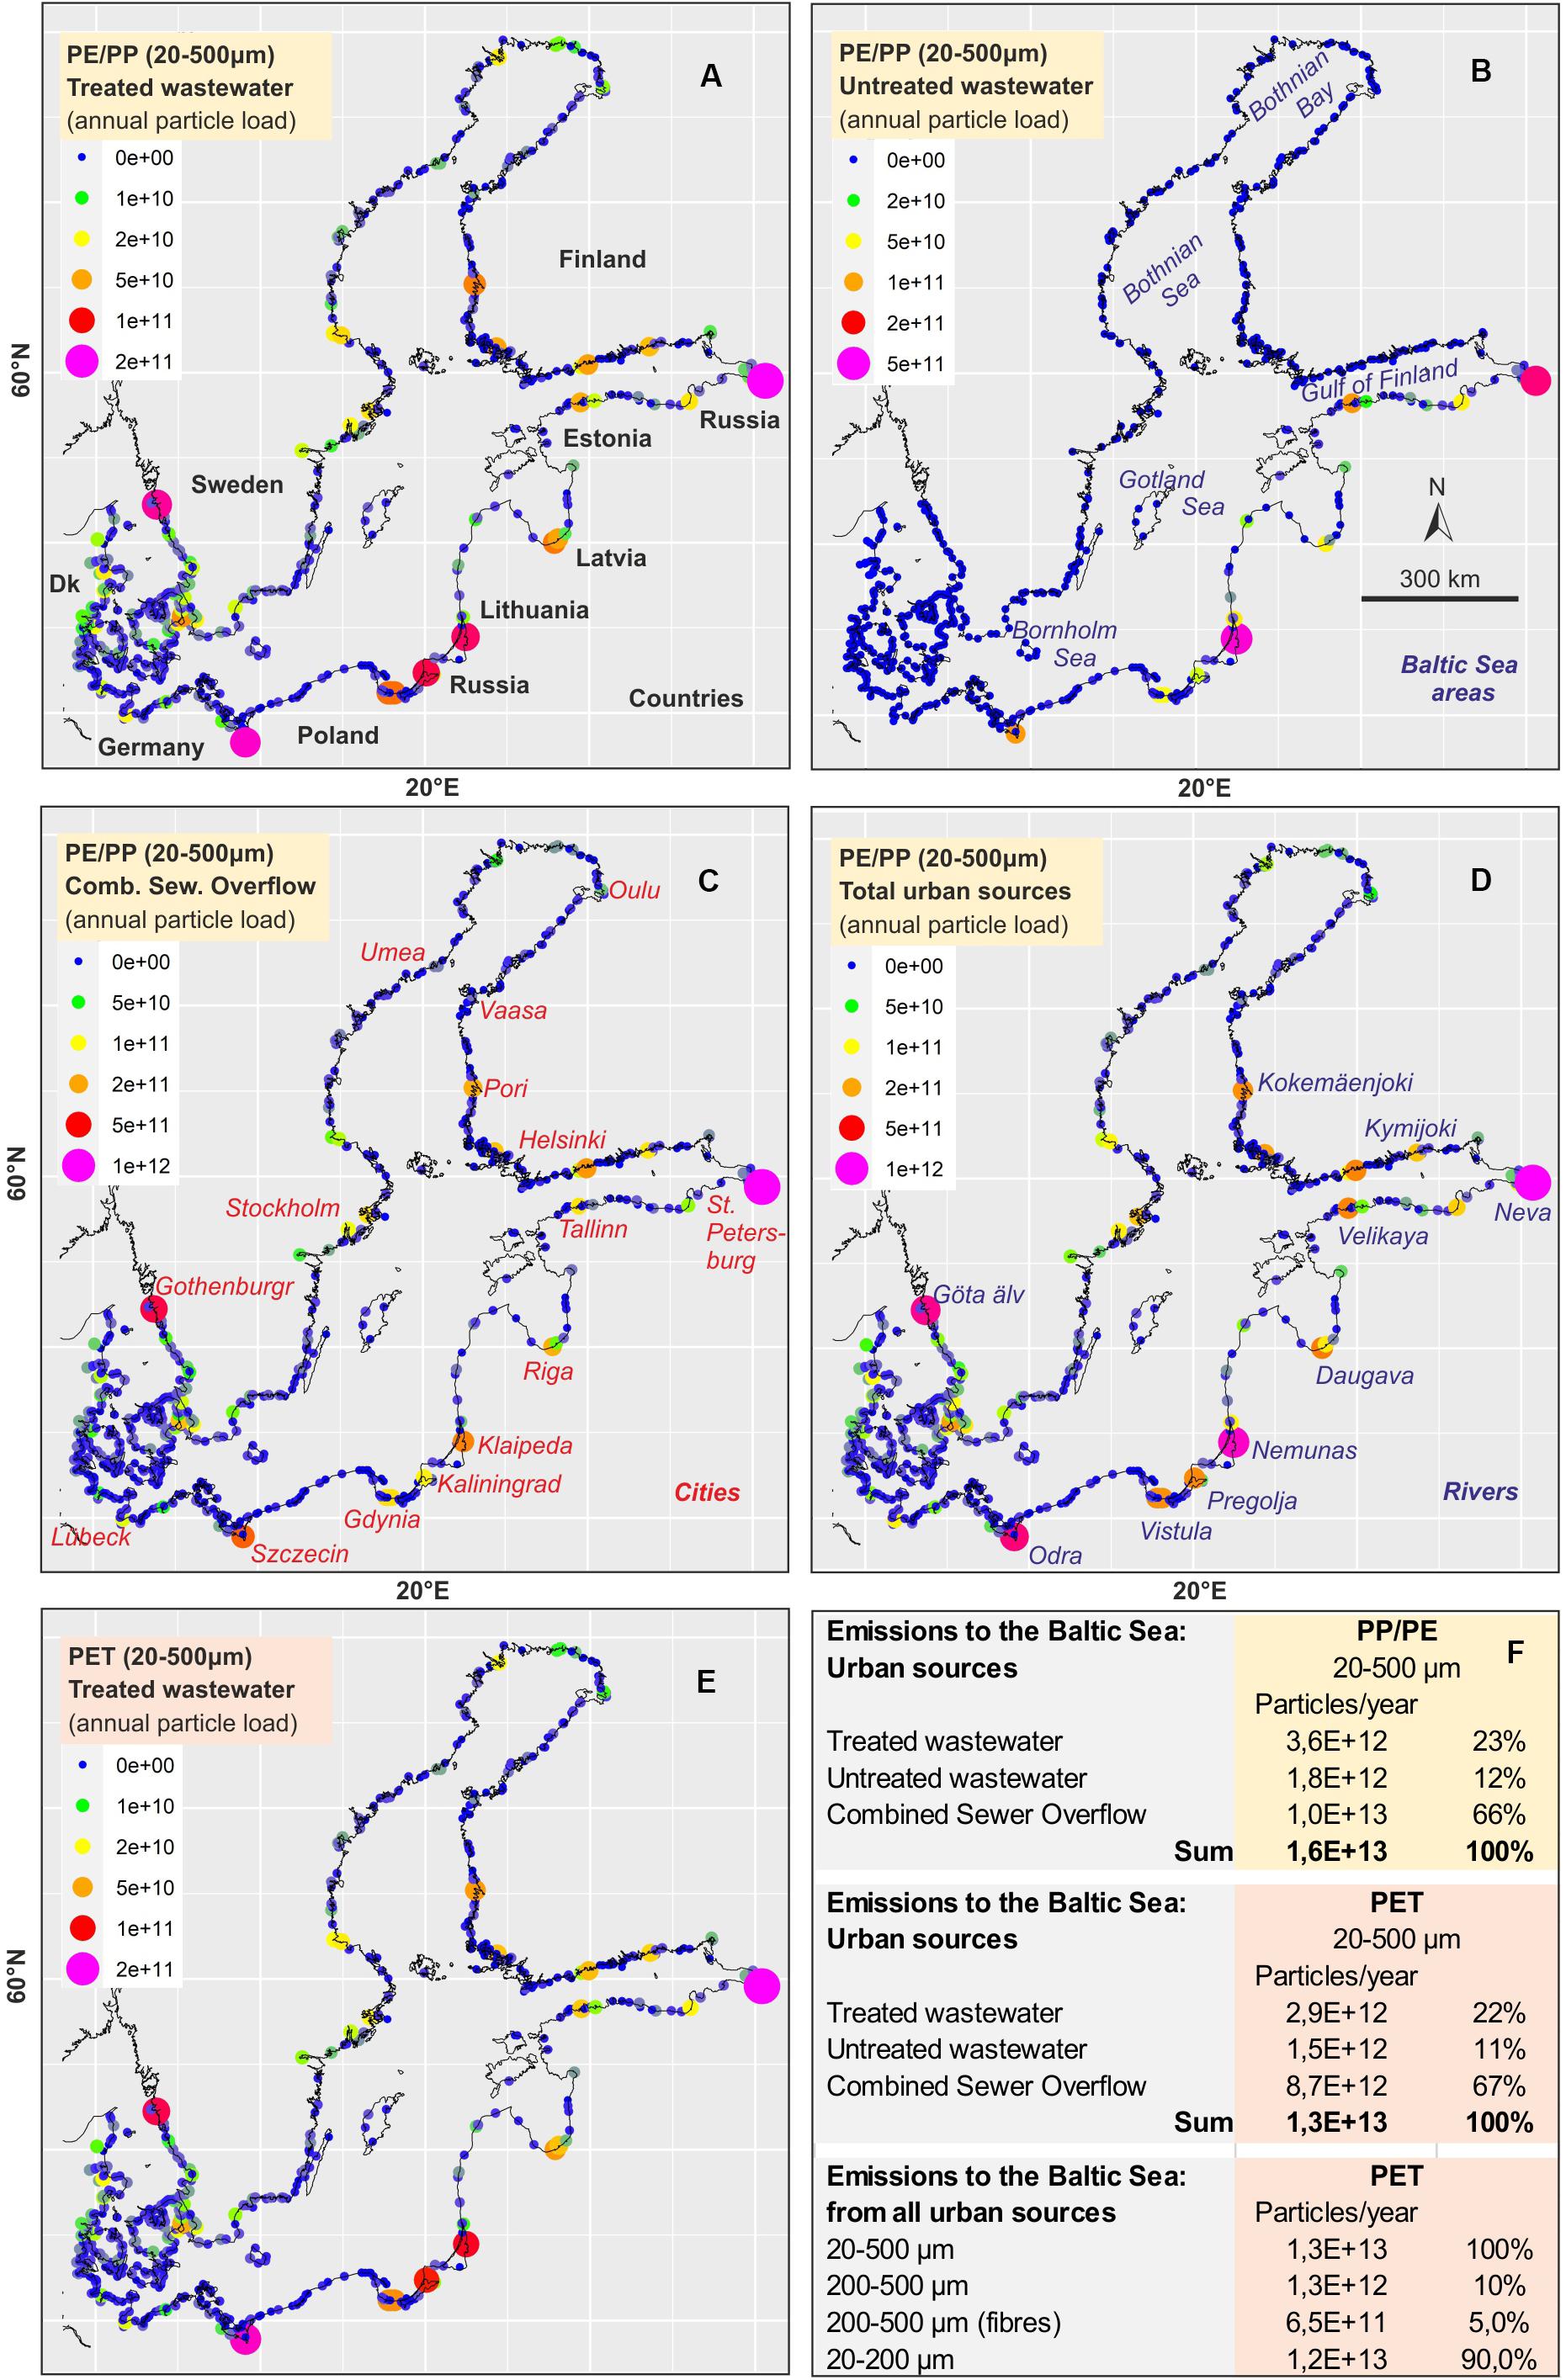
Figure 2. Emissions of Polyethylene (PE)/Polypropylene (PP) and Polyethylenterephthalat (PET) microplastic particles (20–500 μm size fraction) from different urban sources to the Baltic Sea assuming no retention. Treated wastewater covers emissions from effluents of wastewater treatment plants (WWTPs; A,E). Untreated wastewater means emissions from populations not connected to WWTPs (B). Emissions from combined sewer overflow systems (CSS), largely untreated, are kept separately (C). Total urban emissions (D) are the sum of WWTPs, untreated wastewater and CSS. Total annual emissions from urban sources to the Baltic Sea (F).
With respect to PET, the emission amounts and pattern are very similar and only exemplary shown for treated wastewater (Figure 2E). Figure 2F provides an overview about the calculated total emitted quantities for each of the urban pathways.
Residence Time and Relevance of Size and Shape
Our model approach suggests, that once a PE/PP microplastic particle enters the Baltic Sea, it stays in average about 14 days in the water column before it is washed ashore (Figure 3A). The residence time is about 1 day longer in summer and autumn as well as about 1 day shorter in spring and winter. This corresponds to the average meteorological conditions during the seasons (stronger wind speeds and more wave action in spring and winter) as well as to the hydrographic conditions (thermal stratification separates surface and bottom waters during summer and autumn).
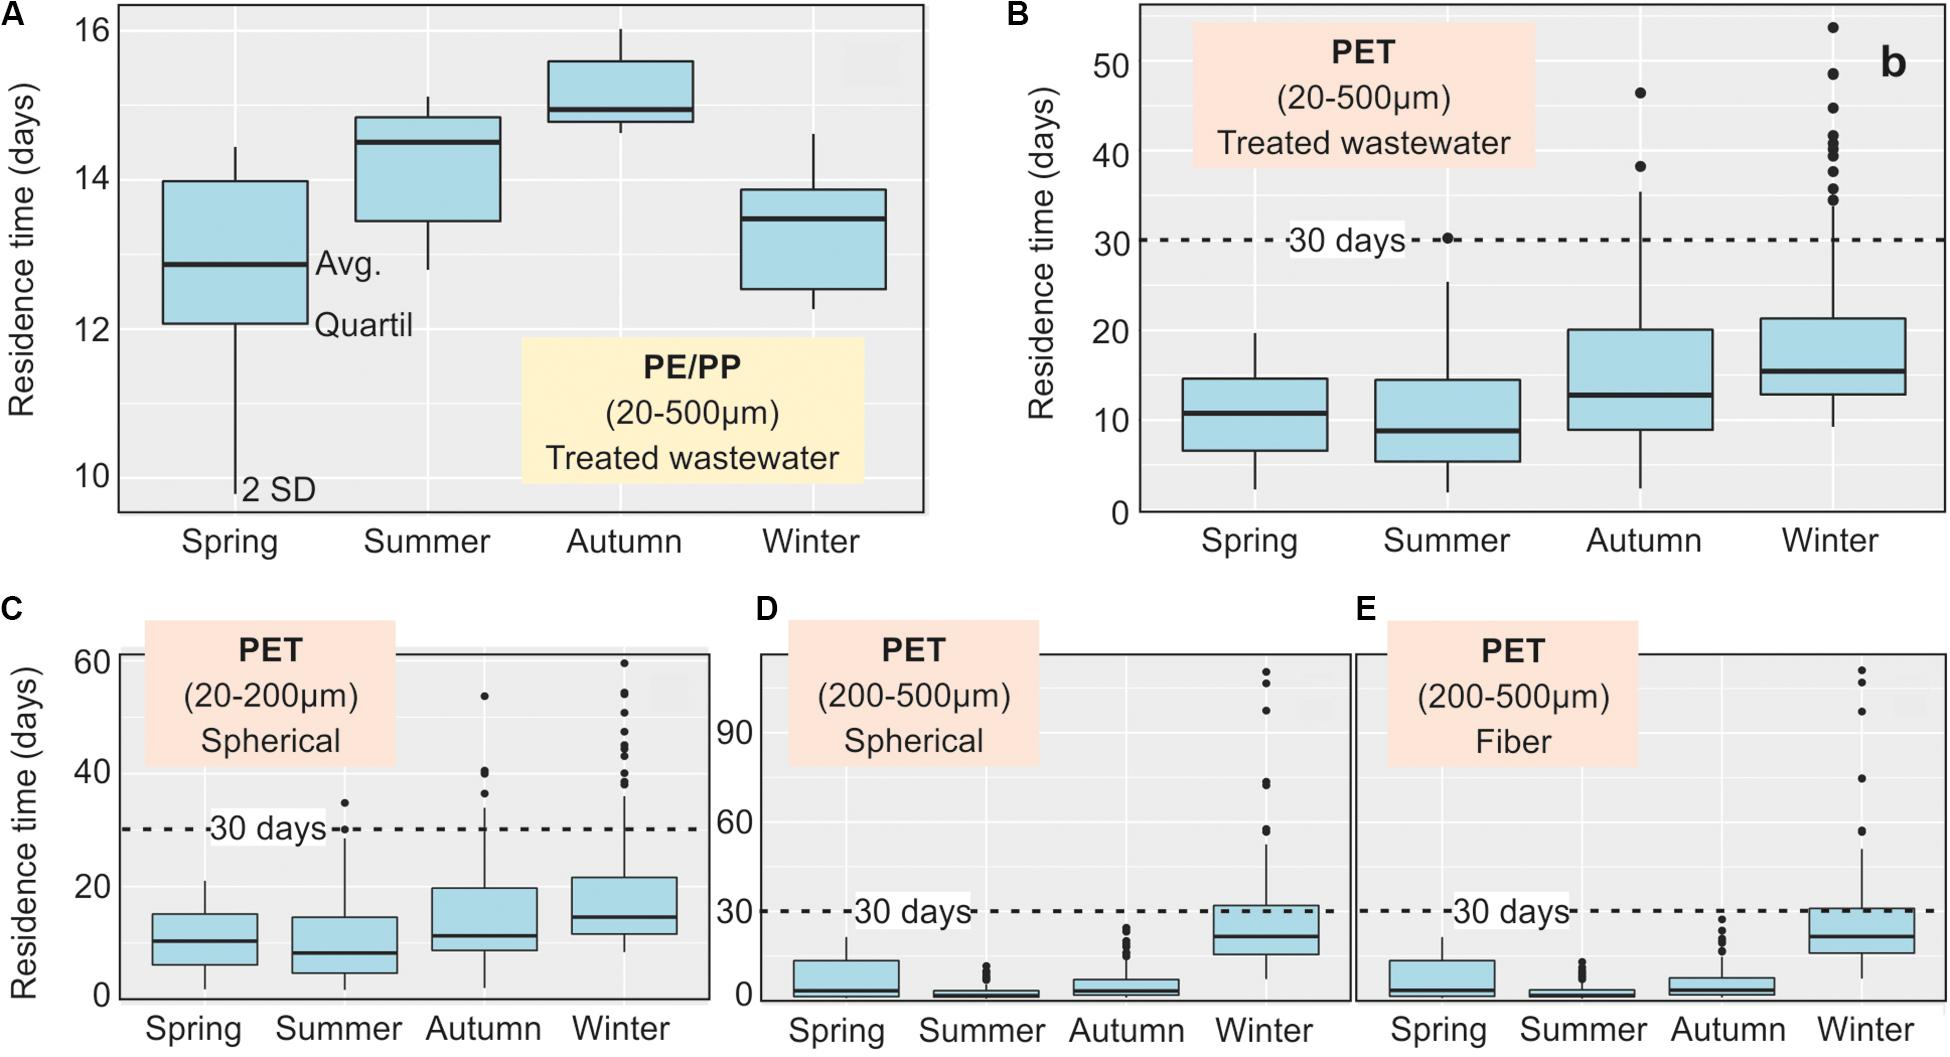
Figure 3. Residence time of Polyethylene (PE)/Polypropylene (PP) and Polyethylenterephthalat (PET) microplastic particles in the Baltic Sea in different meteorological seasons. The results are based on simulations with a 3D hydrodynamic model using meteorological data of the years 2016/2017. PE/PP represents floating and PET sinking plastic. The emissions cover all three urban sources. (A,B) cover the 20–500 μm size fraction; (C) focusses on the small 20–200 μm fraction and (D,E) address the larger fraction (200–500 μm), but separate between spherical and fiber shaped particles. The Box-Plots indicate the median, the upper and lower quartile and 2∗standard deviation as well as extreme values.
While PE/PP is floating, PET has a density of 1.38 g/cm3 and is heavier than water. Despite that it shows a similar average residence time of 13–14 days in the water column (Figure 3B). The coastal Baltic Sea is shallow and turbulence does not allow a settling close to the coast. Only after a transport to deeper waters, a temporary settling at the sediment surface is possible. The sandy sediments of the coastal Baltic Sea do not allow a burial of deposited PET. The seasonality of the residence time is less pronounced, because PET can either be washed ashore or be accumulated at the sea floor. The latter is favored by summerly calm weather conditions. Especially in winter, the residence time can, in rare cases, exceed 50 days. At that time, previously accumulated microplastics at the sea floor is re-suspended and can cause microplastic concentrations in the water column that exceed the 50-fold of the daily emissions. Apart from winter season, the residence time of larger PET particles (200–500 μm) in the water body is, with 3–7 days, much shorter because of a faster deposition at the sea floor. The results do not show a significant difference in residence times between spherical and fiber shaped particles (Figures 3C–E).
Figure 4 gives an insight into the behavior of PET entering the Baltic Sea. The short residence times indicate that only a small share of PET can be found in the water body, smaller (20–200 μm) and larger PET (200–500 μm) differs with respect to their behavior in the sea. While in spring, summer, and autumn about 30% of the smaller fraction are accumulated at the sea bottom, this is true for over 70% of the larger fraction. Over 60% of the small fraction and less than 30% of the large fraction are washed ashore. This pattern changes in winter. Storms cause a resuspension of particles accumulated on the sediment surface and wash them ashore during winter. Smaller particles nearly entirely end-up at the shore, while a share of about 10% of the larger PET particles stays on the sea bottom. It is likely, under our assumptions of a high shoreline-accumulation efficiency, that very heavy storms re-suspend practically all deposited plastic, cause a sediment surface cleaning, temporally high concentrations in the water column and a sub-sequent shoreline pollution.
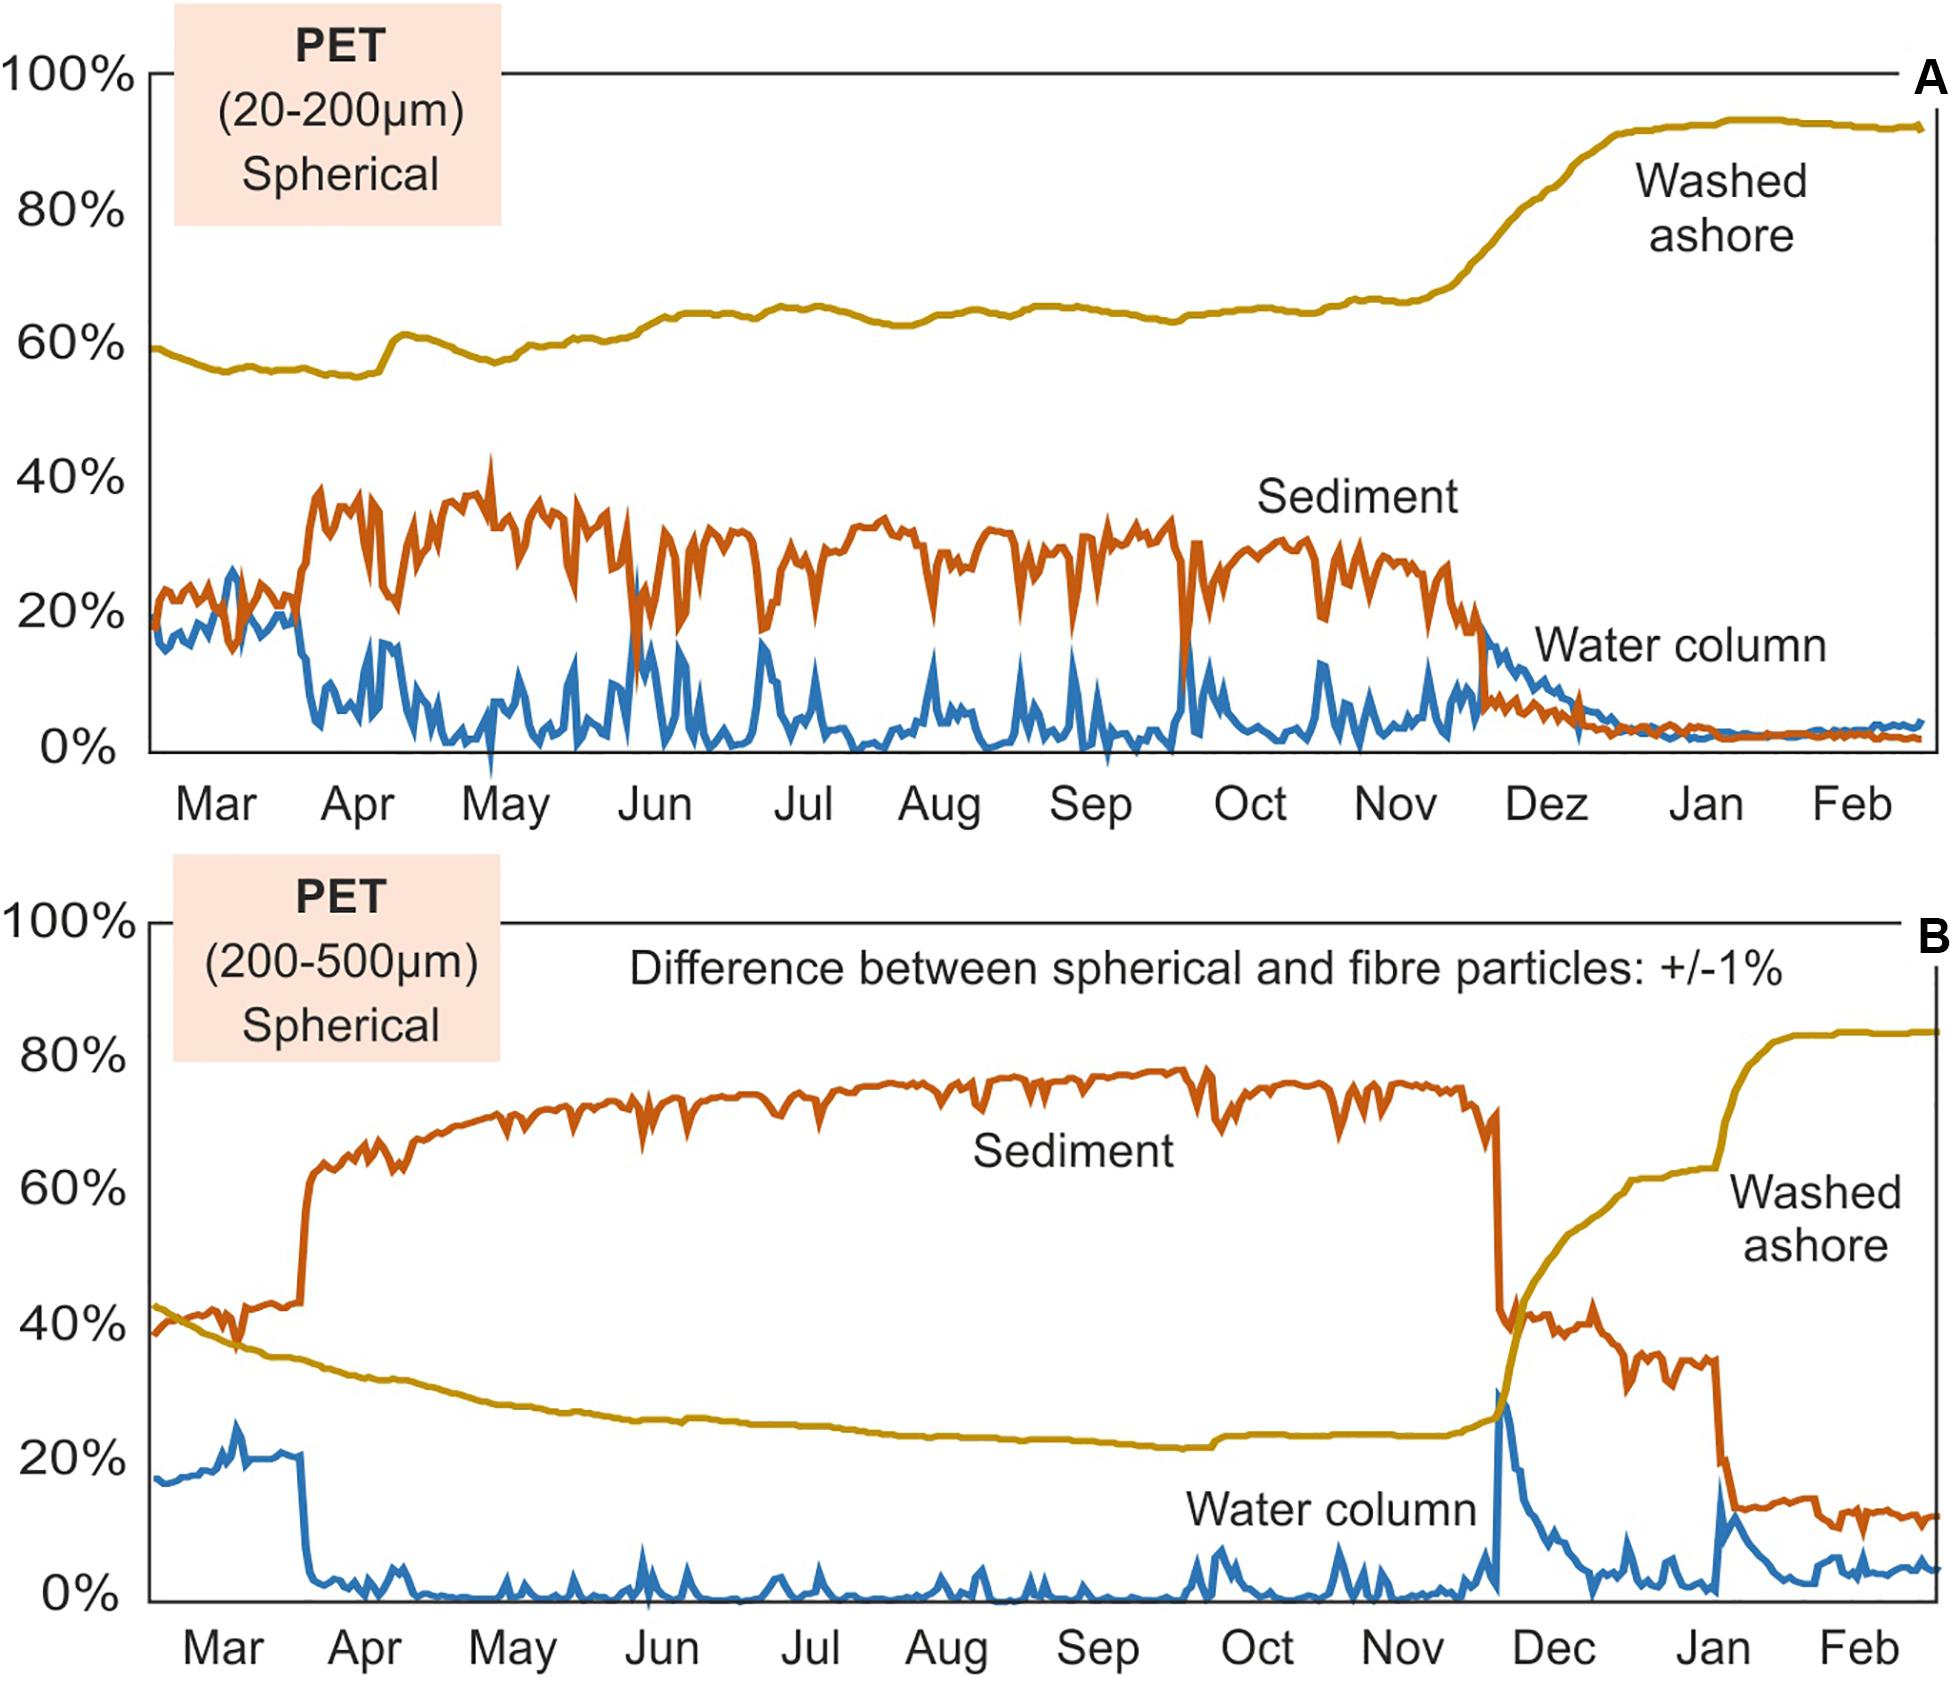
Figure 4. Relative shares of emitted Polyethylenterephthalat (PET) microplastic particles in the water column, on the sediment surface and washed ashore during the course of a year. The results are based on simulations with a 3D hydrodynamic model using meteorological data of the years 2016/2017. The emissions cover all three urban sources and spherical particles of the size fractions (A) 20–500 μm and (B) 200–500 μm.
Our model approach suggests that plastic entering the Baltic Sea does not stay long in the sea. The relatively short residence times of both very different plastic polymers suggests that this is true for other plastic polymers with a comparable density, as well.
Spatial Pattern in Sediments and the Water Column
We focus the spatial model results in terms of the horizontal patterns for the selected particle types. Our 3-D model also provides vertical distributions in the water column, but these are shown in the online supplement for selected stations.
Polyethylene (PE)/PP with its low density is floating and as consequence a certain amount of the emitted particles are distributed all around the Baltic Sea (Figure 5). Our model simulations suggest that there is hardly any area in the Baltic Sea without microplastics pollution. Wind-driven currents spread particles within a few weeks even to central and remote sea regions. However, the highest concentrations are observed near the emission points and in semi-enclosed bays with high emissions and restricted water exchange. The Gulf of Riga is an example for that (Figure 3E). Because of the short residence time of PE/PP particles, already after a few months, the model shows stable conditions, and rough estimates for PE/PP and PET particle concentrations for different sea areas can be provided. The calculated average over the entire Baltic Sea water body is 1.4 PE/PP particles/m2 sea surface during summer. In the central parts of the Gulf of Gdańsk and Gulf of Riga the annual average concentrations are around two PE/PP particles/m2 and in the central Gotland and Arkona Sea as well the Gulf of Finland the concentrations of particles that entered via the investigated pathways are close to 0.5 PE/PP particles/m2 in the water column. The concentrations refer to PE/PP from urban sources only.
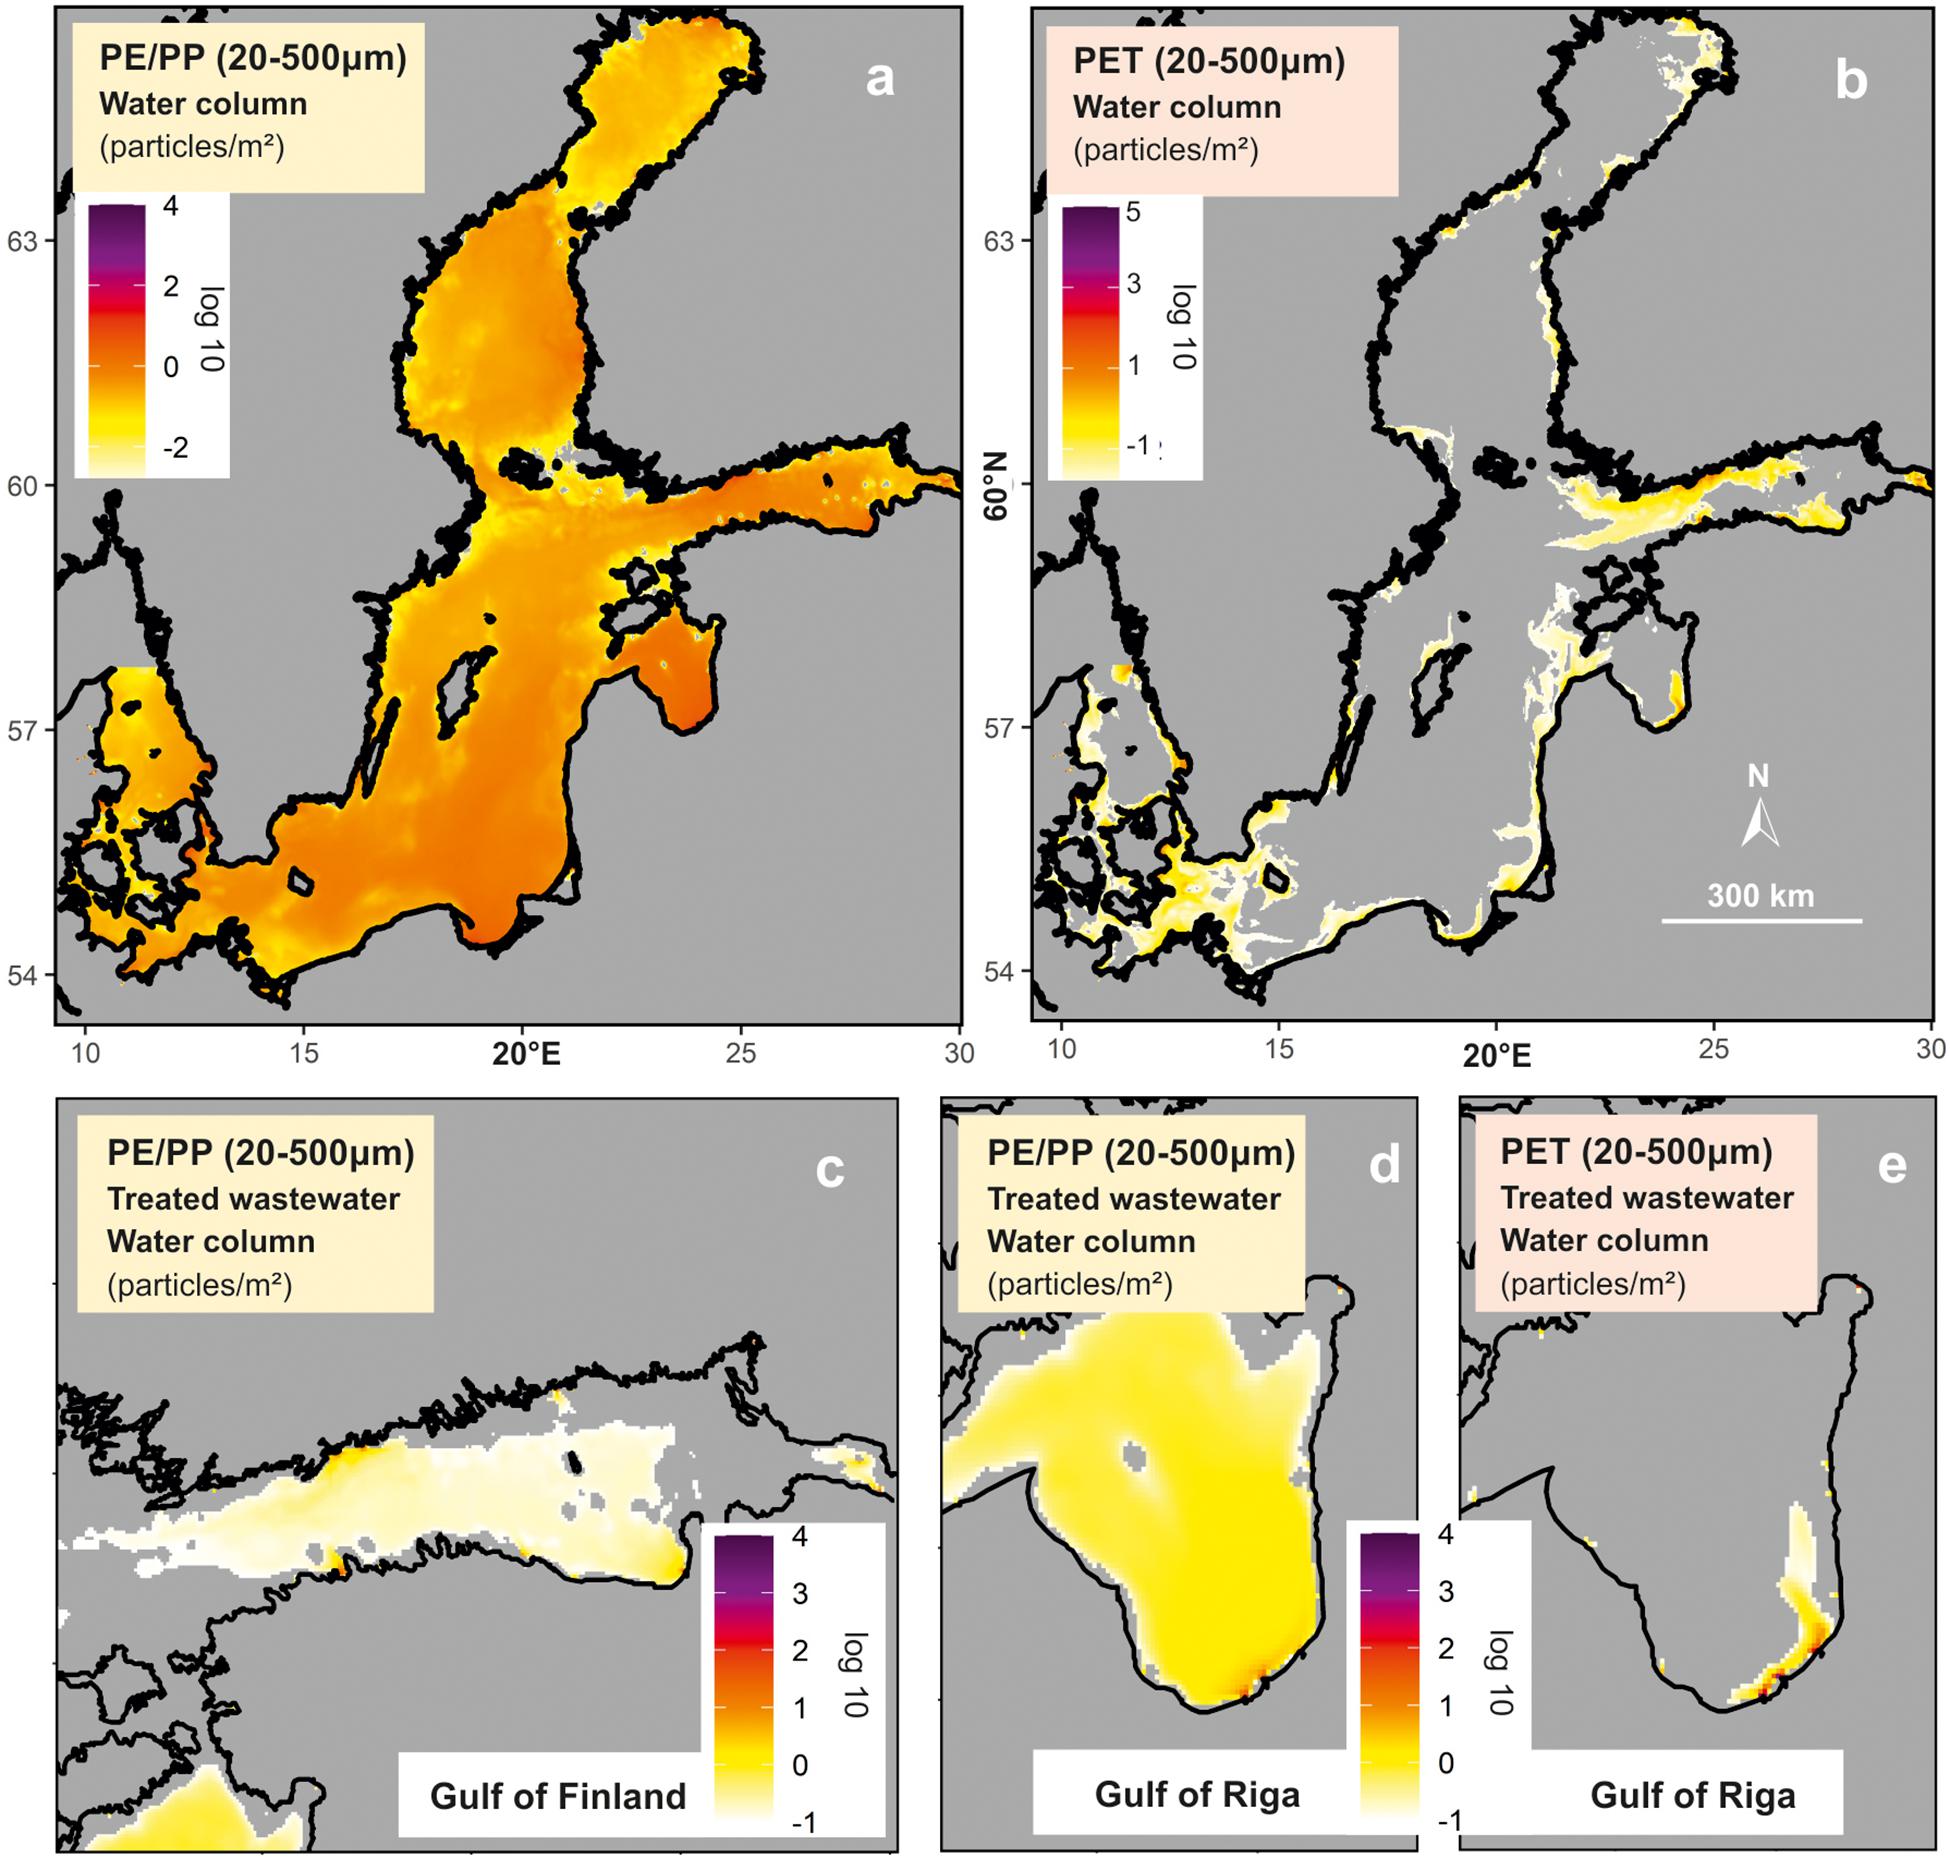
Figure 5. Spatial concentration of Polyethylene (PE)/Polypropylene (PP) (a) and Polyethylenterephthalat (PET) (b) microplastic particles (20–500 μm size fraction) in the water column of the Baltic Sea and in selected sub-basins (c–e) based on simulations with a 3D hydrodynamic model. PE/PP represents floating and PET sinking plastic. The emissions cover all three urban sources. Gray areas in the sea indicate concentration below the color scale.
Polyethylene terephthalate with its higher density behaves differently and emitted particles are sinking soon after entering the sea. As a consequence, PET in the water column is only observed near emission spots and in a near-shore belt around the Baltic Sea. In sheltered areas, such as the Gulf of Riga (Figure 2E), where wind and wave energy and subsequent resuspension is lower, PET is not transported far into the sea but spread with the currents along the coast. The model suggests an average concentration in the Baltic Sea water body of 0.7 PET particles/m2 sea surface in summer. However, in all central sea areas and even in central parts of the Bay of Riga and the Bay of Gdańsk concentrations stay below 0.001 PET particles/m2 sea surface in the annual average.
Polyethylene (PE)/PP is floating, kept in the water column and not accumulated on the sediment surface. PET particles are deposited at the sediment surface soon after entering the sea. As a consequence, PET is accumulated in a coastal water belt around the Baltic Sea. Strong local accumulations especially take place, in sheltered areas, such as the Gulf of Riga (Figure 2E), where wind and wave energy and subsequent resuspension is limited. The model suggests an average concentration in the Baltic Sea water body of nearly four PET particles/m2 sediment surface during summer. In Øresund, the strait between Denmark and Sweden, concentrations above 10–20 PET particles/m2 sediment surface can be expected on annual average (Figures 6a,b).
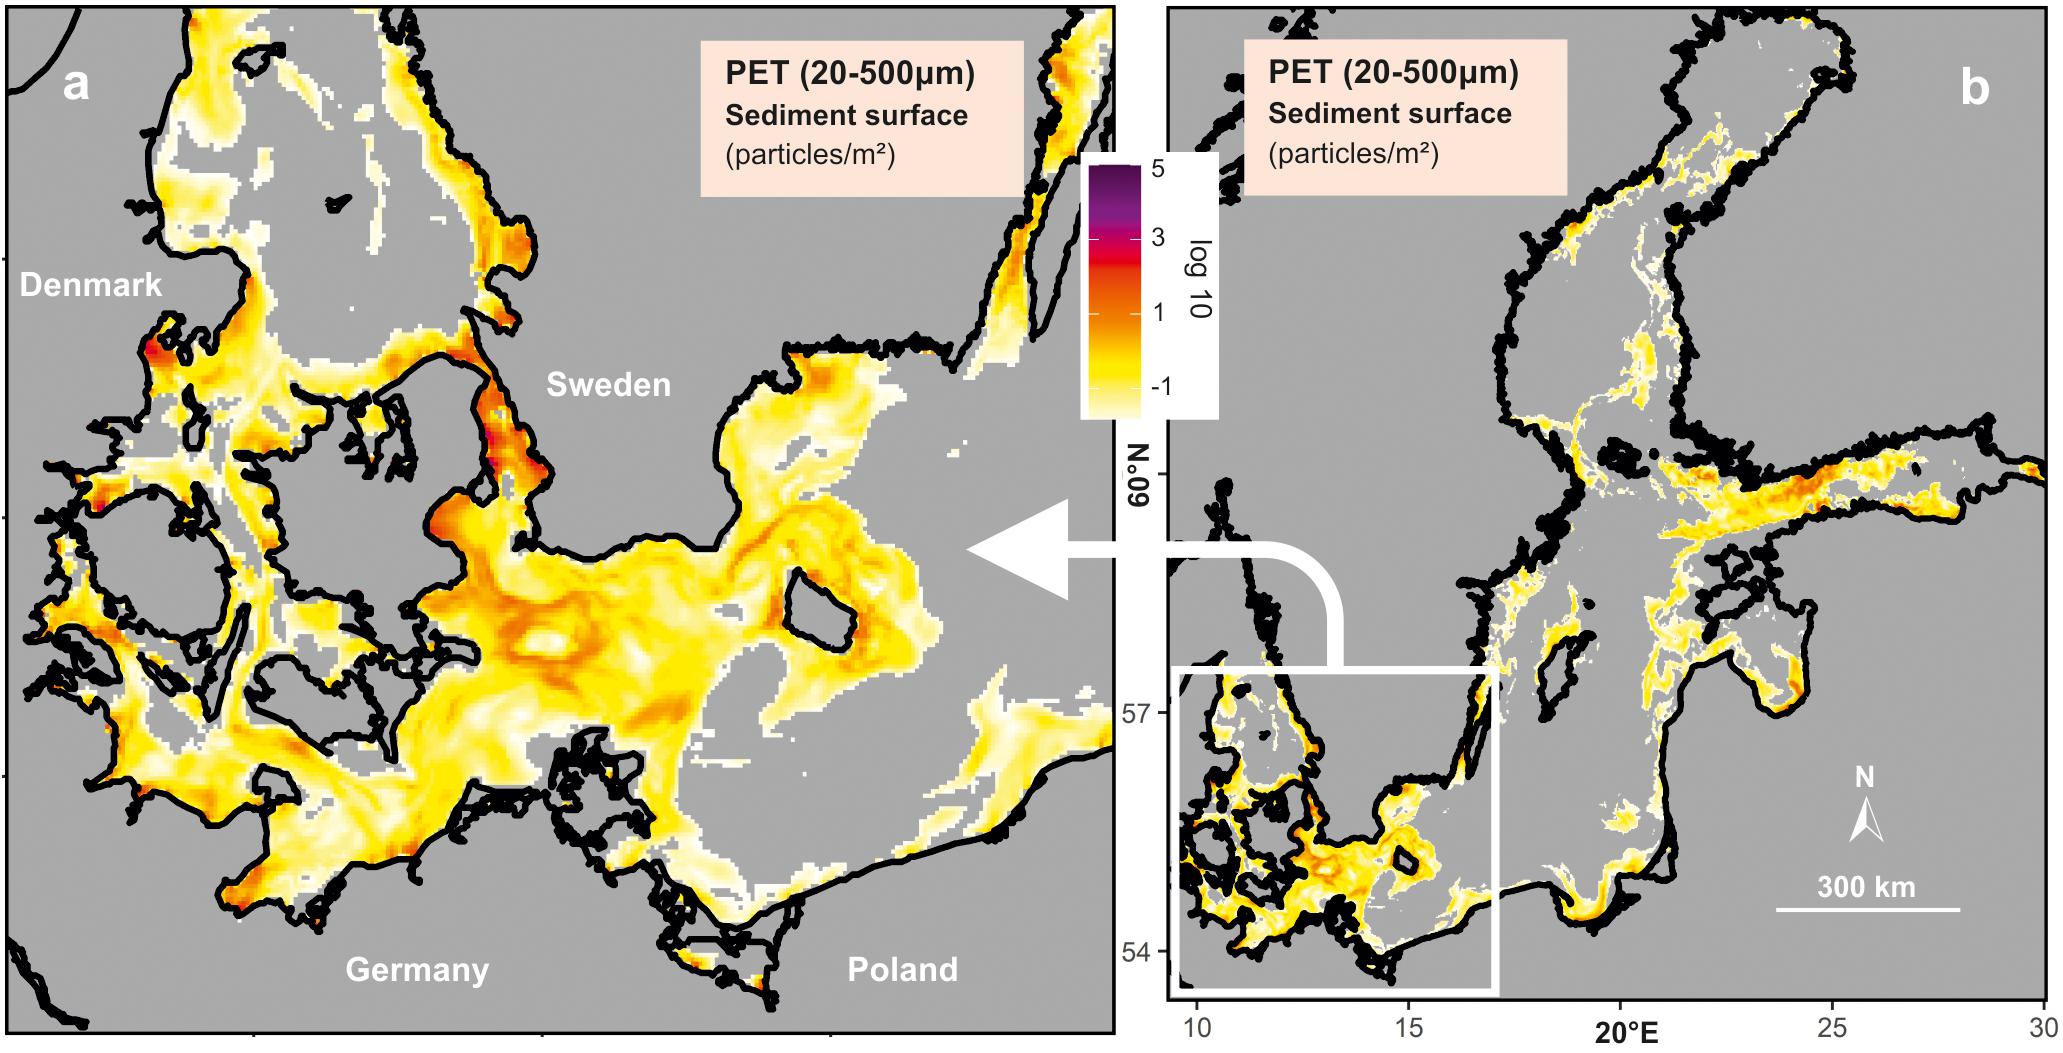
Figure 6. Spatial concentration of Polyethylenterephthalat (PET) microplastic particles (20–500 μm size fraction) at the sediment surface of the Baltic Sea (a) and in the western Baltic Sea (b) based on simulations with a 3D hydrodynamic model. PET represents sinking plastic. The emissions cover all three urban sources. Gray areas in the sea indicate concentrations below 0.01 particles/m2.
Spatial Accumulation Pattern at Shores
The vast majority of emitted PE/PP is washed ashore in the first few kilometers around the emission source (Figure 7). At the coasts around St. Petersburg above 108 particles/m are washed ashore every year according to our model approach. The example of Riga Bay with the river Daugava and the cities Riga and Jūrmala as major emission sources, show annual accumulations up to or slightly above 108 particles/m, as well, but high accumulation rates are limited to a 10 km stretch of coastline (Figure 7B). The mouth of the Odra/Oder river in the Szczecin/Oder Lagoon, the Curonian Lagoon near Klaipeda, the Vistula Lagoon near Kaliningrad, the Gulf of Gdańsk coast as well as fjords near Gothenburg, Stockholm, Helsinki are predicted as other hot-spots with annual accumulations of up to 108 particles/m2 coastline. Our model suggests that few remote sheltered areas in the Bothnian Sea and Bay do not face significant accumulation. For PET, this pattern is even more pronounced and an even higher share is accumulated in the vicinity of the emission sources. The accumulation hot-spots of PET and PE/PP are the same and the annual accumulation numbers are comparable to PE/PP (Figure 7D).
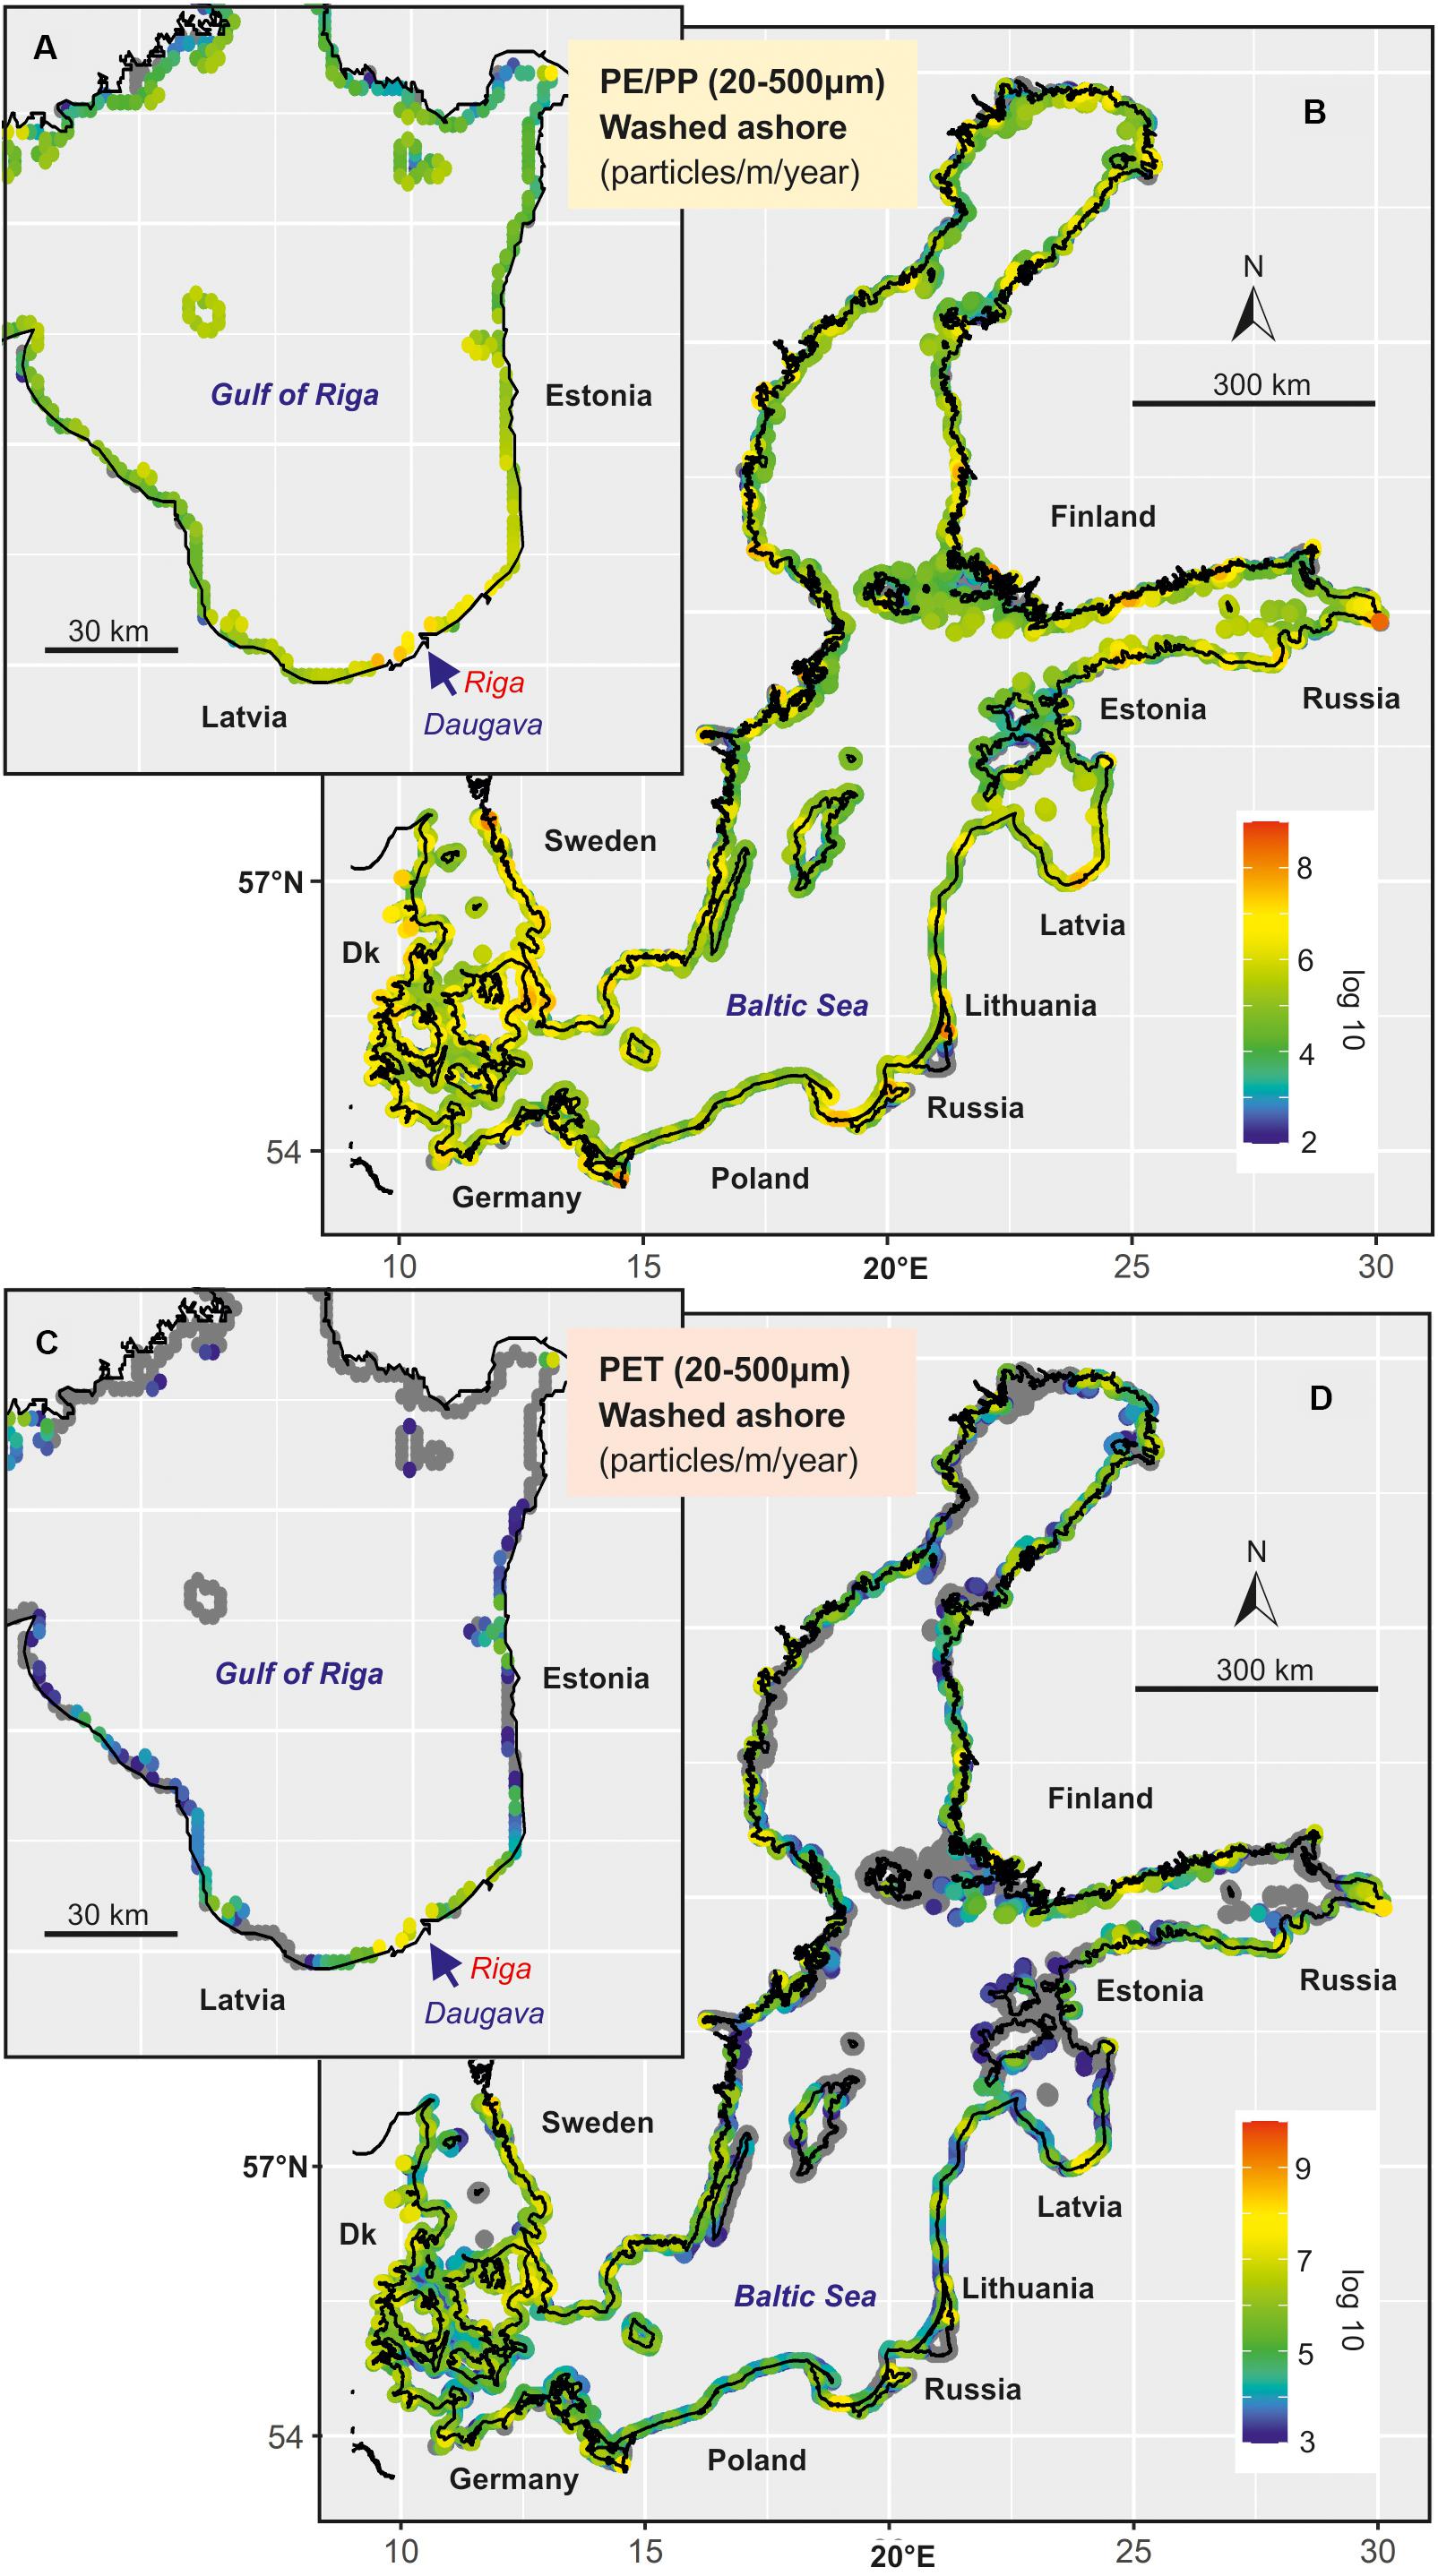
Figure 7. Accumulation of Polyethylene (PE)/Polypropylene (PP) and Polyethylenterephthalat (PET) microplastic particles (20–500 μm size fraction) at shores of the Baltic Sea (B,D) and in the Gulf of Riga (A,C) based on simulations with a 3D hydrodynamic model. PE/PP represents floating and PET sinking plastic. The emissions cover all three urban sources.
In detail, bottom morphometry, coastline structure, shelter, and exposition play a very important role for the accumulation of micro-litter at the coast. As a consequence, a strong spatial patchiness is predicted. The limitations of the model approach and the spatial resolution of one nautical mile do not allow detailed analyses of pollution gradients and small scale pattern in the vicinity of single emission sources. The model suggests very high beach accumulations in nearly closed and semi-closed systems, such as lagoons and fjords. It is very likely that these systems serve as important sinks for microplastics and reduce the pollution of the Baltic Sea. Their ‘cleaning’ efficiency should depend on several factors, and the water exchange rate should be of major importance. However, our present approach does not allow a reliable quantification of this retention.
Realistic Sewer Overflow Emission Pattern
In the previous scenario simulations, emissions from CSS were calculated on an average annual basis. However, it is known that overflow emissions are associated to heavy rain event and that these events are not evenly distributed throughout the seasons of a year. Figure 8A gives an overview about the average monthly spatial distribution of heavy rain events in the Baltic Sea catchment for selected months. Between December and April, the likelihood of heavy rain events is close to zero in the entire Baltic Sea catchment. This likelihood increases in spring until July and August and decreases in autumn again. In the north-western catchment (Germany, Denmark, Sweden), the maritime climate causes a likelihood of heavy rains above 10% in all months between May and November. In contrast, the continental climate in south-eastern countries (Poland, the Baltic States, Belarus, and Russia) is responsible that about 50% all heavy rains of a year take place in July and August. This has consequences on the CSS emissions. Figures 8B,C show the resulting hypothetical monthly emissions of microplastics particles to the Baltic Sea exemplary for May and July. Especially in the south-eastern Baltic, the emissions of PE/PP in July and August from CSS account for up to 50% of the annual CSS emissions. CSS is by far the most important pollution pathway for PE/PP and the same is true for PET, if the assumption of 50% combined treatment of rain- and wastewater is correct. As a consequence, our results suggest that in the south-eastern Baltic, more than 1/3 of the total annual microplastics emissions take place during July and August. Our results are based on several assumptions and simplifications and the results have to be treated with care. However, it is very likely that microplastics emissions show a strong seasonality and that this seasonality differs between the Baltic Sea regions.
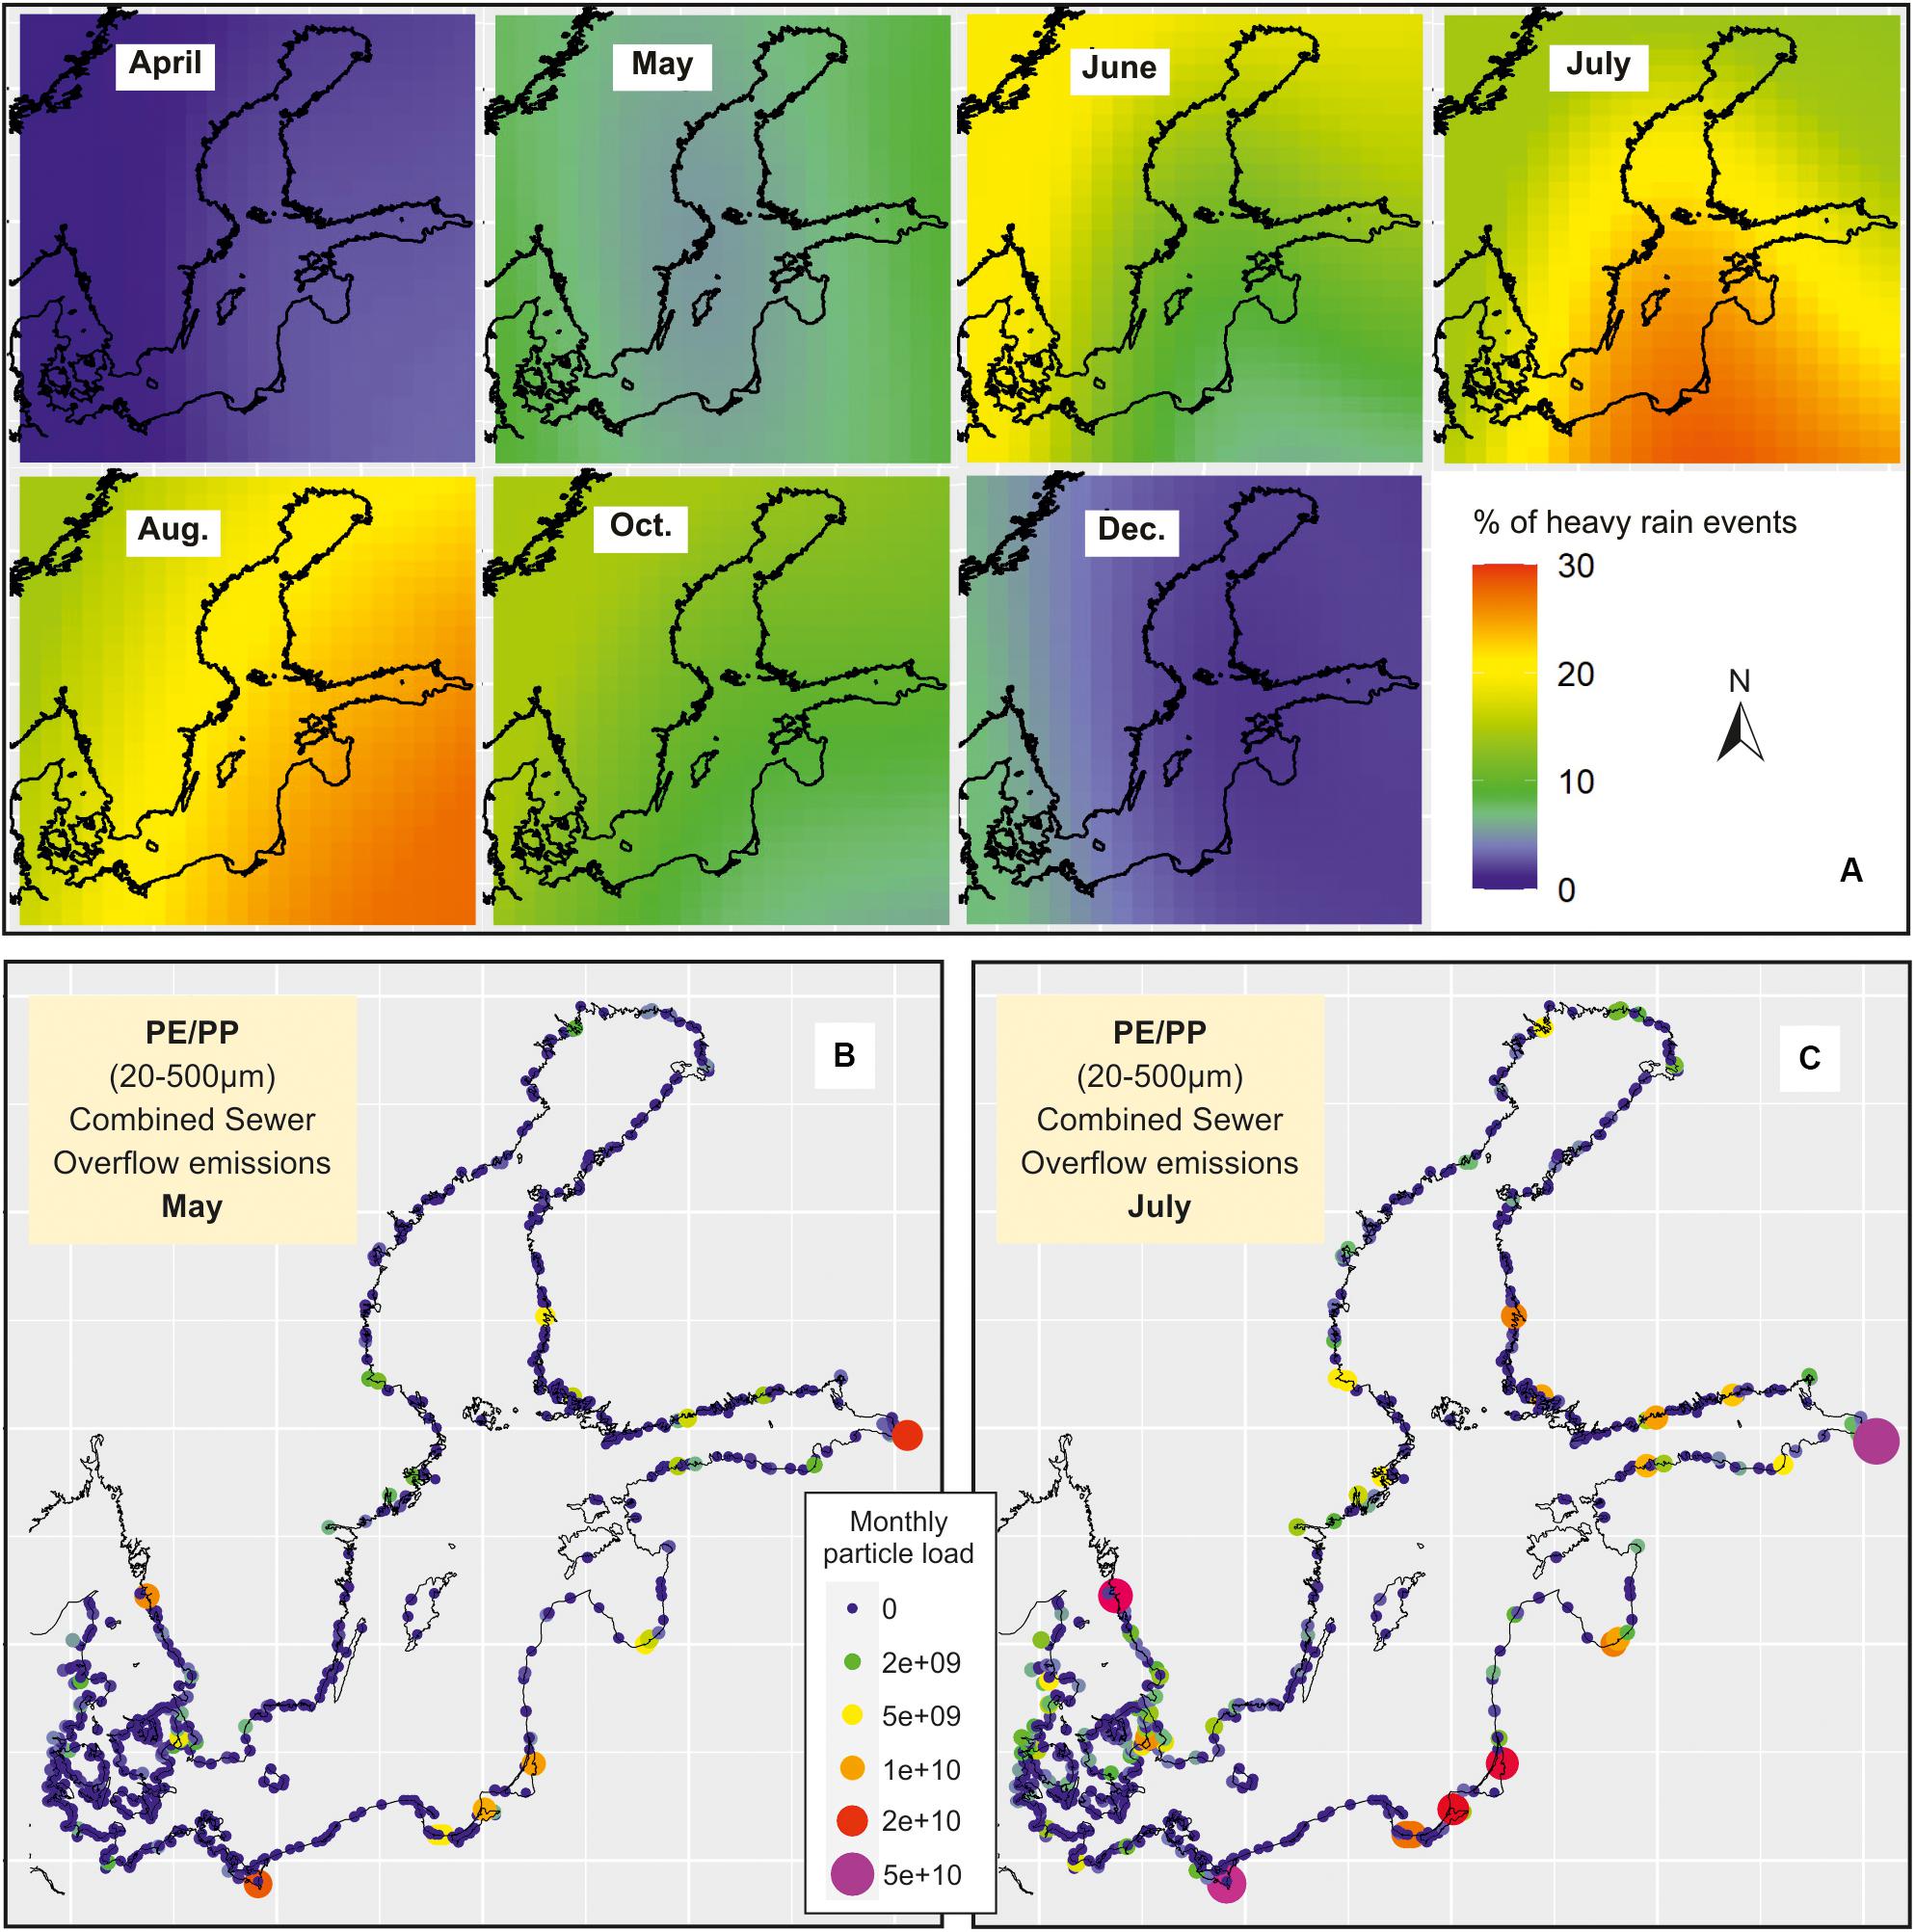
Figure 8. Average monthly spatial distribution of heavy rain events in the Baltic Sea catchment in % of the year (A). Resulting hypothetical monthly emissions of Polyethylene (PE)/Polypropylene (PP) microplastics particles (20–500 μm size fraction) to the Baltic Sea, exemplary shown for May (B) and July (C).
Discussion
Uncertainties and Limitations
We used the present knowledge about location and emissions from WWTPs, CSS systems including stormwater and untreated wastewater (not connected to WWTPs) in the entire Baltic Sea region, estimated the emissions of PET and PE/PP based on a comprehensive literature search and most recent publications and applied an up-to-date 3D model approach. Our approach refines existing microplastics mass emission estimates for the Baltic Sea (Siegfried et al., 2017; Bollmann et al., 2019). However, the uncertainties of our approach are very high. Uncertainties related to the emissions of microplastic from WWTPs, CSS systems, and untreated wastewater are discussed in Baresel and Olshammar (2019). Taking into account the wide range of PP/PE and PET concentrations in raw wastewater found in the literature, the calculated specific emissions can over or underestimate the reality easily by ± one order of magnitude. Talvitie et al. (2015), for example, report extreme values above 600,000 and Simon et al. (2018) even above 7,000,000 microplastics particles/m3 in raw water.
Apart from two simulations, we do not distinguish between fibers, fragments, beads, spheres, flakes, and films. The share between fibers and other fragments is based on literature and uncertain. The same is true with respect to different microplastics size fractions. It is well known, that beside density, shape and size play an important role for the sinking velocity (e.g.,; Kowalski et al., 2016; Kooi and Koelmans, 2019). Waldschläger and Schüttrumpf (2019a; 2019b) provide an overview of data and formulas, which were adapted by us. However, differences in shape and size did not play an important role for the temporal and spatial resolution we used in our model approach. As soon as the behavior of particles within days and transport on a spatial scale of meters are in the research focus, size and shape need to be taken into account. Further we do not assume that during the relatively short transport time of weeks in the environment, plastic particles are significantly modified in their properties (e.g., density changes because of bio-films or aggregation).
Several publications deal with retention in rivers (e.g., Nizzetto et al., 2016; Besseling et al., 2017; Kooi et al., 2018) which depends on particle size, shape and density. Besseling et al. (2017) carried out scenario studies with a hydrological model and conclude that in 40 km river practically all particles [> 100 μm spherical polystyrene (PS)] are kept back. But this study does not cover a long time period and it remains unclear what happens to sedimented plastic particle in river beds during flood events. However, some studies take retention into account in emission calculations (e.g., Siegfried et al., 2017) and in others do not (e.g., van Wijnen et al., 2019). Windsor et al. (2019) state that still little is known about the residence time of plastics in rivers and their role as temporary sinks. Further, our own unpublished data of the Warnow River does not indicate a significant retention. To our mind, field data is still too incomplete and contradicting (e.g., Dikareva and Simon, 2019; Wagner et al., 2019; Schmidt et al., 2020) to enable the calculation of retention rates that can be used in a reliable way in emission calculations on large spatial scales. We assume that degradation during the transport is unlikely and permanent sinks (e.g., lakes and reservoirs) are of minor and/or only temporal relevance. However, the application of a retention factor would affect the amount of emissions and the spatial emission pattern. The calculation of monthly sewer overflow emissions based on the monthly likelihood of heavy rains is a simplified and theoretical approach. It can solely provide a rough impression of the average seasonality of emissions.
Model approaches and simulations always provide a simplified picture of the reality. In general, the spatial transport pattern in the open sea are much more reliable compared to the microplastics accumulation pattern at the coast. The spatial and temporal resolution of the weather input data has, especially during extreme events, significant effects on transport, resuspension and accumulation. We used the best available data, but are aware of the limitations. The model grid with a size of about 1.8 km edge length reflects only a simplified coastline and does not represent the morphometry of smaller structures, such as lagoons and fjords.
Our most simplifying assumption in the model is that particles that enter a grid cell adjacent to land are assumed to be washed ashore immediately. This means that near-shore processes are neglected. It is obvious that the surf-zone physics cannot be dynamically represented in a model with our grid resolution, so the effects of, e.g., wind speed and wave height on the accumulation efficiency are not taken into account in the model. The result might be an overestimation of beach accumulation efficiency and a corresponding underestimation of open-water microplastics concentrations, residence times, and sediment concentrations. To quantify the impact of this simplification on the overall results, future studies should investigate the sensitivity of the model to the chosen beach accumulation rate in dedicated sensitivity experiments. A resuspension from the beach after a previous accumulation is not assumed, but it is known that especially particles with a density above 1 g/cm3 can travel along the coast, before strong wave action causes a permanent burial at the beach. The model assumes that particles can be washed ashore at all kinds of coasts, even the rocky coasts of Scandinavia. Some additional uncertainty is added by the need to translate the number of accumulated particles in the coastal model cell into accumulated particles per meter of coastline, whose length in the model (where it is straight in every single grid cell) may differ from reality.
Representativity
In a global review, Boucher and Friot (2017) assessed the primary microplastics sources in the Oceans and conclude that 98% of the emissions result from land-based activities. Beside tire ware, urban wastewater can be considered as one of the major sources of microplastics (e.g., Dris et al., 2018) world-wide (Boucher and Friot, 2017) and in the Baltic Sea region (Siegfried et al., 2017). It is very likely that our emission scenarios reflect the most important inputs to the Baltic Sea.
A recent study in China (Ly et al., 2019) analyzed raw wastewater and found the following polymer shares: PET (47%), PS (20%), PE (18%), and PP (15%). However, the shares of polymers in wastewater vary in a wide range. An indication which plastic polymers can be expected in the aquatic environment provide the production volumes. PE, PP, PVC, PS, and PET belong to the six most commonly produced polymers worldwide (Vermeiren et al., 2016; Geyer et al., 2017; Kooi et al., 2018). We used PE, PP, and PET as exemplary polymers, because of abundance in the environment and because they cover a density spectrum from around 0.9 to 1.3 g/cm3. We can assume that PET, PE, and PP, and the size-class up to 500 μm, which are considered in our study constitute to over 50% of the total microplastics emissions into the Baltic Sea, when neglecting road runoff (tires).
With respect to the behavior in the marine environment, a differentiation between low and high density PE (0,915–0,97 g/cm3) and PP (0.89–0.92 g/cm3) is not necessary, because it does not affect the spatial pattern and in the water column and coastal accumulation significantly. This is at least true for our spatial model resolution. The results of the polyester PET can be transferred to PVC (1.38 g/cm3), polyvinyl acetate (1.19 g/cm3), polyamide (1.14 g/cm3) as well, because of a comparable density. Our simulations show only minor differences between fibers and spherically shaped particles. However, original polymers and the final processed plastic products often show very different densities and behaviors in the sea. In general, the results give an impression, how other common polymers, such as PS (0.96–1.05 g/cm3) and polyurethane (PU; 1.2 g/cm3) may behave in the marine environment, as well, but these polymers are often used in form of foams with densities below 0.1 g/cm3. For plastic products below a density of about 0.8 g/cm3 our simulations are not representative, because with decreasing density, transport and accumulation is increasingly determined by wind instead of water currents.
Our model approach shows a strong accumulation of microplastics particles around the emissions pathways and in enclosed and semi-encloses coastal waters. Generally, this is well supported by literature. Gewert et al. (2017) found nearly ten times higher abundance of plastics near central Stockholm than in offshore areas. Yonkos et al. (2014) reported the highest microplastics concentrations near densely populated areas of Chesapeake Bay and comparable results exist for other estuaries and lagoons (Vianello et al., 2013; Song et al., 2015; Vermeiren et al., 2016; Blašković et al., 2018; Gray et al., 2018; McEachern et al., 2019). A concrete comparison of our results with field data is problematic, because we restrict ourselves to only three polymers but cover the 20–500 μm particle size class. Field studies often address the size fraction above 333 μm, using a phytoplankton net for sampling, and therefore did not collect the majority of microplastics (Setälä et al., 2016; Tamminga et al., 2018).
Similar to our results, Pedrotti et al. (2016) observed a differentiation between microplastic particles in the Mediterranean Sea, were the floating polymers PE, PP, and polyamides dominated at all distances off-shore and accounted for 86–97% of the total items. The concentration in water bodies vary in wide ranges and reflect the local emissions and the physical situation, such as the water exchange (e.g., Song et al., 2015; McEachern et al., 2019) and can hardly be compared to the Baltic Sea. McEachern et al. (2019) observed higher microplastic concentrations after intense rainfall events in the summer. This indicates the importance of stormwater and supports our results.
Vermeiren et al. (2016) and Wessel et al. (2016) consider beaches as a major sink for microplastic, as well, and burial at beaches as a potential mechanism for long term storage. Claessens et al. (2011) suggests that the depth profile of sediment cores from beaches may even reflect the global plastic production increase. At sandy shorelines in a northern Gulf of Mexico estuary microplastics was abundant and the concentrations were 66–253 times larger than reported for the open ocean (Wessel et al., 2016). A model study by Liubartseva et al. (2016) in the Adriatic reports a relatively short half-life time of microplastics in the sea of 43.7 days with a significant seasonality and considers the shoreline as major sink, too.
A large amount of literature about microplastics in marine sediments exists (e.g., Claessens et al., 2011; Willis et al., 2017; Blašković et al., 2018; Gray et al., 2018; McEachern et al., 2019). Microplastic is found in types of sediments and highest concentrations are observed near populated areas and near emission sources, especially in semi- and enclosed systems (Claessens et al., 2011; Vianello et al., 2013; Gray et al., 2018). Some authors consider the sediments even as major sink for microplastics (Boucher et al., 2019) and suggest that microplastics and fine sediments show similar sinking and accumulation behavior (Vianello et al., 2013). This questioned by other authors. Especially high loads of microplastics fibers on deep seafloor may be largely due to sample contamination (Willis et al., 2017). However, how long microplastics are accumulated on the seafloor depends on hydrodynamic conditions and turbulence. Our results indicate that PET is accumulating over months in shallow coastal waters. In the Baltic, these coastal waters usually show sandy sediments reflecting deep reaching wave induced turbulence and in the coastal Baltic Sea microplastic will hardly be able to accumulate over years.
All our results certainly reflect the specific conditions in the Baltic Sea. The enclosed character does not allow a washout into other seas, its shallowness favors wave-induced resuspension and its long and ragged coastline facilitates fast accumulation at beaches. However, the results are affected by the model approach and several simplifications as well.
Conclusion – Practical Implications
Despite all uncertainties and simplifications, the results allow some practical conclusions and recommendations. The short residence time of PP/PE as well as PET in the Baltic environment of estimated 14 days and the high annual accumulation rates calculated for shores indicate that most microplastics is not transported over long distances but washed ashore soon after the emission. A consequence is that beaches and shores are the major sink for plastic and that the highest pollution takes place close to the emission source. This means that a microplastic monitoring should focus on surface accumulations in the flood zone/tidal seam of beaches and that sampling should take place in the surrounding of emission sources. To catch the spatial gradients, several sampling spots along a beach with increasing distance from the emission source are recommendable.
The model calculates the highest particle accumulations at the shores of semi- or enclosed water bodies, such as fjords, bays, and lagoons. It seems that these systems serve as effective sink and retention unit for microplastics and protect the open Baltic Sea from pollution. To get a better insight into this retention function and capacity a monitoring of these systems is especially recommended.
Our simulations suggest that microplastic particles on the sediment surface stay only for weeks and few months. They are presumably washed ashore after each storm event because of wave-induced resuspension and subsequent accumulation at the coast. A sampling of the water column or the surface or the sediment surface of the coastal sea is less recommendable, because it only reflects concentrations resulting from the most recent emission events and the concentrations largely depend on previous weather conditions as well as resuspension events. Because of hydrodynamic conditions, bottom bathymetry, water depths, and the course of coastline, concentration patterns show a strong spatial variability. From our point of view, single observed concentrations in the water column or on the sediment surface can hardly be regarded as spatially or temporally representative and cannot serve as an indicator for the general state of pollution, at least in the Baltic Sea. This is especially true when additionally taking into account the methodological problems and uncertainties associated to existing field data.
It is well known that nutrients entering the Baltic Sea have a residence time of around 30 years and emission reductions only cause a slow recovery from eutrophication. This is different with respect to microplastics particles. Their short residence time in the Baltic Sea means that concentrations observed in the water body and on sediment surfaces reach a steady state already after a few months. Therefore, microplastics emission reductions would have an immediate positive effect on the pollution of the Baltic Sea. Our simulations suggest that preventing all emissions would result in a practically microplastics unpolluted sea already within 1 year. The coastal areas would contain and absorb the overwhelming majority of the microplastics loads.
Combined sewer overflow systems seems to be not only the most important quantitative urban emission pathway, but seems to have a strong seasonality. The summer months, especially in the south-eastern Baltic Sea seems to be most important with respect to emitted amounts. To efficiently reduce the microplastics load into the Baltic Sea requires measures tackling CSS as a major pathway. High emissions after heavy rain events and subsequent accumulations at nearby beaches call for a complementary event based monitoring. An event-based monitoring is recommended after heavy storms, as well, because a large share, even of heavier particles will be washed ashore. A flood zone beach monitoring after storms will provide a good insight into type and abundance of polymers polluting the Baltic Sea.
The majority of plastic polymers have a density between 0.8 and 1.5 g/cm3. Of course, density, size, and shape do affect their behavior in the Baltic Sea, but on a time-scale of months not too much. Proximity to the emission source appears to be the most important driver for differences in beaching rates for every particle class investigated. This has two implications: A few polymer-types, e.g., PET, PE/PP, can serve as indicators for the state of pollution. If the emissions of other plastic polymers are known, the overall pollution of different parts of aquatic environment can be estimated based on these few indicator polymers because spatial distribution pattern can be calculated based on the model results. If the size of particles, on time-scales of months, does not play a major role, then larger particle can be used as indicators as long as it is known that they originate from the same sources (such as a WWTPs) and the ratio between their emission rates remains stable. The large micro- (1–5 mm) and mesoplastic size fraction (5–25 mm) can be easily monitored in a flood zone and the observed larger polymer types can be determined at relatively low costs. The concentration of these larger particles can potentially be used as indicator for the pollution with microplastic particles of a size below 1 mm. We encourage future studies to look further into the feasibility of using larger plastic particles as pollution indicators.
Data Availability Statement
The original contributions presented in the study are included in the article/Supplementary Material, further inquiries can be directed to the corresponding author.
Author Contributions
GS developed the manuscript concept and the emission scenarios, took care of data analyses, and did the manuscript writing. HR carried out the model simulation and the data processing. RH prepared the input data, carried out a literature analysis, and provided complementary calculations for the model emission scenarios. CB and MO compiled and provided all data about the sewage treatment plants and emission calculations. RO provided the model setup. SO coordinated the overall work within project MicroPoll and contributed comments and proofreading. All authors contributed to the article and approved the submitted version.
Funding
The work was financially supported by the project BONUS MicroPoll (03A0027A) and to a small degree by project MicroCatch (03F0788A) as well as ERA.Net RUS Plus project BalticLitter (01DJ19001), all funded by the German Federal Ministry of Education and Research. BONUS MicroPoll has received funding from BONUS (Art 185) funded jointly from the European Union’s Seventh Programme for research, technological development and demonstration, and from Baltic Sea national funding institutions.
Conflict of Interest
The authors declare that the research was conducted in the absence of any commercial or financial relationships that could be construed as a potential conflict of interest.
Acknowledgments
We like to thank Arunas Balciunas for the technical visualization in Figure 1 and Sarah Piehl for the critical review of the manuscript. The simulations were performed with resources provided by the North-German Supercomputing Alliance (HLRN).
Supplementary Material
The Supplementary Material for this article can be found online at: https://www.frontiersin.org/articles/10.3389/fenvs.2020.579361/full#supplementary-material
FIGURE S1 | Western Baltic: emissions of Polyethylene (PE)/Polypropylene (PP; b) and Polyethylenterephthalat (PET; a) microplastic particles (20–500 μm size fraction) from all urban sources to the Baltic Sea.
FIGURE S2 | Gulf of Finland: emissions of Polyethylene (PE)/Polypropylene (PP; b) and Polyethylenterephthalat (PET; a) microplastic particles (20–500 μm size fraction) from all urban sources to the Baltic Sea.
FIGURE S3 | Gulf of Riga: emissions of Polyethylene (PE)/Polypropylene (PP; b) and Polyethylenterephthalat (PET; a) microplastic particles (20–500 μm size fraction) from all urban sources to the Baltic Sea.
FIGURE S4 | Western Baltic: spatial concentration of Polyethylene (PE)/Polypropylene (PP; b) and Polyethylenterephthalat (PET; a) microplastic particles (20–500 μm size fraction) in the water column of the Baltic Sea. The emissions cover all three urban sources. Gray areas in the sea indicate concentration below the color scale.
FIGURE S5 | Gulf of Finland: spatial concentration of Polyethylene (PE)/Polypropylene (PP; b) and Polyethylenterephthalat (PET; a) microplastic particles (20–500 μm size fraction) in the water column of the Baltic Sea. The emissions cover all three urban sources. Gray areas in the sea indicate concentration below the color scale.
FIGURE S6 | Gulf of Riga: spatial concentration of Polyethylene (PE)/Polypropylene (PP; b) and Polyethylenterephthalat (PET; a) microplastic particles (20–500 μm size fraction) in the water column of the Baltic Sea. The emissions cover all three urban sources. Gray areas in the sea indicate concentration below the color scale.
FIGURE S7 | Spatial concentration of Polyethylenterephthalat (PET) microplastic particles (20–500 mm size fraction) at the sediment surface of the western Baltic Sea (a), the Gulf of Finland (b) and the Gulf of Riga (c) based on simulations with a 3D hydrodynamic model. PET represents sinking plastic. The emissions cover all three urban sources. Gray areas in the sea indicate concentrations below 0.01 particles/m2.
FIGURE S8 | Western Baltic: accumulation of Polyethylene (PE)/Polypropylene (PP; b) and Polyethylenterephthalat (PET; a) microplasticparticles (20–500 μm size fraction) at shores based on simulations with a 3D hydrodynamic model. PE/PP represents floating and PET sinking plastic. The emissions cover all three urban sources.
FIGURE S9 | Gulf of Finland: accumulation of Polyethylene (PE)/Polypropylene (PP; b) and Polyethylenterephthalat (PET; a) microplastic particles (20–500 μm size fraction) at shores based on simulations with a 3D hydrodynamic model. PE/PP represents floating and PET sinking plastic. The emissions cover all three urban sources.
FIGURE S10 | Western Baltic: accumulation of Polyethylene (PE)/Polypropylene (PP; b) and Polyethylenterephthalat (PET; a) microplastic particles (20–500 μm size fraction) at shores based on simulations with a 3D hydrodynamic model. PE/PP represents floating and PET sinking plastic. The emissions cover all three urban sources.
FIGURE S11 | (a) Sinking velocities and critical shear stress: Both sinking velocities and critical shear stresses for microplastics particles depend on viscosity, therefore they vary with temperature. The example shows values for 10°C water temperature. (b) Vertical profiles of MP distribution: The following image shows mean vertical profiles (March 2016–February 2017) for two different types of microplastics for station HELCOM121 (Gulf of Riga, 23.617°E, 57.6167°N) as an example.
Footnotes
References
Baresel, C., and Olshammar, M. (2019). On the importance of sanitary sewer overflow on the total discharge of microplastics from sewage water. J. Environ. Protect. 10, 1105–1118. doi: 10.4236/jep.2019.109065
Besseling, E., Quik, J. T. K., Sun, M., and Koelmans, A. A. (2017). Fate of nano- and microplastic in freshwater systems: a modeling study. ICES J. Mar. Sci. 220, 540–548. doi: 10.1016/j.envpol.2016.10.001
Blašković, A., Guerranti, C., Fastelli, P., Anselmi, S., and Renzi, M. (2018). Plastic levels in sediments closed to Cecina river estuary (Tuscany. Italy). Mar. Pollut. Bull. 135, 105–109. doi: 10.1016/j.marpolbul.2018.07.021
Bollmann, U. E., Simon, M., Vollertsen, J., and Bester, K. (2019). Assessment of input of organic micropollutants and microplastics into the Baltic Sea by urban waters. Mar. Pollut. Bull. 148, 149–155. doi: 10.1016/j.marpolbul.2019.07.014
Boucher, J., Faure, F., Pompini, O., Plummer, Z., Wieser, O., and de Alencastro, L. F. (2019). Plastic fluxes and stocks in Lake Geneva basin. TrAC Trends Anal. Chem. 112, 66–74. doi: 10.1016/j.trac.2018.11.037
Boucher, J., and Friot, D. (2017). Primary Microplastics in the Oceans: A Global Evaluation of Sources. Gland: IUCN, 43. doi: 10.2305/IUCN.CH.2017.01.en
Carr, S. A., Jin, L., and Arnold, G. T. (2016). Transport and fate of microplastic particles in wastewater treatment plants. Water Res. 91, 174–182. doi: 10.1016/j.watres.2016.01.002
Claessens, M., De Meester, S., Van Landuyt, L., De Clerck, K., and Janssen, C. R. (2011). Occurrence and distribution of microplastics in marine sediments along the Belgian coast. Mar. Poll. Bull. 62, 2199–2204. doi: 10.1016/j.marpolbul.2011.06.030
Dikareva, N., and Simon, K. S. (2019). Microplastic pollution in streams spanning an urbanisation gradient. Environ. Pollut. 250, 292–299. doi: 10.1016/j.envpol.2019.03.105
Dris, R., Gasperi, J., and Tassin, B. (2018). “Sources and fate of microplastics in urban areas: a focus on paris megacity,” in Freshwater Microplastics, eds M. Wagner and S. Lambert (Cham: Springer International Publishing), 69–83. doi: 10.1007/978-3-319-61615-5_4
Gatidou, G., Arvaniti, O. S., and Stasinakis, A. S. (2019). Review on the occurrence and fate of microplastics in sewage treatment plants. J. Hazard. Mater. 367, 504–512. doi: 10.1016/j.jhazmat.2018.12.081
GESAMP (2016). “Sources, fate and effects of microplastics in the marine environment: part two of a global assessment,” in (IMO/FAO/UNESCO-IOC/UNIDO/WMO/IAEA/UN/UNEP/UNDP Joint Group of Experts on the Scientific Aspects of Marine Environmental Protection). Rep. Stud. GESAMP No. 93, eds P. J. Kershaw and C. M. Rochman (London: GESAMP), 220.
Gewert, B., Ogonowski, M., Barth, A., and MacLeod, M. (2017). Abundance and composition of near surface microplastics and plastic debris in the Stockholm Archipelago. Baltic Sea. Mar. Pollut. Bull. 120, 292–302. doi: 10.1016/j.marpolbul.2017.04.062
Geyer, R., Jambeck, J. R., and Law, K. L. (2017). Production, use, and fate of all plastics ever made. Sci. Adv. 3:e1700782. doi: 10.1126/sciadv.1700782
Gies, E. A., LeNoble, J. L., Noël, M., Etemadifar, A., Bishay, F., Hall, E. R., et al. (2018). Retention of microplastics in a major secondary wastewater treatment plant in vancouver. Canada. Mar. Pollut. Bull. 133, 553–561. doi: 10.1016/j.marpolbul.2018.06.006
Gray, A. D., Wertz, H., Leads, R. R., and Weinstein, J. E. (2018). Microplastic in two South carolina estuaries: occurrence, distribution, and composition. Mar. Pollut. Bull. 128, 223–233. doi: 10.1016/j.marpolbul.2018.01.030
JRC (2011). Marine Litter - Technical Recommendations for the Implementation of MSFD Requirements. Available at: https://mcc.jrc.ec.europa.eu/documents/201702071118.pdf (accessed June 18, 2020).
Kang, H.-J., Park, H.-J., Kwon, O.-K., Lee, W.-S., Jeong, D.-H., Ju, B.-K., et al. (2018). Occurrence of microplastics in municipal sewage treatment plants: a review. Environ. Health Toxicol. 33:e2018013-0. doi: 10.5620/eht.e2018013
Kay, P., Hiscoe, R., Moberley, I., Bajic, L., and McKenna, N. (2018). Wastewater treatment plants as a source of microplastics in river catchments. Environ. Sci. Pollut. Res. 25, 20264–20267. doi: 10.1007/s11356-018-2070-7
Koelmans, A. A., Nor, N. H. M., Hermsen, E., Kooi, M., Mintenig, S. M., and De France, J. (2019). Microplastics in freshwaters and drinking water: critical review and assessment of data quality. Water Res. 155, 410–422. doi: 10.1016/j.watres.2019.02.054
Kooi, M., Besseling, E., Kroeze, C., van Wezel, A. P., and Koelmans, A. A. (2018). “Modeling the fate and transport of plastic debris in freshwaters: review and guidance,” in Freshwater Microplastics. The Handbook of Environmental Chemistry, Vol. 58, eds Wagner and Lambert (Berlin: Springer open), 125–152. doi: 10.1007/978-3-319-61615-5_7
Kooi, M., and Koelmans, A. A. (2019). Simplifying Microplastic via Continuous Probability Distributions for Size, Shape, and Density. Environ. Sci. Technol. Lett. 6, 551–557. doi: 10.1021/acs.estlett.9b00379
Kowalski, N., Aurelia, M. R., and Joanna, J. W. (2016). “Sinking rates of microplastics and potential implications of their alteration by physical, biological, and chemical factors.”. Mar. Pollut. Bull. 109, 310–319. doi: 10.1016/j.marpolbul.2016.05.064
Lares, M., Ncibi, M. C., Sillanpää, M., and Sillanpää, M. (2018). Occurrence, identification and removal of microplastic particles and fibers in conventional activated sludge process and advanced mbr technology.”. Water Res. 133, 236–246. doi: 10.1016/j.watres.2018.01.049
Liu, F., Olesen, K. B., Borregaard, A. R., and Vollertsen, J. (2019). Microplastics in urban and highway stormwater retention ponds. Sci. Total Environ. 671, 992–1000. doi: 10.1016/j.scitotenv.2019.03.416
Liubartseva, S., Coppini, G., Lecci, R., and Creti, S. (2016). Regional approach to modeling the transport of floating plastic debris in the Adriatic Sea. Mar. Pollut. Bull. 103, 115–127. doi: 10.1016/j.marpolbul.2015.12.031
Long, Z., Pan, Z., Wang, W., Ren, J., Yu, X., Lin, L., et al. (2019). Microplastic abundance, characteristics, and removal in wastewater treatment plants in a Coastal City of China. Water Res. 155, 255–265. doi: 10.1016/j.watres.2019.02.028
Ly, X., Dong, Q., Zuo, Z., Liu, Y., Huang, X., and Wu, W.-M. (2019). Microplastics in a municipal wastewater treatment plant: fate, dynamic distribution, removal efficiencies, and control strategies. J. Cleaner Product. 225, 579–586. doi: 10.1016/j.jclepro.2019.03.321
Magnusson, K., Jörundsdóttir, H., Norén, F., Lloyd, H., Talvitie, J., and Setälä, O. (2016). Microlitter in Sewage Treatment Systems, TemaNord. Copenhagen: Nordic Council of Mini- sters, doi: 10.6027/TN2016-510
McEachern, K., Alegria, H., Kalagher, A. L., Hansen, C., Morrison, S., and Hastings, D. (2019). Microplastics in Tampa Bay, Florida: abundance and variability in estuarine waters and sediments. Mar. Pollut. Bull. 148, 97–106. doi: 10.1016/j.marpolbul.2019.07.068
Mintenig, S. M., Int-Veen, I., Löder, M. G. J., Primpke, S., and Gerdts, G. (2016). Identification of microplastic in effluents of waste water treatment plants using focal plane array-based micro-fourier-transform infrared imaging. Water Res. 108, 365–372. doi: 10.1016/j.watres.2016.11.015
Murphy, F., Ewins, C., Carbonnier, F., and Quinn, B. (2016). Wastewater treatment works (WwTW) as a source of microplastics in the aquatic environment.”. Environ. Sci. Technol. 50, 5800–5808. doi: 10.1021/acs.est.5b05416
Nizzetto, L., Bussi, G., Futter, M. N., Butterfield, D., and Whitehead, P. G. (2016). A theoretical assessment of microplastic transport in river catchments and their retention by soils and river sediments. Environ. Sci. Processes Impacts 18, 1050–1059. doi: 10.1039/c6em00206d
Olesen, K. B., Stephansen, D., van Alst, N., and Vollertsen, J. (2019). Microplastics in a stormwater pond. Water 11:1466. doi: 10.3390/w11071466
Osinski, R. D., and Radtke, H. (2020). Ensemble hindcasting of wind and wave conditions with WRF and Wavewatch III® driven by ERA5. Ocean Sci. 16, 355–371. doi: 10.5194/os-16-355-2020
Osinski, R. D., Enders, K., Gräwe, U., Klingbeil, K., and Radtke, H. (2020). Model uncertainties of a storm and their influence on microplastics / sediment transport in the Baltic Sea. Ocean Sci. Discuss. doi: 10.5194/os-2020-28
Pedrotti, M. L., Petit, S., Elineau, A., Bruzaud, S., Crebassa, J.-C., Dumontet, B., et al. (2016). Changes in the floating plastic pollution of the mediterranean sea in relation to the distance to land. PLoS One 11:e0161581. doi: 10.1371/journal.pone.0161581
Prata, J. C. (2018). Microplastics in wastewater: state of the knowledge on sources. Fate and Solutions. Mar. Pollut. Bull. 129, 262–265. doi: 10.1016/j.marpolbul.2018.02.046
Schmidt, C., Kumar, R., Yang, S., and Büttner, O. (2020). Microplastic particle emission from wastewater treatment plant effluents into river networks in Germany: loads, spatial patterns of concentrations and potential toxicity. Sci. Total Environ. 737:139544. doi: 10.1016/j.scitotenv.2020.139544
Setälä, O., Magnusson, K., Lehtiniemi, M., and Norén, F. (2016). Distribution and abundance of surface water microlitter in the Baltic Sea: a comparison of two sampling methods. Mar. Pollut. Bull. 110, 177–183. doi: 10.1016/j.marpolbul.2016.06.065
Shields, A. R. (1936). “Application of similarity principles and turbulence research to bed-load movement,” in Mitteilungen der Preussischen Versuchsanstalt für Wasserbau und Schiffbau, Vol. 26, Berlin, 5–24.
Siegfried, M., Koelmans, A. A., Besseling, E., and Kroeze, C. (2017). Export of microplastics from land to sea. A modelling approach. Water Res. 127, 249–257. doi: 10.1016/j.watres.2017.10.011
Simon, M., van Alst, N., and Vollertsen, J. (2018). Quantification of microplastic mass and removal rates at wastewater treatment plants applying focal plane array (FPA)-Based fourier transform infrared (FT-IR) imaging. Water Res. 142, 1–9. doi: 10.1016/j.watres.2018.05.019
Song, Y. K., Hong, S. H., Jang, M., Han, G. M., and Shim, W. J. (2015). Occurrence and distribution of microplastics in the sea surface microlayer in Jinhae Bay. South Korea. Arch. Environ. Contam. Toxicol. 69, 279–287. doi: 10.1007/s00244-015-0209-9
Sun, J., Dai, X., Wang, Q., van Loosdrecht, M. C. M., and Ni, B.-J. (2019). Microplastics in wastewater treatment plants: detection, occurrence and removal. Water Res. 152, 21–37. doi: 10.1016/j.watres.2018.12.050
Talvitie, J., Heinonen, M., Pääkkönen, J.-P., Vahtera, E., Mikola, A., Setälä, O., et al. (2015). Do wastewater treatment plants act as a potential point source of microplastics? preliminary study in the Coastal Gulf of Finland, Baltic Sea. Water Sci. Technol. 72, 1495–1504. doi: 10.2166/wst.2015.360
Talvitie, J., Mikola, A., Koistinen, A., and Setälä, O. (2017). Solutions to microplastic pollution - removal of microplastics from wastewater effluent with advanced wastewater treatment technologies. Water Res. 123, 401–407. doi: 10.1016/j.watres.2017.07.005
Tamminga, M., Hengstmann, E., and Fischer, E. K. (2018). Microplastic analysis in the South Funen Archipelago. Baltic Sea. Mar. Pollut. Bull. 208, 601–608. doi: 10.1016/j.marpolbul.2018.01.066
van Wijnen, J., Ragas, A. M. J., and Kroeze, C. (2019). Modelling global river export of microplastics to the marine environment: sources and future trends. Sci. Total Environ. 673, 392–401. doi: 10.1016/j.scitotenv.2019.04.078
Vermeiren, P., Muñoz, C. C., and Ikejima, K. (2016). Sources and sinks of plastic debris in estuaries: a conceptual model integrating biological, physical and chemical distribution mechanisms. Mar. Pollut. Bull. 113, 7–16. doi: 10.1016/j.marpolbul.2016.10.002
Vianello, A., Boldrin, A., Guerriero, P., Moschino, V., Rella, R., Sturaro, A., et al. (2013). Microplastic particles in sediments of Lagoon of Venice, Italy: first observations on occurrence, spatial patterns and identification. Estuar. Coast. Shelf Sci. 130, 54–61. doi: 10.1016/j.ecss.2013.03.022
Wagner, S., Klöckner, P., Stier, B., Römer, M., Seiwert, B., Reemtsma, T., et al. (2019). Relationship between discharge and river plastic concentrations in a Rural and an Urban Catchment. Environ. Sci. Technol. 53, 10082–10091. doi: 10.1021/acs.est.9b03048
Waldschläger, K., and Schüttrumpf, H. (2019a). Effects of particle properties on the settling and rise velocities of microplastics in freshwater under laboratory conditions. Environ. Sci. Technol. 53, 1958–1966. doi: 10.1021/acs.est.8b06794
Waldschläger, K., and Schüttrumpf, H. (2019b). Erosion behavior of different microplastic particles in comparison to natural sediments. Environ. Sci. Technol. 53, 13219–13227. doi: 10.1021/acs.est.9b05394
Wessel, C. C., Lockridge, G. R., Battiste, D., and Cebrian, J. (2016). Abundance and characteristics of microplastics in beach sediments: insights into microplastic accumulation in northern Gulf of Mexico estuaries. Mar. Pollut. Bull. 109, 178–183.
Willis, K. A., Eriksen, R., Wilcox, C., and Hardesty, B. D. (2017). Microplastic distribution at different sediment depths in an Urban Estuary. Front. Mar. Sci. 4:419. doi: 10.3389/fmars.2017.00419
Windsor, F. M., Durance, I., Horton, A. A., Thompson, R. C., Tyler, C. R., and Ormerod, S. J. (2019). A catchment-scale perspective of plastic pollution. Glob. Change Biol. 2019, 1207–1221. doi: 10.1111/gcb.14572
Wolff, S., Kerpen, J., Prediger, J., Barkmann, L., and Müller, L. (2019). Determination of the microplastics emission in the effluent of a municipal waste water treatment plant using raman microspectroscopy. Water Res. 2:100014. doi: 10.1016/j.wroa.2018.100014
Yonkos, L. T., Friedel, E. A., Perez-Reyes, A. C., Ghosal, S., and Arthur, C. D. (2014). Microplastics in four estuarine rivers in the chesapeake bay U.S.A. Env. Sci. Tech. 48, 14195–14202. doi: 10.1021/es5036317
Ziajahromi, S., Neale, P. A., and Leusch, F. D. L. (2016). Wastewater treatment plant effluent as a source of microplastics: review of the fate, chemical interactions and potential risks to aquatic organisms. Water Sci. Technol. 74, 2253–2269. doi: 10.2166/wst.2016.414
Keywords: wastewater treatment plants, stormwater runoff, combined sewer overflow, pollution, hydrodynamic model, monitoring, sedimentation, accumulation
Citation: Schernewski G, Radtke H, Hauk R, Baresel C, Olshammar M, Osinski R and Oberbeckmann S (2020) Transport and Behavior of Microplastics Emissions From Urban Sources in the Baltic Sea. Front. Environ. Sci. 8:579361. doi: 10.3389/fenvs.2020.579361
Received: 02 July 2020; Accepted: 24 August 2020;
Published: 19 October 2020.
Edited by:
André Ricardo Araújo Lima, Marine and Environmental Sciences Centre (MARE), PortugalReviewed by:
Miguel Angel Morales Maqueda, Newcastle University, United KingdomQing Wang, Yantai Institute of Coastal Zone Research (CAS), China
Copyright © 2020 Schernewski, Radtke, Hauk, Baresel, Olshammar, Osinski and Oberbeckmann. This is an open-access article distributed under the terms of the Creative Commons Attribution License (CC BY). The use, distribution or reproduction in other forums is permitted, provided the original author(s) and the copyright owner(s) are credited and that the original publication in this journal is cited, in accordance with accepted academic practice. No use, distribution or reproduction is permitted which does not comply with these terms.
*Correspondence: Gerald Schernewski, Gerald.schernewski@io-warnemuende.de; schernewski@eucc-d.de