Optimal Design of Virtual Reality Visualization Interface Based on Kansei Engineering Image Space Research

Key Laboratory of Advanced Manufacturing Technology, Ministry of Education, Guizhou University, Guiyang 550025, China
*
Author to whom correspondence should be addressed.
Symmetry 2020, 12(10), 1722; https://doi.org/10.3390/sym12101722
Submission received: 14 September 2020
/
Revised: 5 October 2020
/
Accepted: 12 October 2020
/
Published: 19 October 2020
Abstract
:To effectively organize design elements in virtual reality (VR) scene design and provide evaluation methods for the design process, we built a user image space cognitive model. This involved perceptual engineering methods and optimization of the VR interface. First, we studied the coupling of user cognition and design features in the VR system via the Kansei Engineering (KE) method. The quantitative theory I and KE model regression analysis were used to analyze the design elements of the VR system’s human–computer interaction interface. Combined with the complex network method, we summarized the relationship between design features and analyzed the important design features that affect users’ perceptual imagery. Then, based on the characteristics of machine learning, we used a convolutional neural network (CNN) to predict and analyze the user’s perceptual imagery in the VR system, to provide assistance for the design optimization of the VR system design. Finally, we verified the validity and feasibility of the solution by combining it with the human–machine interface design of the VR system. We conducted a feasibility analysis of the KE model, in which the similarity between the multivariate regression analysis of the VR intention space and the experimental test was approximately 97% and the error was very small; thus, the VR intention space model was well correlated. The Mean Square Error (MSE) of the convolutional neural network (CNN) prediction model was calculated with a measured value of 0.0074, and the MSE value was less than 0.01. The results show that this method can improve the effectiveness and feasibility of the design scheme. Designers use important design feature elements to assist in VR system optimization design and use CNN machine learning methods to predict user image values in VR systems and improve the design efficiency. Facing the same design task requirements in VR system interfaces, the traditional design scheme was compared with the scheme optimized by this method. The results showed that the design scheme optimized by this method better fits the user’s perceptual imagery index, and thus the user’s task operation experience was better.
1. Introduction
The application of virtual reality (VR) has developed substantially in the field of information visualization with the potential advantages of immersive experience. Natural interaction VR systems have a profound correlation with the user’s intention perception [1]. VR systems have the characteristics of imagination, interaction, and immersion, and are widely used in the military, manufacturing, medical, education, and many other fields. However, for a long time, the research on the interactive interface design of the user experience has mainly focused on usability, and few interactive interface designs have taken satisfying users’ hidden emotional demands into consideration. Currently, users are increasingly emphasizing the emotional experience resulting from the interactive interface. The coincidence between the interactive interface design and the user’s perceptual imagery preference has become an important factor to attract users and ensure user stickiness.
In the task context of VR systems, the coupling relationship between multi-channel visual expression of information resources and users’ cognitive needs is an important part of studying the VR system user experience. However, the perceptual cognition of users in the field of VR systems is still not fully understood, and, moreover, the match of the VR system and user image is also challenging in application [2,3]. The operation mode, which is based on the VR digital man–machine interface, is widely used in the field of control systems. Effectively meeting the physiological and psychological needs of users is an important task in the development process.
It is important to optimize the design features of virtual reality according to the users’ physiological and psychological needs. For VR technology, the simulation of the man–machine layout design of a VR system is constrained by man–machine characteristics, such as human physiology, psychology, and cognition [4,5]. According to the needs of users, designers rearrange the combination of design elements to optimize the VR system interface, thus improving user comfort and work efficiency [6].
Shi et al. [7] realized the effective interaction between patients and rehabilitation equipment by VR and proposed an interface to improve the interaction experience and patient interest, and meet users’ rehabilitation needs. Liu et al. [8] and Intraub et al. [9] used statistical analysis methods to establish the cognitive basis of virtual interfaces and investigated whether vision produced greater spatial perception extension than touch in virtual reality space. For the interface visualization measurement and evaluation, Lu et al. [10] demonstrated that the objective discrimination and prediction of the mental load of the cockpit display interface of an aircraft can also be comprehensively adopted in physiological measurement technology with the subjective evaluation and performance evaluation methods.
Yan et al. [11] studied the influence of the user interface layout on users’ psychological load by analyzing the operators in emergency operation procedures of nuclear power plants. In the space field, the visualization method of data analysis should be optimized and set according to the cognitive psychology of users [12,13,14,15,16]. Akyeampong et al. [17] used Task Load Index (NASA-TLX) to evaluate the hydraulic excavator Human Machine Interface (HMI)and proposed an innovative HMI solution that reduced the mental and physical load on the operator. Therefore, as seen in previous studies, when optimizing a VR system, it is necessary to analyze the physiological and psychological needs of users, which can assist designers to build VR system interfaces and scenes with better experiences.
As users’ perceptual cognition is typically implicit, designers are required to identify and analyze users’ needs to design a virtual reality interactive system that meets the users’ cognition and expectations. The Kansei Engineering (KE) method plays an important role in mining users’ perceptual needs in the field of digital interface and user emotional interaction. Using the KE method, scholars combine perceptual cognition with rational analysis, which plays a positive role in the optimal design of product systems and assisting designers to make design decisions. The authors in [18,19] proposed a new ontological engineering method to support perceptual thinking, which formed part of the early discussion on the application of perceptual engineering. The relationship between users and systems can be quickly analyzed by KE; then, the production systems can be optimized and the optimal product matching can be selected. KE can also assist in design decisions [20,21]. The KE system, which is based on rough set probability statistics, can realize the automatic generation of Kansei needs.
Chanyachatchawan [22] optimized the KE system and improved the decision efficiency using fuzzy hierarchy and probability statistics. Hasegawa et al. [23] collected digital physiological data sets through a brain–computer interface, expanding the application of KE in product system configuration and improving the accuracy of design decisions. KE is employed in the acquirement of user satisfaction and product generation [24]. For example, Tama et al. [25] and Chen et al. [26] used the KE and Carnot model to study the relationship between Kansei words and design elements, providing analysis data and text sets for product system optimization. The use of KE also contributes to the optimal design of Color, Material& Finishing (CMF) elements, such as the material color of products [27,28]. Therefore, the KE method can be used in VR system optimization, and the application of the KE method in the VR field can be expanded using the research in this paper.
Because the user’s perceptual cognition is subjective, the combination with rational data analysis can improve the scientific basis and accuracy of the research. Users, designers, and products can be organically combined using the KE method, thus boosting user satisfaction and design efficiency. Wu et al. [29] and Xue et al. [30] proposed a comprehensive decision system for design. The importance of each design element in the system can be quantified based on the user’s perceptions, combined with evaluation and analysis methods, such as fuzzy computing and quantitative analysis. Quan et al. [31] proposed a Kansei engineering-based grey relational analysis and techniques for order preference by similarity to ideal solution (KE-GAR-TOPSIS), which relies on the KE method combined with grey relational analysis and sequential preference. The method of mining information and text from big data promotes the accuracy and objectivity of user perceptual image and evaluation data collection. Chiu et al. [32] developed a case-based online customer review analysis method and extracted customer preferences using the integration of text mining and KE. Based on the correlation analysis of design elements under the implicit requirements of users, the complex network method can provide a better research direction. Gao et al. [33] studied the design elements related to knowledge innovation and green economy behavior using a complex network. Li et al. [34] adopted a complex network in advanced manufacturing systems, thus addressing design element layout problems of the system.
To improve the efficiency of system design based on users’ perceptual cognition, the prediction of users’ perceptual imagery combined with intelligent algorithms has become an important research topic. Su et al. [35] and Li et al. [36] proposed an evaluation structure based on convolutional neural networks to eliminate the differences of individual evaluation criteria in product attributes and improve the evaluation efficiency. Diego [37] developed a modeling method of consumer emotion feedback via a neural network that is suitable for product form design. Therefore, rational data analysis methods should be used to analyze the influence of the combination of different design elements on user perceptual imagery and to explore the correlation of design elements to achieve the purpose of aided design, thus saving the time and cost of preliminary investigation and analysis.
In the above research, there are few in-depth discussions and studies starting from the emotional interaction between users and VR system interfaces. There is also a lack of dynamic feedback mechanisms between resource elements and users’ cognitive imagery, in addition to a shortage of analysis of the relationship between users’ emotional imagery and VR information interfaces. Furthermore, there is little research on applying the prediction characteristics of CNN machine learning to VR system optimization. Therefore, this study adopted a research method that combines the VR system interface with KE to analyze user satisfaction. The KE model was established based on regression analysis to deconstruct the design element features. Then, the key design elements were analyzed, and the user perceptual imagery value was predicted using a CNN, to optimize the design of the VR system interface.
2. Theoretical and Numerical Model
2.1. Theoretical Framework
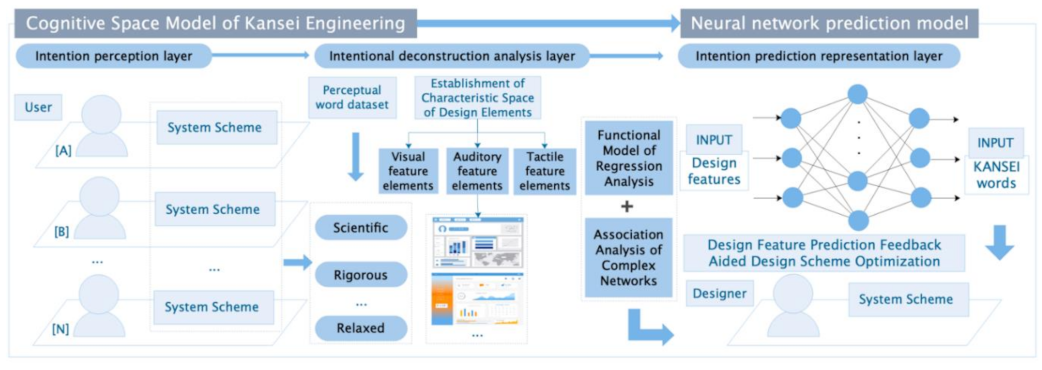
As shown in Figure 1, the research framework of VR interface optimization was performed with four steps, which are based on KE theory.
- (1)
- The mapping space model of the VR system users’ hidden requirements and design features is established. First, the characteristics of the design resources in the VR system and the cognitive behavior of the users in VR system are carefully investigated. Then, the mapping relationship between the explicit coding of the VR system information and the invisible cognition is analyzed. Thereby, the cognitive image resource space of VR system of users can be built. Therefore, the cognitive image resource space of the user’s VR system can be established to establish the foundation for the efficient matching of design element variables and the user’s invisible cognitive needs.
- (2)
- A multi-dimensional correlation model of design elements driven by hidden requirements is established to analyze the importance of different design elements in the VR system. The quantitative theory I is adopted to determine the approximate functional relationship between qualitative project group variables and quantitative benchmark variables. A functional KE model based on regression analysis is established, and the design elements of VR human-computer interaction interface are analyzed. Combining the analysis results with complex network verification, the importance of the VR interface design elements can be analyzed, and the key design element nodes that affect users’ hidden cognition can be obtained, thus assisting designers to accurately design VR systems.
- (3)
- A convolution neural network (CNN), a machine learning method, is used to predict the user image of the VR system interface. The nonlinear expression variable relationship between VR interface design elements and user perceptual cognitive images can be explained based on the characteristics of the neural network. Then, the user’s perceptual imagery can assist in the establishment of the VR system with high-accuracy. The VR system design scheme can be used to predict user satisfaction through machine learning, which can shorten the design time and reduce the design cost on the basis of meeting user needs.
- (4)
- In instance validation, the design elements of the interface are classified according to the attributes. The quantitative analysis of the potential correlation between users’ subjective perception and interface design is conducted, which provides a reference for the VR interface design and evaluation. Then, a data set is collected by experiments, which can predict users’ perception and cognitive needs. Thereby, the guiding opinions are drawn up. The virtual reality system designed by the traditional design method is compared with the optimization method proposed in this paper to verify the effectiveness of the method.
2.2. Kansei Engineering Theory
Visual information presentation based on digital VR system interfaces has been widely used in many fields. Effective information transmission on the basis of meeting users’ hidden needs is an important task faced by designers in the development process. In a VR system, users rely on their sense of sight, hearing, and touch to obtain information of the system operation via the VR interface. Then, quick decisions can be made by the brain, and manipulation signals are transmitted to the system via the motor organs [38]. Therefore, a good adaptation relationship between the user and the virtual display interface of the system is needed. Subjective feelings, such as aesthetics, comprehensibility, and operability of the man–machine interface, are influenced by people’s preferences, knowledge, and experience. A better interaction design should involve the satisfaction of user needs and an effective image of the interface.
Effectively meeting the physiological and psychological needs of users is an important task for designers in the development process. Therefore, mining and analyzing users’ hidden needs can improve the interactions with the VR system interface.
The KE method makes an important contribution in the field of mining users’ perceptual needs. The term “emotional engineering” was first coined by Kenichi Yamamoto in 1986 at the University of Michigan. The central idea is to translate users’ perceptual needs and imagery into quantitative data by analyzing their perceptual imagery. Obtaining perceptual words for the user evaluation of design features plays a decisive role in perceptual engineering research [39,40]. Cong et al. [41] and Wang et al. [42] studied the intelligent service system and captured users’ emotional images using perceptual vocabulary mining. Chiu et al. [43] extracted customer preferences using the integration of text mining and KE, and committed to realizing conceptual data-driven design automation and successfully identified future trends. The focus of KE research is to accurately understand the user’s perception of a product and to establish a link between perception and product design elements.
The general research of KE includes the following steps. First, the collection of typical samples of the interface and screen. Secondly, the collection of perceptual image words. Thirdly, the establishment of a system for evaluating perceptual indicators. Perceptual images are a mixture of users’ preferences, concepts, judgments, and attitudes towards things. In addition, the method of investigation of the relationship between the virtual reality interface and Kansei image is mainly quantitative theory I, which is widely used and practical. Quantitative theory is a branch of multivariate analysis in which quantitative variables are converted into qualitative variables.
The quantitative theory I is used to determine the approximate functional relationship between qualitative project group variables and quantitative benchmark variables, and the dependent variables are predicted by multiple regression analysis and mathematical models. The cognitive space of the perceptual image is constructed using a cognitive experiment of the perceptual image, and the mapping model between interactive interface design variables and the perceptual image is realized using the mathematical model equation method. The effectiveness of the model is further verified by the T-test method. In addition, the correlations between design elements are further analyzed using complex networks, and the network of VR system scenario resource elements is established using complex network theory as a guide. Thus, we analyzed the dynamic changes in the organization structure and interaction between user imagery and design elements.
Therefore, in this paper, we established a relationship model between users’ implicit cognitive needs and VR system design elements, clarified the importance ranking of VR system interface design elements that affect user cognition, and obtained optimization information of aided design. The optimization design of a VR system based on user information mining is realized, thus promoting the optimization design of a VR system to develop in a direction more in line with user cognition.
2.3. Theory of VR Information Interface Prediction Model
To improve the design efficiency of a VR system, machine learning prediction methods can be used to predict whether the design scheme meets the cognitive needs of users and to assist the designer to make more decisions, and improve the design efficiency and the accuracy of the scheme. Convolution neural networks (CNNs) are used to predict the user intention value of the user cognitive intention prediction model of VR interface systems. A convolutional neural network, based on the method of user quantitative evaluation of user usage data, is established and includes the mapping between user perception evaluation and product performance [44,45]. The CNN evaluates the emotional images in user decision making, which is of great significance to improve user satisfaction and design quality [46]. A CNN is an artificial neural network that senses the information features. CNN data processing adopts the method of local connection and sharing weights, obtains information representation from the original data through a pooling layer, and automatically extracts local features of the data, thus establishing feature vectors.
For the process of information in the convolution layer, the convolution processing is:
where is the layer network; is the biased function; is the weight matrix; is the layer output; is the layer input; Mj is the − 1 convolution region of layer j characteristic graph; f(·) is an active function.
The activation function of the CNN is given as:
where xi is the input, xi+1 is the output, β is the multiplicative bias, b is additive bias, xk−1 is the input of the full connection layer, yk is the output of the full connection layer, ωk is the weight coefficient, bk is the additive bias, k is the serial number of the network layer. In the full connection layer, the Softmax activation function is always employed for the multi-classification prediction.
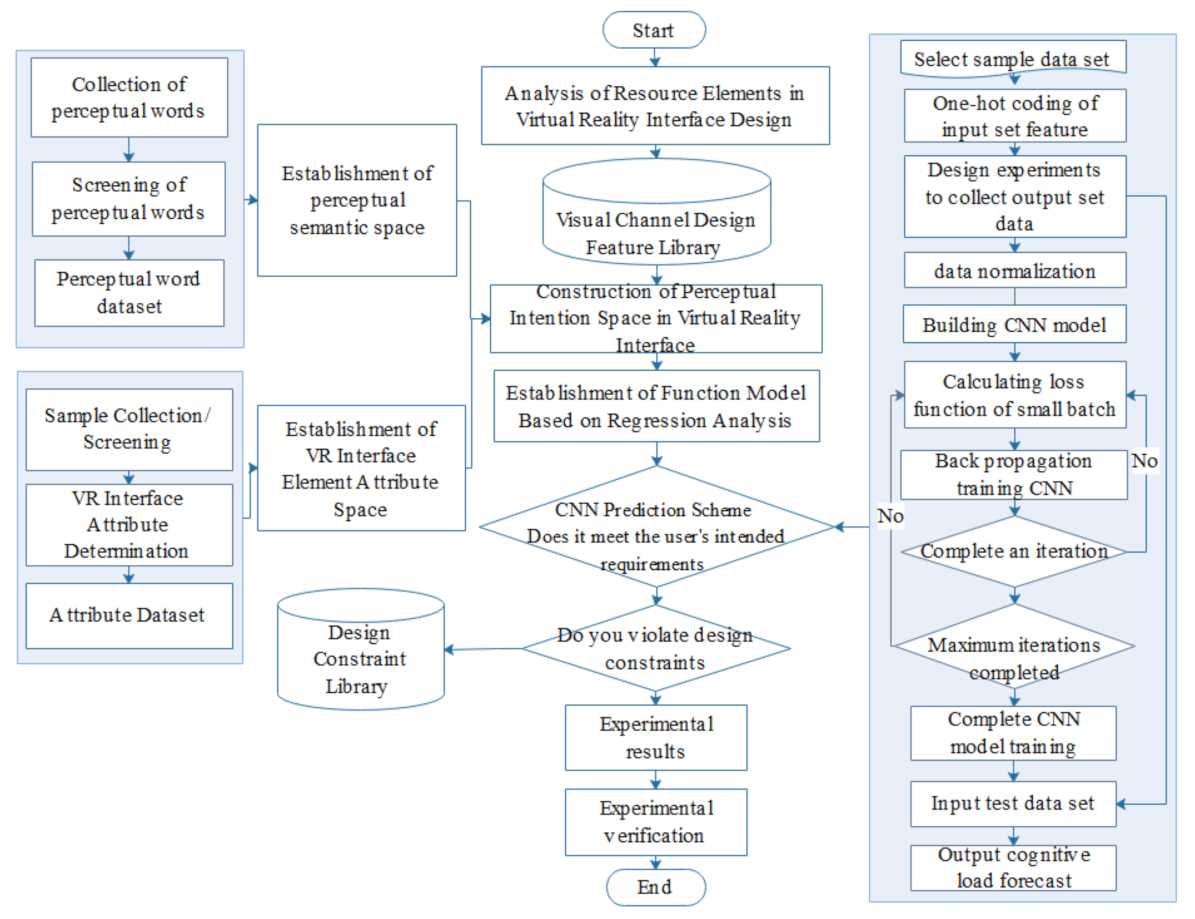
The nonlinear characteristics of a CNN can be applied to the interface design optimization and decision making of VR systems. In Figure 2, the task flow of the predictive model is presented. This task flow processes the interactive selection of resource features and the evaluation of perceptual imagery. The scheme target of the VR system interface works as the input, and then matches and selects the VR interface elements with the perceptual imagery vocabulary. Then, the VR perceptual imagery space is established via KE. According to the model of regression analysis function, a numerical model is established and the important design elements and the knowledge points are analyzed. Combined with complex network analysis and design elements, important design element nodes are obtained to assist designers in the VR system interface design optimization. In addition, the CNN can carefully check whether the built plan meets the cognitive requirements and design principle constraints to help design decisions. Thus, if the design principles are met, the scheme is saved and implemented.
3. Spatial Intention Analysis of VR System Information Interface Based on the KE Method
3.1. Sample Selection and Semantic Selection of VR System Interface
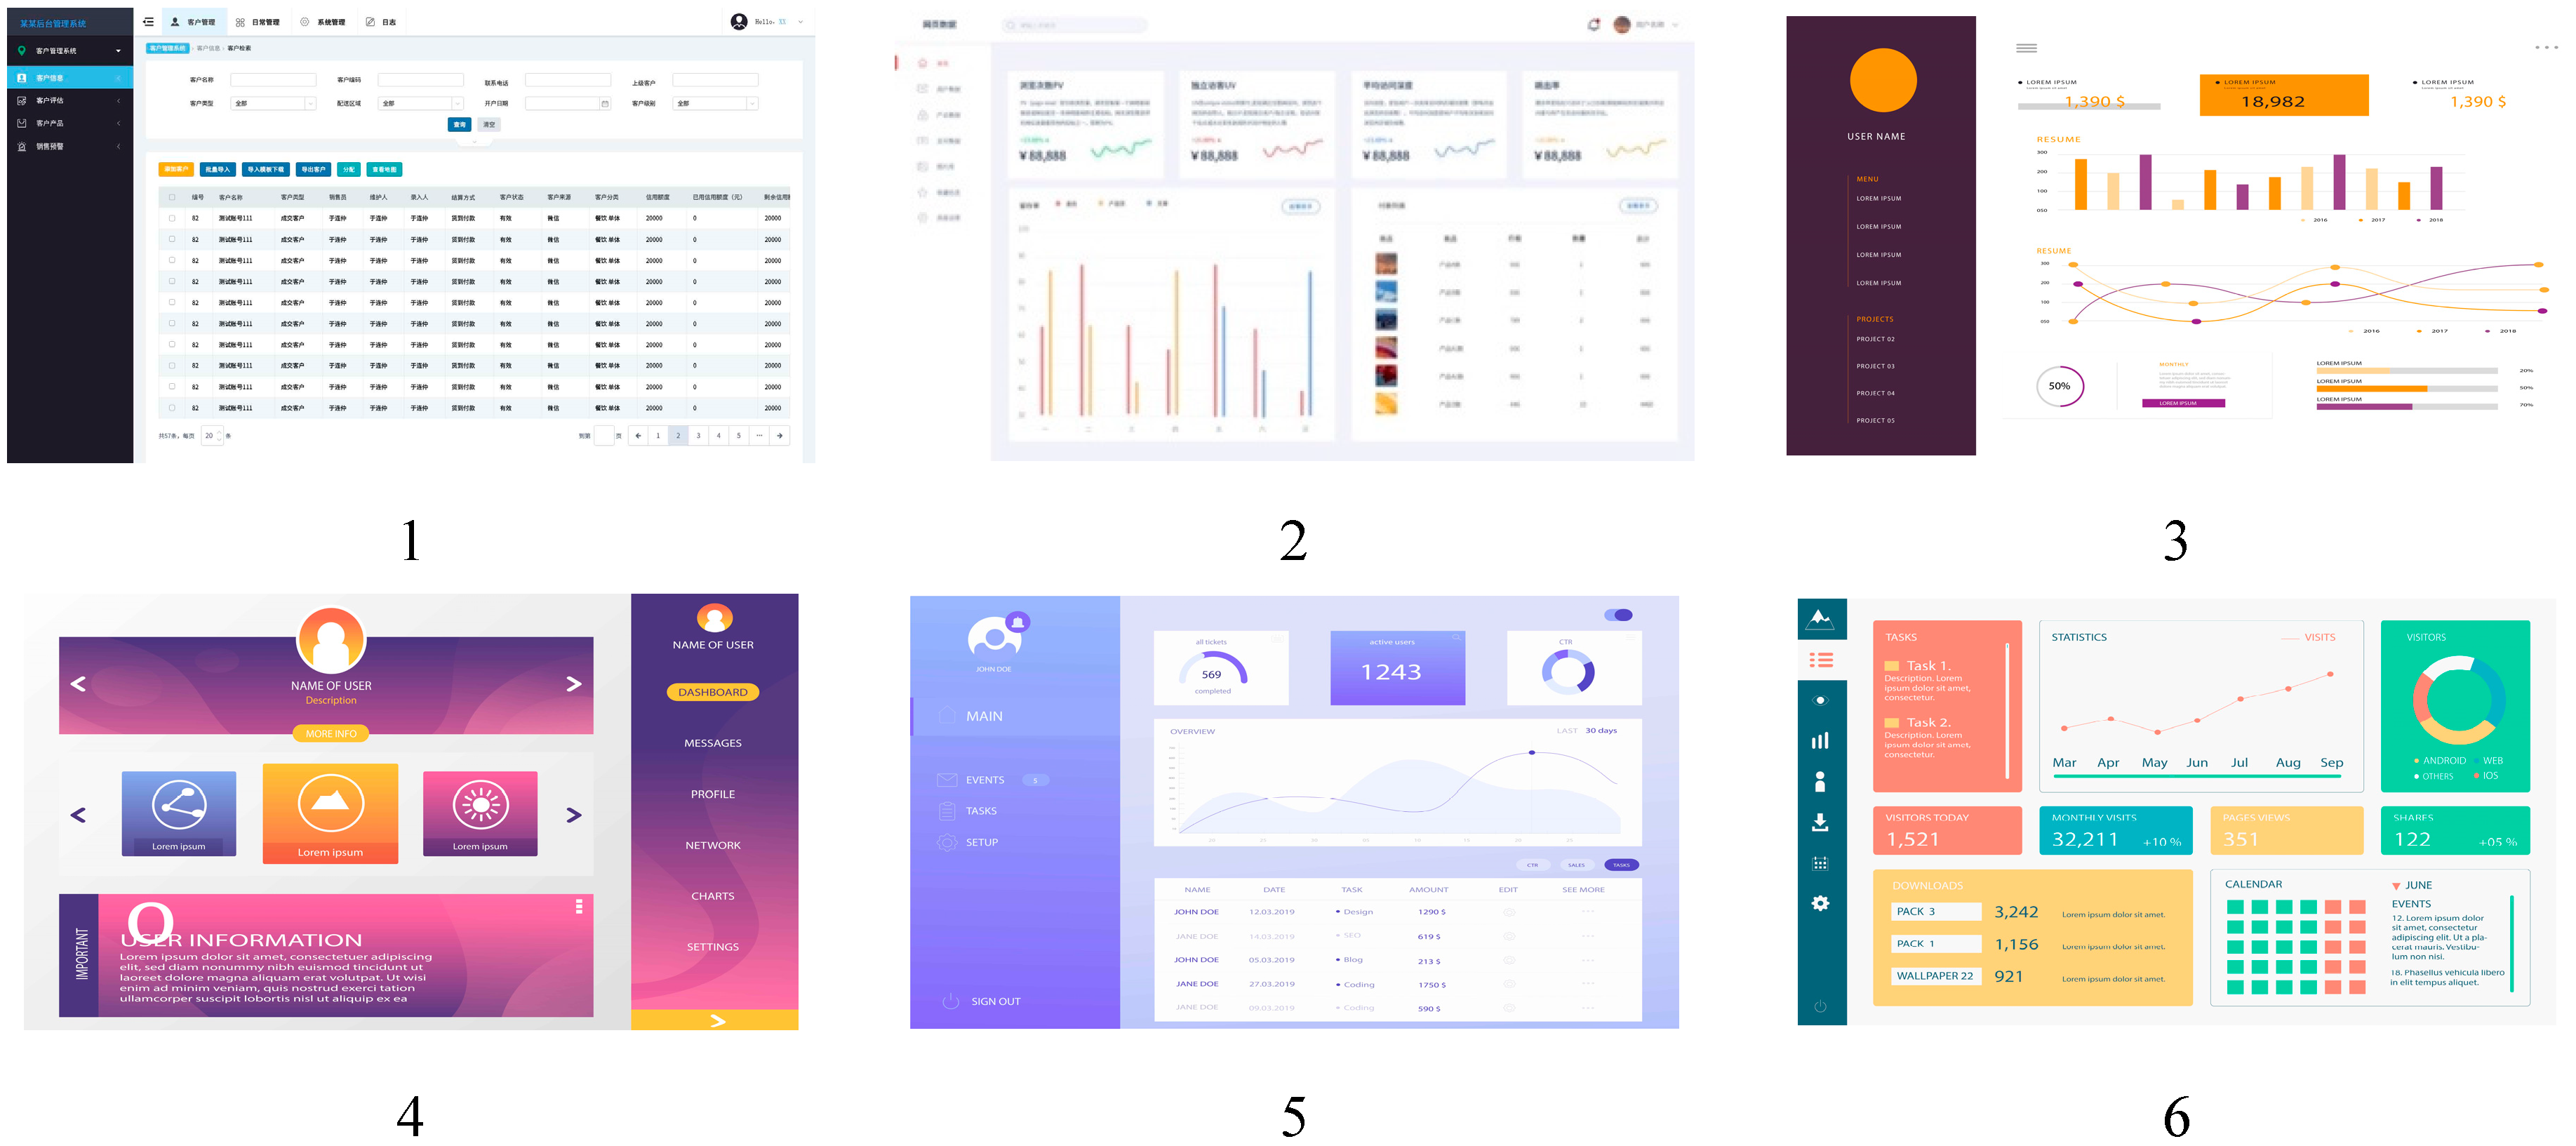
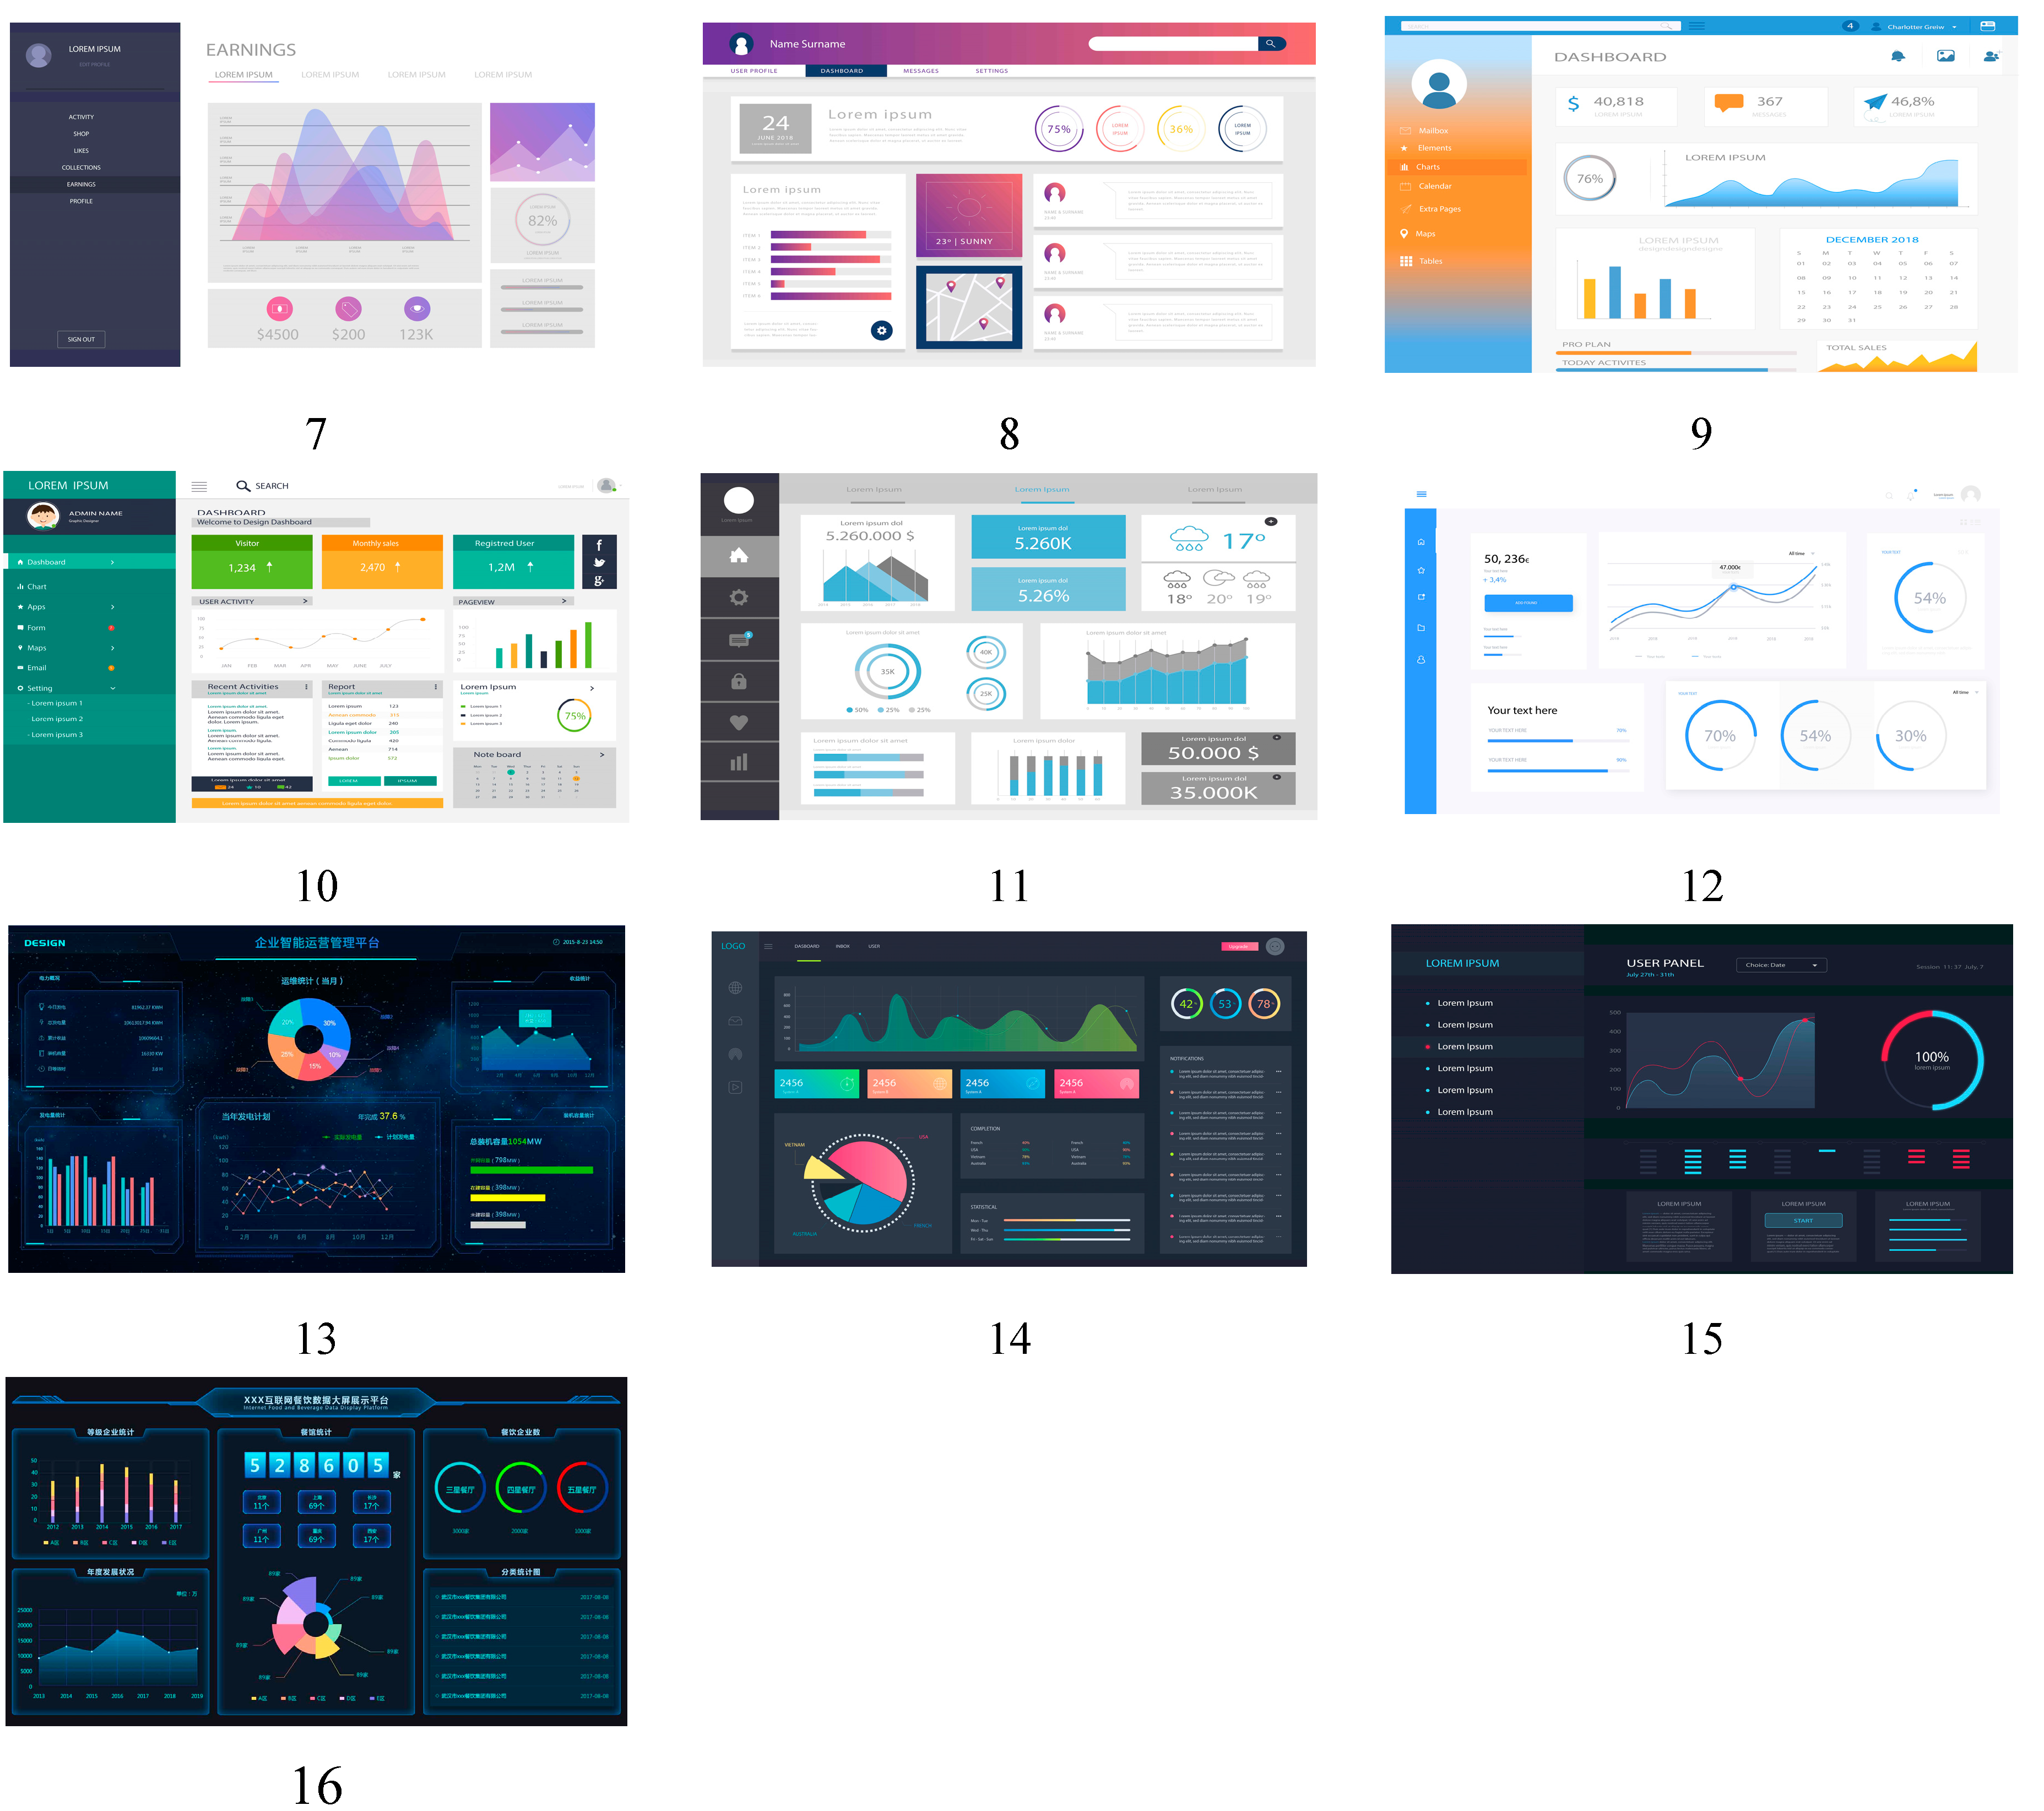
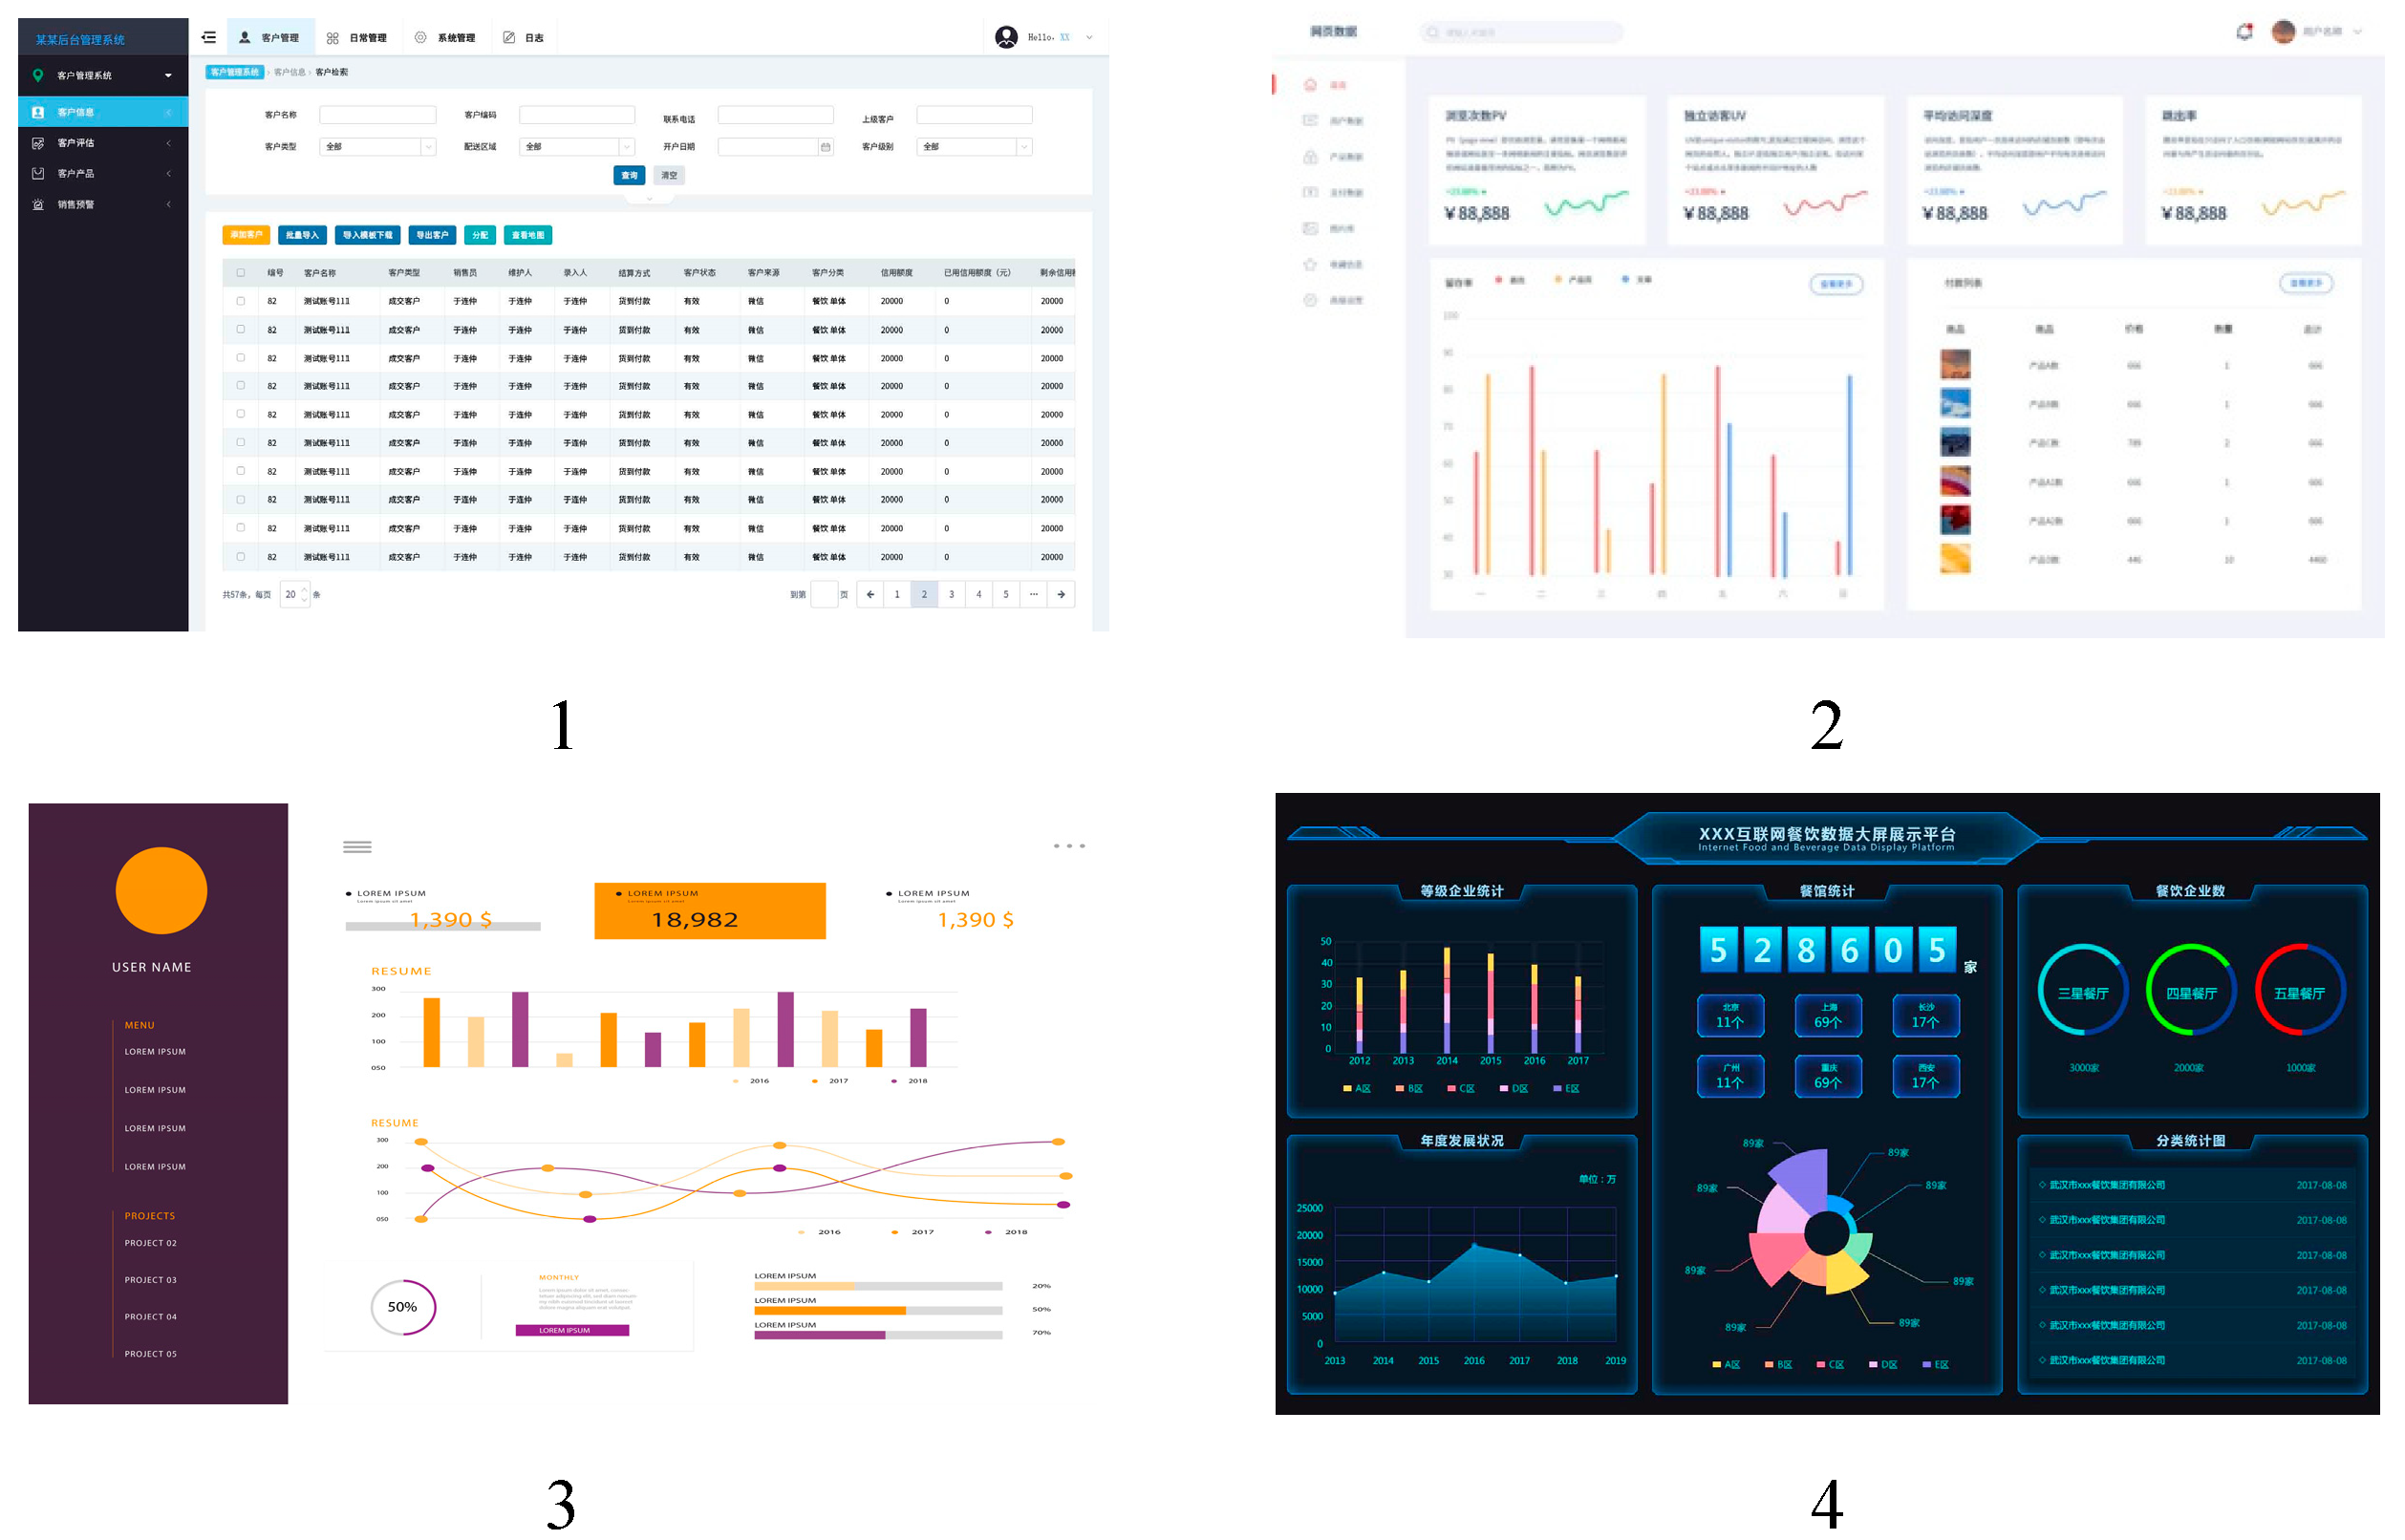
The KE method holds that, to properly evaluate a system or product, the evaluation variables should be adjusted according to the users’ psychological changes and the Kansei Engineering (KE) method. For the investigation of perceptual images of products, the research samples and target images should be selected [41]. The main research point of the KE method is to map users’ subjective feelings to explicit design elements [42]. The purpose of this method is to match users’ emotional needs with the overall environment of the VR system, thus improving users’ satisfaction. As presented in Figure 3, 16 VR interfaces with similar influence factors were selected, and an interface case base was constructed. The effects of VR interface design elements on perceptual images are discussed below.
After the deconstruction of modeling elements of the interface sample, the visual features of the VR interactive interface can be given, such as image elements, the layout of functional operation area, visual graphic area, color, font, elements, and interface transparency. Subjective images exist in different combinations of design elements, and users can judge perceptual images through design elements. These elements come from the layout of the function operation area, browsing order, visual graphics area, color, font, element, transparency, etc. Then, the suitable perceptual image semantics for describing VR interfaces can be selected. To avoid the problems of too strong subjectivity, poor real-time performance, and less data in the traditional KE method, this paper used the method of a big data crawler to sort the image lexicon of the VR system interface from the channels of the network, publicity materials, pictorials, etc., and obtained a total of 40,000 words of comments on the VR system. Adjectives were extracted through semantic analysis, and words suitable for VR interface emotional image expression with high word frequency, and the top 200 weight rankings, were selected. Then, 50 emotional image words were established by eliminating words with similar meanings, as shown in Table 1.
Table 2 demonstrates the preliminary screening of the perceptual image semantics, in which 22 VR users (12 men and 10 women) are tested. Firstly, a questionnaire is established. Then, the sample pictures can be observed from the test results, which takes the users experience into account to select the most suitable perceptual image semantics. According to the number of votes, 33 perceptual image semantic words are initially screened and established to express the VR interface. Then, perceptual images are semantically grouped as shown in Figure 3.
To further explore the structural relationship of the perceptual images in the VR interface, 22 subjects were invited to collect the perceptual images. After the reading of image adjectives, the words with similar meanings were entered into in the same column by the artificial classification method. Table 3 depicts the 33 × 33 similarity matrix gained by MATLAB, which counts the same number of grouping times. The obtained data were imported into SPSS data statistical software for cluster analysis. The perceptual image words can be divided into seven groups, as shown in Table 4. The representative perceptual image semantics with the seven groups were: scientific and technological, clear, fashionable, balanced, neat, dynamic, and easy to use.
3.2. Deconstruction of the VR Interface Design Elements
According to the multiple regression analysis, the functional relationship of design feature space and image space can be achieved, and then the KE model of the VR system interface is formed [43]. The deconstruction and reanalysis of the design element features of VR interface samples were conducted using the design element analysis method. Combining the VR system interface design requirements and design principle constraints, this defines the design items as function operation area layout, visual browsing sequence, visual graphic area, color, font, transparency, etc. The design elements of the VR interface are presented in Table 5. According to the corresponding elements, the distribution of each design category was determined with six items and 13 categories.
The layout of the functional operation area was distinguished by aggregation and dispersion. The visual browsing sequence was distinguished according to the proportion of text and graphics in the system interface. If the text accounted for a large proportion, the number of browsing interruptions was less. Pictures accounted for a large proportion because the user’s vision stayed on the images for analysis, and the number of browsing interruptions was higher. The visual graphic area was distinguished by chamfering. The color of the system interface was distinguished by hue. The transparency of the system interface was distinguished according to whether there was transparency. Fonts were distinguished according to the thickness of the strokes.
3.3. Establishment and Solution of Intention Space Model
According to the theory of multiple regression analysis, the linear relationship between the perceptual image cognitive space and VR interface design variables was established. Qualitative variables of interface design must be converted into quantitative variables, and then quantitative analysis can be carried out. Based on quantitative theory I, a mathematical model was established. The VR interface design project is regarded as item X and the design elements as category C.
where δi (j,k)(i = 1, …, n; j = 1,…, m; k = 1, …, rj) is the response of category k.
This model calculates the average value of the semantic scores of all testers for each category in the sample. A sample with a greater than average value can be identified as the element category and has a greater impact on the user’s sensibility and is, thus, parameterized as “1”. For the parameterization “0”, the category is less than the average value. As shown in Table 6, the evaluation average value of the perceptual image words and each design category are substituted into the mathematical model. Then, the influence and direction of each category on perceptual image words can be analyzed by the category scores.
3.4. Importance Analysis of the VR Interface Design Elements
When analyzing the importance of design elements in the VR system design interface, the Likert scale provides a method to effectively connect user cognition and design elements. The Likert scale is a psychological response scale. The Likert scale can express the changes of users’ perceptual cognition of products through ordered variables [44,45]. From the analysis of VR interface factors, 16 samples were selected for experiments as shown in Figure 1. The subjects comprised 40 users, 22 of whom had a design background. Sixteen typical samples were divided into seven groups of perceptual image semantics, and a Likert scale was adopted to discretize the target data. The image relevance degree of semantic words in Likert scale were divided into 1, 2, 3, 4, and 5 levels. Thus, “1” and “5” represent “relatively” and “extremely”, respectively, and “3” is the neutral point. The subjects who choose the neutral point answer usually do not have a clear attitude. The further away the selected answer is from the neutral point of “3”, the clearer the subject’s perceptual tendency towards himself. After the Likert scale investigation, the sample was evaluated to produce the perceptual image evaluation table of VR interface influencing factors, as shown in Table 7. For a certain kind of image, the parameters were input into SPSS for data processing; then, the values of design features and the average value of perceptual images of each experimental sample were calculated. After the calculation and analysis of multiple regression, the analysis results of the relationship model between the design project and the perceptual image word pair were obtained.
For an image of SPSS, the values of parameterized design features and the average value of perceptual images of each experimental sample were input respectively. Then, the analysis results of the relationship model between the design project and the perceptual image word pair were obtained. As shown in Table 8, taking “easy to use” as an example, the relationship of “easy to use” and perceptual image words is gained.
The level of category score in Table 8 indicates the semantic level of the perceptual image of the project. A positive value of the category score is a positive image, and a negative value represents a corresponding negative image. The smaller the absolute value of the difference between the determination coefficient and 1, the higher the accuracy of the prediction model. The difference between the maximum and minimum category score in each element is used to measure the contribution of each item in the overall forecast. Multivariate regression analysis is employed to study the expression of dependency relationship of variables [46]. The multivariate regression method is adopted to analyze the mapping function relationship between the VR interface feature space and perceptual space. Moreover, the multiple correlation coefficient is the fitting degree of the regression model, which explains the meaning of the perceptual image, that is, the reliability degree of regression analysis. As shown in Table 8, the constant term is 0.782. The multiple correlation coefficient was 0.936, and the decision coefficient was 0.876. Thus, the prediction model is shown in Equation (6):
Y1 = 0.003c11 − 1.821c12 + 0.007c21 − 3.417c22 + 0.001c31 − 0.009c32 − 0.013c41 + 0.433c42 − 0.479c43 + 0.001c51 + 3.190c52 − 0.011c61 + 2.702c62 + 0.782.
Table 8 also indicates that the discrete layout of the functional operation areas (X1–C12) and the jumping interface browsing mode (X2–C22) have a reverse effect on the “easy to use” perceptual image. The interface with the aggregation of the functional operation area layout (X1–C11) and sequential browsing mode and less user visual jump (X1–C21) played a positive role in “easy to use” perceptual images. The layout of more dispersed functional operation areas dispersed the user’s concentration and consumed more time and energy in finding functional tasks. Therefore, the more concentrated distribution of functional areas should be controlled uniformly within the optimum visual range of users, thus increasing the efficiency of functional operations.
The browsing mode of users tended to be the interface form of combining pictures and words. More words caused user cognitive fatigue, whereas more pictures lack logic. Therefore, a combination of the two improves users’ satisfaction. The contribution values of the perceptual images of each project are shown in Table 9. For the user demand of “easy to use”, the complex network was used to analyze the correlation between design elements in the VR system interface. As shown in Table 10, the interface layout and overall tone have a strong correlation with each element. The analysis results of multiple linear regression were combined with the complex network, which demonstrated that the interface layout (X1) and interface browsing sequence (X2) of the functional operation area worked as important factor indexes in the system design.
4. Validation and Analysis of Case Experiments
4.1. KE Model Verification of the VR System Interface
The user’s perceptual demand image for the target interactive interface was determined, and the design items of VR interactive interface were obtained through category hierarchy inference. Then, on the basis of comparative analysis with the actual values of the VR system, the design variables of the interactive interface were classified and sorted. Secondly, after the qualitative variables of interactive interface design were transformed into quantitative variables through parameterization, the mapping relationship model between perceptual images and interactive interface design variables was established using multiple linear regression analysis. Using the T-test, the utility of the model was verified to be reliable.
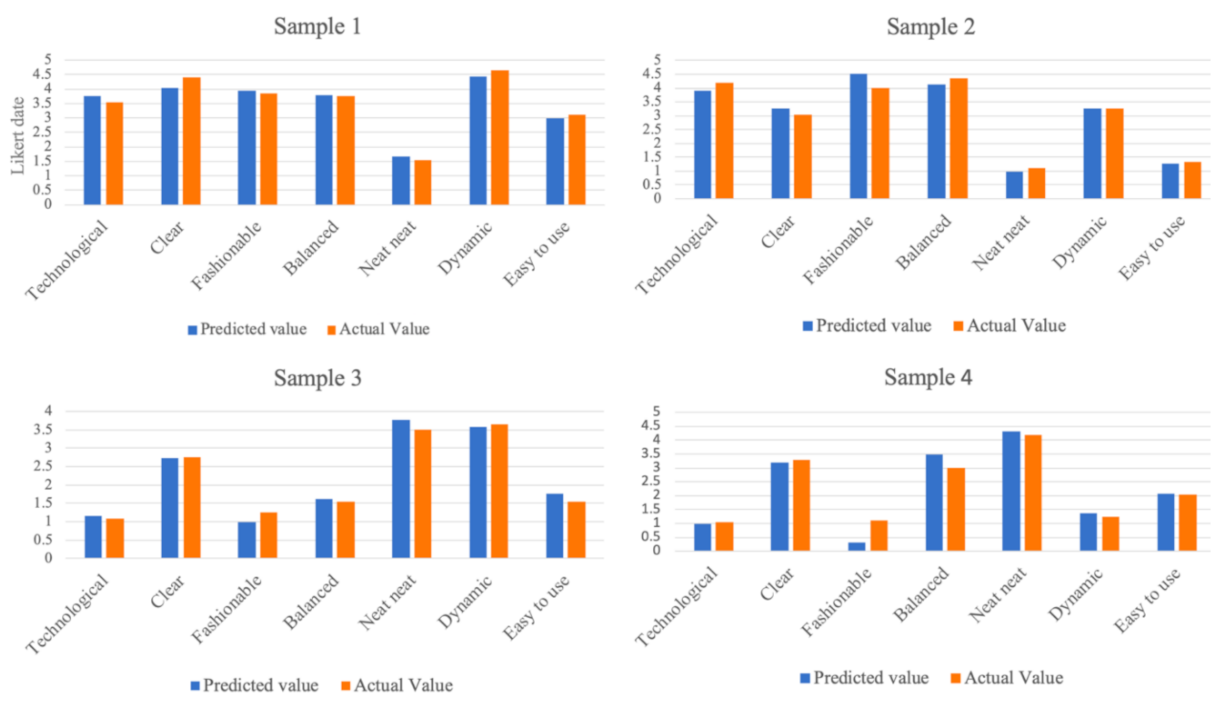
To verify the perceptual imagery semantic score of the KE model, the subjective evaluation of the sample was performed by the participant, and the calculated value of the KE model was compared with the actual value with a single-sample T-test. As shown in Figure 4, four samples were selected and verified. The characteristics of the texture components of typical samples were substituted into multiple regression equations, and then the image scores and coordinates of the image space were obtained. The paired contrast T-test was conducted with the actual evaluation data, which was gained from the image verification experiment to judge the credibility of the modeling rule.
The concrete composition of the interface design elements of the virtual reality system was calculated through the concrete coordinate values of the perceptual space. The product scheme was designed according to the composition of the elements. The designer evaluated the imagery perception of the design solution. The actual evaluation data was obtained from the experiment, which was compared and tested against the predicted data to determine the credibility of the stylistic rule. For the four verification samples, the coding table of the morphological and physical elements was achieved as shown in Table 11.
The characteristics of the components of the verification sample design were substituted into the multiple regression equation (KE model) to calculate the image score. We invited 20 subjects to complete a questionnaire survey of the five-order semantic difference method. Four samples were scored on six perceptual image semantics as shown in Figure 5. The average score of each perceptual image semantics was calculated, and the predicted value of the multiple regression equation was compared with the actual value. For each sample, the calculated value was subtracted from the corresponding column value of the evaluation score. Then, the absolute value was obtained, which was recorded as Pi (i = 1, 2... 7), where i is the corresponding perceptual image word, for example, i = 1 is “easy to use”.
For the same sample, the average value of the difference between the “calculated value and the actual value” of the perceptual image was obtained and recorded as T, T = (P1 + P2 + … … + P7)/7, and the correlation coefficient was obtained as shown in Table 12. The results show that the difference between the calculated value and the actual value was essentially controlled at approximately 97%. The mathematical model of the developed VR interface imagery space was reasonable and considered significantly relevant; thus, the reliability of the analysis results can be verified. The KE method is based on emotional experience to analyze users’ cognitive behavior, which not only provides the basis for VR system interaction designers to mine the needs of design users but also opens up the design space for designers to enhance users’ perceptual cognitive experiences.
4.2. CNN Forecast Model
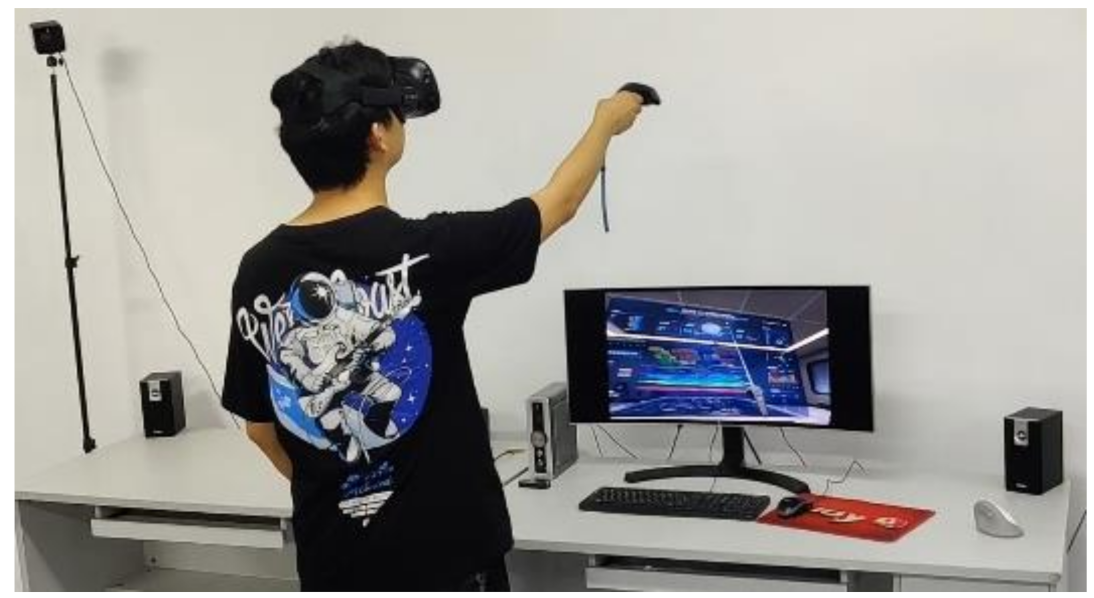
Based on the CNN, a VR perceptual image prediction model and the optimal combination of design elements were established, which provided certain theoretical guiding significance for assisting in the design and development of the VR system interface. The predictive model input set data was organized with the imagery of the VR system interface as “easy to use”. The VR interface elements were deconstructed according to the deconstruction method outlined in Section 3.2. The design feature module is an explicit knowledge feature. The One-Hot coding method was adopted to extend the numerical value of discrete features to Euclidean space [47,48]. The number 0 indicates the irrelevant options, and the number 1 indicates the relevant options. The VR information interface sample design elements were input to process information according to the One-Hot coding mode. Based on the modeling method of the convolution neural network, the correlation between user perceptual intention and design elements was quantitatively established by making full use of the user interaction data of the VR system [49]. Then, the output set data was collated, and the collated samples were imported into the VR information interface. Figure 6 depicts the experimental scene diagram.
The VR system applied is modeled by Rhinoceros software, and the system is developed using UNREAL ENGINE 4.21.1. The virtual hardware devices are HTC VIVE/HTC VIVE PRO, VIVE head-mounted device, VIVE control handle and VIVE locator. In the formal experiment, 15 personnel were recruited for the perceptual intention experiment, who were aged between 20 and 26 years old, and comprised 8 men and 7 women. All of the subjects had normal vision or corrected vision with no defects in visual, auditory, or tactile perception, and were right-handed. The experimental task was to observe the overall interface information transmission effect and click on the task area. The task involved a sense of ease, and the data measurement of intention value “ease and ease of use” was recorded by the NASA-TLX scale.
For the feature analysis of the input and output set data, the neural network model structure for the VR system interface should mainly contain the following layers. As shown in Figure 2, the first layer is a one-dimensional convolution method. It has 2048 convolution kernels and the size of the convolution kernels is set to 7. The output dimensions of this layer are (28 – 7 + 1) = 22 and 2048. When the number of convolution kernels is 1024 and the size of convolution kernels is 5, the output dimensions of this layer are (22 – 5 + 1) = 18 and 1024. The third layer is the convolution layer with 512 convolution kernels and the size of convolution kernels is 5. The fourth layer is a convolution layer, which has 256 convolution kernels and the size of convolution kernels is 5. The fifth layer is also a convolution layer, which has 128 convolution kernels and the size of convolution kernels is 3. The sixth convolution layer has 64 convolution kernels and the size of convolution kernels is 3. The seventh layer is a tile layer. The eighth layer is the full junction layer with 128 neurons. The ninth layer is the full junction layer with 20 neurons. The tenth layer is the output layer and has one neuron.
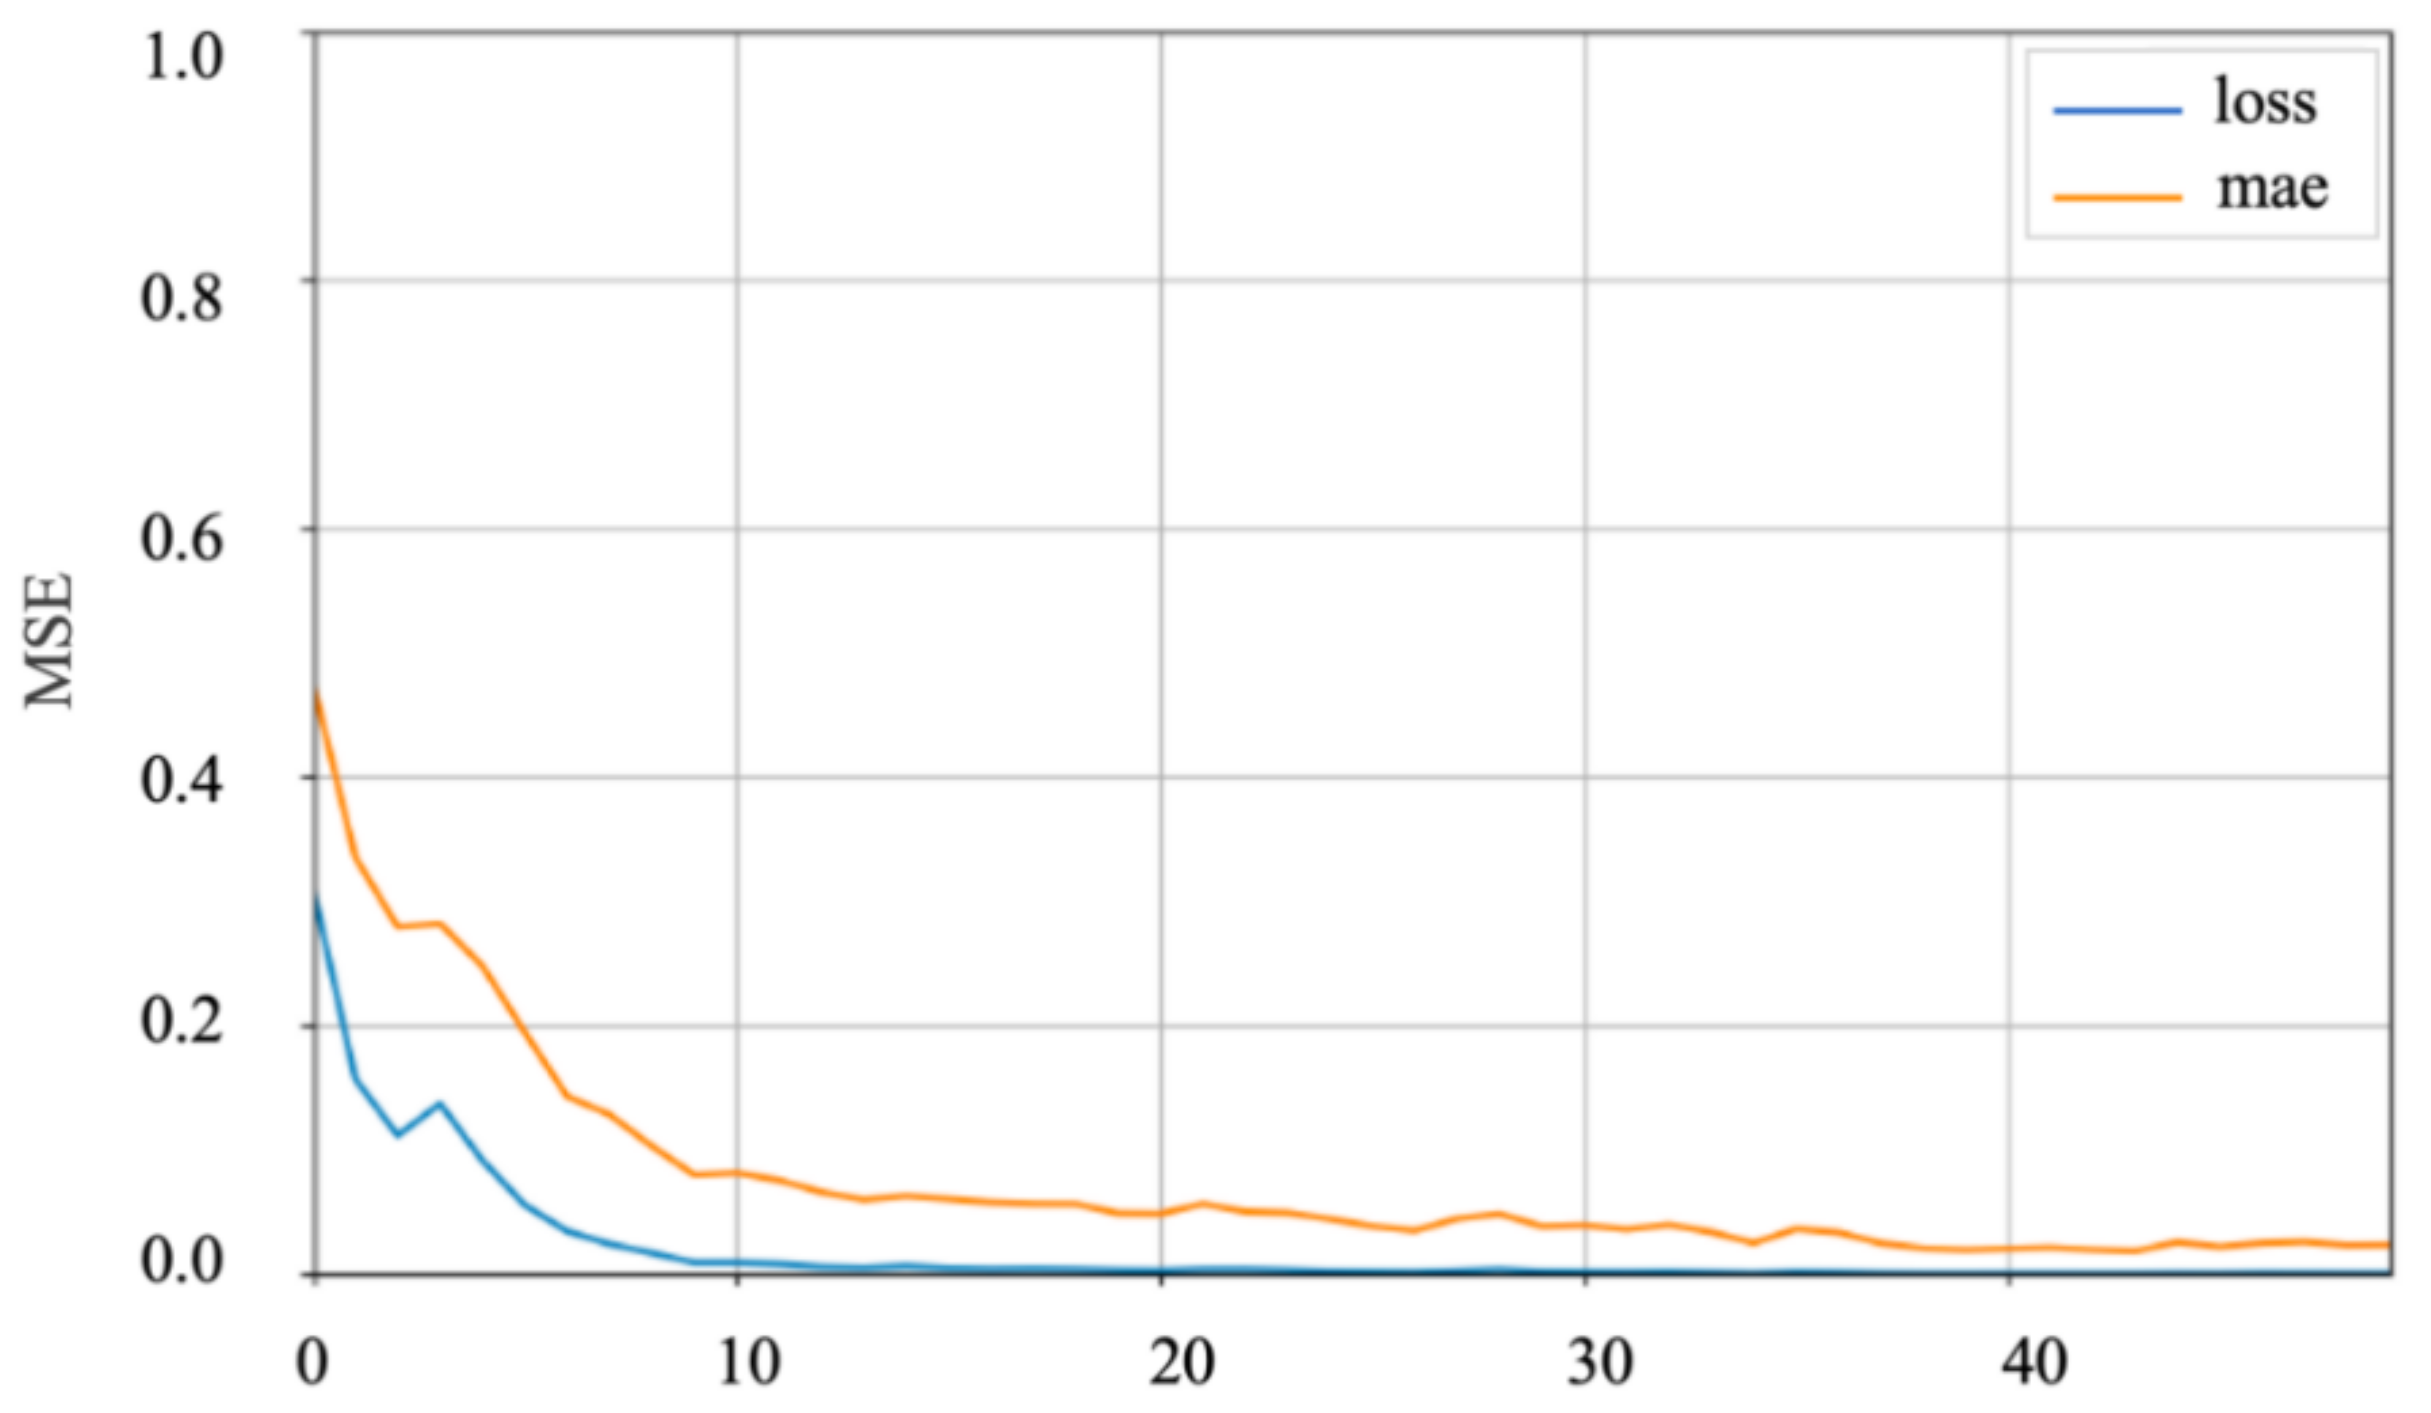
To verify the results of the prediction model, samples are selected with the performance test. Then, the data in the output layer can be normalized and detected by the function MSE. Mean square error in mathematical statistics refers to the expected value of the square of the difference between the estimated parameter value and the parameter value, which is recorded as MSE. MSE is a convenient method to measure the “average error”. MSE can evaluate the degree of change of data. The smaller the MSE value, the better the accuracy of the prediction model in describing experimental data.
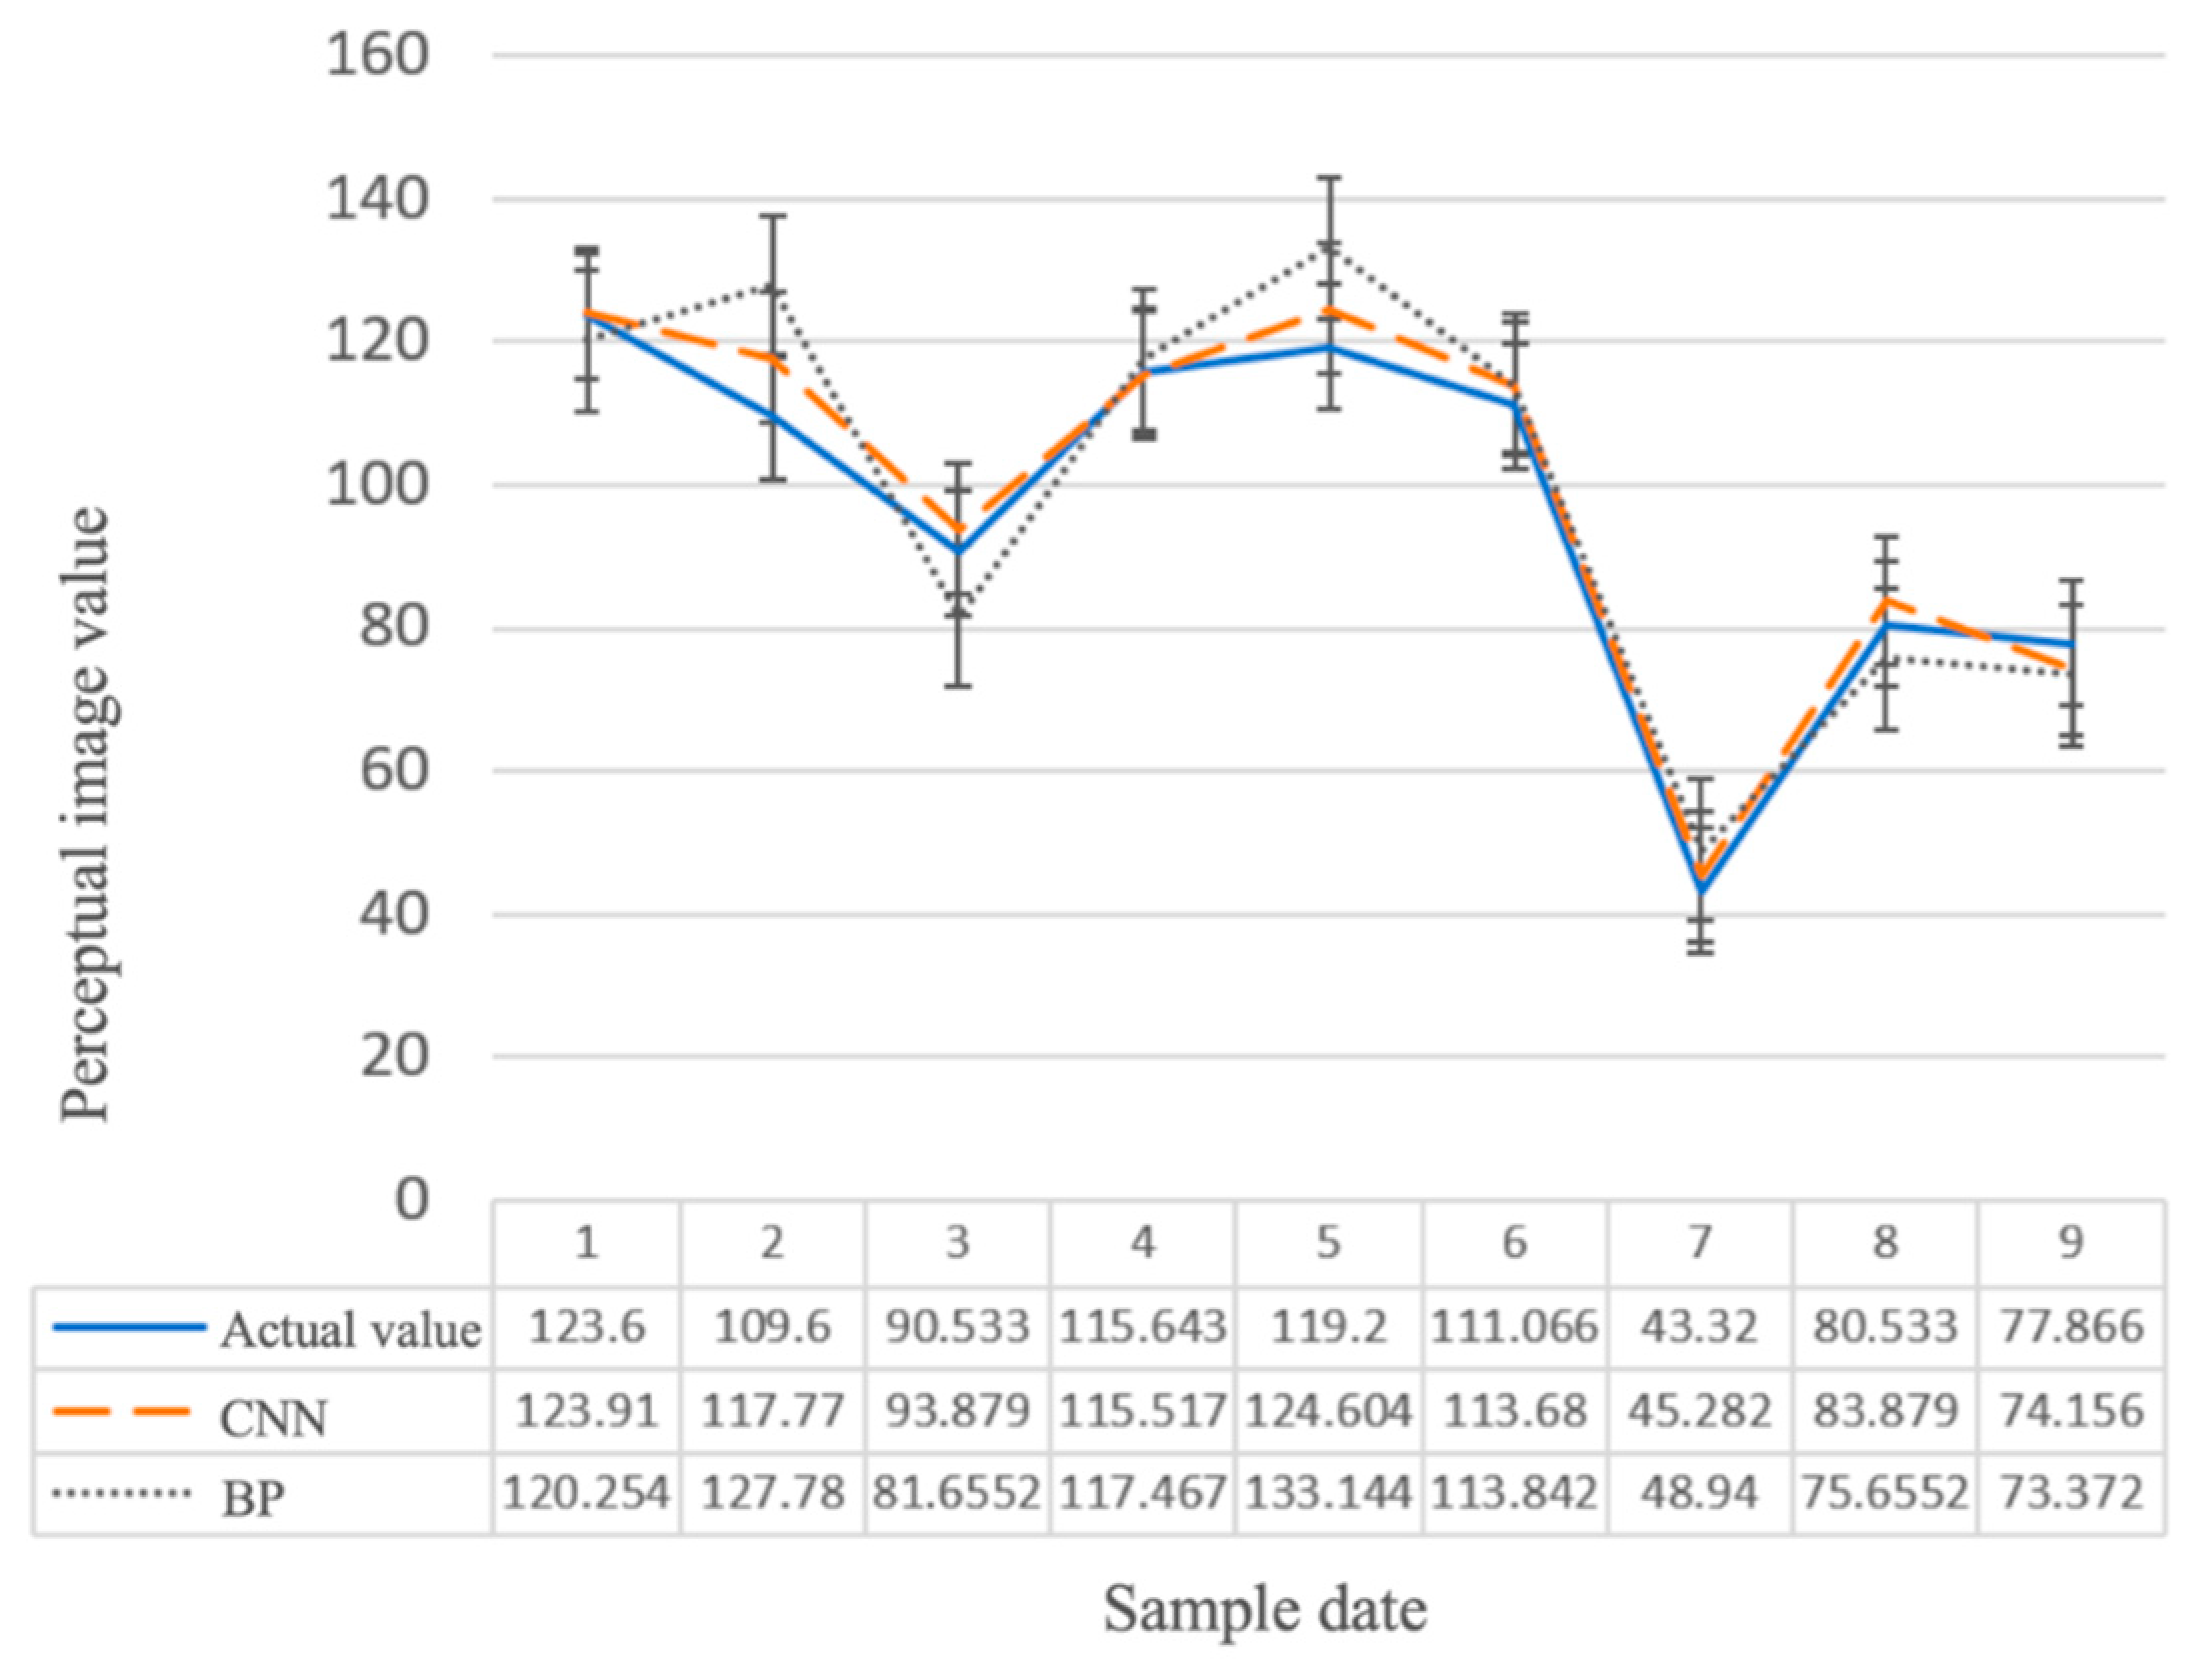
The authors in [50] demonstrated that the feasibility of the CNN prediction model can be verified with MSE values of less than 0.01 for this VR interface. The test data of the user NASA scale and the output layer values of CNN model were analyzed via the mean square deviation MSE calculation. Figure 7 shows the fitting situation of 50 iterations. The measured result value was 0.0074, and the MSE value was less than 0.01, which proves that the CNN model of VR digital information interfaces performed well. This also shows that the output predicted value was essentially consistent with the experimental value data and that the model can complete the correct mapping between user imagery testing and design elements. Comparing the CNN forecast data and Back Propagation Neural Network (BP) forecast data with the actual values, we found that the CNN forecast data was more accurate, as shown in Figure 8. Therefore, this CNN prediction model has guiding significance for assisting the design and development of VR system interfaces.
4.3. Analysis of Perceptual Image Prediction Results Based on CNN
The matching types of interface design elements of the VR system were 2 × 2 × 2 × 3 × 2 × 2 = 96 when the NASA cognitive load scale takes a value of 40.59454, which is the minimum cognitive load value. The VR information interface features included the following features. (1) The layout of the aggregated functional operation area had fewer visual interruptions. This can improve the concentration of users, reduce energy consumption, and improve the efficiency of functional operations. (2) The chamfering features of the visual graphic area were round chamfering. Roundly chamfered corners gave users a warm and friendly feeling, improved the comfort of user experience, and reduced stimulation. (3) The overall tone was cold. The colder color tone is more in line with the scientific and technological characteristics of VR systems. (4) The interface was transparent. The transparent interface makes the VR system environment more real, provides a sense of depth in the environment, and enhances the user experience. (5) The font strokes of the text are thick. Thicker font strokes can make the text clearer and have a higher error tolerance for users to read information.
Based on the analysis results of the intention space of KE presented in Section 3.4 the discrete layout of the functional operation areas and the jumping browsing mode had a reverse effect on the “easy to use” Kansei image. The interface with an aggregated layout of the functional operation areas, sequential browsing mode, and fewer visual jumps played a positive role in “easy to use” perceptual images. Therefore, the results of the CNN prediction and KE imagery space analysis were combined for the optimization design and scheme selection of the VR information interface. Table 13 compares the representative VR visual information interface design schemes. This presents a representative of the VR visualization information interface design schemes, in which scheme two is optimized after the CNN prediction and data comparison. Scheme two had a lower cognitive load value, which is more in line with the user’s demand of “easy to use” perceptual intention. Hence, the VR system design method proposed in this paper uses the perspective of taking users as the center, and drives the VR system interface optimization design using objective data based on user cognition. This provides the support of the users’ design knowledge for designers to carry out their work, and improves the attractiveness of the VR system to users and the market competitiveness.
5. Conclusions
Starting from the perceptual images of users, this paper investigated users’ psychological tendencies in operating VR interfaces to break the tradition of subjective thinking design and identify the key features of VR interface form design. We adopted quantitative theory I and the multiple regression analysis model. Then, user intention prediction was carried out via a CNN. Using qualitative inference, the relationship between the VR system design details and the perceptual demands was established. Via the construction of the mapping model, the perceptual requirements were quantitatively transformed into design variables.
These results provide a new method for designers to produce design schemes more objectively and efficiently from the perspective of users’ perceptual needs. This helps to improve the satisfaction of users and the market competitiveness of innovative design and, also, provides a reference for the interactive interface design of other products.
The main findings are summarized as follows:
- (1)
- The application of KE in VR system visualization is expanded. Multi-channel perceptual information is integrated into VR interface task scenario research, which is guided by cognitive psychology theory and KE theory. The relationship between VR system design elements and users’ perceptual cognition is analyzed. Then, the spatial model of VR system users’ perceptual cognitive image resources is built.
- (2)
- The design cycle for the building of VR systems is shortened and the user satisfaction of the design scheme is improved. The KE function model is established using quantitative theory I and multiple regression theory.
- (3)
- The similarity between the calculated value and the actual value is about 97%, thus, the VR mathematical model established is significantly related. The VR system design features are used to learn users’ cognitive images through the CNN to achieve the effect of predicting users’ satisfaction. The CNN prediction model gains a measurement value of 0.0074 and the MSE value is less than 0.01, which indicates that the CNN model has a good test performance.
The focus of the future research will be to explore the multi-dimensional interaction of design features in VR task situations on user task operations. According to user image feedback, VR resource features can be dynamically optimized, and the optimal interval value of each design resource feature can be determined under the condition of high user satisfaction. In general, our research proves that Kansei Engineering plays an important role in analyzing users’ perceptual images in VR systems’ human–computer interaction, thus expanding the research field for KE.
Author Contributions
Conceptualization, Q.F.; methodology, Q.F.; software, Q.F. and J.L.; validation, J.L. and S.T.; formal analysis, J.L. and S.T.; investigation, Q.F.; resources, Q.F.; data curation, Q.X.; writing—original draft preparation, Q.F.; writing—review and editing, J.L.; visualization, Q.F.; supervision, J.L., S.T. and Q.X.; project administration, J.L.; funding acquisition, Q.X. All authors have read and agreed to the published version of the manuscript.
Funding
This research was funded by [National Natural Science Foundation of China (NSFC)] grant number [52065010]. Also funded by [Natural Science Foundation of Guizhou Provincial Science and Technology Department] grant number [[2018]1049]. And this research was funded by [National Natural Science Foundation of China (NSFC)] grant number [52065010].
Conflicts of Interest
The authors declare no conflict of interest.
References
- Abdelhamid, A.; Zong, P. A Novel Software Simulator Model Based on Active Hybrid Architecture. Int. J. Aerosp. Eng. 2015, 2015, 107301. [Google Scholar] [CrossRef] [Green Version]
- Shim, H.-M.; Lee, S. Multi-channel electromyography pattern classification using deep belief networks for enhanced user experience. J. Central South Univ. 2015, 22, 1801–1808. [Google Scholar] [CrossRef]
- Shangguan, Z.; Wang, L.; Zhang, J. Vision-Based Object Recognition and Precise Localization for Space Body Control. Int. J. Aerosp. Eng. 2019, 2019, 1–10. [Google Scholar] [CrossRef]
- Wu, H.; Tian, G.; Li, Y.; Sang, S.; Zhang, H.-T. Building of cognizing semantic map in large-scale semi-unknown environment. J. Central South Univ. 2014, 21, 1804–1815. [Google Scholar] [CrossRef]
- Zhang, H.; Zhang, C.; Jiang, Z.; Yao, Y.; Meng, G. Vision-Based Satellite Recognition and Pose Estimation Using Gaussian Process Regression. Int. J. Aerosp. Eng. 2019, 2019, 1–20. [Google Scholar] [CrossRef]
- Zhao, Y.-C.; Liang, J.; Chen, L.; Cai, Y.-F.; Yao, M.; Hua, G.-D.; Zhu, N. Driving rule extraction based on cognitive behavior analysis. J. Central South Univ. 2020, 27, 164–179. [Google Scholar] [CrossRef]
- Shi, Y.; Peng, Q. A VR-based user interface for the upper limb rehabilitation. Procedia CIRP 2018, 78, 115–120. [Google Scholar] [CrossRef]
- Liu, H.; Feng, Z.; Liang, L. Natural interaction model and algorithm of virtual interface. J. Zhejiang Univ. 2016, 50, 1167–1175. [Google Scholar]
- Intraub, H.; Morelli, F.; Gagnier, K.M. Visual, haptic and bimodal scene perception: Evidence for a unitary representation. Cognition 2015, 138, 132–147. [Google Scholar] [CrossRef] [Green Version]
- Lu, K.; Wei, Z.; Zhuang, D. Physiological model for discriminant prediction of mental load on aircraft cockpit display interface. J. Beijing Univ. Aeronaut. Astronaut. 2016, 42, 685–693. [Google Scholar]
- Akyeampong, J.; Udoka, S.; Caruso, G.; Bordegoni, M. Evaluation of hydraulic excavator Human–Machine Interface concepts using NASA TLX. Int. J. Ind. Ergon. 2014, 44, 374–382. [Google Scholar] [CrossRef]
- Guan, D.; Zhao, D.; Ren, Z. Aeroacoustic Attenuation Performance of a Helmholtz Resonator with a Rigid Baffle Implemented in the Presence of a Grazing Flow. Int. J. Aerosp. Eng. 2020, 2020, 1–16. [Google Scholar] [CrossRef]
- Mohammadi, M.; Montazeri, M.; Abasi, S. Bacterial graphical user interface oriented by particle swarm optimization strategy for optimization of multiple type DFACTS for power quality enhancement in distribution system. J. Central South Univ. 2017, 24, 569–588. [Google Scholar] [CrossRef]
- Ji, S.; Wang, B.; Zhao, D. Numerical analysis on combustion instabilities in end-burning-grain solid rocket motors utilizing pressure-coupled response functions. Aerosp. Sci. Technol. 2020, 98, 105701. [Google Scholar] [CrossRef]
- Cai, T.; Zhao, D.E. Bluff-body effect on thermal and NO emission characteristics in a micro-planar combustor fueled with premixed ammonia-oxygen. Chem. Eng. Process.-Process Intensif. 2020, 153, 107979. [Google Scholar] [CrossRef]
- Zhao, D.; Thomas, J.-L.; Marchiano, R. Computation of the radiation force exerted by the acoustic tweezers using pressure field measurements. J. Acoust. Soc. Am. 2019, 146, 1650–1660. [Google Scholar] [CrossRef]
- Yan, S.; Tran, C.C.; Chen, Y.; Tan, K.; Habiyaremye, J.L. Effect of user interface layout on the operators’ mental workload in emergency operating procedures in nuclear power plants. Nucl. Eng. Des. 2017, 322, 266–276. [Google Scholar] [CrossRef]
- Ogawa, T.; Nagai, Y.; Ikeda, M. An ontological approach to designers’ idea explanation style: Towards supporting the sharing of kansei-ideas in textile design. Adv. Eng. Inform. 2009, 23, 157–164. [Google Scholar] [CrossRef]
- Fenech, A.; Francalanza, E.; Azzopardi, M.A.; Micallef, A. Kansei Engineering over Multiple Product Evolution Cycles: An Integrated Approach. Procedia CIRP 2019, 84, 76–81. [Google Scholar] [CrossRef]
- Wang, W.; Wang, J.; Li, Z.; Tian, Z.; Tsui, E. Multiple affective attribute classification of online customer product reviews: A heuristic deep learning method for supporting Kansei engineering. Eng. Appl. Artif. Intell. 2019, 85, 33–45. [Google Scholar] [CrossRef]
- Zabotto, C.N.; Da Sergio Luis, S.; Amaral, D.C.; Hornos, C.J.M.; Benze, B.G. Automatic digital mood boards to connect users and designers with kansei engineering. Int. J. Ind. Ergon. 2019, 74, 102829. [Google Scholar] [CrossRef]
- Chanyachatchawan, S.; Yan, H.-B.; Sriboonchitta, S.; Huynh, V.-N. A linguistic representation based approach to modelling Kansei data and its application to consumer-oriented evaluation of traditional products. Knowl.-Based Syst. 2017, 138, 124–133. [Google Scholar] [CrossRef]
- Hasegawa, H.; Shibasaki, S.; Ito, Y. Shape and Layout Understanding Method Using Brain Machine Interface for Idea Creation Support System. Procedia Comput. Sci. 2015, 60, 1205–1214. [Google Scholar] [CrossRef]
- Aziz, A.A.; Moganan, F.F.M.; Ismail, A.; Lokman, A.M. Autistic Children’s Kansei Responses towards Humanoid-Robot as Teaching Mediator. Procedia Comput. Sci. 2015, 76, 488–493. [Google Scholar] [CrossRef] [Green Version]
- Tama, I.P.; Azlia, W.; Hardiningtyas, D. Development of Customer Oriented Product Design using Kansei Engineering and Kano Model: Case Study of Ceramic Souvenir. Procedia Manuf. 2015, 4, 328–335. [Google Scholar] [CrossRef] [Green Version]
- Chen, M.; Hsiao, Y.; Chang, K.; Lin, M. Applying big data analytics to support Kansei engineering for hotel service development. Data Technol. Appl. 2019, 53, 33–57. [Google Scholar] [CrossRef]
- Takatera, M. Introduction to special issue on Kansei Engineering in textiles and clothing. Int. J. Cloth. Sci. Technol. 2020, 32, 1–4. [Google Scholar] [CrossRef]
- Castro, J.A.; Vargas, A.L.; Bustos, G.E.O. Ingeniería kansei aplicada a un estudio referido a cinco maderas comerciales de Chile. Madera Y Bosques 2019, 25. [Google Scholar] [CrossRef]
- Wu, Y.; Kang, X. Establishment of an Aggregation Model Associated with Instrument Interface Design Based on Kansei Factors of Electric Vehicle Drivers. Math. Probl. Eng. 2020, 2020, 1–15. [Google Scholar] [CrossRef]
- Xue, L.; Yi, X.; Zhang, Y. Research on Optimized Product Image Design Integrated Decision System Based on Kansei Engineering. Appl. Sci. 2020, 10, 1198. [Google Scholar] [CrossRef] [Green Version]
- Quan, H.; Li, S.; Wei, H.; Hu, J. Personalized Product Evaluation Based on GRA-TOPSIS and Kansei Engineering. Symmetry 2019, 11, 867. [Google Scholar] [CrossRef] [Green Version]
- Chiu, M.-C.; Lin, K.-Z. Utilizing text mining and Kansei Engineering to support data-driven design automation at conceptual design stage. Adv. Eng. Inform. 2018, 38, 826–839. [Google Scholar] [CrossRef]
- Gao, X.; Tian, L.; Li, W. Coupling interaction impairs knowledge and green behavior diffusion in complex networks. J. Clean. Prod. 2020, 249, 119419. [Google Scholar] [CrossRef]
- Li, Y.; Tao, F.; Cheng, Y.; Zhang, X.; Nee, A. Complex networks in advanced manufacturing systems. J. Manuf. Syst. 2017, 43, 409–421. [Google Scholar] [CrossRef] [Green Version]
- Su, Z.; Yu, S.; Chu, J.; Zhai, Q.; Gong, J.; Fan, H. A novel architecture: Using convolutional neural networks for Kansei attributes automatic evaluation and labeling. Adv. Eng. Inform. 2020, 44, 101055. [Google Scholar] [CrossRef]
- Li, Z.-M.; Gui, W.; Zhu, J.-Y. Fault detection in flotation processes based on deep learning and support vector machine. J. Central South Univ. 2019, 26, 2504–2515. [Google Scholar] [CrossRef]
- Diego-Mas, J.A.; Alcaide-Marzal, J. Single users’ affective responses models for product form design. Int. J. Ind. Ergon. 2016, 53, 102–114. [Google Scholar] [CrossRef] [Green Version]
- Zhao, H.; He, L.; Lin, L. Research on perceptual image design for complex digital man-machine interface. Mech. Des. Manuf. 2016, 6, 135–138. [Google Scholar]
- Guo, F.; Qu, Q.; Nagamachi, M. A proposal of the event-related potential method to effectively identify kansei words for assessing product design features in kansei engineering research. Int. J. Ind. Ergon. 2020, 76, 102940. [Google Scholar] [CrossRef]
- Hsu, C.; Fann, S.; Chuang, M. Relationship between eye fixation patterns and Kansei evaluation of 3D chair forms. Displays 2017, 50, 21–34. [Google Scholar] [CrossRef]
- Cong, J.; Chen, C.; Zheng, P. A holistic relook at engineering design methodologies for smart product-service systems development. J. Clean. Prod. 2020, 272, 122737. [Google Scholar] [CrossRef]
- Wang, C.; Chin, H. Integrating affective features with engineering features to seek the optimal product varieties with respect to the niche segments. Adv. Eng. Inform. 2017, 33, 350–359. [Google Scholar] [CrossRef]
- Liu, Z.; Xie, Q.; Huang, H. Construction and performance evaluation of multi-dimensional variable Kansei engineering model. J. Sichuan Univ. 2016, 48, 198–206. [Google Scholar]
- Yao, G.; Xue, C.; Wang, H. Method of bus modeling design based on image cognition. J. Southeast Univ. 2016, 46, 1198–1203. [Google Scholar]
- Kampen, J.K.; Kampen, J.K. Reflections on and test of the metrological properties of summated rating, Likert, and other scales based on sums of ordinal variables. Measurement 2019, 137, 428–434. [Google Scholar] [CrossRef]
- Su, J.; Zhang, X.; Jing, N. Research on Entropy Evaluation of Product Modeling Image under Cognitive Differences. Mech. Des. 2016, 33, 105–108. [Google Scholar]
- Yasami, Y. A new knowledge-based link recommendation approach using a non-parametric multilayer model of dynamic complex networks. Knowl.-Based Syst. 2018, 143, 81–92. [Google Scholar] [CrossRef]
- Zhang, S.; Wu, J. Research on Form of Wall Set Charging Pile Base on BP Neural Networks. J. Graph. 2017, 143, 12. [Google Scholar]
- Yan, B.; Zhang, L.; Chu, X. Modeling of user perception evaluation based on convolution neural network. J. Shanghai Jiaotong Univ. 2019, 53, 844–851. [Google Scholar]
- Yao, C.; Yang, P.; Liu, Z. Load Forecasting Method Based on CNN-GRU Hybrid Neural Network. Power Syst. Technol. 2019, 2058, 11–2410. [Google Scholar]
Figure 1.
The theoretical framework diagram.

Figure 2.
Task flow chart of user image prediction model. Virtual reality (VR) and convolutional neural network (CNN).
Figure 2.
Task flow chart of user image prediction model. Virtual reality (VR) and convolutional neural network (CNN).

Figure 3.
Pictures of the selected sample.


Figure 4.
Verified samples of the Kansei Engineering (KE) model.

Figure 5.
Comparison chart of the experimental values and actual values.

Figure 6.
Experimental scenario.

Figure 7.
Model training results.

Figure 8.
Comparison of the forecast results.


Table 1.
Extracting words from Big Data analysis.
| Project | Explanation | |||||||
|---|---|---|---|---|---|---|---|---|
| Big Data Collection Text |   | |||||||
| Image words | Words | Weight | Words | Weight | Words | Weight | Words | Weight |
| Technological | 0.892 | Safe | 0.838 | Comfortable | 0.7382 | Accurate | 0.7149 | |
| Balanced | 0.925 | Trustworthy | 0.810 | Intuitive | 0.7254 | Shock | 0.7235 | |
| Easy to use | 0.921 | Efficient | 0.814 | Natural | 0.7469 | Oppression | 0.7294 | |
| Concise | 0.877 | Fashionable | 0.837 | Advanced | 0.7155 | Agile | 0.6849 | |
| Tidiness | 0.878 | Trustworthy | 0.761 | Calm | 0.7233 | Friendly | 0.6953 | |
| Tedious | 0.881 | Quiet | 0.769 | Interesting | 0.7341 | Uncomfortable | 0.7112 | |
| Novel | 0.872 | Rich | 0.815 | Endurable | 0.7383 | Vertigo | 0.6935 | |
| Beautiful | 0.863 | Compact | 0.774 | Dynamic | 0.7619 | Happy | 0.6971 | |
| Rational | 0.859 | Moderate | 0.744 | Relaxed | 0.7121 | Cheap | 0.6991 | |
| Clear | 0.853 | Convenient | 0.790 | Experience | 0.7161 | Texture | 0.7006 | |
| Coordinated | 0.838 | Orderliness | 0.765 | Smooth | 0.7011 | Trivial | 0.7035 | |
| Symmetrical | 0.826 | Cheerful | 0.739 | Clear | 0.7056 | Disgusting | 0.6887 | |
| Gorgeous | 0.819 | Complicated | 0.755 | Feel good | 0.7149 | Patient | 0.6934 | |
Table 2.
The preliminary screening results of the perceptual image semantic words.
| Adjective | Votes | Adjective | Votes | Adjective | Votes | Adjective | Votes | Adjective | Votes |
|---|---|---|---|---|---|---|---|---|---|
| Technological | 14 | Beautiful | 9 | Trustworthy | 12 | Intuitive | 12 | Natural | 11 |
| Balanced | 16 | Rational | 12 | Efficient | 11 | Convenient | 9 | Advanced | 12 |
| Easy to use | 10 | Clear | 13 | Fashionable | 12 | Orderliness | 13 | Calm | 8 |
| Concise | 8 | Coordinated | 11 | Dependable | 12 | Cheerful | 10 | Interesting | 13 |
| Tidiness | 9 | Symmetrical | 8 | Quiet | 9 | Complicated | 13 | Endurable | 18 |
| Tedious | 5 | Gorgeous | 4 | Rich | 9 | Comfortable | 10 | Relaxed | 10 |
| Novel | 9 | Safe | 13 | Compact | 16 | Intuitive | 12 |
Table 3.
The 33 × 33 similarity matrix of the perceptual image semantic vocabulary.
| Word 1 | Word 2 | Word 3 | Word 4 | …… | Word 30 | Word 31 | Word 32 | Word 33 | |
|---|---|---|---|---|---|---|---|---|---|
| Word 1 | 0 | 0 | 0 | 0 | …… | 1 | 5 | 12 | 0 |
| Word 2 | 0 | 0 | 0 | 0 | …… | 0 | 3 | 0 | 1 |
| Word 3 | 0 | 0 | 0 | 0 | …… | 3 | 2 | 1 | 4 |
| Word 4 | 0 | 0 | 0 | 0 | …… | 9 | 0 | 0 | 11 |
| …… | …… | …… | …… | …… | …… | …… | …… | …… | …… |
| Word 30 | 1 | 0 | 3 | 9 | …… | 0 | 1 | 0 | 5 |
| Word 31 | 3 | 3 | 2 | 0 | …… | 1 | 0 | 4 | 1 |
| Word 32 | 14 | 0 | 1 | 0 | …… | 0 | 4 | 0 | 2 |
| Word 33 | 0 | 1 | 2 | 13 | …… | 5 | 1 | 1 | 0 |
Table 4.
The results of the semantic grouping of perceptual images *.
| Group | Perceptual Image Words |
|---|---|
| Group 1 | Technological, Rational |
| Group 2 | Balanced, Neat, Coordinated, Symmetrical |
| Group 3 | Easy to use, Efficient, Convenient, Cheerful, Intuitive |
| Group 4 | Concise, Monotonous, Calm |
| Group 5 | Tedious, Rich, Compact, Complicated |
| Group 6 | Novel, Advanced, Fashionable, Interesting |
| Group 7 | Beautiful, Endurable, |
| Group 8 | Gorgeous, Dynamic, |
| Group 9 | Safe, Trustworthy |
| Group 10 | Comfortable, Natural, Relaxed |
* According to the obtained perceptual image words, these are formed into antisense adjective pairs: scientific and technological–traditional; clear–vague; fashionable–conservative; balanced–unbalanced; neat–fragmentary; dynamic–quiet; easy to use–difficult to use.
Table 5.
Classification of the VR interface design elements.
| Project | Category | Category Definition |
|---|---|---|
| Function Operation Area Layout X1 | Aggregation C11 | The layout of functional operation areas is relatively concentrated. |
| Discrete C12 | The layout of the functional operation area is relatively discrete. | |
| Visual browsing order X2 | Few browse interruptions C21 | The number of user visual browsing interruptions is small. |
| Browse interrupted the second time C22 | The user’s visual browsing is interrupted many times. | |
| Visual graphic area X3 | Round chamfering C31 | Chamfered curve |
| Square chamfer C32 | Chamfered straight lines are the main ones. | |
| Color X4 | Cold tone C41 | The overall hue is colder |
| Warm tone C42 | The overall hue is warmer. | |
| Grey tone C43 | Colorless phase, gray tone | |
| Transparency X5 | Transparency C51 | In VR space, the following objects can be seen through the interface. |
| No transparency C52 | In VR space, the following objects cannot be seen through the interface. | |
| Font X6 | Rough gesture C61 | The font is thick |
| Gesticulate meticulously C62 | The font strokes are thinner. |
Table 6.
The perceptual image data of the VR interface based on quantitative theory class I.
| X1 | X2 | X3 | X4 | X5 | X6 | ||||||||
|---|---|---|---|---|---|---|---|---|---|---|---|---|---|
| Sample | C11 | C12 | C21 | C22 | C31 | C32 | C41 | C42 | C43 | C51 | C52 | C61 | C62 |
| 1 | 1 | 0 | 1 | 0 | 0 | 1 | 1 | 0 | 0 | 0 | 1 | 1 | 0 |
| 2 | 0 | 1 | 0 | 1 | 0 | 1 | 0 | 0 | 1 | 0 | 1 | 0 | 1 |
| 3 | 0 | 1 | 0 | 1 | 0 | 1 | 0 | 1 | 0 | 0 | 1 | 0 | 1 |
| 4 | 0 | 1 | 1 | 0 | 1 | 0 | 0 | 1 | 0 | 0 | 1 | 1 | 0 |
| 5 | 0 | 1 | 1 | 0 | 0 | 1 | 0 | 1 | 0 | 1 | 0 | 0 | 1 |
| 6 | 1 | 0 | 0 | 1 | 0 | 1 | 0 | 0 | 1 | 0 | 1 | 0 | 1 |
| 7 | 0 | 1 | 0 | 1 | 0 | 1 | 0 | 1 | 0 | 0 | 1 | 0 | 1 |
| 8 | 1 | 0 | 1 | 0 | 1 | 0 | 0 | 1 | 0 | 1 | 0 | 1 | 0 |
| 9 | 0 | 1 | 1 | 0 | 1 | 0 | 1 | 0 | 0 | 0 | 1 | 1 | 0 |
| 10 | 0 | 1 | 1 | 0 | 1 | 0 | 1 | 0 | 0 | 0 | 1 | 1 | 0 |
| 11 | 1 | 0 | 1 | 0 | 1 | 0 | 0 | 0 | 1 | 0 | 1 | 1 | 0 |
| 12 | 0 | 1 | 0 | 1 | 0 | 1 | 0 | 1 | 0 | 0 | 1 | 0 | 1 |
| 13 | 1 | 0 | 1 | 0 | 1 | 0 | 0 | 1 | 0 | 0 | 1 | 1 | 0 |
| 14 | 1 | 0 | 0 | 1 | 0 | 1 | 0 | 0 | 1 | 0 | 1 | 0 | 1 |
| 15 | 1 | 0 | 1 | 0 | 1 | 0 | 0 | 1 | 0 | 0 | 1 | 1 | 0 |
| 16 | 0 | 1 | 1 | 0 | 1 | 0 | 1 | 0 | 0 | 1 | 0 | 0 | 1 |
Table 7.
The evaluation factors of the VR interface perceptual image.
| Sample | Perceptual Image Words | |||
|---|---|---|---|---|
| Technological | Clear | …… | Easy to Use | |
| 1 | 3.725 | 4.25 | …… | 2.725 |
| 2 | 1.125 | 3.725 | 3.275 | |
| 3 | 2.225 | 3.735 | …… | 1.865 |
| …… | …… | …… | …… | …… |
| 16 | 1.935 | 3.45 | …… | 1.985 |
Table 8.
Relationship of “easy to use” and perceptual image words.
| Design Project | Design Category | Design Category | Score Range |
|---|---|---|---|
| Function Operation Area Layout X1 | C11 | 2.004 | 3.024 |
| C12 | −1.821 | ||
| Visual browsing order X2 | C21 | 1.007 | 2.125 |
| C22 | 0.417 | ||
| Visual graphic area X3 | C31 | 0.001 | 0.010 |
| C32 | −0.009 | ||
| Color X4 | C41 | −0.013 | 0.912 |
| C42 | 0.433 | ||
| C43 | −0.479 | ||
| Transparency X5 | C51 | −0.001 | 1.191 |
| C52 | 3.190 | ||
| Font X6 | C61 | −0.011 | 1.713 |
| C62 | 2.702 | ||
| Constant term | 0.782 | ||
| Decision coefficient | 0.876 | ||
| Multiple correlation coefficient | 0.936 |
Table 9.
The results of the analysis on the relationship between perceptual image words.
| Perceptual Image Words | X1 | X2 | X3 | X4 | X5 | X6 |
|---|---|---|---|---|---|---|
| Technological | 0.067 | 0.983 | 2.798 | 2.191 | 1.640 | 2.655 |
| Clear | 3.395 | 2.747 | 0.773 | 1.065 | 1.966 | 0.544 |
| Fashionable | 0.824 | 1.424 | 2.010 | 2.912 | 13.191 | 0.713 |
| Balanced | 1.694 | 0.596 | 0.039 | 0.479 | 0.745 | 0.442 |
| Neat | 1.147 | 1.235 | 1.436 | 0.938 | 2.481 | 0.167 |
| Dynamic | 0.681 | 1.903 | 3.017 | 2.149 | 1.127 | 1.076 |
| Easy to use | 3.524 | 2.908 | 0.269 | 0.358 | 1.080 | 1.075 |
Table 10.
Correlation of the design elements.
| Clustering Coefficient | Number of Triangles | Eigenvector | Degree | Closeness Centrality | Hub | Diagram | |
|---|---|---|---|---|---|---|---|
| Layout | 0.7 | 7 | 0.83 | 6 | 0.63 | 0.4 |  |
| Contrast color | 0.6 | 6 | 0.86 | 6 | 0.7 | 0.41 | |
| Browse order jump | 0.6 | 6 | 0.78 | 6 | 0.63 | 0.37 | |
| Transparency | 0.5 | 3 | 0.66 | 5 | 0.63 | 0.32 | |
| Total tone | 0.4 | 6 | 1 | 7 | 0.77 | 0.47 | |
| Font wireframe | 0.33 | 1 | 0.41 | 4 | 0.58 | 0.19 | |
| Icon shape | 0.13 | 2 | 0.81 | 7 | 0.77 | 0.38 | |
| Chamfer shape | 0 | 0 | 0.21 | 3 | 0.46 | 0.09 |
Table 11.
Validation of the sample design element image data.
| X1 | X2 | X3 | X4 | X5 | X6 | ||||||||
|---|---|---|---|---|---|---|---|---|---|---|---|---|---|
| Sample | C11 | C12 | C21 | C22 | C31 | C32 | C41 | C42 | C43 | C51 | C52 | C61 | C62 |
| 1 | 1 | 0 | 1 | 0 | 0 | 1 | 1 | 0 | 0 | 0 | 1 | 1 | 0 |
| 2 | 0 | 1 | 1 | 0 | 0 | 1 | 0 | 1 | 0 | 0 | 1 | 0 | 1 |
| 3 | 1 | 0 | 0 | 1 | 1 | 0 | 0 | 1 | 0 | 0 | 1 | 1 | 0 |
| 4 | 0 | 1 | 0 | 1 | 1 | 0 | 0 | 0 | 1 | 0 | 1 | 1 | 0 |
Table 12.
Verification of the sample “Calculated Value—Actual Value” correlation coefficient.
| Sample | T |
|---|---|
| 1 | 0.122 |
| 2 | 0.163 |
| 3 | 0.104 |
| 4 | 0.482 |
Table 13.
Comparison of the schemes.
| Category | Option 1 | Option 2 | |
| VR scene map |  |  | |
| Visual elements | Interface layout: neat and balanced, Operation area: located in the upper left corner of the interface Shape of chamfered area: round Primary colors: dark cool tones Contrast in the overall tone of the mission area: contrast in brightness Visual browsing in descending order: left to right, top to bottom. Graphical form: combined Interface transparency: none | Interface layout: neat and balanced Operation area: located in the middle and lower part of the interface Features of the graphic area chamfering: bevel chamfering Main tone: cool tones Contrast between the mission area and overall tone: lightness contrast Visual browsing order: left to right, top to bottom The proportion of pictures and texts is balanced Interface transparency: yes | |
| Cognitive load | Mental needs Physical demand Time Demand Task Performance Degree of effort Frustration Total Load Value | 7.8 | 6.571 |
| 5.2667 | 3.714 | ||
| 7.067 | 3.786 | ||
| 10.067 | 3.929 | ||
| 5.067 | 4.857 | ||
| 7.067 | 3.428 | ||
| 109.6 | 62.06667 | ||
| Task Selection Time | 1.734 | 1.12 | |
| Category | Option 3 | Option 4 | |
| VR scene map |  |  | |
| Visual elements | Interface layout: simple and balanced Operation area: upper left corner of the interface Chamfering form of the visual graphic area: square chamfering Overall color palette of the visualization interface: cool light colors Contrast between the mission area and the overall color palette: brightness contrast Visual order of navigation: left to right, top to bottom. Due to less combination of pictures and texts, more text than graphics, so fewer visual transitions and pauses.Interface transparency: none | Interface layout: rich and balanced. Operating area: upper left corner Visual area chamfering method: oblique chamfering Total color palette of the visualization interface: cool and dark. Contrast between task selection area and overall color palette: no contrast Visual browsing order: left to right, top to bottom. Fewer visual transitions and pauses due to less combination of graphics and more graphics than text. Interface transparency: none | |
| Cognitive load | Mental needs Physical demand Time Demand Task Performance Degree of effort Frustration Total Load Value | 9.867 | 7.933 |
| 6.733 | 7.267 | ||
| 6.4 | 6.4 | ||
| 6 | 7.867 | ||
| 6.2 | 9 | ||
| 6.667 | 9.2 | ||
| 106.27 | 120.33 | ||
| Task Selection Time | 1.317 | 1.903 | |
Publisher’s Note: MDPI stays neutral with regard to jurisdictional claims in published maps and institutional affiliations. |
© 2020 by the authors. Licensee MDPI, Basel, Switzerland. This article is an open access article distributed under the terms and conditions of the Creative Commons Attribution (CC BY) license (http://creativecommons.org/licenses/by/4.0/).
Share and Cite
MDPI and ACS Style
Fu, Q.; Lv, J.; Tang, S.; Xie, Q. Optimal Design of Virtual Reality Visualization Interface Based on Kansei Engineering Image Space Research. Symmetry 2020, 12, 1722. https://doi.org/10.3390/sym12101722
AMA Style
Fu Q, Lv J, Tang S, Xie Q. Optimal Design of Virtual Reality Visualization Interface Based on Kansei Engineering Image Space Research. Symmetry. 2020; 12(10):1722. https://doi.org/10.3390/sym12101722
Chicago/Turabian StyleFu, Qianwen, Jian Lv, Shihao Tang, and Qingsheng Xie. 2020. "Optimal Design of Virtual Reality Visualization Interface Based on Kansei Engineering Image Space Research" Symmetry 12, no. 10: 1722. https://doi.org/10.3390/sym12101722
Note that from the first issue of 2016, this journal uses article numbers instead of page numbers. See further details here.