Improved Control Strategy of MMC–HVDC to Improve Frequency Support of AC System


Power and Energy Laboratory, School of Electrical Engineering, Korea University, Seoul 02841, Korea
*
Author to whom correspondence should be addressed.
Appl. Sci. 2020, 10(20), 7282; https://doi.org/10.3390/app10207282
Submission received: 22 September 2020
/
Revised: 10 October 2020
/
Accepted: 15 October 2020
/
Published: 18 October 2020
(This article belongs to the Special Issue High Voltage Direct Current Transmission for Grid Services in Electric Power Systems II)
Abstract
:With the continuous development of power electronics technology, variable-speed offshore wind turbines that penetrated the grid system caused the problem of inertia reduction. This study investigates the frequency stability of synchronous, offshore wind-farm integration through a modular-multilevel-converter high-voltage direct-current (MMC–HVDC) transmission system. When full-scale converter wind turbines (type 4) penetrate the AC grid, the AC system debilitates, and it becomes difficult to maintain the AC system frequency stability. In this paper, we present an improved inertial-response-control method to solve this problem. The mathematical model of the synchronous generator is based on the swing equation and is theoretically derived by establishing a MMC–HVDC. Based on the above model, the inertia constant is analyzed using a model that integrates the MMC–HVDC and offshore synchronous generator. With the new improved control method, a more sensitive and accurate inertia index can be obtained using the formula related to the effective short-circuit ratio of the AC system. Moreover, it is advantageous to provide a more accurate inertial control evaluation for AC systems under various conditions. Furthermore, the impact of the MMC–HVDC on system safety is assessed based on the capacitor time constant. This simulation was implemented using the PSCAD/EMTDC platform.
1. Introduction
In recent years, with continuous attention focused on energy issues, the traditional power grid is facing a major challenge of renewable energy generation. In Korea, with the promulgation of the “2030 renewable energy” plan, the power generation of renewable sources will reach 20% of the total power generation in 2030, as proposed in the plan. The penetration level of renewable energy sources will increase to a large extent in the next 10 years, that is, it will penetrate the traditional power grid. In particular, maintaining the stability of the power system despite increase in the penetration level of offshore wind turbines is a significant challenge.
Type 4 (full-scale converter wind turbines, or FSC-WTs) is a variable-speed wind turbine that is widely used for offshore wind-power generation. However, extensive type-4 penetration into the power system causes the onshore-power-grid inertia to decrease, debilitating the onshore AC power grid and making it difficult to maintain its frequency stability. As the type-4 wind turbine has a series connected to a back-to-back converter, in severe cases, it may cause power outages [1]. In a previous study [2], it was proposed that the type-4 wind turbine be integrated with a weaker grid because the phase-locked-loop parameters may cause low-frequency and synchronous-oscillation problems, as proven via dynamic modeling and eigenvalue analysis. In [3], it was recommended that the system inertia be controlled by measuring the DC voltage of the converter instead of using the conventional method of measuring the system frequency. This method was verified using the hardware-in-loop method. The authors in [4] suggested that the inertial response constant of a single wind turbine was not the inertial response constant of the wind power system; this was verified using field measurements and simulations. In [5], the author explained in detail the calculation method of the inertia constant of the wind turbine with a formula.
The authors in [6,7,8,9] presented several different frequency control strategies for the entire power grid, which consisted of offshore wind power plants and line-commutated converter high-voltage direct-current transmission systems (LCC–HVDC). A control strategy that controls the grid frequency instead of reactive power control is used to control the firing angle of the HVDC rectifier or the DC-link current in [6] because of the reactive power controlled by the rotor-side converter and rectifier converter. A coordinated control strategy provides primary frequency control for the grid, which consists of the LCC-HVDC and offshore wind turbines [7].
The authors in [8] state that the modeling of the weak grid is highly sensitive to the effective DC inertia constant and effective short circuit ratio, which connect to the LCC-HVDC. The authors in [9] presented a full-order and four-state model to verify the frequency droop control strategy proposed in this paper, which can improve the frequency response speed of the weak grid. The voltage-source converter HVDC (VSC-HVDC) has more advantages than the traditional HVDC system. As is well-known, the LCC-HVDC is required to consider commutation failure, especially in the case of weak AC grids, and this may be more likely to cause grid failures. The short board of LCC-HVDC is mentioned in [10]. Compared with VSC-HVDC, LCC-HVDC has a high risk of the stability.
The VSC-HVDC is not required to consider commutation failure and can compensate for a weak AC grid owing to its good active-power and reactive-power regulation ability. In [11], a virtual impedance control strategy is proposed to improve the dynamic adjustment ability. Furthermore, the VSC–HVDC can also transmit energy to the system via the passive power grid, especially when the wind turbine is subject to external interference. In a previous study [12], the stability of the power system was verified by the root-locus method. The system consists of hybrid offshore wind power plants and VSC-HVDC. The authors in [13] proposed a method for maintaining the system frequency through coordinated control of the DC voltage. A similar power synchronization control is adopted to regulate the fault ride-through capability into a combined power grid of offshore wind power plants and VSC-HVDC [14,15,16]. But the proposed method increases the communication risk at both converter sides, which makes the control method more complicated.
As mentioned in [17,18], a new method called inertia emulation control is used to help the VSC-HVDC evaluate the inertia of the synchronous generator (SG) when faults occur and the load is changed. This method mainly uses DC link capacitors. Because of capacity limitations, compensation capabilities are limited. The authors in [19] proposed inertial and primary frequency support to control the frequency of the VSC-HVDC and wind turbines. The majority of modern modular multilevel converter high-voltage direct-current systems (MMC-HVDC) use half-bridge modeling with a DC breaker. The detailed MMC-HVDC model in [20,21] uses average-value models, which can simplify the calculation. In [4], a high-level capacity of a type-4 wind turbine farm replaces the traditional SG and penetrates the system, resulting in a reduction in the available inertia of the system and oscillation of the system frequency stability.
In this paper, an improved inertia control method is presented to evaluate the frequency stability of a hybrid system consisting of a full-scale-converter-wind-turbine (FSCWT) farm connected to an onshore AC system via an MMC-HVDC. The derivation of the improved control method is based on a synchronous-generator inertial mathematical model and hybrid AC/DC mathematical model. The inertia index is based on the inertia emulation control presented in [16,17]. First, it uses the capacitor of the MMC-HVDC sub-modulation instead of the DC link capacitor to provide the virtual inertia constant without capacity limitation. The index is also calculated based on the effective short circuit ratio (ESCR) of the AC system. An improved method can aid the AC system in maintaining its frequency stability. The index is intended to provide a simpler and faster calculation method for the system inertia constant. As the strength of the onshore AC system is different, this index will provide the minimum inertia constant required for system frequency stability. This function eliminates the inconvenience caused by other auxiliary measurement methods.
The rest of this paper is organized as follows. Section 2 presents the inertia of the power system. Section 3 describes the mathematical model of the MMC-HVDC, and the new index is calculated to evaluate the stability of the hybrid AC/DC system according to the ESCR of the AC system. Furthermore, in this section, the advantages of the proposed method are considered. The obtained results represent the stability of the entire system under AC faults or a small disturbance, and the verification of the correctness of the method is presented in Section 4. The conclusions of this study are presented in Section 5.
2. Inertia of Power System
In recent years, power electronics has significantly improved. Many types of power equipment are no longer directly connected to the power grid. However, they are connected to the power grid through various types of converters. This can greatly improve the power quality of the entire grid, but it also poses a great challenge in maintaining the stability of the power system. This article presents an investigation of the challenge of maintaining frequency stability caused by the popularity of converter technology. In this study, the offshore wind turbines considered were FSCWTs.
The generator directly connects to the back-to-back converter in series. As its output power is regulated by the converter, it loses the inertial constant. The penetration capacity of the renewable source is significantly high. The grid can be operated in a low-inertia state. Therefore, the power system cannot maintain its frequency stability under normal conditions [4,5]. To consider the transmission distance and system stability adjustment of offshore wind power, it is considered that the MMC-HVDC is used to connect the offshore wind power and onshore AC system, and the active power and reactive power control of MMC-HVDC can provide system stability control for AC systems.
The virtual inertia control proposed in this article will accurately and quickly provide the required minimum inertia constant based on the strength of the AC system without the root locus analysis method or eigenvalue analysis method [12]. The detailed results are discussed in Section 5. In addition, this consideration combines the above advantages with those of the onshore AC system to provide a more suitable inertial control for the system. This also means that we are still able to clearly determine whether the system is in a stable state without confirming the eigenvalue.
3. Control Method of MMC-HVDC System
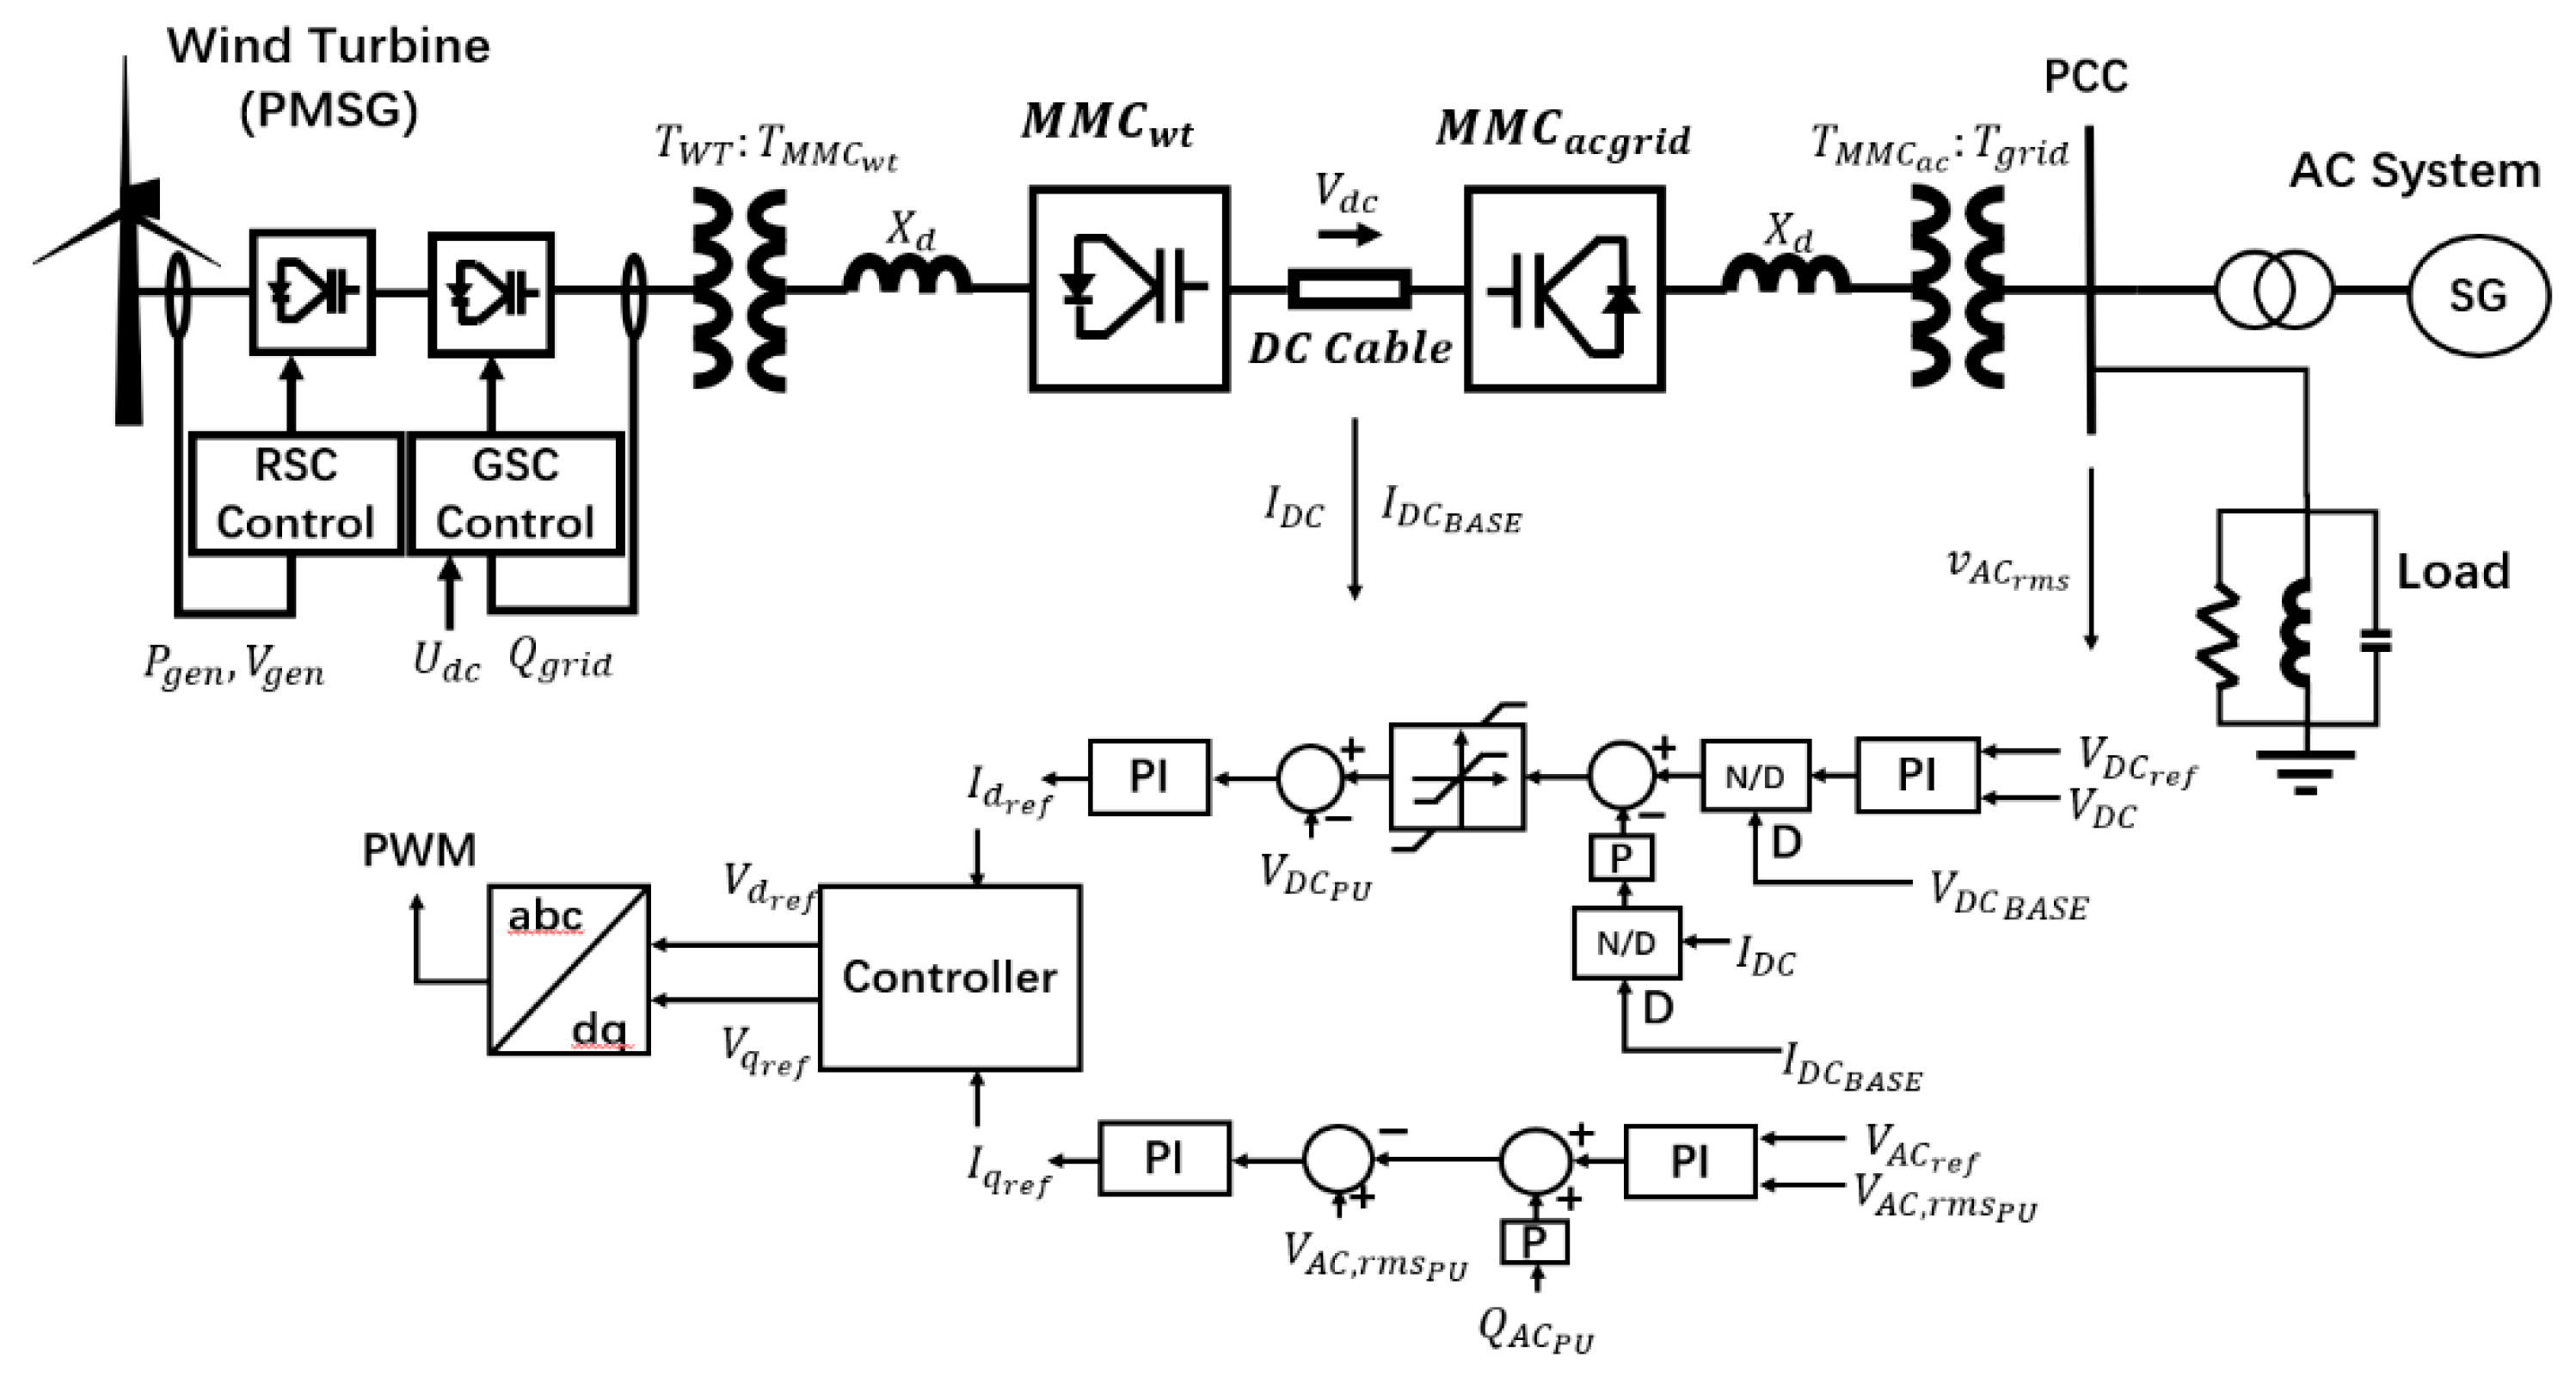
As shown in Figure 1, the entire system consists of three parts: offshore wind power farm, onshore AC system, and MMC-HVDC system. In addition, the system has an HVDC cable and an AC cable in the modeling. In the MMC converter on the side of the offshore wind power farm, the P-Q control strategy is adopted, and on the side of the MMC converter connected to the onshore AC system, the Vdc-Q control strategy is adopted. The Vdc control strategy is used to quickly adjust the output active power from the MMC converter side. The reactive power control strategy aids the AC system in quickly adjusting the voltage level by using a set-point value. First, the detailed modeling of the controller of the MMC-HVDC is described in this section.
The MMC-HVDC model contains three-phase legs, and each phase contains an upper and lower arm. Each item’s upper and lower arms have an equal number of submodules in series. There is a capacitor inside each submodule for storing energy. Therefore, a DC-link capacitor is not required for MMC-HVDC [20,22]. For detailed information on MMC-HVDC modeling, please refer to [20,22].
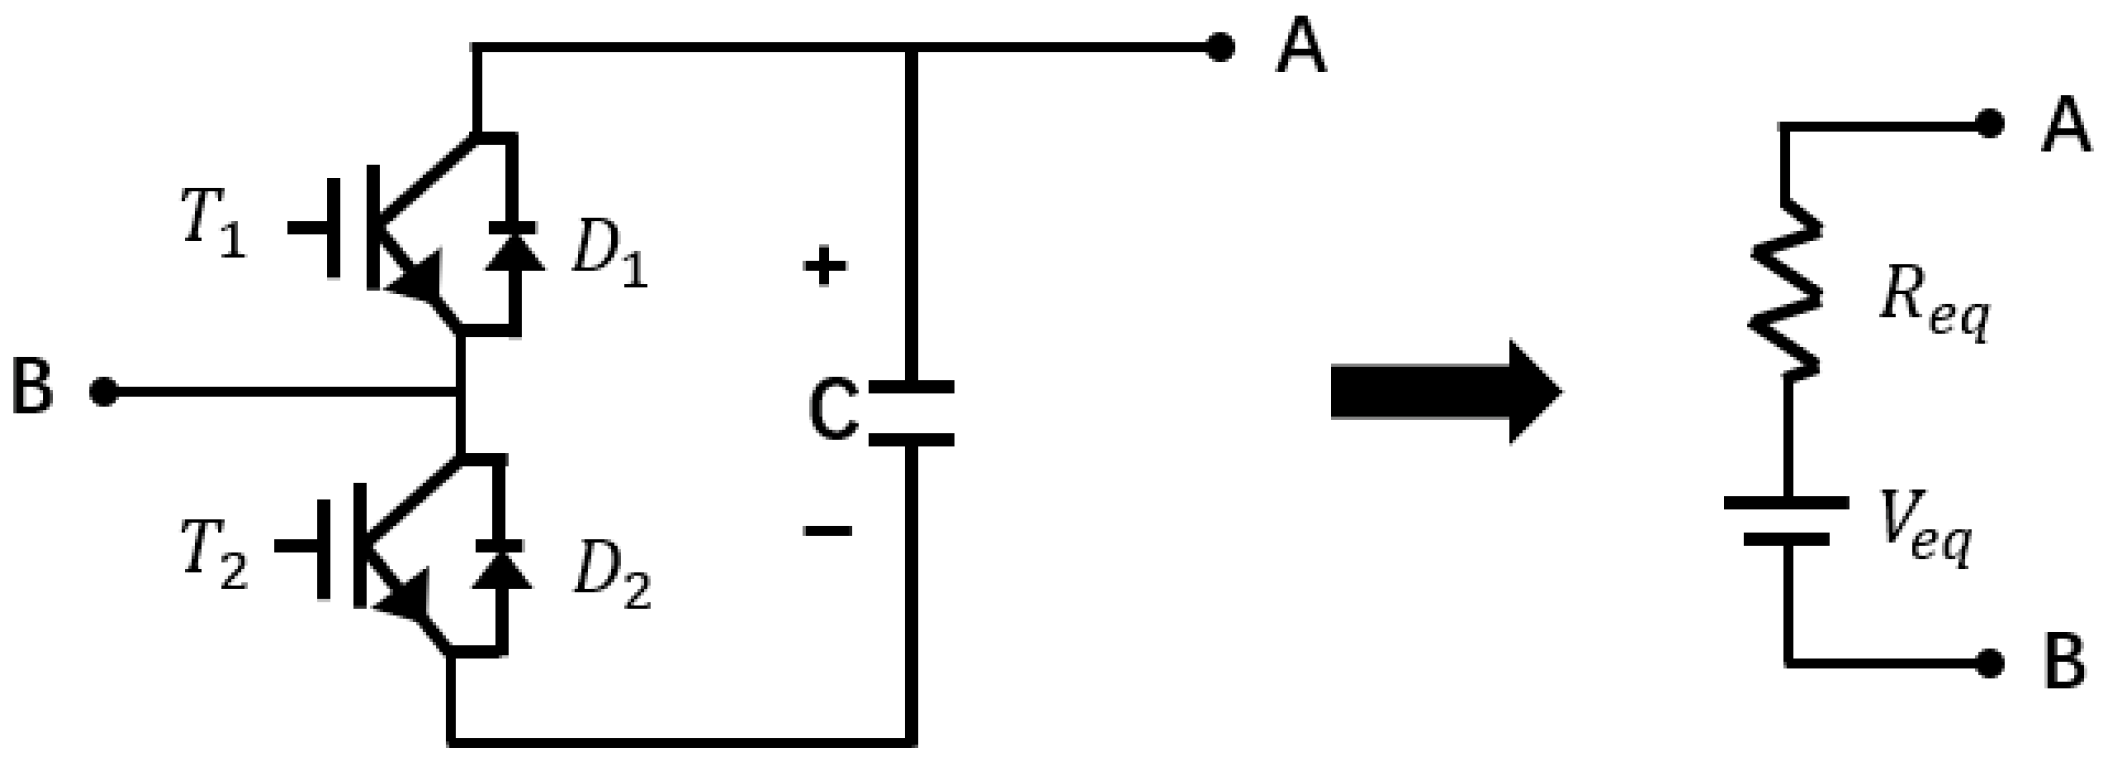
Figure 2 shows a detailed model of the half-bridge submodule, which contains two insulated-gate bipolar transistor (IGBT) switches and a capacitor for energy storage. Figure 2 presents the equivalent circuit of the submodule, which simplifies the mathematical formula.
and are the corresponding resistances of the IGBT switches, is the voltage of the capacitors, and is the resistance of the capacitor. The changes in these values depend on changes in the time and state of the IGBT switch. Therefore, the time-varying formula can be expressed as follows:
where is the time-varying voltage value of the upper/lower arm of the MMC-HVDC. Figure 1 shows the basic control strategy logic for the MMC-HVDC control. Figure 1 presents a d-axis control strategy that provides two control strategies—active power control and DC voltage control—for calculating the d-axis current reference. Figure 1 also presents a q-axis control strategy that provides two control strategies—reactive power control and AC voltage control—for calculating the q-axis current reference. The proportional-integral (PI) controller is used primarily in the control strategy loop of this study.
To ensure that the voltage components of the HVDC and the point of common coupling (PCC) are the same, we use a phase-locked loop (PLL) to realize control. When the voltage of the PCC is maintained at a constant value and balanced (), the MMC dynamic formula is as follows:
where is the d-component voltage of the DC side, is the d-component voltage of the AC side, and R, L, and X are the equivalent resistance, inductance, and impedance of the three-phase reactor and transformer, respectively. The current component required for control by the proportional-integral (PI) controller is calculated, and the MMC voltage reference component is then calculated. Using these calculated values, the active power and reactive power output of the MMC-HVDC injected into the AC system through the dq-to-abc transformer is then calculated. This formula is as follows:
where is the active power injected into the AC system for calculating the d-component reference current, and is the reactive power injected into the AC system for calculating the q-component reference current.
4. Improved Inertia Control of MMC-HVDC
4.1. Effective Short-Circuit Ratio (ESCR) for AC Systems
The improved inertia control proposed in this study can be used to control the frequency stability of AC systems of various strengths. For the single-line HVDC-fed system, consideration of the interaction effects from other lines is unnecessary. Therefore, in this study, the effective short-circuit ratio (ESCR) is used to assess the robustness of the onshore AC system. In addition, the ESCR takes into consideration the reactive power injected into the system from the reactive power compensator. The ESCR accurately represents the robustness of the AC system. The ESCR formula is as follows:
where is the rated MVA of the AC system, is the reactive power injected into the AC system, and is the rated active power of the HVDC.
4.2. Synchronous Generator
The AC system considered herein is composed of an SG and a load. In the previous section, it was mentioned that when the type-4 offshore wind turbine penetrates the system, the back-to-back converter relationship cannot provide an effective inertia constant for the system, thus making it difficult for the AC system to maintain its frequency stability. In this case, the conventional SG of the onshore AC system has only an inertia constant, which can supply inertia to the entire system. The formula for the moment of inertia is derived from the kinetic energy theorem as follows:
where J is the inertia moment of the SG, and is the synchronous speed of the SG. The formula for the inertia time constant of the SG can be expressed as follows:
where is the initial rotor speed of the SG, is the rated active power of the SG, and is the inertia constant of the SG. In this case, the relationship equation is calculated using the torque of the SG and the inertia moment as follows:
By recombining (10) and (11), we obtain an improved equation for the acceleration torque of the SG as follows:
where is the acceleration torque of the SG, and is the rated torque of the SG. As it is an SG, the active power changes of the synchronous motor result in corresponding changes in the rotor speed, and (the active power changes of the synchronous motor) are the same as the changes in the rotor speed . The formula for the active power change is as follows:
In this case, we assume that
and are small and can be neglected. The improved formula of the inertia time constant of the SG can be calculated based on the rotor speed of the SG as follows:
As this study only takes the SG into consideration, the frequency of the SG is calculated based on the rotor speed, which is divided by . This is obtained via multiple experimental runs. In this case, the change in frequency is the same as the change in the rotor speed per unit. However, the new formula is as follows:
where is the rated frequency of the onshore AC system, and is the change in frequency that corresponds to a small system perturbation or load tripping in the AC system.
4.3. MMC-HVDC System
In this study, we used the half-bridge MMC-HVDC to connect the offshore wind turbine to the AC system. The MMC converters use vector control to calculate the reference current of the d-q transformer, and the offshore-side MMC converter uses the P-Q control strategy, which consists of the inner control loop, outer loop control, and PI controller. The AC-side MMC converter uses the Q-Vdc control strategy. This control method includes a circulating current suppression controller, which controls the sub-modulator voltage ripple caused by second harmonics. The capacitor time constant of the MMC-HVDC takes into consideration the characteristics of the number and capacitance of submodules as obtained using (10) as follows [21,23]:
where is the rated voltage of the MMC-HVDC system, is the per-arm number, is the per-arm capacitance of the MMC-HVDC, and is the rated MVA of the MMC-HVDC system.
The reference value of the DC voltage () can be calculated using the change in the system frequency caused by a system disturbance. As the DC voltage changes, the change in the active power will be the same in the capacitors of the MMC submodules. The short term is given as follows [24,25]:
where is the rated active power of the MMC-HVDC system. In this case, the MMC-HVDC is composed of a DC cable between the offshore-side MMC converter and the onshore-AC-side MMC converter. We assume that the DC cable loss is negligible. The formula for the change in the active power obtained using the capacitor time constant (17) is given as follows:
where is the active power injected from the offshore-wind-farm side, and is the active power transmitted to the onshore AC side. We assume that the cable losses are 0 for the entire system. We combine the Equations (15) and (18) to obtain the new equation of the inertia constant of the MMC-HVDC in the next subsection.
4.4. Improved Inertia Response Control
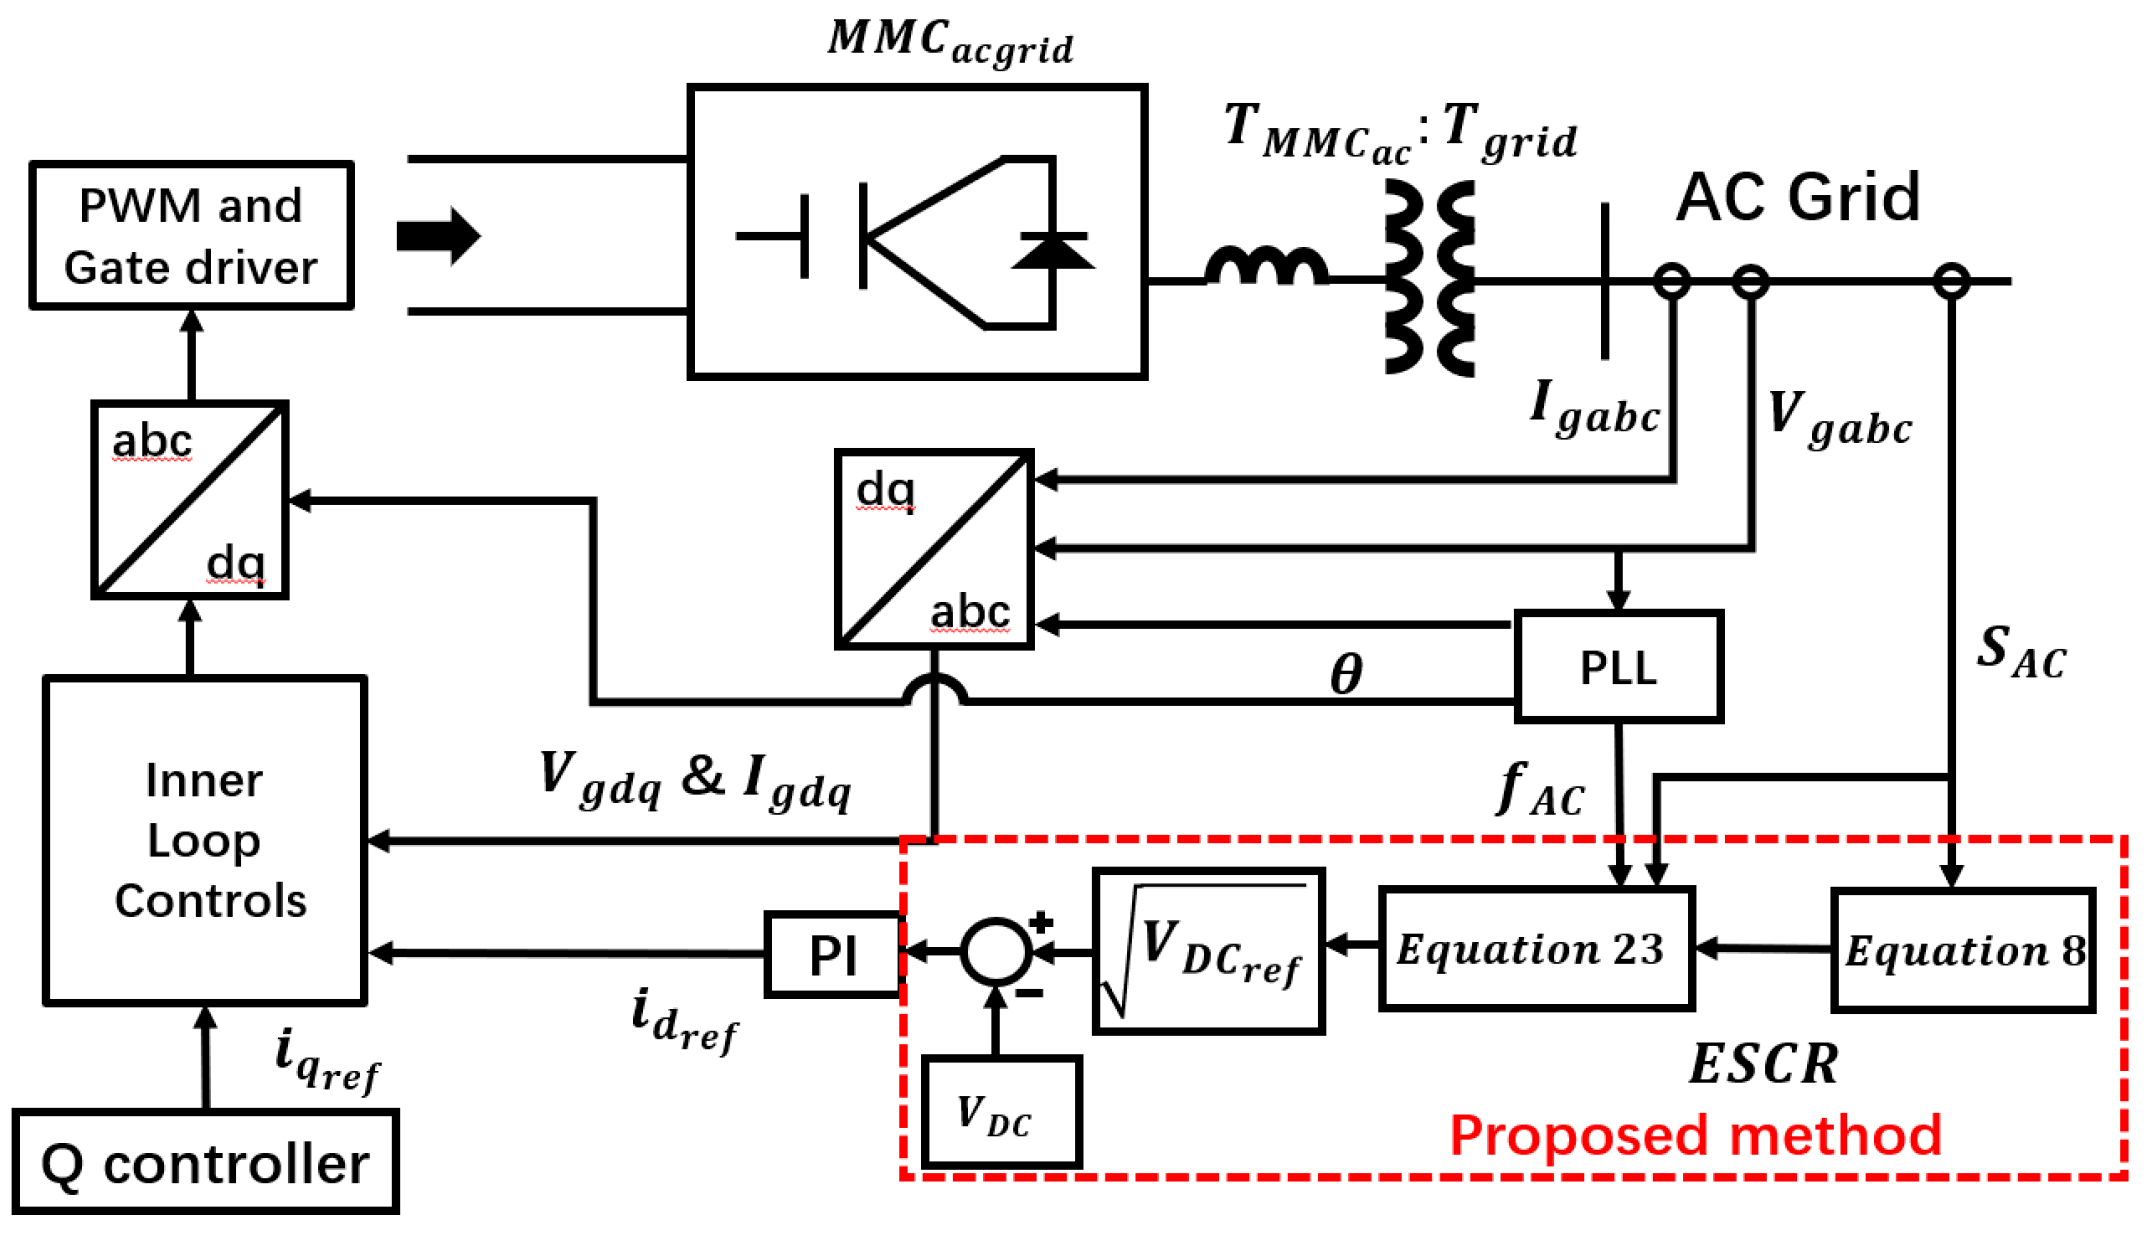
Figure 3 is an improved virtual inertia control loop diagram. The dq transformer gets values of the voltage and current from the AC system. Besides, as we need to calculate the ESCR of the AC system, we also get the rated power from the AC system. We use equation 8 to calculate ESCR and pass the result to (23). It can calculate the reference value of the DC voltage. Then, compare it with the actual DC voltage value to get the new result, and finally pass the signal generated by the PI controller to the inner loop controller. The value of required for dq transformer is calculated by phase lock loop (PLL). In addition, we use Q controller to control the reactive power of the system.
We assume that the loss of both the transformers and cables in the entire system is 0. If the entire power system is in a fully idealized state, then is equal to , and both are 0. A new formula can be obtained by combining (15) and (18) as follows:
By simultaneously integrating both sides of (19) and recombining it with (8), we obtain (20):
Based on (8) in subsection A, the formula for the inertia time constant of the MMC is calculated based on the ESCR of the AC system as follows:
where is the initial voltage of the MMC-HVDC, and is the actual voltage of the MMC-HVDC. As the capacitor of the submodules can store energy, the MMC-HVDC can supply reactive power to the system without additional reactive power compensators, and therefore is 0. Thus, we can calculate using (22) as follows [21,23,24,25]:
The DC voltage reference is not calculated solely based on the frequency variation of the AC system in (23). Furthermore, changes in the rated capacity of the AC system and the robustness of the AC system can also affect the reference calculation of the DC voltage, as shown in Figure 4. Using (23), we can easily control the frequency stability of AC systems at various intensities.
5. Case Study
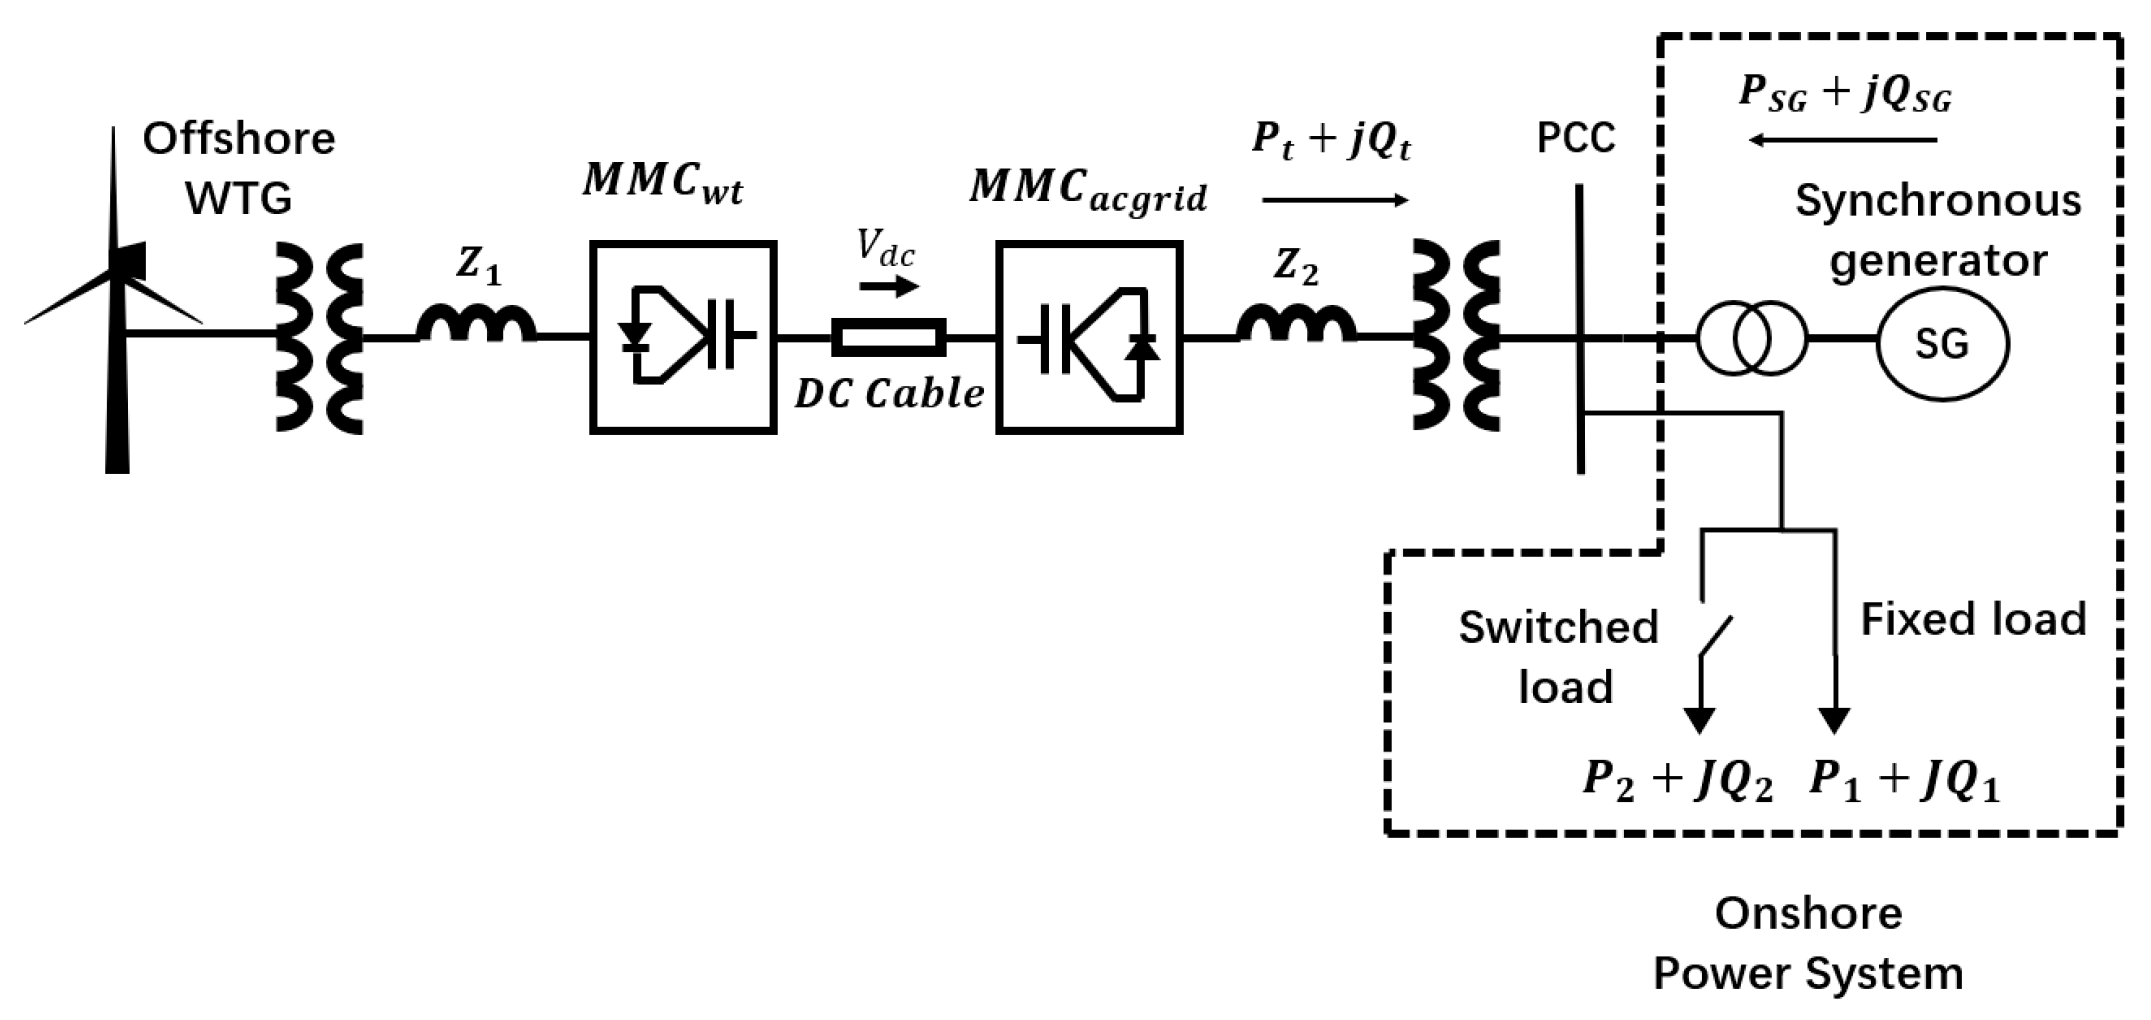
The simulation system diagram is shown in Figure 4. The ends of the MMC-HVDC are connected to the offshore wind turbine and onshore AC system. The offshore system is wind turbine generators. They transmit constant power energy to the onshore load system by using MMC-HVDC. The rated capacity of the type-4 offshore wind turbine is 5 MW. The onshore power system includes a synchronous generator and load system. There are two passive load connections on the onshore-AC-system side: is the fixed passive load, and is the other passive load caused by switching in or out. As the simulation is performed at different strengths of the AC system, the capacity of the passive load and parameters are detailed in a subsequent subsection. The inertia constant is calculated under the worst case of the allowable range. The 16 s before the simulation in this article is the initialization time of the system, which means that the system is not stable before 16 s. Therefore, the simulations in this article are all carried out after the 16 s. At 17 s, the switched load was disconnected from the system because of the opening of the switch.
For example, when the system is subjected to an external disturbance, the frequency fluctuation of the system is controlled within 49.2 Hz. Therefore, the calculated system frequency variation is 0.8 Hz. In addition, as the system does not consider the third resonance, the maximum range of the allowable voltage variation is 0.1 p.u. From the above data, the minimum inertia constant required for the MMC-HVDC inertia control is calculated. In this section, the improved inertia control and commonly used control are compared based on the simulation results. In addition, the simulation also takes into consideration the relationship between the inertia constant and the onshore-AC-system strength.
In Table 1, for detailed parameters refer to [26,27]. Through [26], we can know that the detailed parameters reference comes from the design of an MMC-HVDC system, which interconnected the 400-kV systems of France and Spain by 2013. This system has been put into use in practical applications, so the data of this system is reliable. In addition, the [26,27] have further proved the reliability of the parameters through simulation.
5.1. ESCR Is Low and 10% Changes in Load (ESCR = 1.7)
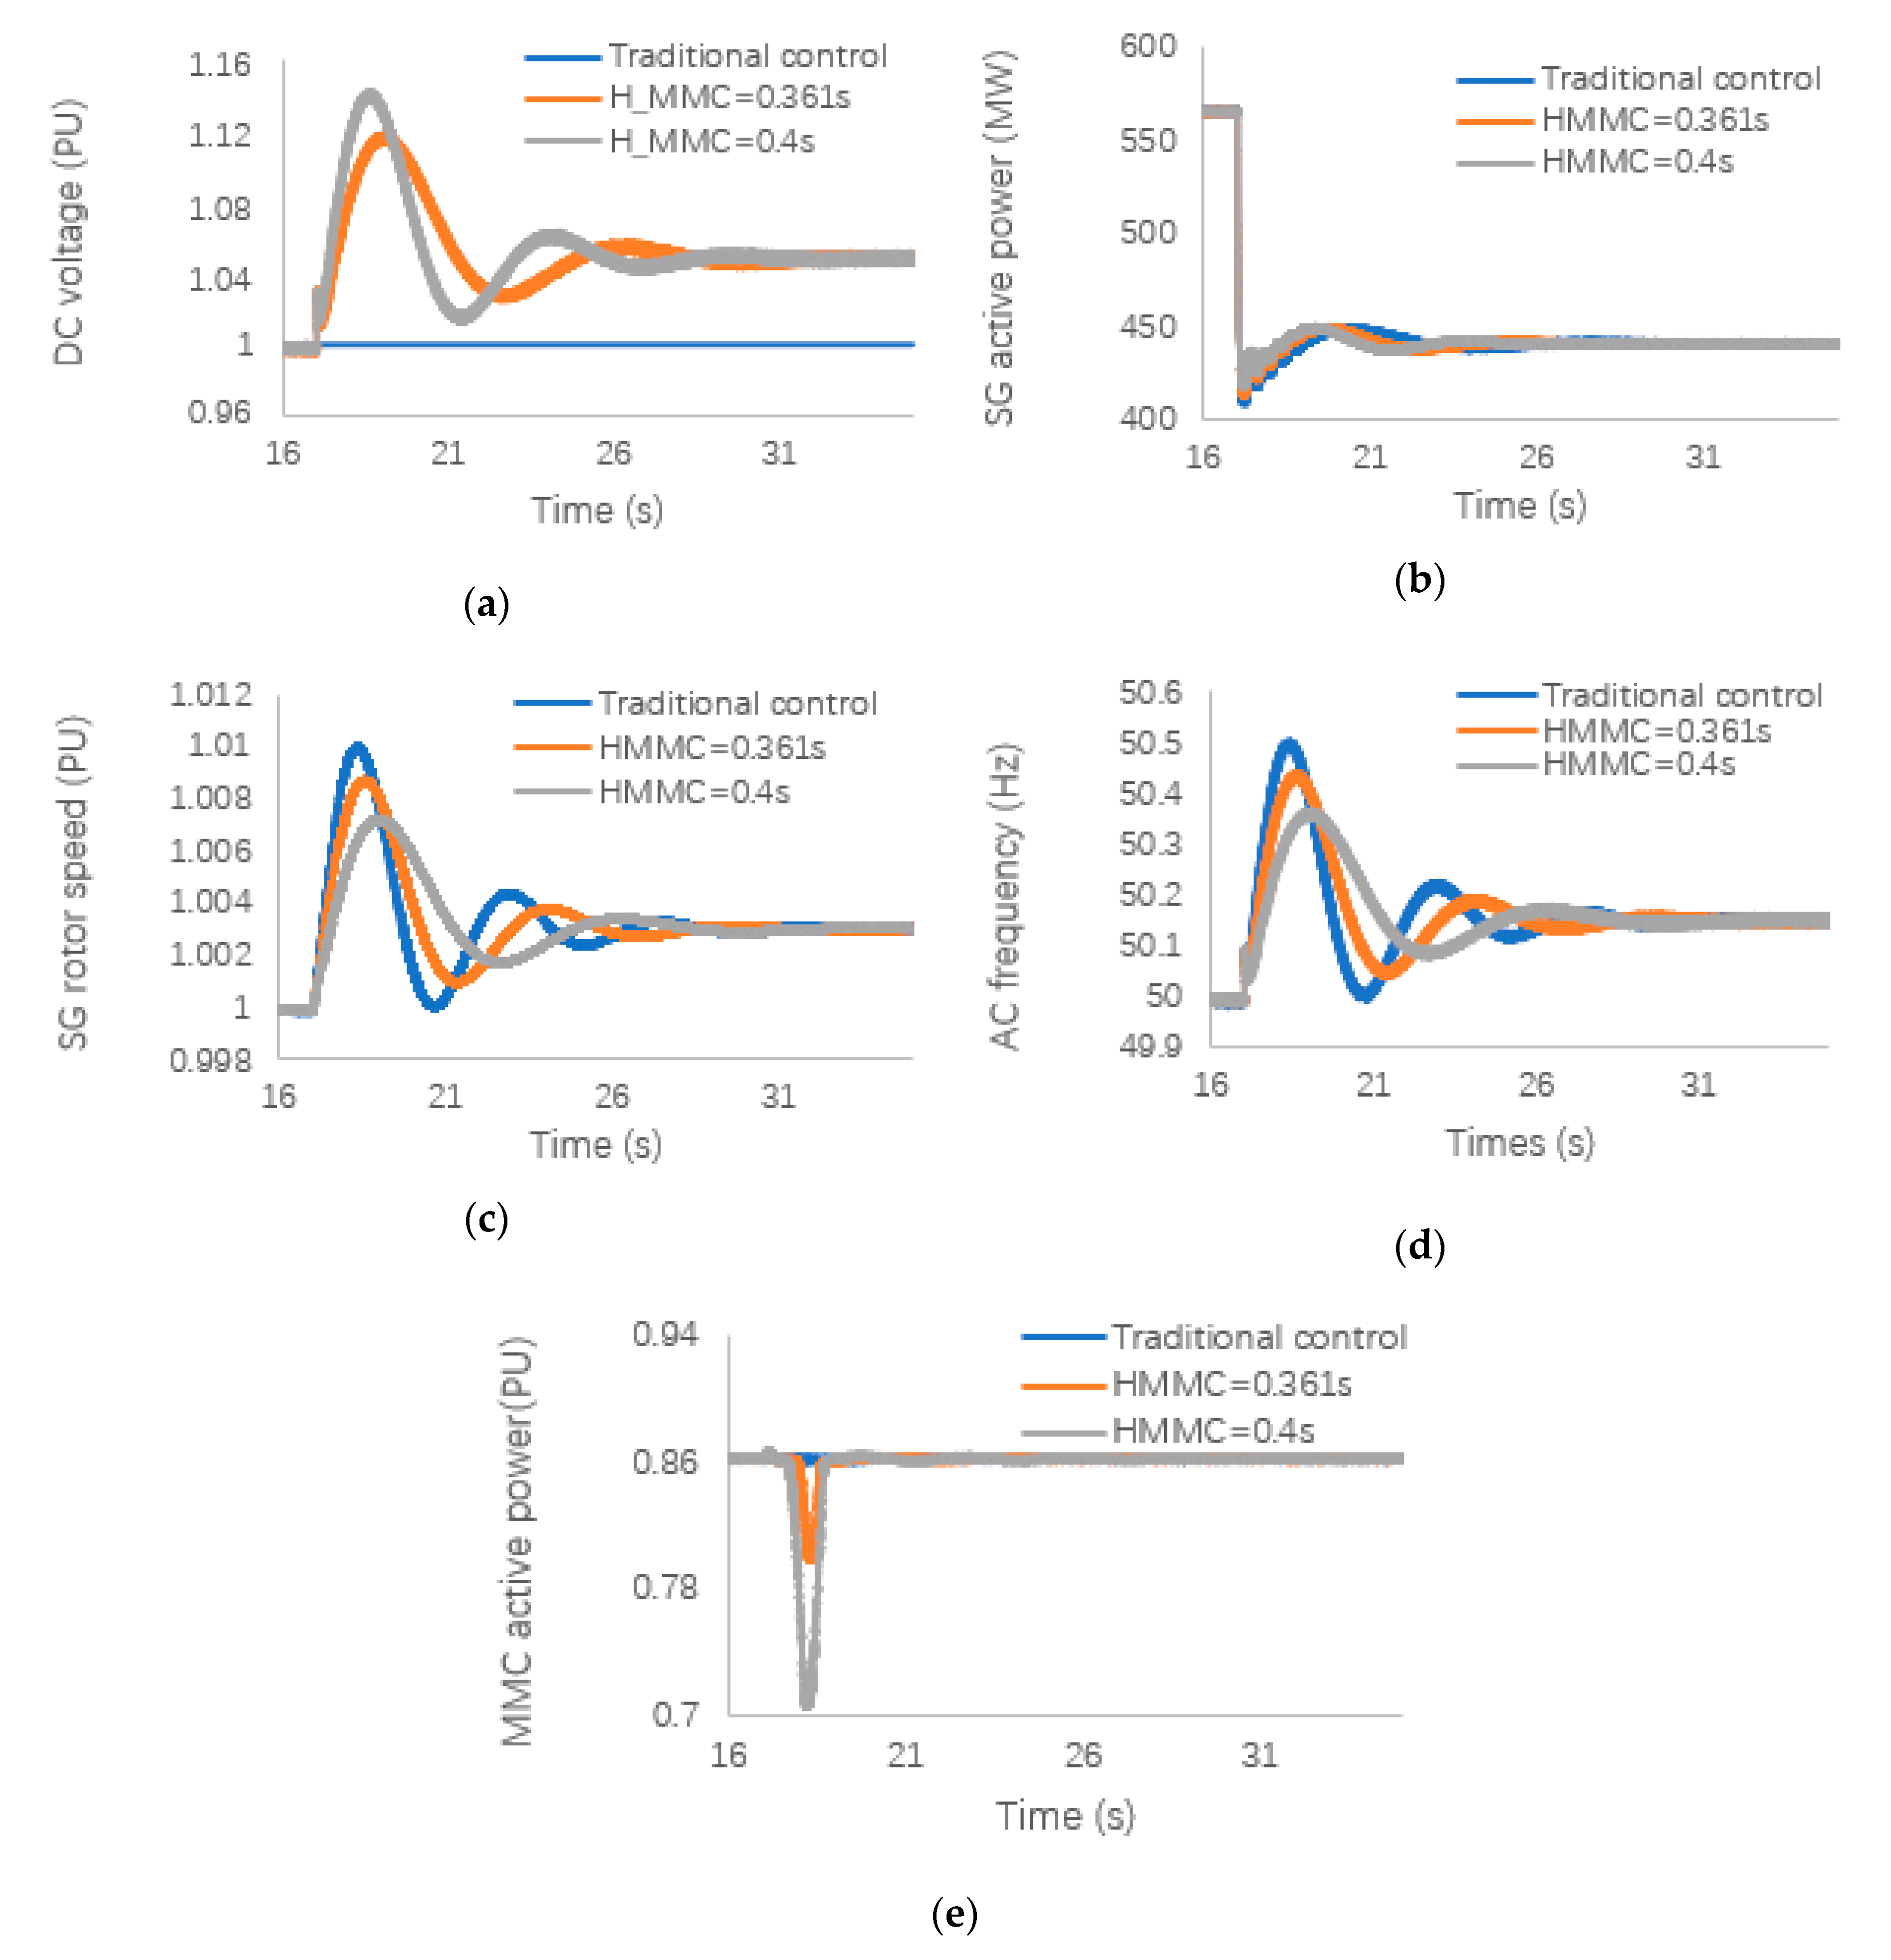
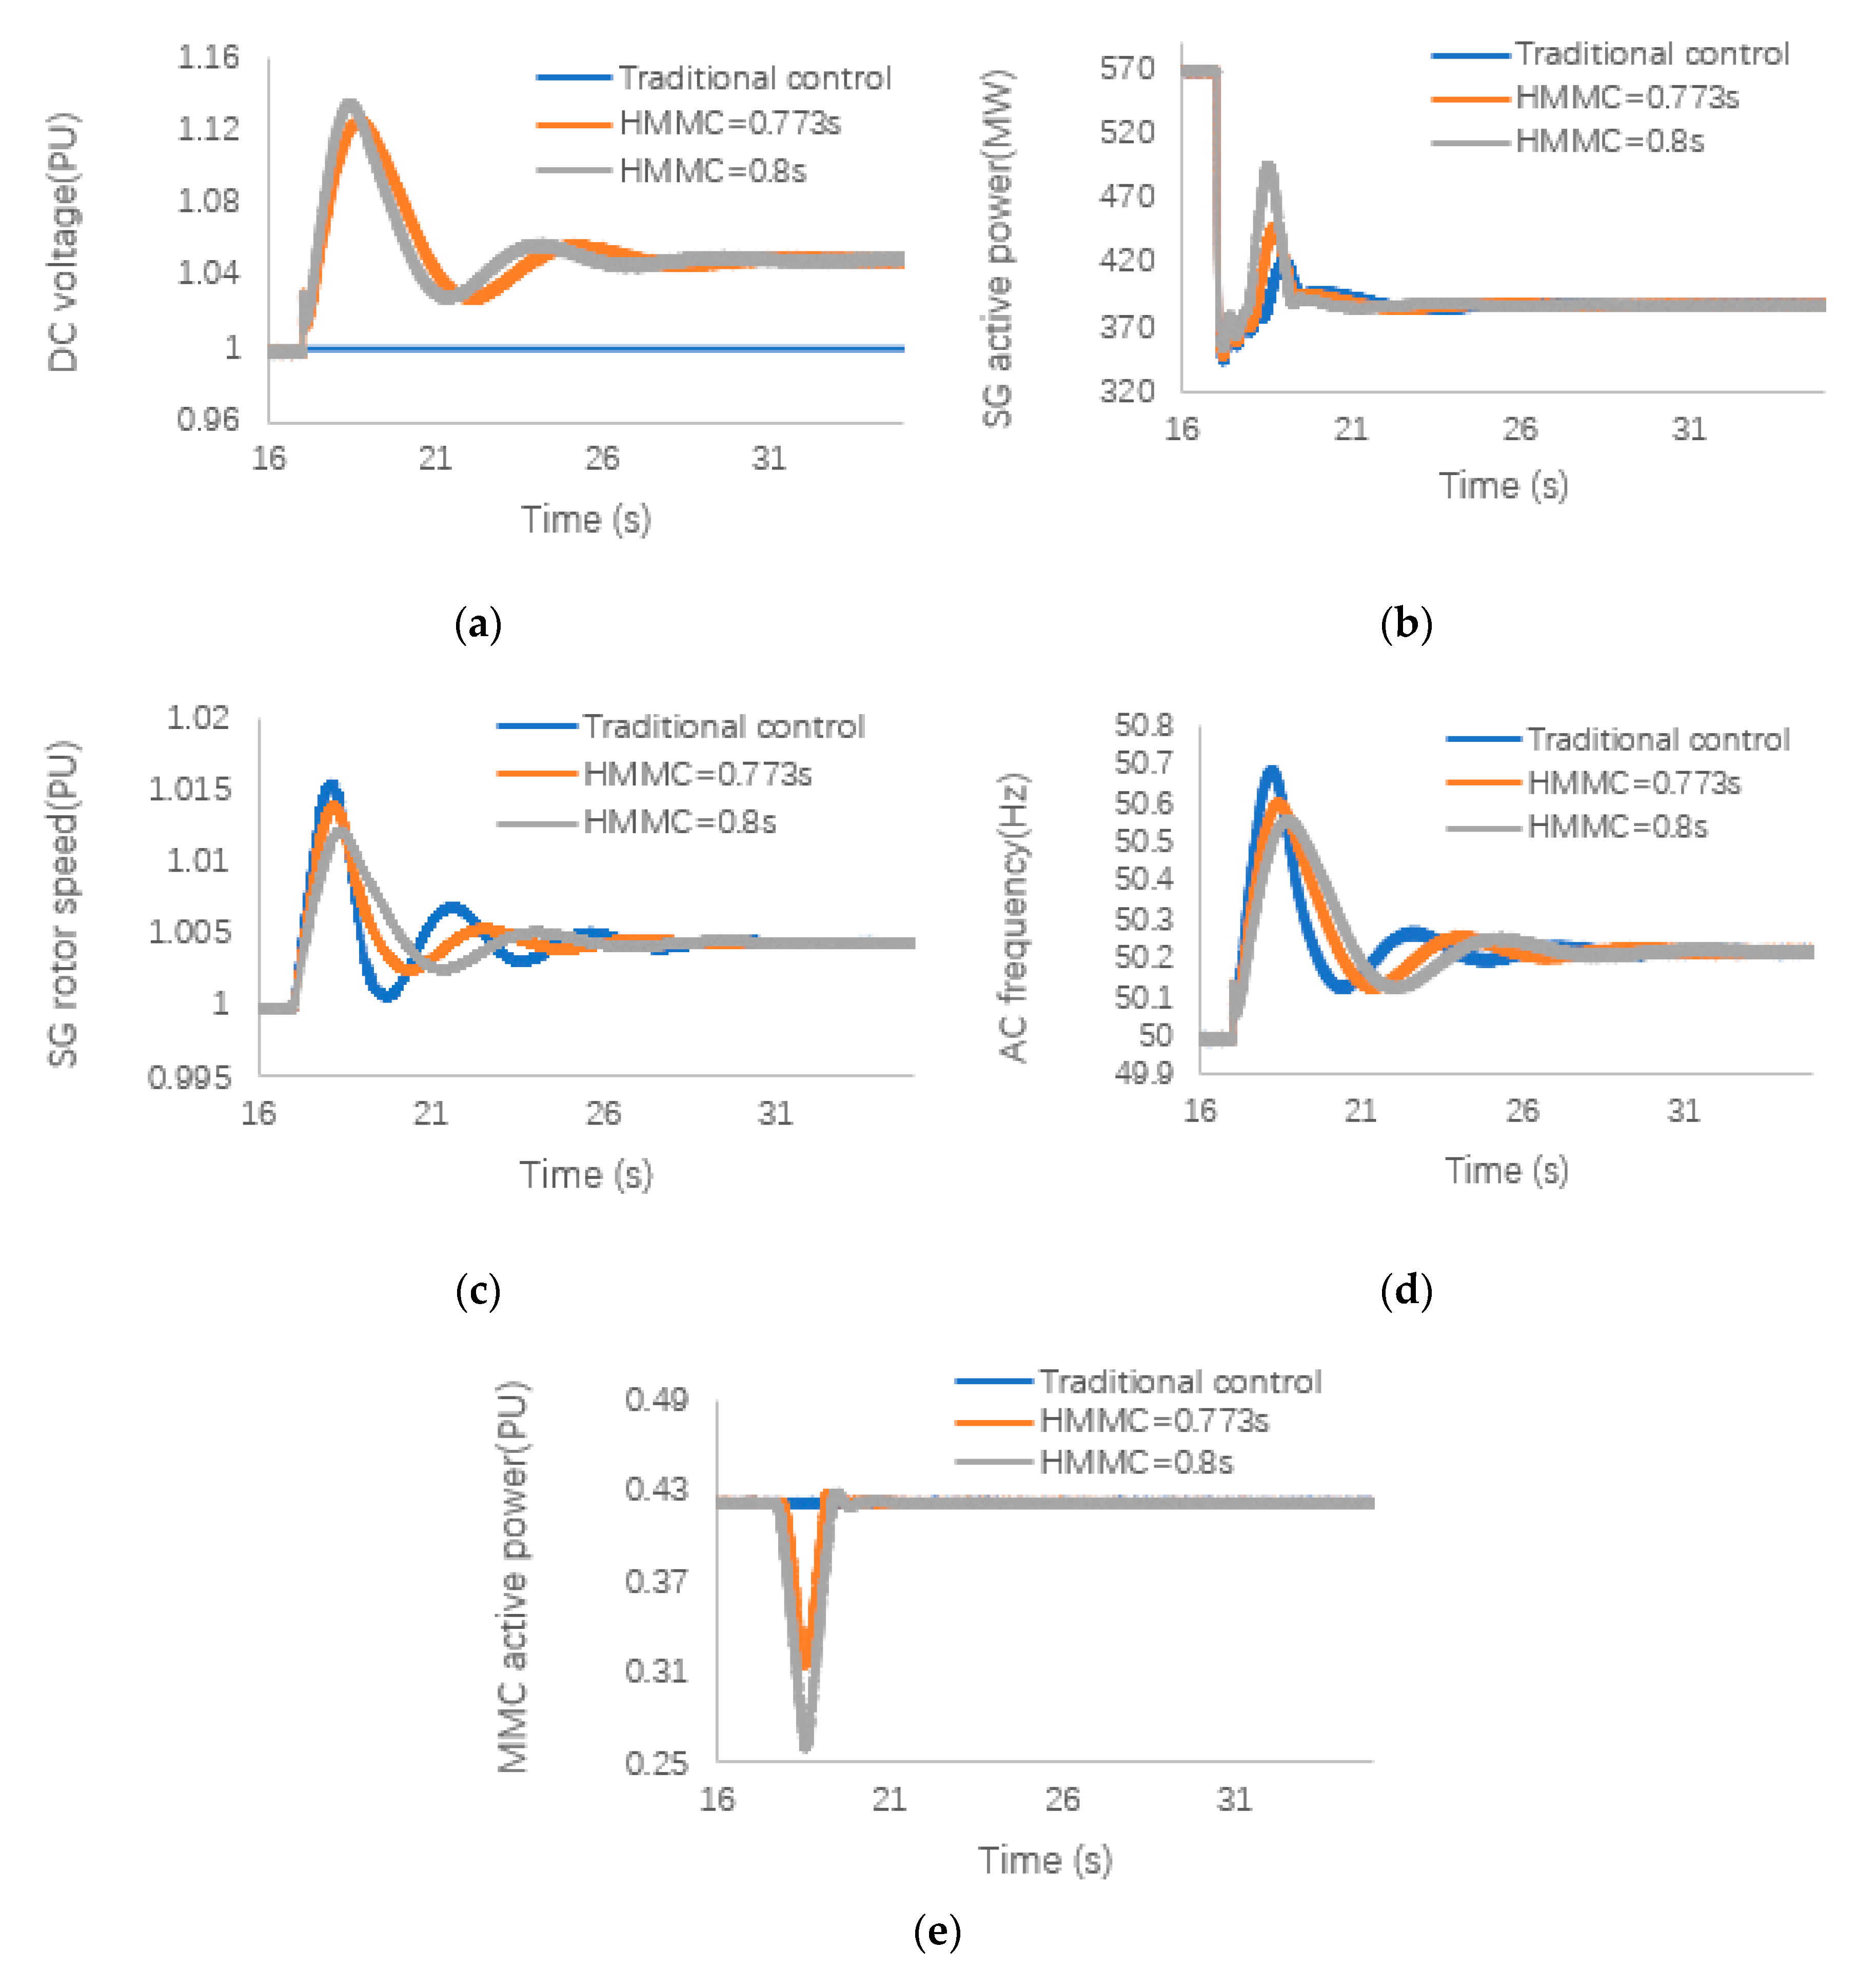
Case 1 was simulated when the onshore AC system was relatively weak. Thus, when the ESCR of the AC system is 1.7, the variable load is disconnected from the system when the system is under the stability condition. Figure 5 shows the changes in the AC-side MMC converter and onshore AC system when the system loses 10% of the load. Figure 5a shows the curve of the DC voltage of the AC-side MMC converter. From the figure, we observe that when the ESCR is 1.7, the corresponding value is 0.361 s.
When we increase to 0.4 s, we find that the curve amplitude increases, which indicates improved support of the inertia control for realizing system stability. It can also be observed that the output increases as increases, and the effective support of the inertia control for the system frequency regulation also increases. Figure 5b,c presents the active power and rotor speed of the SG in the AC system, respectively. It is clearly observed that when the system load is reduced, the SG’s rotor-speed change and active-power change are effectively obtained.
Figure 5d shows the frequency variation curve of the onshore AC system. Figure 5e shows the changes of MMC active power when the system is weak. As the load decreases, the active power is affected to a certain extent, but the normal operation of the system can still be guaranteed. As the system inertia constant increases, the system frequency stability is also greatly enhanced. The increase of the inertia constant can further reduce the oscillation of the system frequency. This once again verifies that the improved inertia control effectively supports the frequency stability of the system.
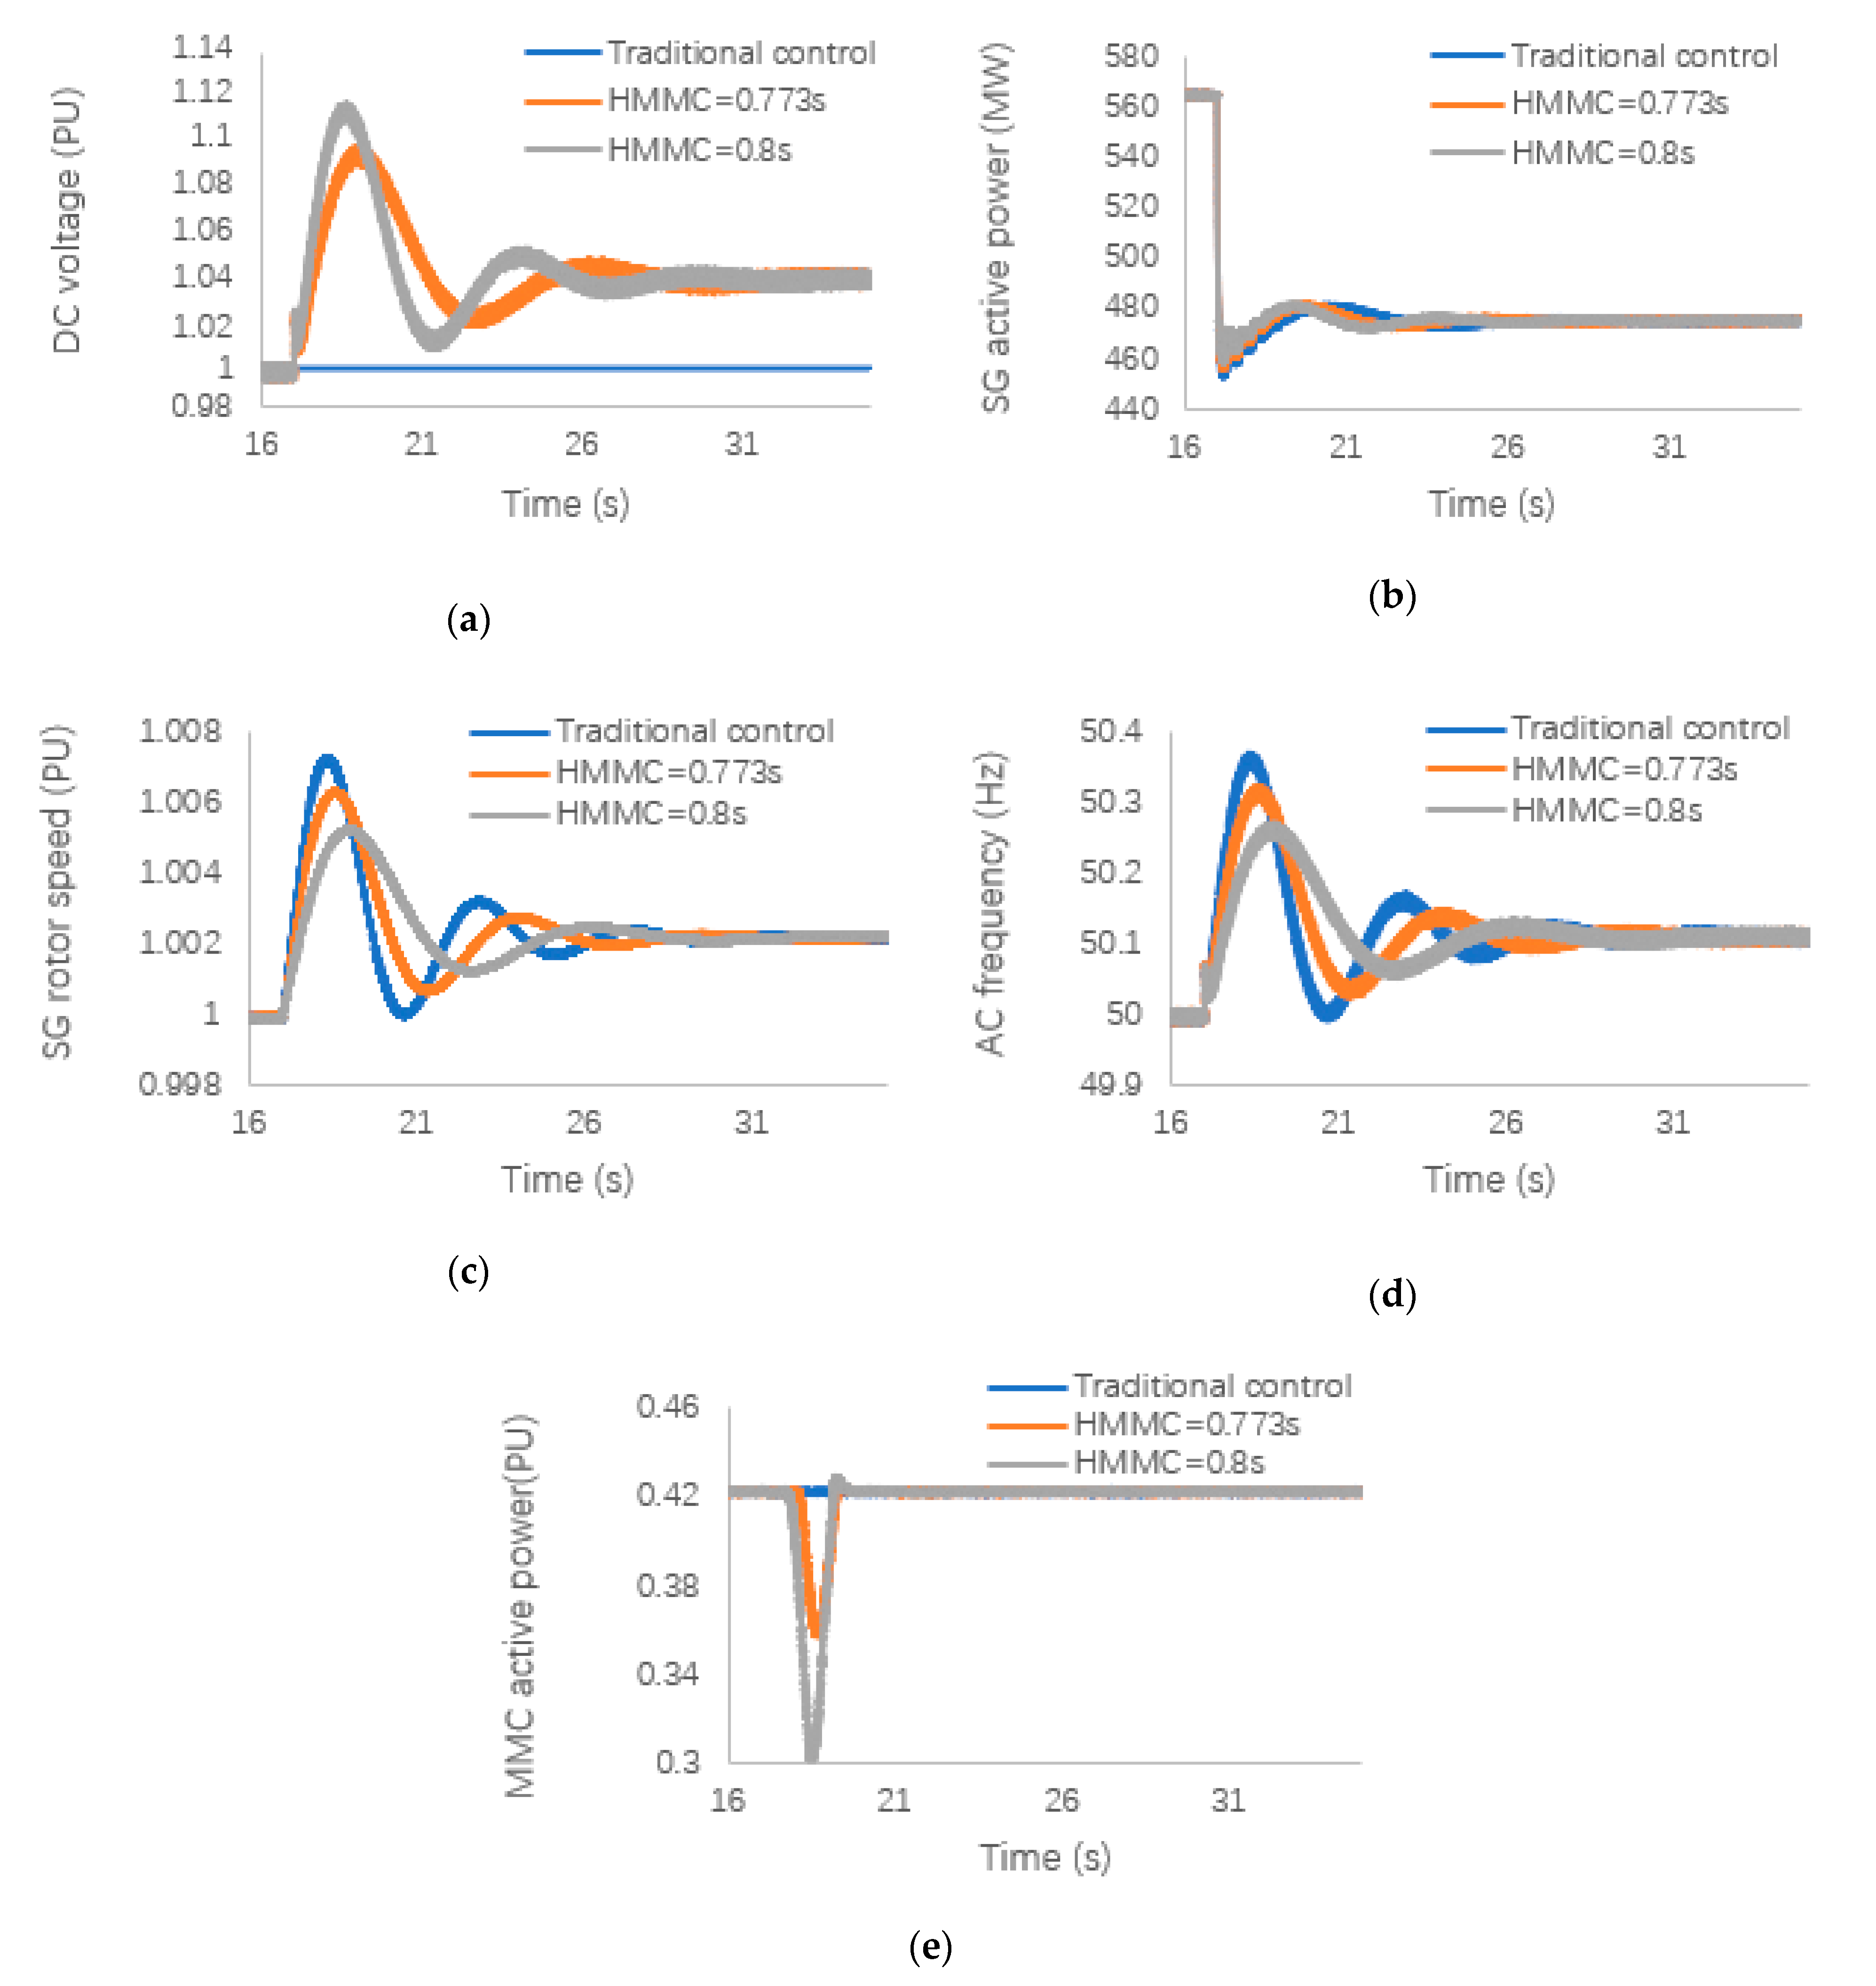
5.2. ESCR Is High and 10% Changes in Load (ESCR = 2.5)
In Case 2, the load decreased in the system when the strength of the AC system increased to 2.5. When the AC system became stronger, its frequency stability was enhanced compared to that in Case 1. As the strength of the AC system increased to 2.5, the corresponding also increased to 0.773 s. Figure 6a shows that the DC voltage can be effectively supported as increases. Both the MMC converter and the improved inertia control can be observed in Figure 6d,c, which further demonstrates that the improved control method is effective for maintaining the system stability, Figure 6e. When the system becomes a stronger system, it can be found that while its own stability has been improved, the impact on it is also reduced.
As the system becomes stronger, the required inertia constant also increases. With the enhancement of the AC system’s stability, the system’s inertia constant also increases, which implies that the MMC controller can provide a lower inertia constant to maintain the frequency stability of the system. The AC system variation in Figure 6d demonstrates that an improved inertia control can effectively control the system frequency stability.
5.3. ESCR Is Higher and 10% Changes in Load (ESCR = 3.5)
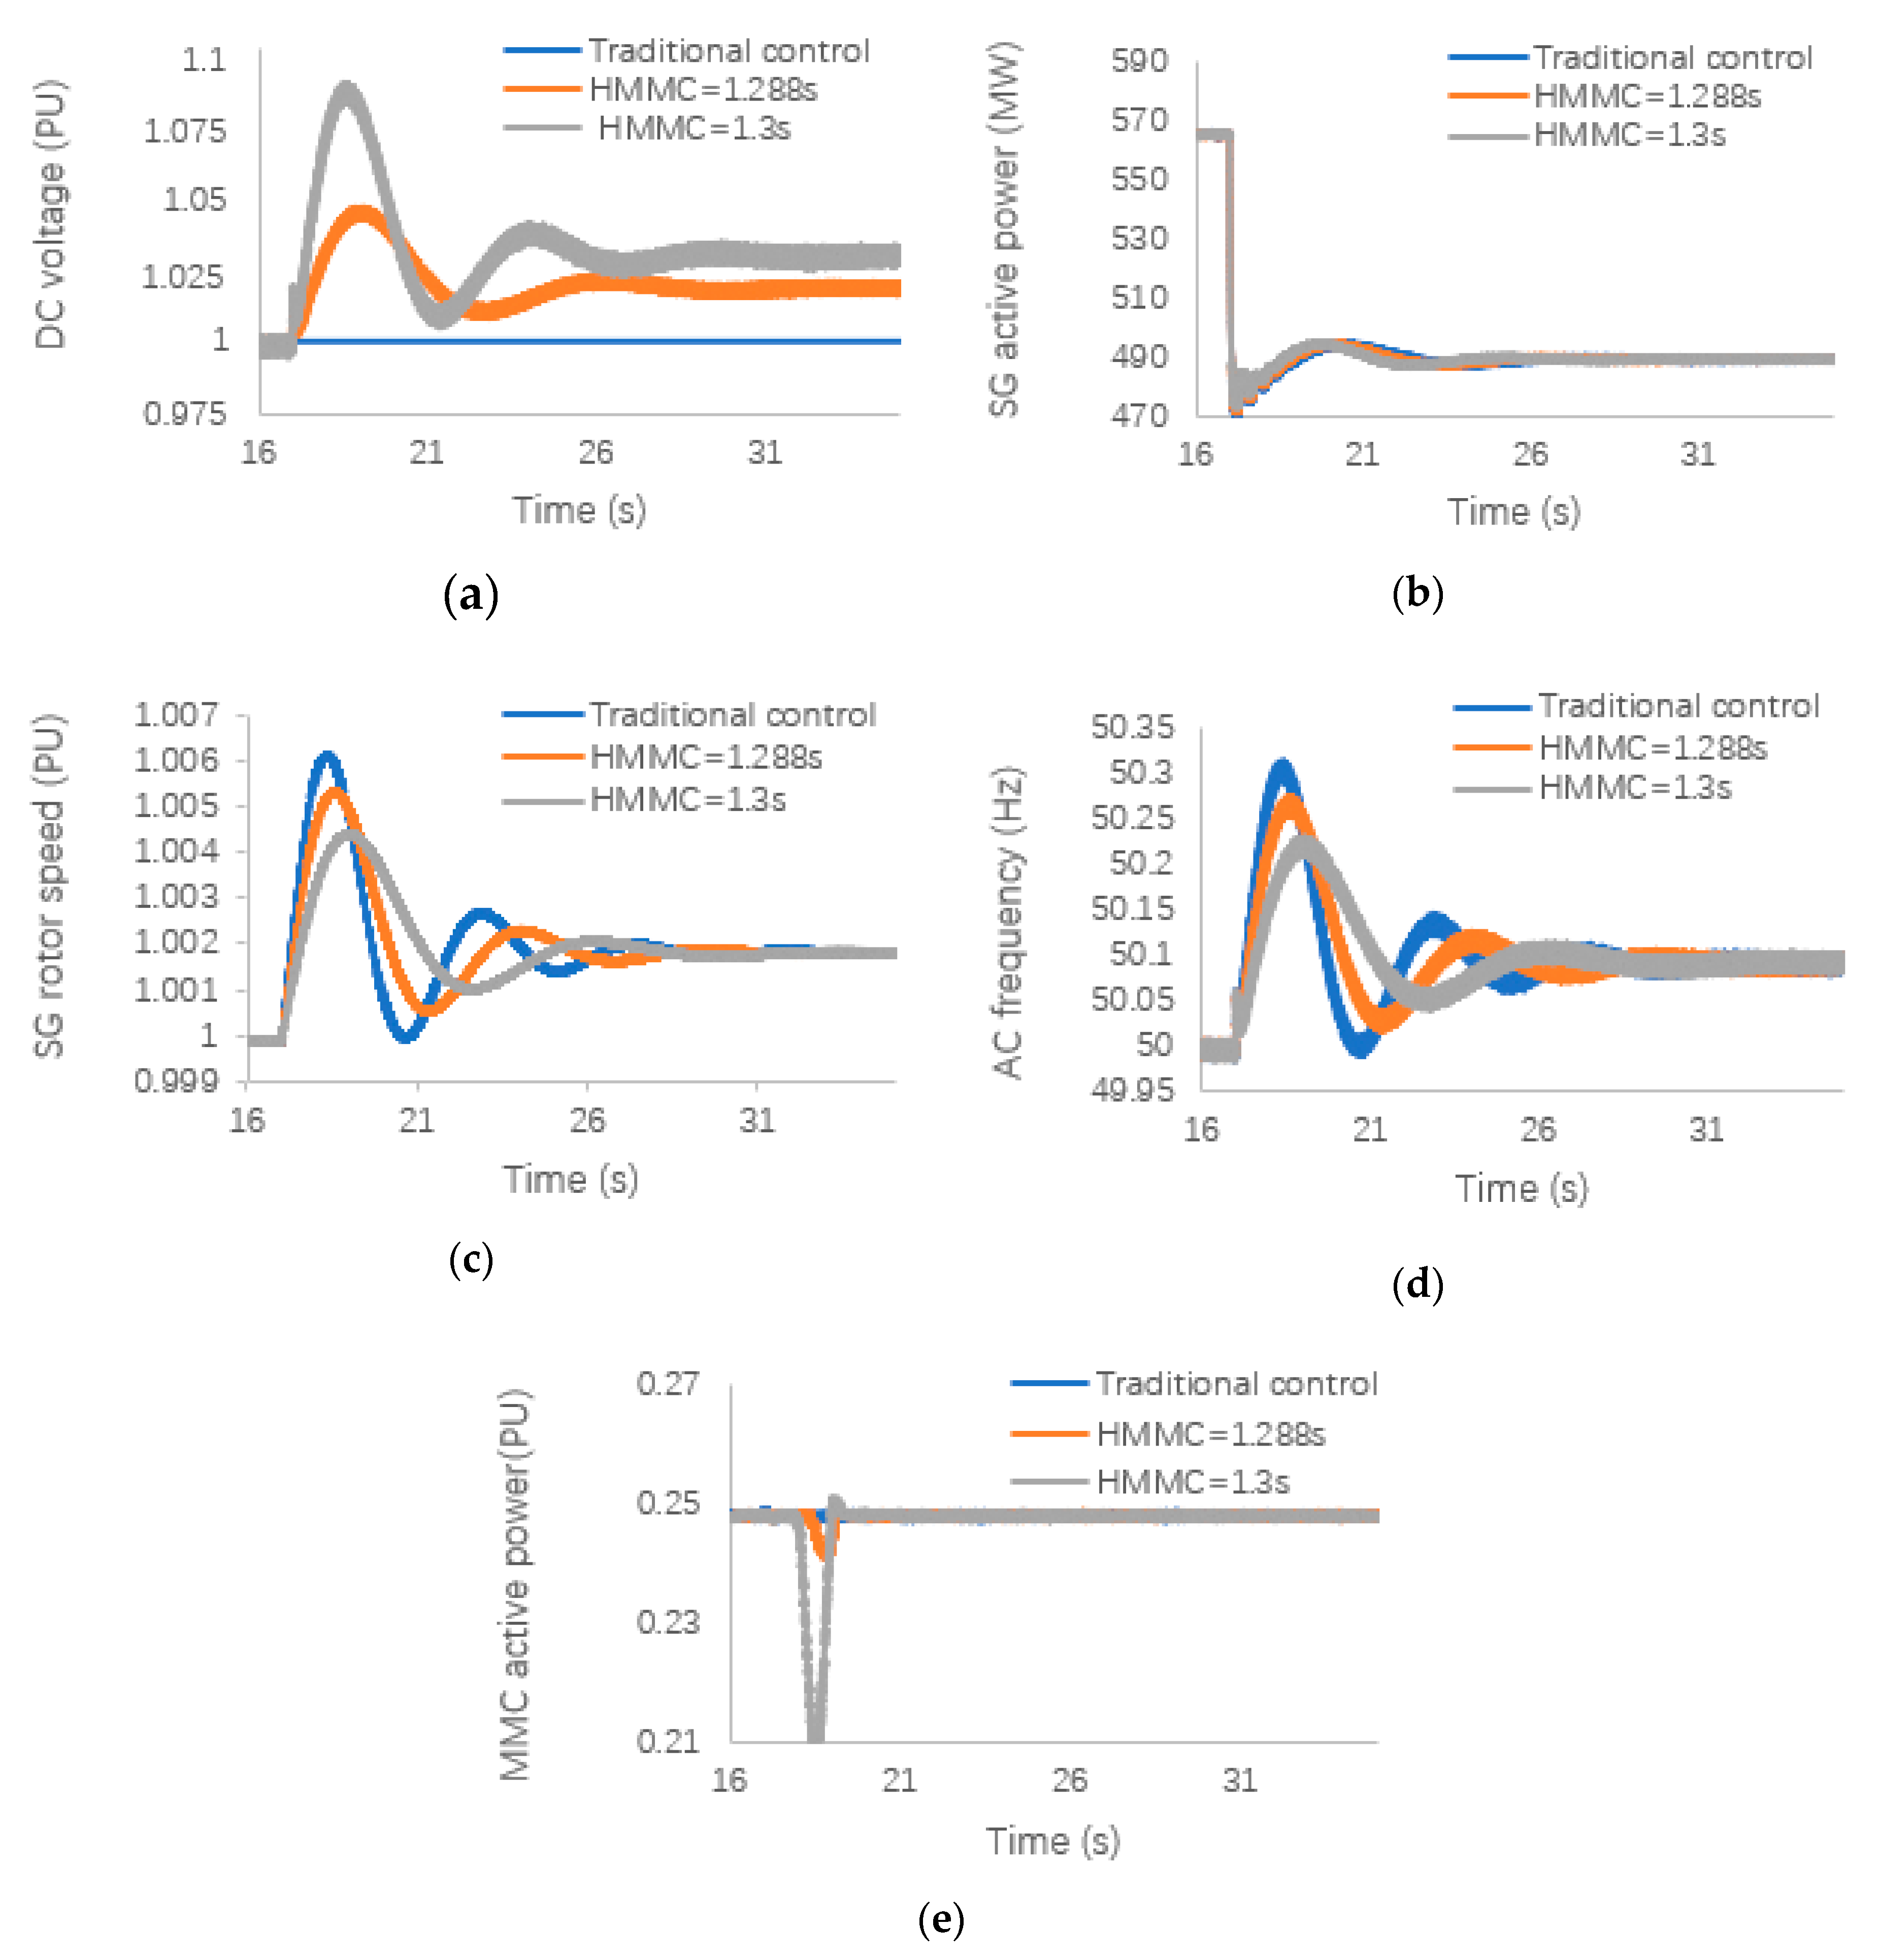
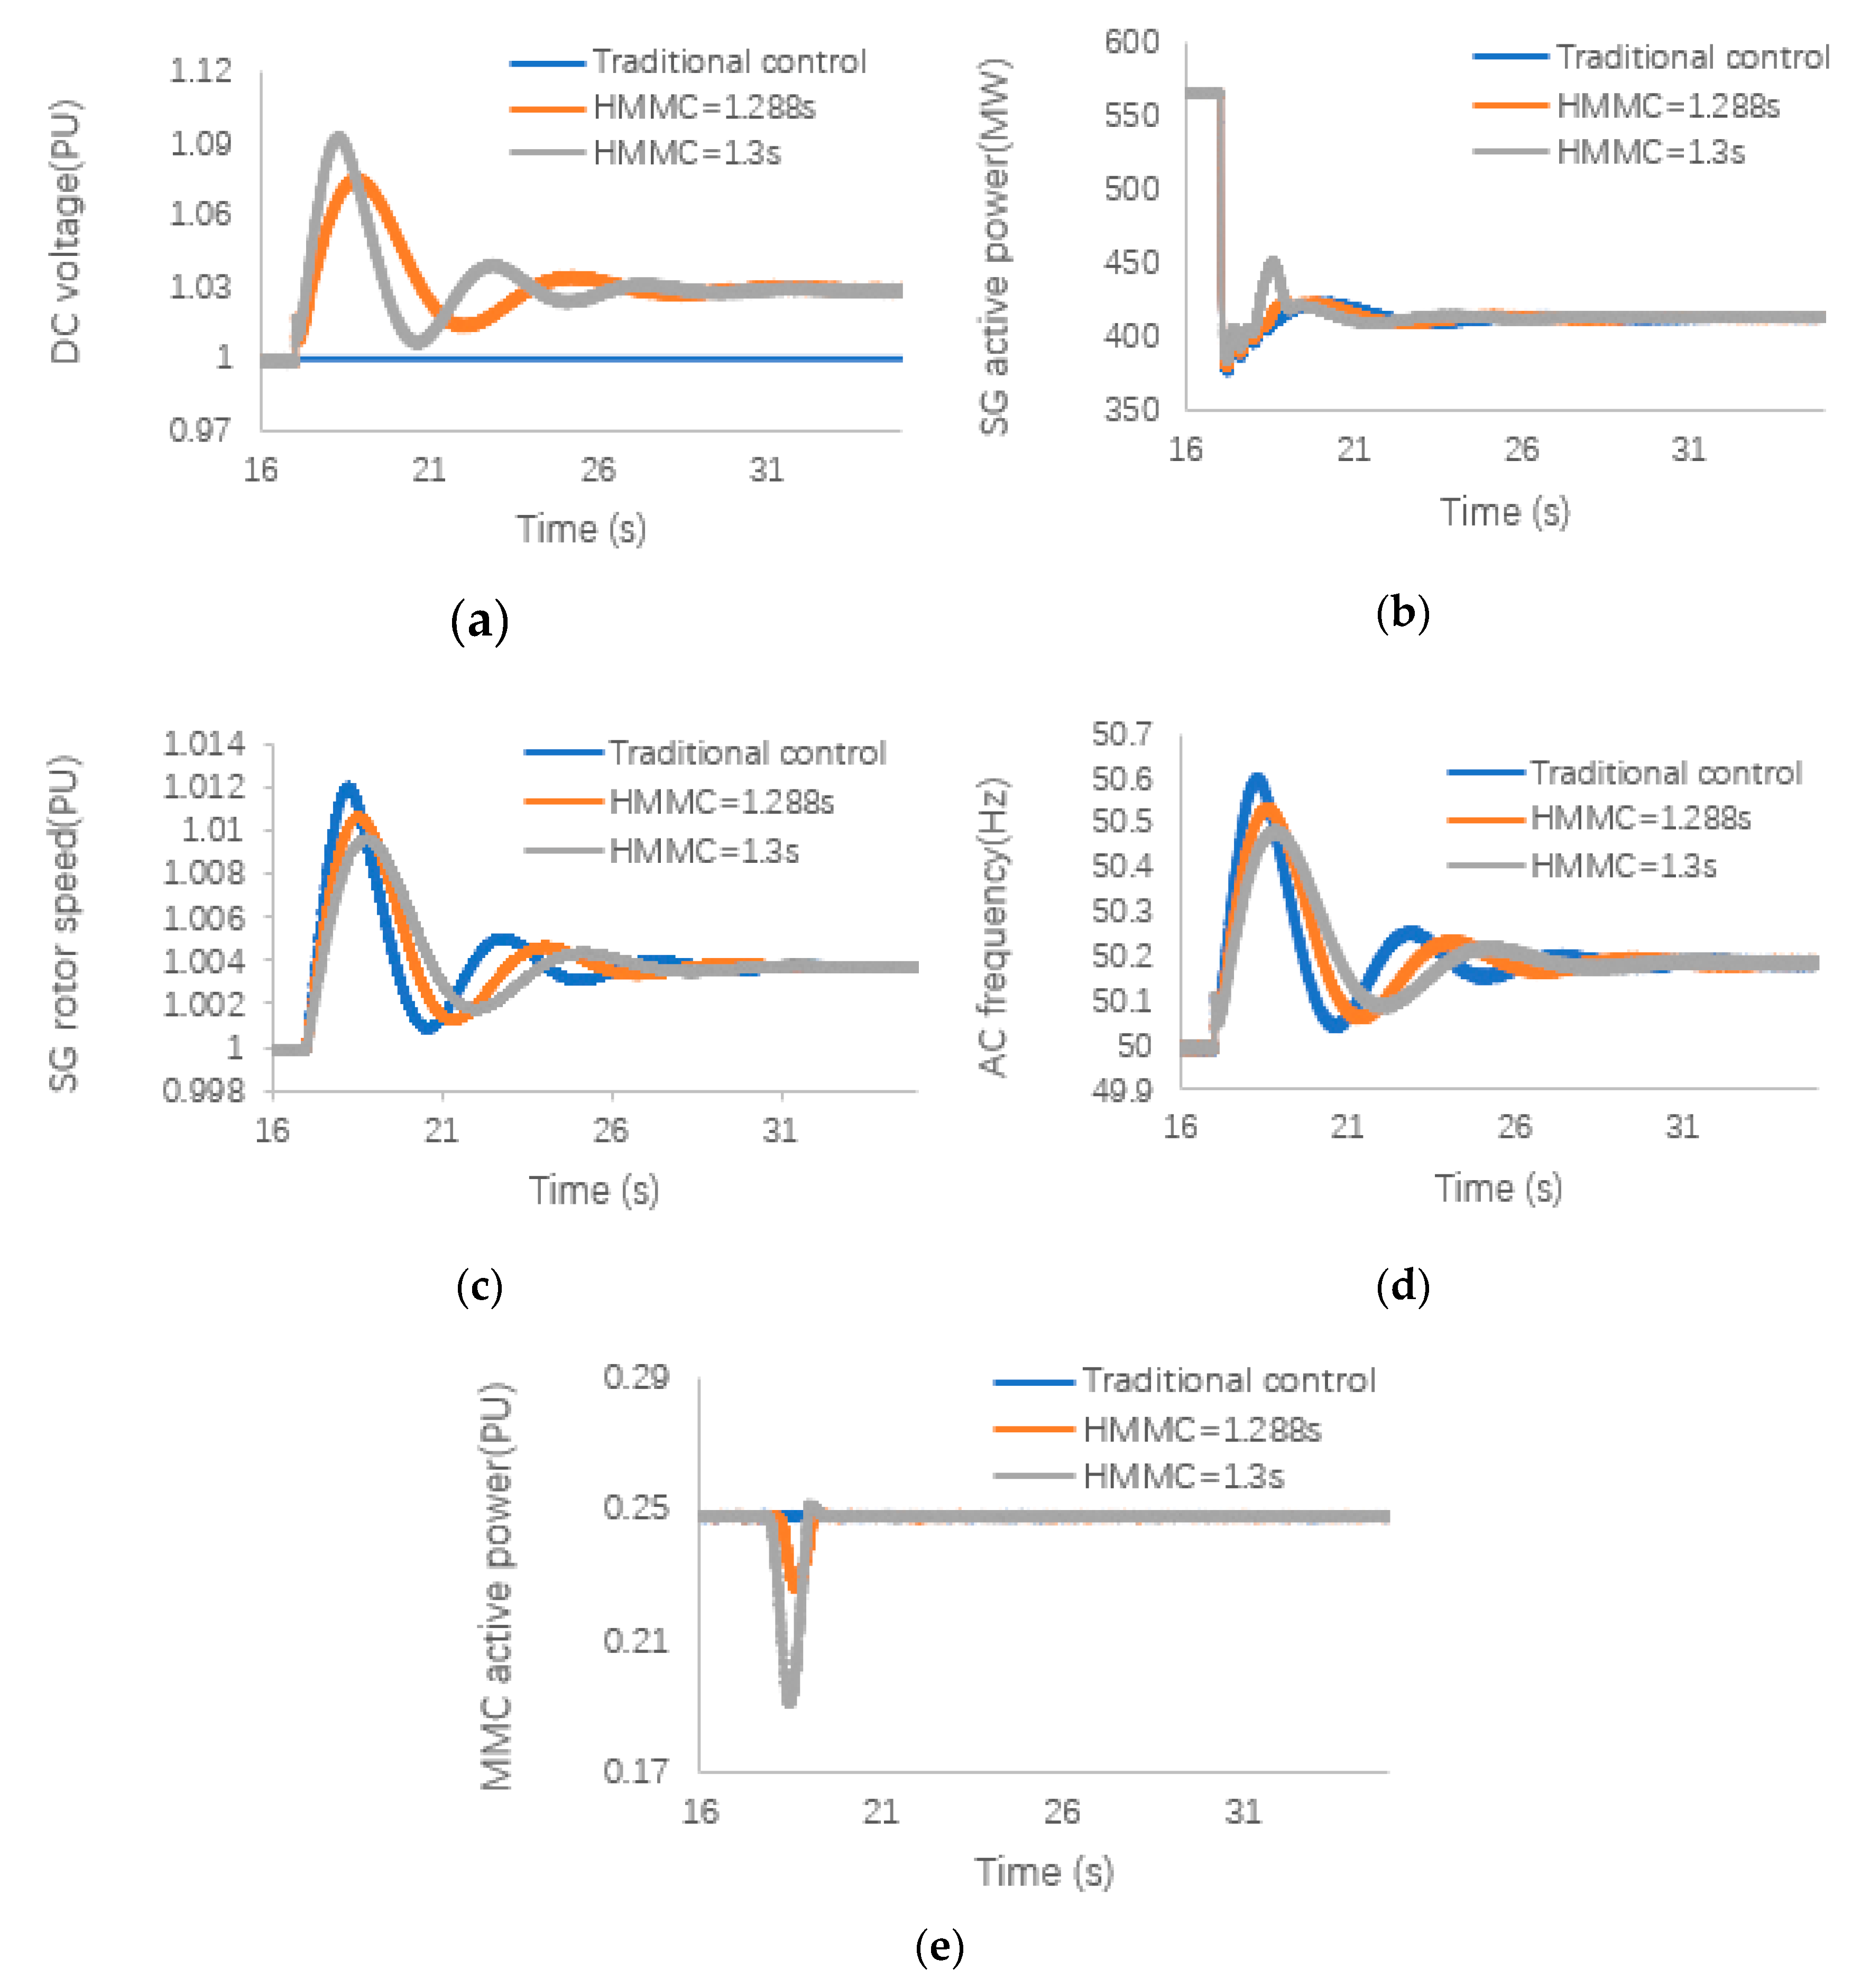
According to international standards, when the ESCR value of the AC system exceeds 3, the system can be defined as a strong system. The AC system used in Case 3 had an ESCR of 3.5. The system was truly powerful. As the ESCR of the AC system increased to 3.5, correspondingly increased to 1.288 s. Figure 7a shows that although the system itself is strong, the improved inertia control can still effectively support the stability of the DC voltage. This also influences the active power and rotor speed of the SG in the AC system.
The results presented in Figure 7b,c show that when is increased by 1.3 s, the change in inertia constant can still be effectively suppressed. As the AC system becomes stronger, the system inertia constant increases. Regardless of how high a system inertia constant is provided by the MMC virtual inertia control, it will not have a significant impact on the system frequency stability. Finally, in Figure 7d, it can be observed that the improved inertia constant provides effective support for the system frequency stability. When the MMC provides a minimum that is higher than the system requirement, further system changes are contained. Figure 7e also progresses to verify that when the system becomes stronger, its own anti-interference ability is stronger and can cope with more complex changes.
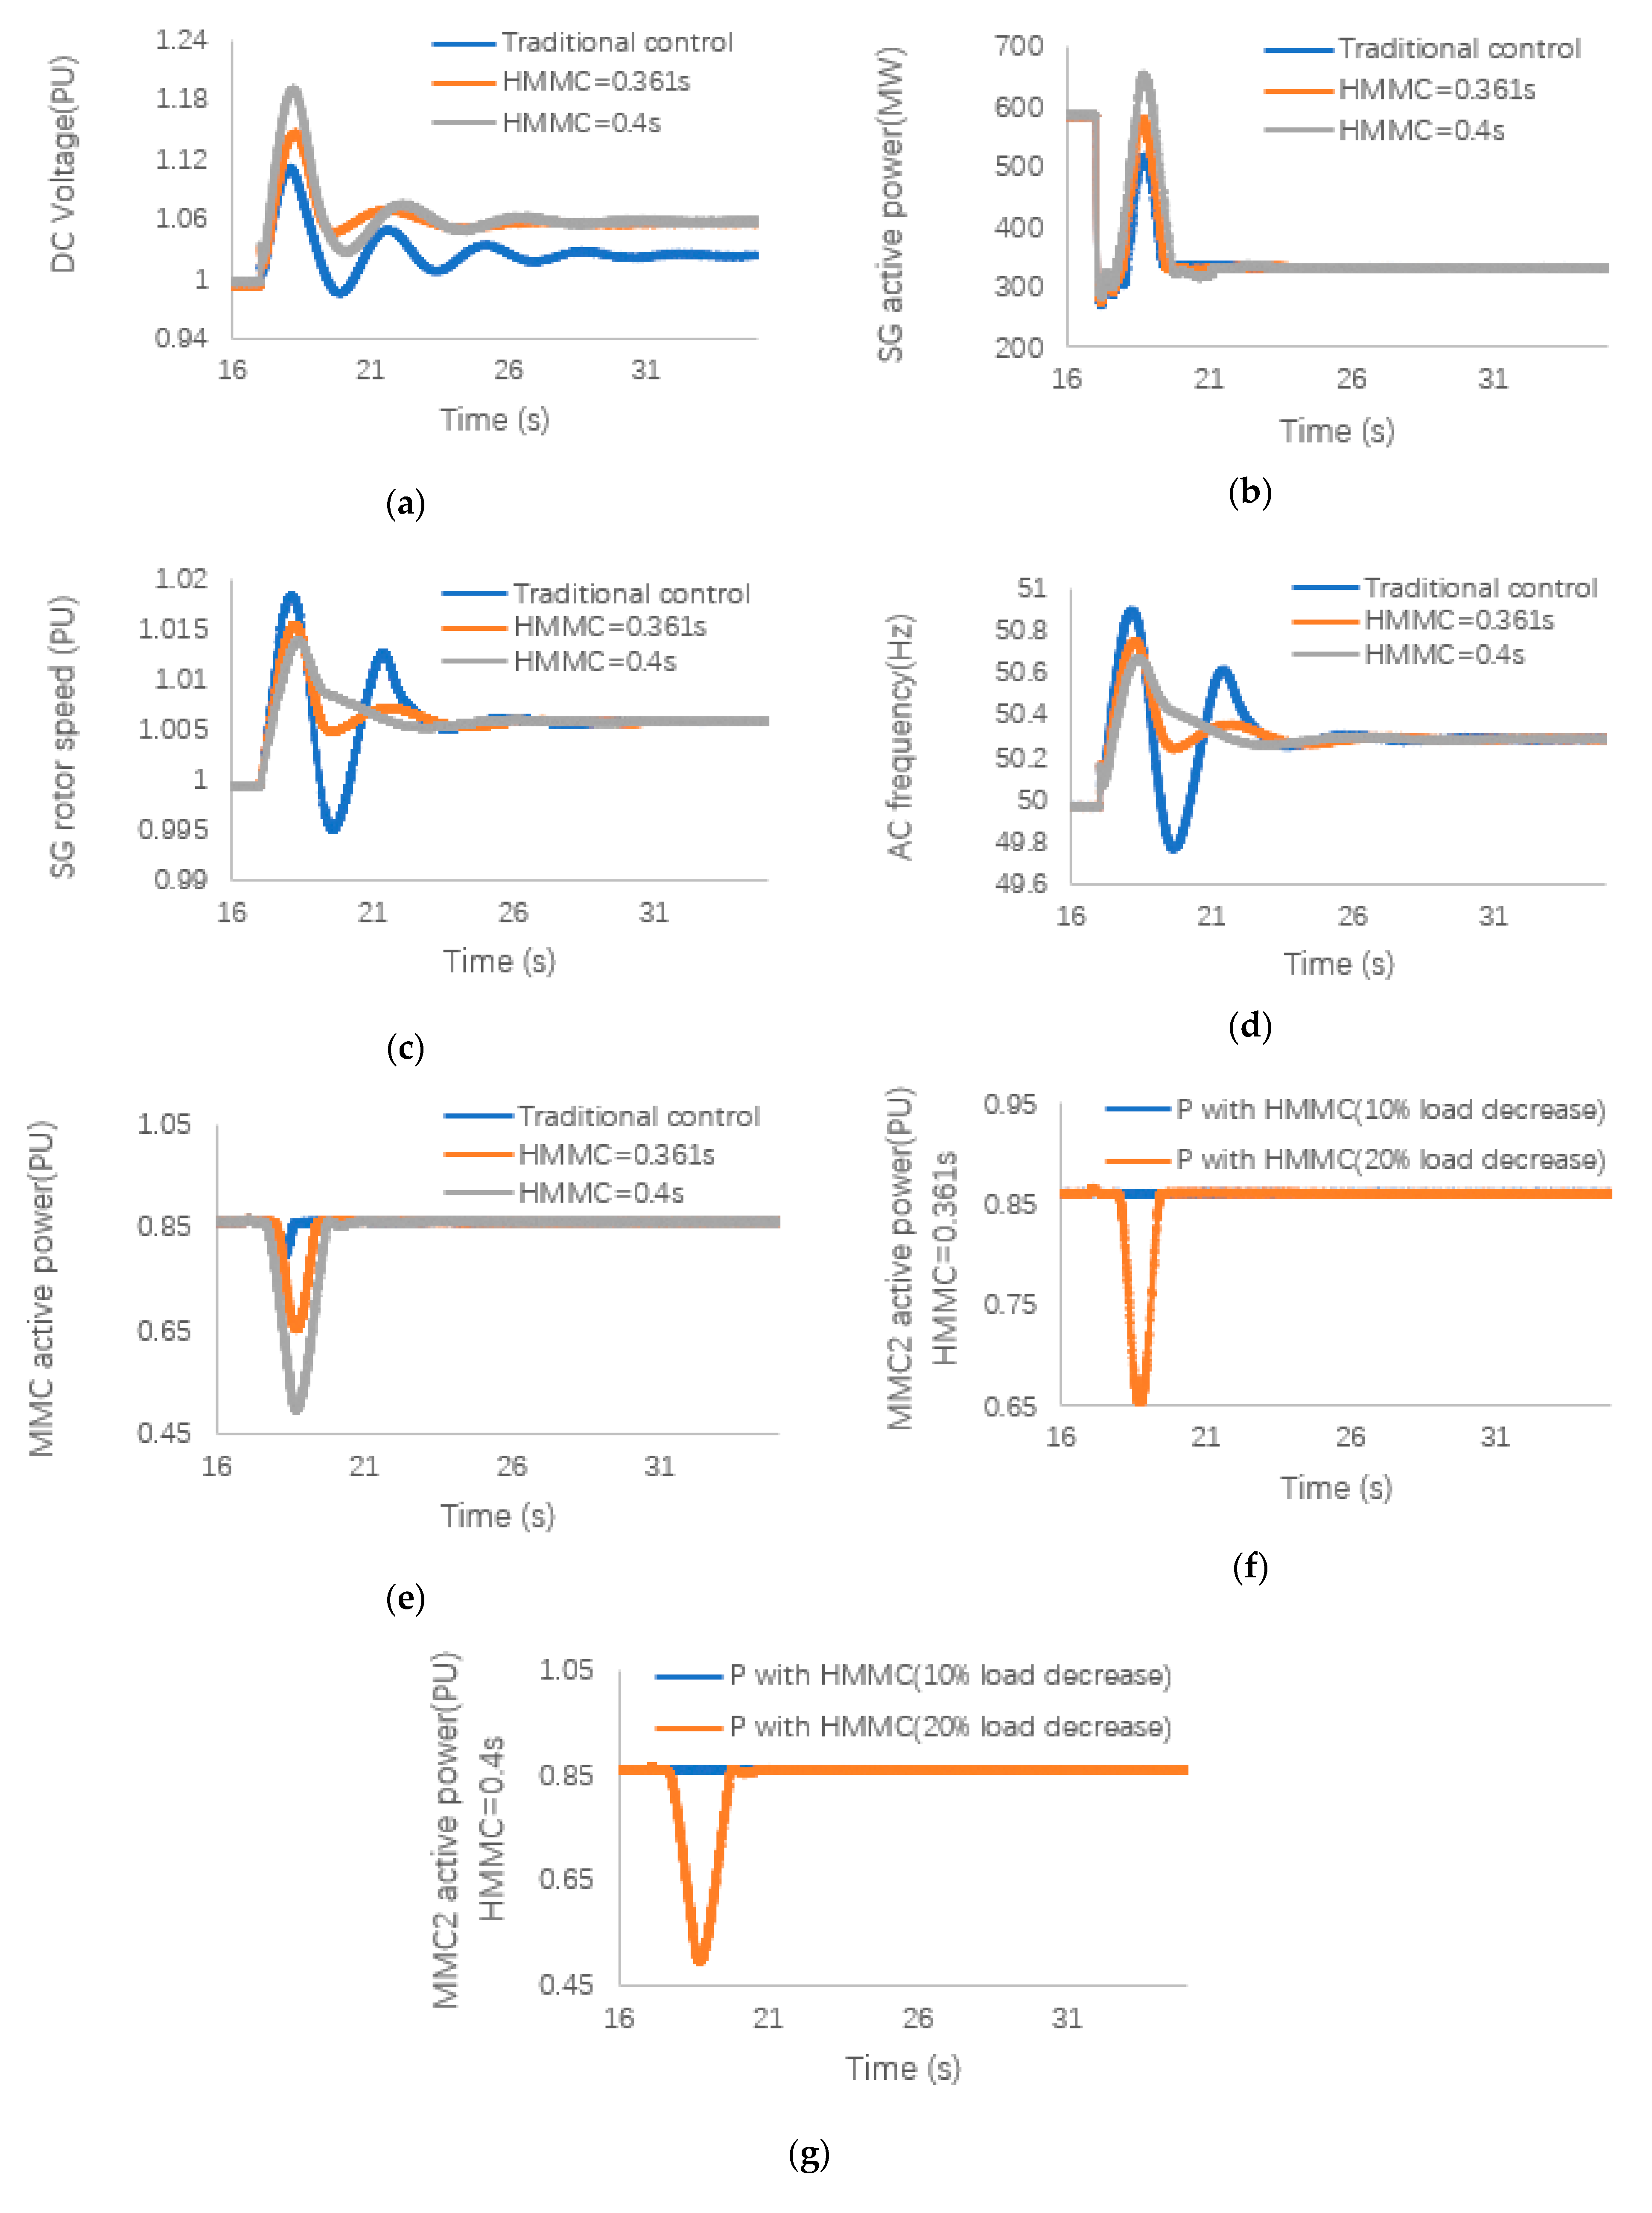
5.4. ESCR Is Low and 20% Changes in Load (ESCR = 1.7)
Case 4 simulates the situation where 20% of load decrease with the weak onshore AC system. Figure 8 shows the response of the system after the load decreases when the onshore power system is weak. Figure 8a shows the changes of DC voltage during the 20% load decreases. The value of HMMC directly affects the variation of DC voltage. With the increase of , the variation of DC voltage also increases. Figure 8b can clearly find that onshore SG has temporarily increased the power output during the load decreases. At the same time, the onshore MMC temporarily reduces the active power output to deal with the power mismatch of the onshore system in Figure 8e. Improved inertia control still helps the system’s active power return to normal levels through its own rapid adjustment capabilities. It means that improved inertia control can also support the main frequency stability of the system under more complicated conditions. Figure 8c shows that as the value increases, the rotor speed of the SG is effectively damped. It means that the inertia constant provided by the improved inertia control effectively improves the stability of the system frequency. By observing Figure 8d, the improved inertia control strategy effectively gives the system frequency support. When , the system device response is greatly improved than before, and it is better than the system under the traditional control strategy.
In addition, by observing Figure 8f,g, the two figures show the changes of offshore side MMC active power when the load is reduced by 10% and 20% under weak onshore AC system conditions. When the load is decreased by 10%, it affects the system which is close to the onshore side, but it does not affect the offshore side under the control of the improved inertia control strategy. When the load is decreased by 20%, the system is more affected, which also causes the active power on the offshore side to be affected, but it is still restored to a normal level under the control of improved inertia control. Although it has been more affected than the previous loading conditions, the improved inertia control strategy still effectively supports the system with a good blocking capability. When the onshore system is weak, it still has an impact on the offshore side MMC converter. But this impact is quickly corrected, then the normal operation of the system is guaranteed. Case 5 and case 6 systems have become stronger. Under the control of improved inertia control, neither a 10% load reduction nor a 20% load reduction can affect the offshore side. Therefore, case 5 and case 6 will no longer represent the active power graphics on the offshore side.
5.5. ESCR Is High and 20% Changes in Load (ESCR = 2.5)
In case 5, the 20% load decreased in the system when the strength of the AC system increased to 2.5. Figure 9 shows the result of system response to load decrease when the onshore system becomes stronger. In Figure 9, the results show that the onshore power system becomes stronger, the system’s own frequency stability enhanced, and it can cope with more complex changing conditions. In Figure 9a, with the enhancement of the onshore system, the inertia constant provided by the improved inertia control still makes the DC variation. In addition, as the ESCR value of the onshore system increases, it can be found through the proposed method that the minimum inertia constant required by the system also increases. The active power of the SG changed under the stronger onshore system in Figure 9b. In Figure 9c, with the enhancement of the onshore system, the improved inertia control is still effective to damp the rotor speed of the SG. With the effective support of improved inertia control, the system frequency variation decreases in Figure 9d. It also has a good control effect for MMC output active power as shown in Figure 9e. Similarly, when is increased to 0.8, the response result of the system is better than before.
5.6. ESCR Is Higher and 20% Load Changes (ESCR = 3.5)
The results in Figure 10 show that when the system becomes a strong system, its own stability will be greatly improved, and the minimum inertia constant required by the system will also increase. Figure 10a shows that the inertia constant provided by improved inertia control still causes changes in the DC voltage. The response of the active power is shown in Figure 10b. The results in Figure 10c show that the rotor speed of SG can be well controlled under the condition of strong onshore AC system. Improved inertia control still effectively controls the frequency of the AC system. From Figure 10d, improved inertia control still effectively controls the frequency of the AC system. When the is further increased to 1.3 s, the response result of the system is also satisfactory. It has a superior control effect for MMC active power in Figure 10e.
5.7. Relationship between Inertia Constant and ESCR
In this subsection, we discuss the relationship between the inertia constant and AC system robustness based on (22). Additionally, the ESCR is affected by the AC-rated capacity and DC-rated active power. In other words, the total capacity of offshore wind turbines directly affects the rated active power of the MMC-HVDC. As the capacity of each type-4 wind turbine is fixed, the number of generators that penetrate the system determines the transmission power. As shown in Figure 8, we provided an ESCR ranging from weak to strong (e.g., ESCR of 1 to 4), an inertia constant, and the number of wind turbines infiltrating the system.
In Figure 11, it can be observed from the results that the value of the inertia constant depends to a certain extent on the value of the ESCR, which maintains the same DC voltage level. If the number of wind turbines infiltrating the grid is reduced, then the inertia of the system increases. Therefore, as the capacity of a single motor is fixed, the penetration level of the wind turbine will also present great challenges to the stability of the grid.
6. Conclusions
In this paper, an improved inertia constant control that uses the ESCR value of the AC system is presented. This method aids the system in maintaining its frequency stability by using the energy stored in the capacitor of the MMC submodules and via effective damping of the frequency oscillations owing to load loss. The simulation results show that improved inertia control can better support the frequency stability of the AC system under various conditions. Whether it is under 10% load reduction or 20% load reduction, the improved inertia control strategy provides good support for system stability. In addition, the control accuracy of this method is higher even if the system is in a relatively weaker state (and even in the case of a system with an extremely low inertia constant). The improved inertia control can also help the generators connected to it, which can effectively contain the fault effect and provide better stability support and primary frequency control for the system.
As the type-4 wind-turbine penetration level decreases, the inertia constant of the MMC-HVDC improves significantly. The stability of the system itself was strengthened to ensure the stability of the system frequency when the regenerative-energy penetration level increases in the future, and a fault crossing capability was realized.
Author Contributions
Conceptualization, Z.Z. and J.L.; validation, G.J.; Data curation. Z.Z. and J.L.; Investigation, Z.Z. and J.L.; Methodology, G.J.; Writing-original draft, Z.Z.; Writing-review & editing, J.L. and G.J. All authors have read and agreed to the published version of the manuscript.
Funding
This work was supported by Korea Institute of Energy Technology Evaluation and Planning (KETEP) grant funded by the Korea government (MOTIE) (No. 20191210301890). This work was supported by “Human Resources Program in Energy Technology” of the Korea Institute of Energy Technology Evaluation and Planning (KETEP), granted financial resource from the Ministry of Trade, Industry & Energy, Republic of Korea. (No.20194030202420).
Conflicts of Interest
The authors declare no conflict of interest.
References
- Hertem, D.V.; Gomis-Bellmunt, O.; Liang, J. HVDC Grids for Offshore and Supergrid of the Future; Wiley-IEEE Press: Hoboken, NJ, USA, 2016; pp. 102–107. [Google Scholar]
- Fan, L.L.; Miao, Z.X. Wind in weak grids: 4 Hz or 30 Hz Oscillations? IEEE Trans. Power Syst. 2018, 33, 5803–5804. [Google Scholar] [CrossRef]
- Kim, J.W.; Lee, S.H.; Park, J.W. Inertia-free stand-alone microgrid, part II: Inertia control for stabilizing DC-link capacitor voltage of PMSG wind turbine system. IEEE Trans. Indus. Appl. 2019, 54, 4060–4068. [Google Scholar] [CrossRef]
- Godin, P.; Fischer, M.; Röttgers, H.; Mendonca, A.; Engelken, S. Wind power plant level testing of inertial response with optimised recovery behaviour. IET Renew. Power Gen. 2019, 13, 676–683. [Google Scholar] [CrossRef]
- Wu, Q.W.; Sun, Y.Z. Modeling and Modern Control of Wind Power; Wiley-IEEE Press: Hoboken, NJ, USA, 2018; pp. 85–114. [Google Scholar]
- Li, R.S.; Bozhko, S.; Asher, G. Frequency control design for offshore wind farm grid with LCC-HVDC link connection. IEEE Trans. Power Electron. 2008, 23, 1085–1092. [Google Scholar] [CrossRef]
- Miao, Z.X.; Fan, L.L.; Osborn, D.; Yuvarajan, S. Wind farms with HVDC delivery in inertial response and primary frequency control. IEEE Trans. Energy Conv. 2010, 25, 1171–1178. [Google Scholar] [CrossRef]
- Yogarathinam, A.; Kaur, J.; Chaudhuri, N.R. Impact of inertia and effective short circuit ratio on control of frequency in weak grids interfacing LCC-HVDC and DFIG-based wind farms. IEEE Trans. Power Deliv. 2017, 32, 2040–2051. [Google Scholar] [CrossRef]
- Vennelaganti, S.G.; Chaudhuri, N.R. New insights into coupled frequency dynamics of AC grids in rectifier and inverter sides of LCC-HVDC interfacing DFIG-based wind farms. IEEE Trans. Power Deliv. 2018, 33, 1765–1776. [Google Scholar] [CrossRef]
- Sha, J.B.; Guo, C.Y.; Rehman, A.U.; Zhao, C.Y. A Quantitative Index to Evaluate the Commutation Failure Probability of LCC-HVDC with a Synchronous Condenser. Appl. Sci. 2019, 9, 925. [Google Scholar] [CrossRef] [Green Version]
- Li, Y.Y.; Liu, K.P.; Liao, X.B.; Zhu, S.; Huai, Q. A Virtual Impedance Control Strategy for Improving the Stability and Dynamic Performance of VSC–HVDC Operation in Bidirectional Power Flow Mode. Appl. Sci. 2019, 9, 3184. [Google Scholar] [CrossRef] [Green Version]
- Wang, L.; Lin, C.Y.; Wu, H.Y.; Prokhorov, A.V. Stability analysis of a microgrid system with a hybrid offshore wind and ocean energy farm fed to a power grid through an HVDC Link. IEEE Trans. Ind. Appl. 2018, 54, 2012–2022. [Google Scholar] [CrossRef]
- Liu, H.Z.; Chen, Z. Contribution of VSC-HVDC to frequency regulation of power systems with offshore wind generation. IEEE Trans. Energy Conv. 2015, 30, 918–926. [Google Scholar] [CrossRef]
- Nanou, S.I.; Papathanassiou, S.A. Grid code compatibility of VSC-HVDC connected offshore wind turbines employing power synchronization control. IEEE Trans. Power Syst. 2016, 31, 5042–5050. [Google Scholar] [CrossRef]
- Zhang, L.D.; Harnefors, L.; Nee, H.P. Power-synchronization control of grid-connected voltage-source converters. IEEE Trans. Power Syst. 2010, 25, 809–820. [Google Scholar] [CrossRef]
- Mitra, P.; Zhang, L.D.; Harnefors, L. Offshore wind integration to a weak grid by VSC-HVDC links using power-synchronization control: A case study. IEEE Trans. Power Deliv. 2014, 29, 453–461. [Google Scholar] [CrossRef]
- Zhu, J.B.; Booth, C.D.; Adam, G.P.; Roscoe, A.J.; Bright, C.G. Inertia emulation control strategy for VSC-HVDC transmission systems. IEEE Trans. Power Syst. 2013, 28, 1277–1287. [Google Scholar] [CrossRef] [Green Version]
- Liu, X.D.; Lindemann, A. Control of VSC-HVDC connected offshore windfarms for providing synthetic inertia. IEEE J. Emerg. Sel. Top. Power Electron. 2018, 6, 1407–1417. [Google Scholar] [CrossRef]
- Guan, M.Y.; Pan, W.L.; Zhang, J.; Hao, Q.R.; Cheng, J.Z.; Zheng, X. Synchronous generator emulation control strategy for voltage source converter (VSC) stations. IEEE Trans. Power Syst. 2015, 30, 3093–3101. [Google Scholar] [CrossRef]
- Hafeez, K.; Khan, S.A.; Van den Bossche, A.; Hasan, Q.A. Circulating Current Reduction in MMC-HVDC System Using Average Model. Appl. Sci. 2019, 9, 1383. [Google Scholar] [CrossRef] [Green Version]
- Saad, H.; Peralta, J.; Dennetière, S. Dynamic averaged and simplified models for MMC-based HVDC transmission Systems. IEEE Trans. Power Deliv. 2013, 28, 1723–1730. [Google Scholar] [CrossRef]
- Gnanarathna, U.N.; Gole, A.M.; Jayasinghe, R.P. Efficient modeling of modular multilevel HVDC converters (MMC) on electromagnetic transient simulation programs. IEEE Trans. Power Deliv. 2011, 26, 316–324. [Google Scholar] [CrossRef] [Green Version]
- Leon, A.E. Short-term frequency regulation and inertia emulation using an MMC-based MTDC system. IEEE Trans. Power Syst. 2018, 33, 2854–2863. [Google Scholar] [CrossRef]
- Li, B.; Zhang, W.X.; He, J.W. Inertia emulation and dynamic voltage support scheme for MMC-based dc systems. IET Renew. Power Gener. 2019, 13, 146–154. [Google Scholar] [CrossRef]
- Zhu, J.B.; Shen, Z.P.; Bu, S.Q.; Li, X.L.; Booth, C.D.; Qiu, W.; Jia, H.J.; Wang, C.S. Coordinated Flexible Damping Mechanism with Inertia Emulation Capability for MMC-MTDC Transmission Systems. IEEE J. Emerg. Sel. Top. Power Electron. 2020, 1–14. [Google Scholar] [CrossRef]
- Peralta, J.; Saad, H.; Dennetiére, S.; Mahseredjian, J.; Nguefeu, S. Detailed and averaged models for a 401-level MMC-HVDC system. IEEE Trans. Power Del. 2012, 27, 1501–1508. [Google Scholar] [CrossRef]
- D’Arco, S.; Nguyen, T.T.; Suul, J.A. Evaluation of Virtual Inertia Control Strategies for MMC-based HVDC Terminals by P-HiL Experiments. In Proceeding of the IECON 2019—45th Annual Conference of the IEEE Industrial Electronics Society, Lisbon, Portugal, 14–17 October 2019; pp. 4811–4818. [Google Scholar]
Figure 1.
System outline and conventional control loop of modular multilevel-converter high-voltage direct-current (MMC-HVDC).
Figure 1.
System outline and conventional control loop of modular multilevel-converter high-voltage direct-current (MMC-HVDC).

Figure 2.
Thevenin equivalent circuit of submodules.

Figure 3.
Improved inertia control diagram.

Figure 4.
Single-line view of the simulation system diagram.

Figure 5.
Effective short circuit ratio (ESCR) is 1.7 for 10% load decrease: (a) DC voltage; (b) synchronous generator (SG) active power; (c) SG rotor speed; (d) AC system frequency; (e) modular multilevel-converter (MMC) active power.
Figure 5.
Effective short circuit ratio (ESCR) is 1.7 for 10% load decrease: (a) DC voltage; (b) synchronous generator (SG) active power; (c) SG rotor speed; (d) AC system frequency; (e) modular multilevel-converter (MMC) active power.

Figure 6.
ESCR is 2.5 for 10% load decrease: (a) DC voltage; (b) SG active power; (c) SG rotor speed; (d) AC system frequency; (e) MMC active power.
Figure 6.
ESCR is 2.5 for 10% load decrease: (a) DC voltage; (b) SG active power; (c) SG rotor speed; (d) AC system frequency; (e) MMC active power.

Figure 7.
ESCR is 3.5 for 10% load decrease: (a) DC voltage; (b) SG active power; (c) SG rotor speed; (d) AC system frequency; (e) MMC active power.
Figure 7.
ESCR is 3.5 for 10% load decrease: (a) DC voltage; (b) SG active power; (c) SG rotor speed; (d) AC system frequency; (e) MMC active power.

Figure 8.
ESCR is 1.7 for 20% load decrease: (a) DC voltage; (b) SG active power; (c) SG rotor speed; (d) AC system frequency; (e) MMC active power; (f) MMC2 active power with HMMC = 0.361 s; (g) MMC active power with HMMC = 0.4 s.
Figure 8.
ESCR is 1.7 for 20% load decrease: (a) DC voltage; (b) SG active power; (c) SG rotor speed; (d) AC system frequency; (e) MMC active power; (f) MMC2 active power with HMMC = 0.361 s; (g) MMC active power with HMMC = 0.4 s.

Figure 9.
ESCR is 2.5 for 20% load decrease: (a) DC voltage; (b) SG active power; (c) SG rotor speed; (d) AC system frequency; (e) MMC active power.
Figure 9.
ESCR is 2.5 for 20% load decrease: (a) DC voltage; (b) SG active power; (c) SG rotor speed; (d) AC system frequency; (e) MMC active power.

Figure 10.
ESCR is 3.5 for 20% load decrease: (a) DC voltage; (b) SG active power; (c) SG rotor speed; (d) AC system frequency; (e) MMC active power.
Figure 10.
ESCR is 3.5 for 20% load decrease: (a) DC voltage; (b) SG active power; (c) SG rotor speed; (d) AC system frequency; (e) MMC active power.

Figure 11.
Relationship between inertia constant, ESCR of AC system, and number of offshore wind turbine deviations.
Figure 11.
Relationship between inertia constant, ESCR of AC system, and number of offshore wind turbine deviations.


Table 1.
System parameters.
| Item | Rated Value |
|---|---|
| Rated AC rms voltage | 230 kV |
| Rated SG rms voltage | 230 kV |
| Rated VSC power | 950 MVA |
| Rated DC voltage | 640 kV |
| Nominal DC voltage | 370 kV |
| VSC arm reactor | 50 mH |
| VSC converter reactor | 1.25 mH |
| VSC reactor resistance | 0.0005 Ω |
| DC capacitor | 2.8 mF |
| Submodule number | 76 |
| Filter cutoff frequency | 2400 Hz |
| Nominal frequency | 50 Hz |
Publisher’s Note: MDPI stays neutral with regard to jurisdictional claims in published maps and institutional affiliations. |
© 2020 by the authors. Licensee MDPI, Basel, Switzerland. This article is an open access article distributed under the terms and conditions of the Creative Commons Attribution (CC BY) license (http://creativecommons.org/licenses/by/4.0/).
Share and Cite
MDPI and ACS Style
Zhang, Z.; Lee, J.; Jang, G. Improved Control Strategy of MMC–HVDC to Improve Frequency Support of AC System. Appl. Sci. 2020, 10, 7282. https://doi.org/10.3390/app10207282
AMA Style
Zhang Z, Lee J, Jang G. Improved Control Strategy of MMC–HVDC to Improve Frequency Support of AC System. Applied Sciences. 2020; 10(20):7282. https://doi.org/10.3390/app10207282
Chicago/Turabian StyleZhang, Zicong, Junghun Lee, and Gilsoo Jang. 2020. "Improved Control Strategy of MMC–HVDC to Improve Frequency Support of AC System" Applied Sciences 10, no. 20: 7282. https://doi.org/10.3390/app10207282
Note that from the first issue of 2016, this journal uses article numbers instead of page numbers. See further details here.