Article

First In-Situ Measurements of Plume Chemistry at Mount Garet Volcano, Island of Gaua (Vanuatu)

1
Dipartimento DiSTeM, Università degli Studi di Palermo, 90123 Palermo, Italy
2
Lamont-Doherty Earth Observatory, Columbia University, New York, NY 10027, USA
3
Department of Earth and Planetary Sciences, American Museum of Natural History, New York, NY 10024, USA
4
CNRS, IRD, OPGC, Laboratoire Magmas et Volcans, Université Clermont Auvergne, 63000 Clermont-Ferrand, France
5
Department of Electronic and Electrical Engineering, University College London, London WC1E 6BT, UK
6
Istituto Nazionale di Geofisica e Vulcanologia, Osservatorio Etneo, 95125 Catania, Italy
*
Author to whom correspondence should be addressed.
Appl. Sci. 2020, 10(20), 7293; https://doi.org/10.3390/app10207293
Submission received: 29 September 2020 / Revised: 13 October 2020 / Accepted: 15 October 2020 / Published: 19 October 2020
(This article belongs to the Special Issue Volcano Monitoring: From the Magma Reservoir to Eruptive Processes)

Abstract

:
Recent volcanic gas compilations have urged the need to expand in-situ plume measurements to poorly studied, remote volcanic regions. Despite being recognized as one of the main volcanic epicenters on the planet, the Vanuatu arc remains poorly characterized for its subaerial emissions and their chemical imprints. Here, we report on the first plume chemistry data for Mount Garet, on the island of Gaua, one of the few persistent volatile emitters along the Vanuatu arc. Data were collected with a multi-component gas analyzer system (multi-GAS) during a field campaign in December 2018. The average volcanic gas chemistry is characterized by mean molar CO2/SO2, H2O/SO2, H2S/SO2 and H2/SO2 ratios of 0.87, 47.2, 0.13 and 0.01, respectively. Molar proportions in the gas plume are estimated at 95.9 ± 11.6, 1.8 ± 0.5, 2.0 ± 0.01, 0.26 ± 0.02 and 0.06 ± 0.01, for H2O, CO2, SO2, H2S and H2. Using the satellite-based 10-year (2005–2015) averaged SO2 flux of ~434 t d−1 for Mt. Garet, we estimate a total volatile output of about 6482 t d−1 (CO2 ~259 t d−1; H2O ~5758 t d−1; H2S ~30 t d−1; H2 ~0.5 t d−1). This may be representative of a quiescent, yet persistent degassing period at Mt. Garet; whilst, as indicated by SO2 flux reports for the 2009–2010 unrest, emissions can be much higher during eruptive episodes. Our estimated emission rates and gas composition for Mount Garet provide insightful information on volcanic gas signatures in the northernmost part of the Vanuatu Arc Segment. The apparent CO2-poor signature of high-temperature plume degassing at Mount Garet raises questions on the nature of sediments being subducted in this region of the arc and the possible role of the slab as the source of subaerial CO2. In order to better address the dynamics of along-arc volatile recycling, more volcanic gas surveys are needed focusing on northern Vanuatu volcanoes.

1. Introduction

Monitoring the composition and mass flux of subaerial volcanic emissions is key to understanding how volcanism impacts our planet, on both local and global scales.
At subduction zones, de-volatilization of subducting slab materials during high-pressure metamorphism [1,2,3] returns volatiles back to the hydrosphere-atmosphere via mantle wedge melting and arc volcanism. These materials are injected into the mantle through subducted sediments [4,5,6,7], altered oceanic crust (AOC) [8,9] and serpentinized lithospheric mantle [10,11,12].
Therefore, constraining major volatile budgets from subaerial volcanic arc emitters provides a tool to partially quantify the recycling efficiency of H2O, CO2, SO2 and other volatiles via the subduction process. The contrasting volatile ratios in the depleted mantle (CO2/ST of ~0.3–0.8) [13], subducted sediments (CO2/ST ~1–100) [14] and crustal fluids from limestone de-carbonatation (CO2/ST >>100) [15] imply that measuring volcanic gas composition can bear crucial information on volatile sources at depth. At the arc-scale, ever-increasing volcanic gas inventories are key to understanding the volatile cycle at subduction.
However, global volcanic gas datasets [15,16,17,18,19,20,21,22] are still sparse and incomplete, largely due to the remote location of some volcanic centers, inaccessibility, social/political instability of geographic regions and/or high level of volcanic activity.
For instance, the Southwestern Pacific region is home to some of the most persistently degassing volcanoes on Earth [23], but Melanesian volcanoes have systematically been underrepresented in previous literature reviews. Recent advances in satellite remote sensing techniques, such as the ozone monitoring instrument (OMI), have greatly improved our knowledge on SO2 flux emissions globally [23], revealing Vanuatu as a major volcanic SO2 source globally, and urging the volcanic gas community to target volcanic gas studies in the poorly studied, yet strongly emitting volcanoes along this arc segment.
In-situ measurements of volcanic gas compositions can be attained by using relatively inexpensive multi-component gas analyzer systems (such as the multi-GAS) [24,25]. In addition to their great potential in eruption forecasting, these portable units have revolutionized our understanding of along-arc chemistry of volcanic gases at different regions of the world. Moreover, when combined with remotely sensed SO2 fluxes, these measurements provide a means to constrain volcanic gas fluxes, especially CO2 [17,18,19,20,21,26,27,28,29].
In the Vanuatu arc, volcanic gas surveys have mostly focused on Yasur [30,31,32] and Ambrym [33,34,35] due to the persistent high levels of degassing and volcanic activity. However, Reference [36] reported the first estimate of volcanic SO2 budget for the Vanuatu Island Arc, in which the authors highlight other vigorously degassing volcanoes along the arc, for which volcanic gas compositions have remained unconstrained.
In this paper, we present the results of a field campaign to measure gas compositions and estimate total volatile fluxes emitted from Mount Garet volcano (or Mount Gharat; also occasionally referred to in the literature as Gaua volcano), located on the island of Gaua, Vanuatu, whose activity in 2009–2010 prompted the evacuation of more than 1500 inhabitants [36]. Data collected in December 2018 is here integrated with previous SO2 flux reports from both ground-based measurements [36] and satellite records [23] in order to assess the volatile budget of Mount Garet. Data from this study represents the first in-situ plume composition measurements obtained for Mount Garet and thus provides information on volcanic gas signatures in the northern part of the arc segment. We also integrate our novel dataset in the context of previously reported gas compositions for other Vanuatu volcanic centers and discuss the overall implications of this and other recent studies of Melanesian volcanoes [37] to global volatile budgets.

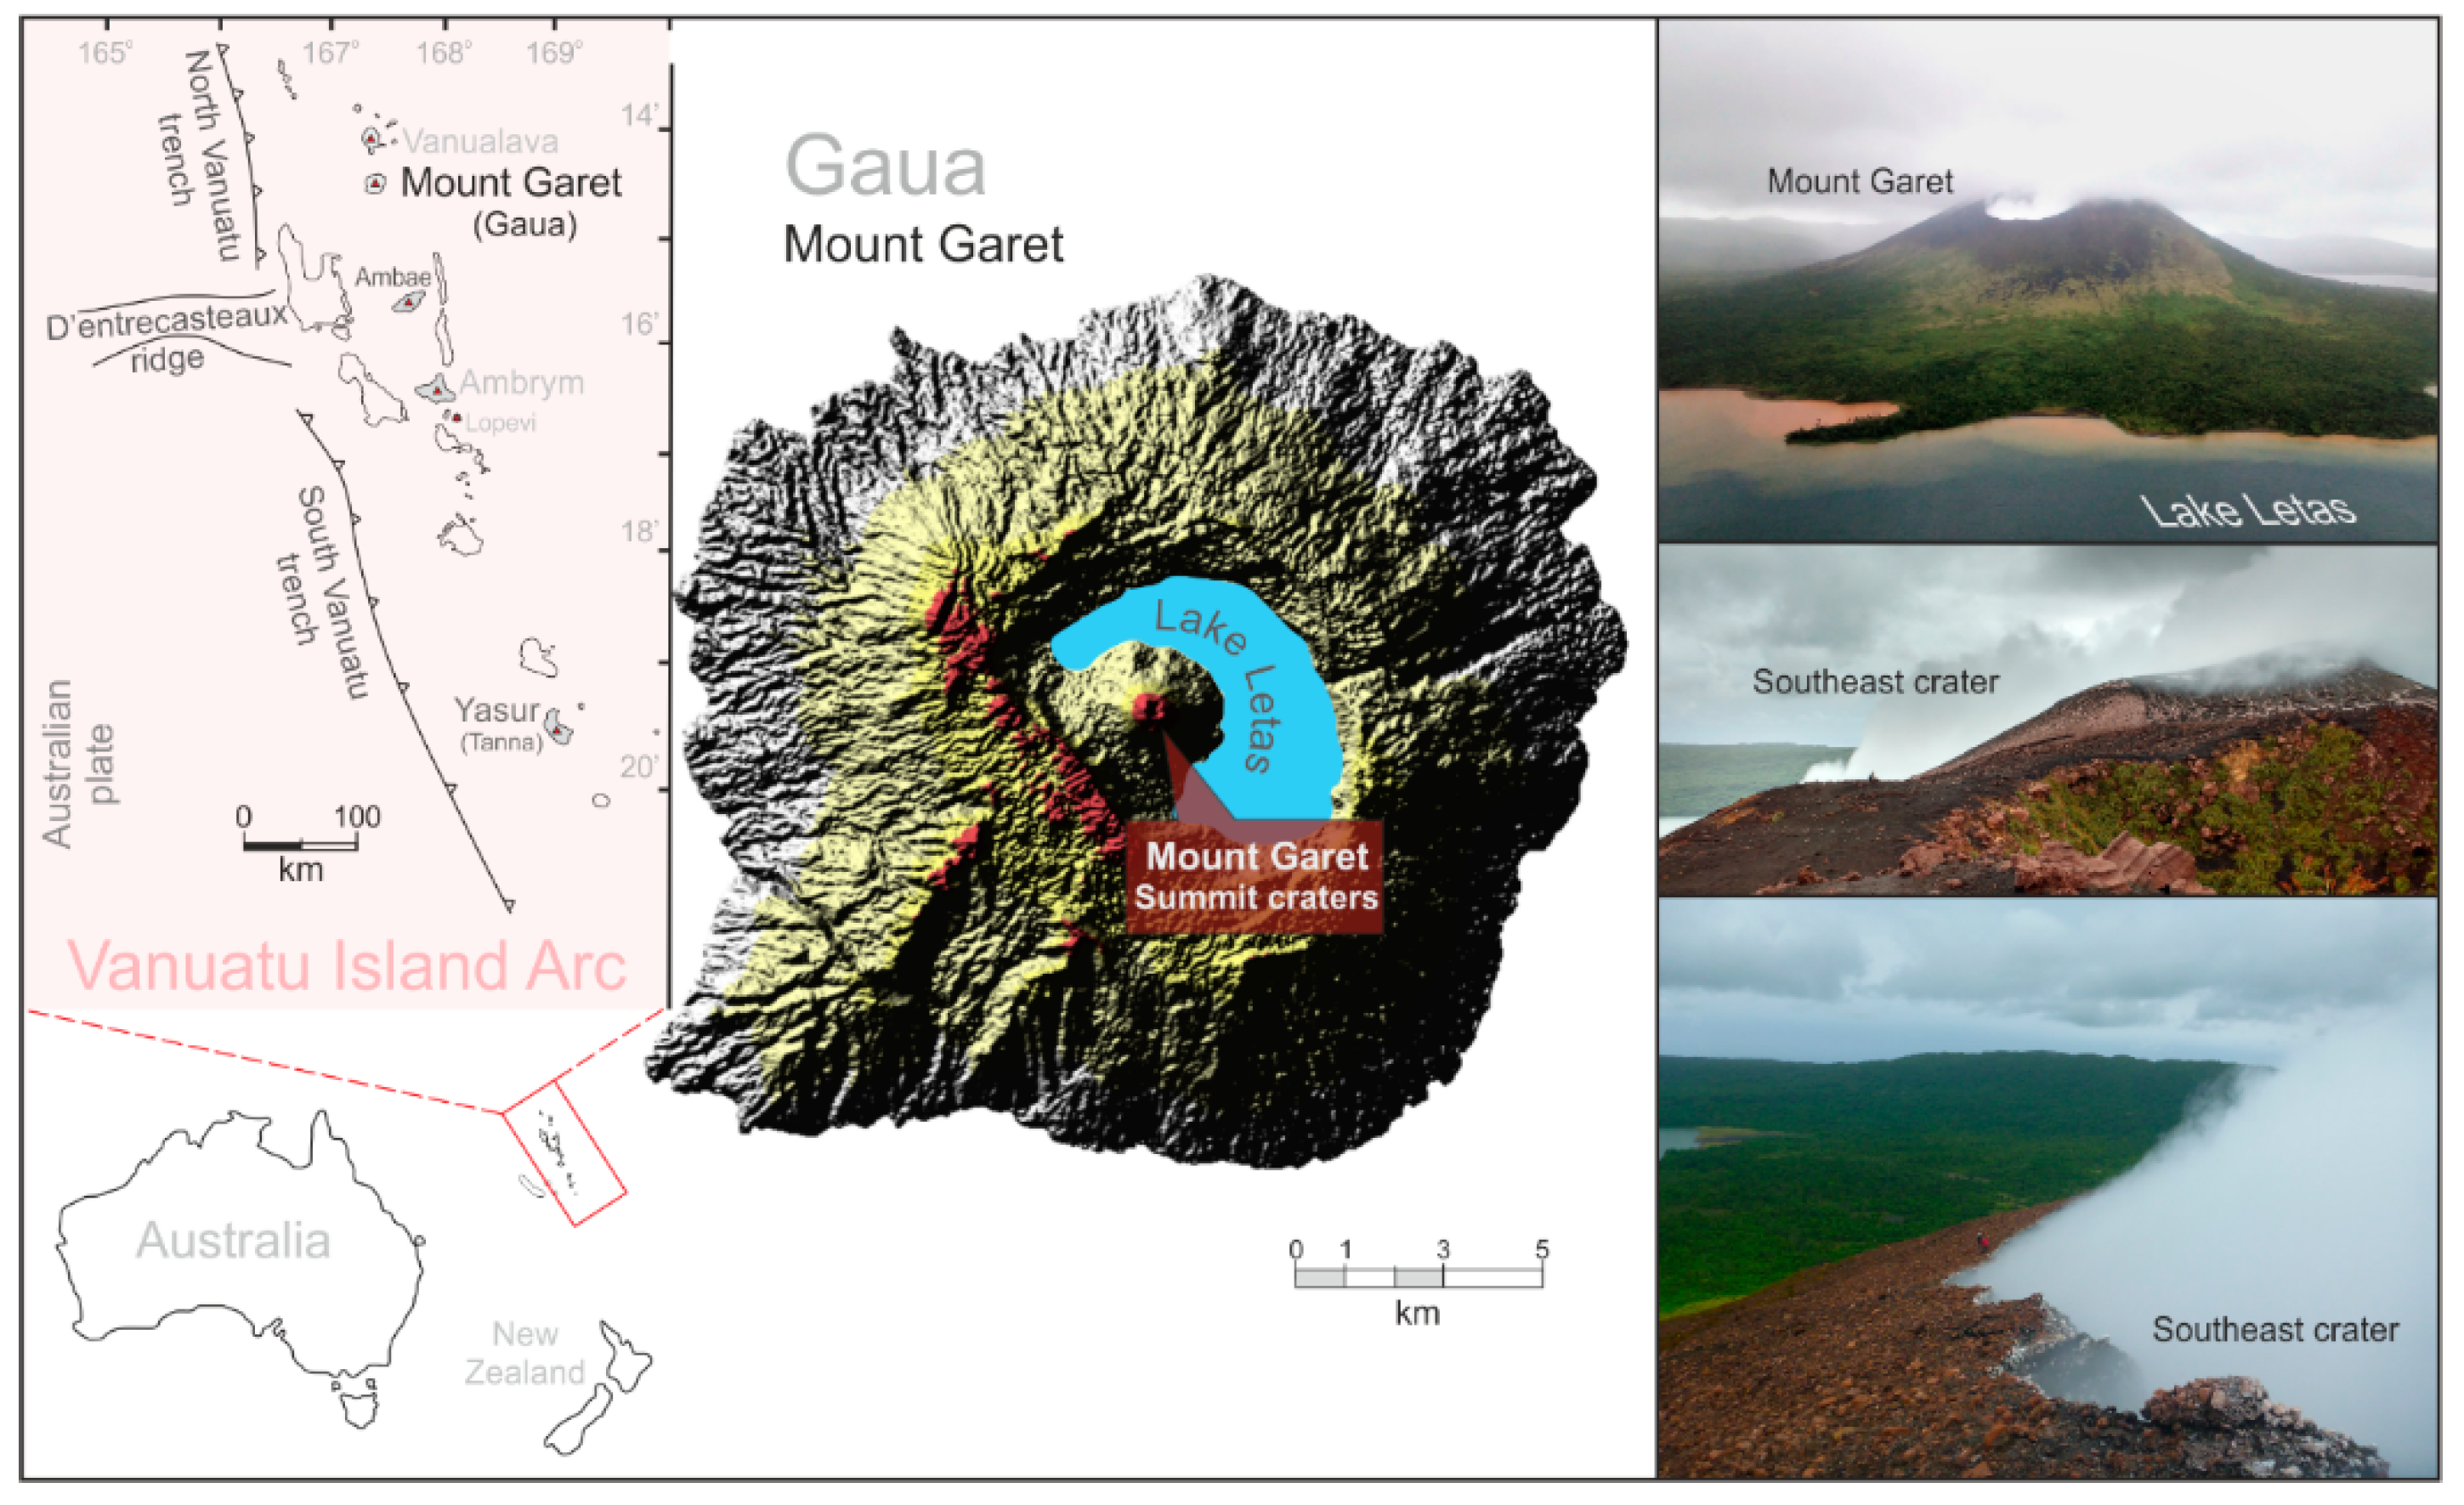
2. The Vanuatu Island Arc

The New Hebrides Island Arc is located in the southwest Pacific (Figure 1). It is composed of a narrow chain of Neogene to recent volcanic islands originating from the eastward subduction of the Australian plate beneath the Pacific plate, with associated back-arc extension of the North Fiji basin on the Pacific side [38,39]. The recent tectonic evolution of the arc is dominated by its collision with the D’Entrecasteaux Zone (DEZ) [40], which began 1.5–3 Ma ago near Epi island, and has been migrating northward as a result of the obliquity of the DEZ relative to the trench [40,41]. The New Hebrides Island Arc is subdivided in four different segments, the northernmost being essentially submarine and poorly studied. The other three include the central and south segments (CVS and SVS, respectively) and the high-Mg andesite volcanic segment (HMAVS) [42].
Vanuatu extends over the CVS and SVC, for about 700 km. It consists of a partly emergent ridge with an average width of 200 km, that overlies a steeply eastward-dipping subducted slab [42]. The DEZ collision triggered the detachment of the Australian plate lithosphere beneath the central part of Vanuatu. However, this detachment is less pronounced in the Northern part of the Vanuatu arc (due to a westward and upward invasion of the Indian-type MORB mantle) [42] where the island of Gaua is located.
Gaua, also named Santa Maria, represents the emerged part of a 3000 m-high and 40 km-wide composite volcano [43]. It consists of a little-dissected symmetrical cone, about 25 km-across, truncated at an elevation between 500 m and 690 m (a.s.l.) by an 8.5 × 6 km central caldera, filled by a large crater lake (Lake Letas; Figure 1). The active cone of Mt. Garet rises in the middle of Lake Letas.
Mt. Garet (797 m, a.s.l.) has two distinct craters. Since 1991, the activity has clustered on the southeast crater, which was also the site of the 2009–2010 explosions [44] and the survey location for the in-situ volcanic gas measurements reported here. A previous study [45] on the geology of the volcano identified a thick pile of basaltic and andesitic lava flows with associated rubble horizons and beds of red cinders or agglomerates. Mallick and Ash [45] also recognized an extensive cap of ash surrounding the caldera. On the flanks, small parasitic cones and fissure-fed lava flows are distributed along fractures concentric to the caldera rim. The morphology of vents and lava surfaces mantling the lower slopes suggest that these peripheral extrusions are very young. Analysis of 2009–2010 lavas, products of the last major eruption, revealed identical compositions to those previously reported in literature [43,45,46]. The occurrence of basaltic andesite and basaltic trachyandesite volcanites with highly calcic plagioclase suggest that the 2009–2010 eruption of Gaua was fed by an alkaline (K-rich) magmatic source, typical of the northern part of the Vanuatu arc [44].

The 2009–2010 Eruption of Mount Garet (Gaua)

According to local inhabitants, the 2009–2010 eruption of Mount Garet was the strongest witnessed since 1963. Bani et al. [44] assessed magma composition, lithology of volcanites, ash mineralogy, SO2 mass discharge, halogen release and lake water chemistry, and provided a comprehensive understanding of the 2009–2010 sequence of eruptive events described below.
A series of mild explosions on 29 September 2009, marked the beginning of a year-long eruption at Mount Garet. Shortly after, on October 3 and 14, airborne differential optical absorption spectroscopy (DOAS) measurements revealed SO2 fluxes of 3024 ± 1063 and 2765 ± 956 t d−1, respectively [36]. Despite high degassing rates, the first two months of volcanic activity were largely characterized by low explosivity, with the exception of four large explosive events that took place between 18–27 November 2009 and that displaced 250 inhabitants from the western coast of Gaua, the area most affected by ash fallout. By 17 December, SO2 discharge rates had remained high (3084 ± 1080 t d−1) [36], although the low proportions of juvenile materials and the abundance of hydrothermally altered rock and lava fragments deposited until then suggested an initial eruptive phase fueled by the subsurface interaction between the rising magma and a hydrothermal system [44].
Volcanic activity intensified again in January 2010. Eruption columns regularly reached up to 3000 m a.s.l. over the following five months (Volcanic Ash Advisory Center, Darwin) (GVP: 05/2011 (BGVN 36:05)) and ash fallout extended at least 10 km away from the source [44]. Following this, magma composition became more basic and more homogeneous, as evidenced by the lithological characteristics of ash fragments and further by Scanning Electron Microscopy (SEM) analysis [44]. The prominent role of more juvenile magma in this eruptive phase is attested by larger proportions of vesiculated fragments, and by a concomitant decrease in hydrothermally altered materials emitted. By the end of January, up to 75% of the erupted products were juvenile, and composed of 50% of vesiculated fragments [44].
Finally, in July 2010, volcanic activity at Mount Garet started to decline and the eruption ended in September 2010. The Vanuatu Geohazards Observatory (VGO) maintained the alert level at two throughout the eruption, and no further evacuation was carried out. During the 2009–2010 Gaua eruption, Lake Letas also went through a partial color change from blue to brown [44], which could still be seen in December 2018 in the area adjacent to Mt. Garet (Figure 1).

3. Materials and Methods

We used a multi-GAS unit [24,25] to measure in-plume concentrations of major volatile species at Mount Garet’s southeast crater (~797 m a.s.l.). The instrument was composed of a Gascard nondispersive infrared (NDIR) CO2 spectrometer from Edinburgh Sensors and City Technology SO2, H2S and H2 electrochemical sensors (see supplementary material S1 for details on sensor’s manufacture models, sensor’s accuracy and repeatability, calibration ranges and gas standards). Gas sensors were calibrated before and after the field campaign at the Earth and Marine Sciences Department (DiSTeM) of the University of Palermo. The system also included temperature (T) and relative humidity (Rh) KVM3/5 Galltec-Mela sensors. All components and respective power sources were contained inside a weather-resistant plastic case, with inlet/outlet ports to provide access to ambient air.
In the field, volcanic gas was pumped through the in-series connected sensors using a small pump with a flow rate of 1.8 l/min. In-plume gas concentrations were measured non-continuously for approximately 4 h (see Figure 2 for the whole concentration time series of CO2 and SO2) at a frequency of 1 Hz. Each measurement routine was preceded by instrument warm-up (3 min) and two minutes of ambient air flow to flush residual volcanic gas that remained trapped within the circuit.
Multi-GAS data were processed using the Ratiocalc software [47]. We selected specific acquisition time windows showing good temporal correlation (R2 ≥ 0.70) between volatile concentrations measured simultaneously [48,49,50] (see Figure 3a for different gas species). Molar ratios and errors reported in Table 1 were calculated from the slope and the R2 value of the best-fit line (linear regression, such as the example of Figure 3b, in black), respectively. Following an identical procedure, bulk compositions and associated errors reported in Table 1 and Table 2 were obtained from all data points for a given x/SO2 pair. The x/SO2 dot-to-dot ratio versus in-plume SO2 concentration [47,51] (Figure 3a) is also shown to demonstrate that ratios, widely scattered at low SO2 concentrations, converge to a less-varying ratio value (statistically indistinguishable from bulk x/SO2 ratios reported in Table 1) at high SO2 concentrations (30–70 ppmv).
Cross-sensitivity SO2 effects on the H2S sensor were estimated at 14% during calibration and corrections were applied during data processing to calculate interference-corrected H2S concentrations in the gas plume.
Water concentration ratios were calculated using measurements of T, P and Rh and the Arden Buck equation [47]. CO2 and H2O concentration ratios were estimated after subtraction of background-air concentration ratios acquired at plume-free areas, and their relative abundance is given in Figure 4 following the above described procedure.

4. Results

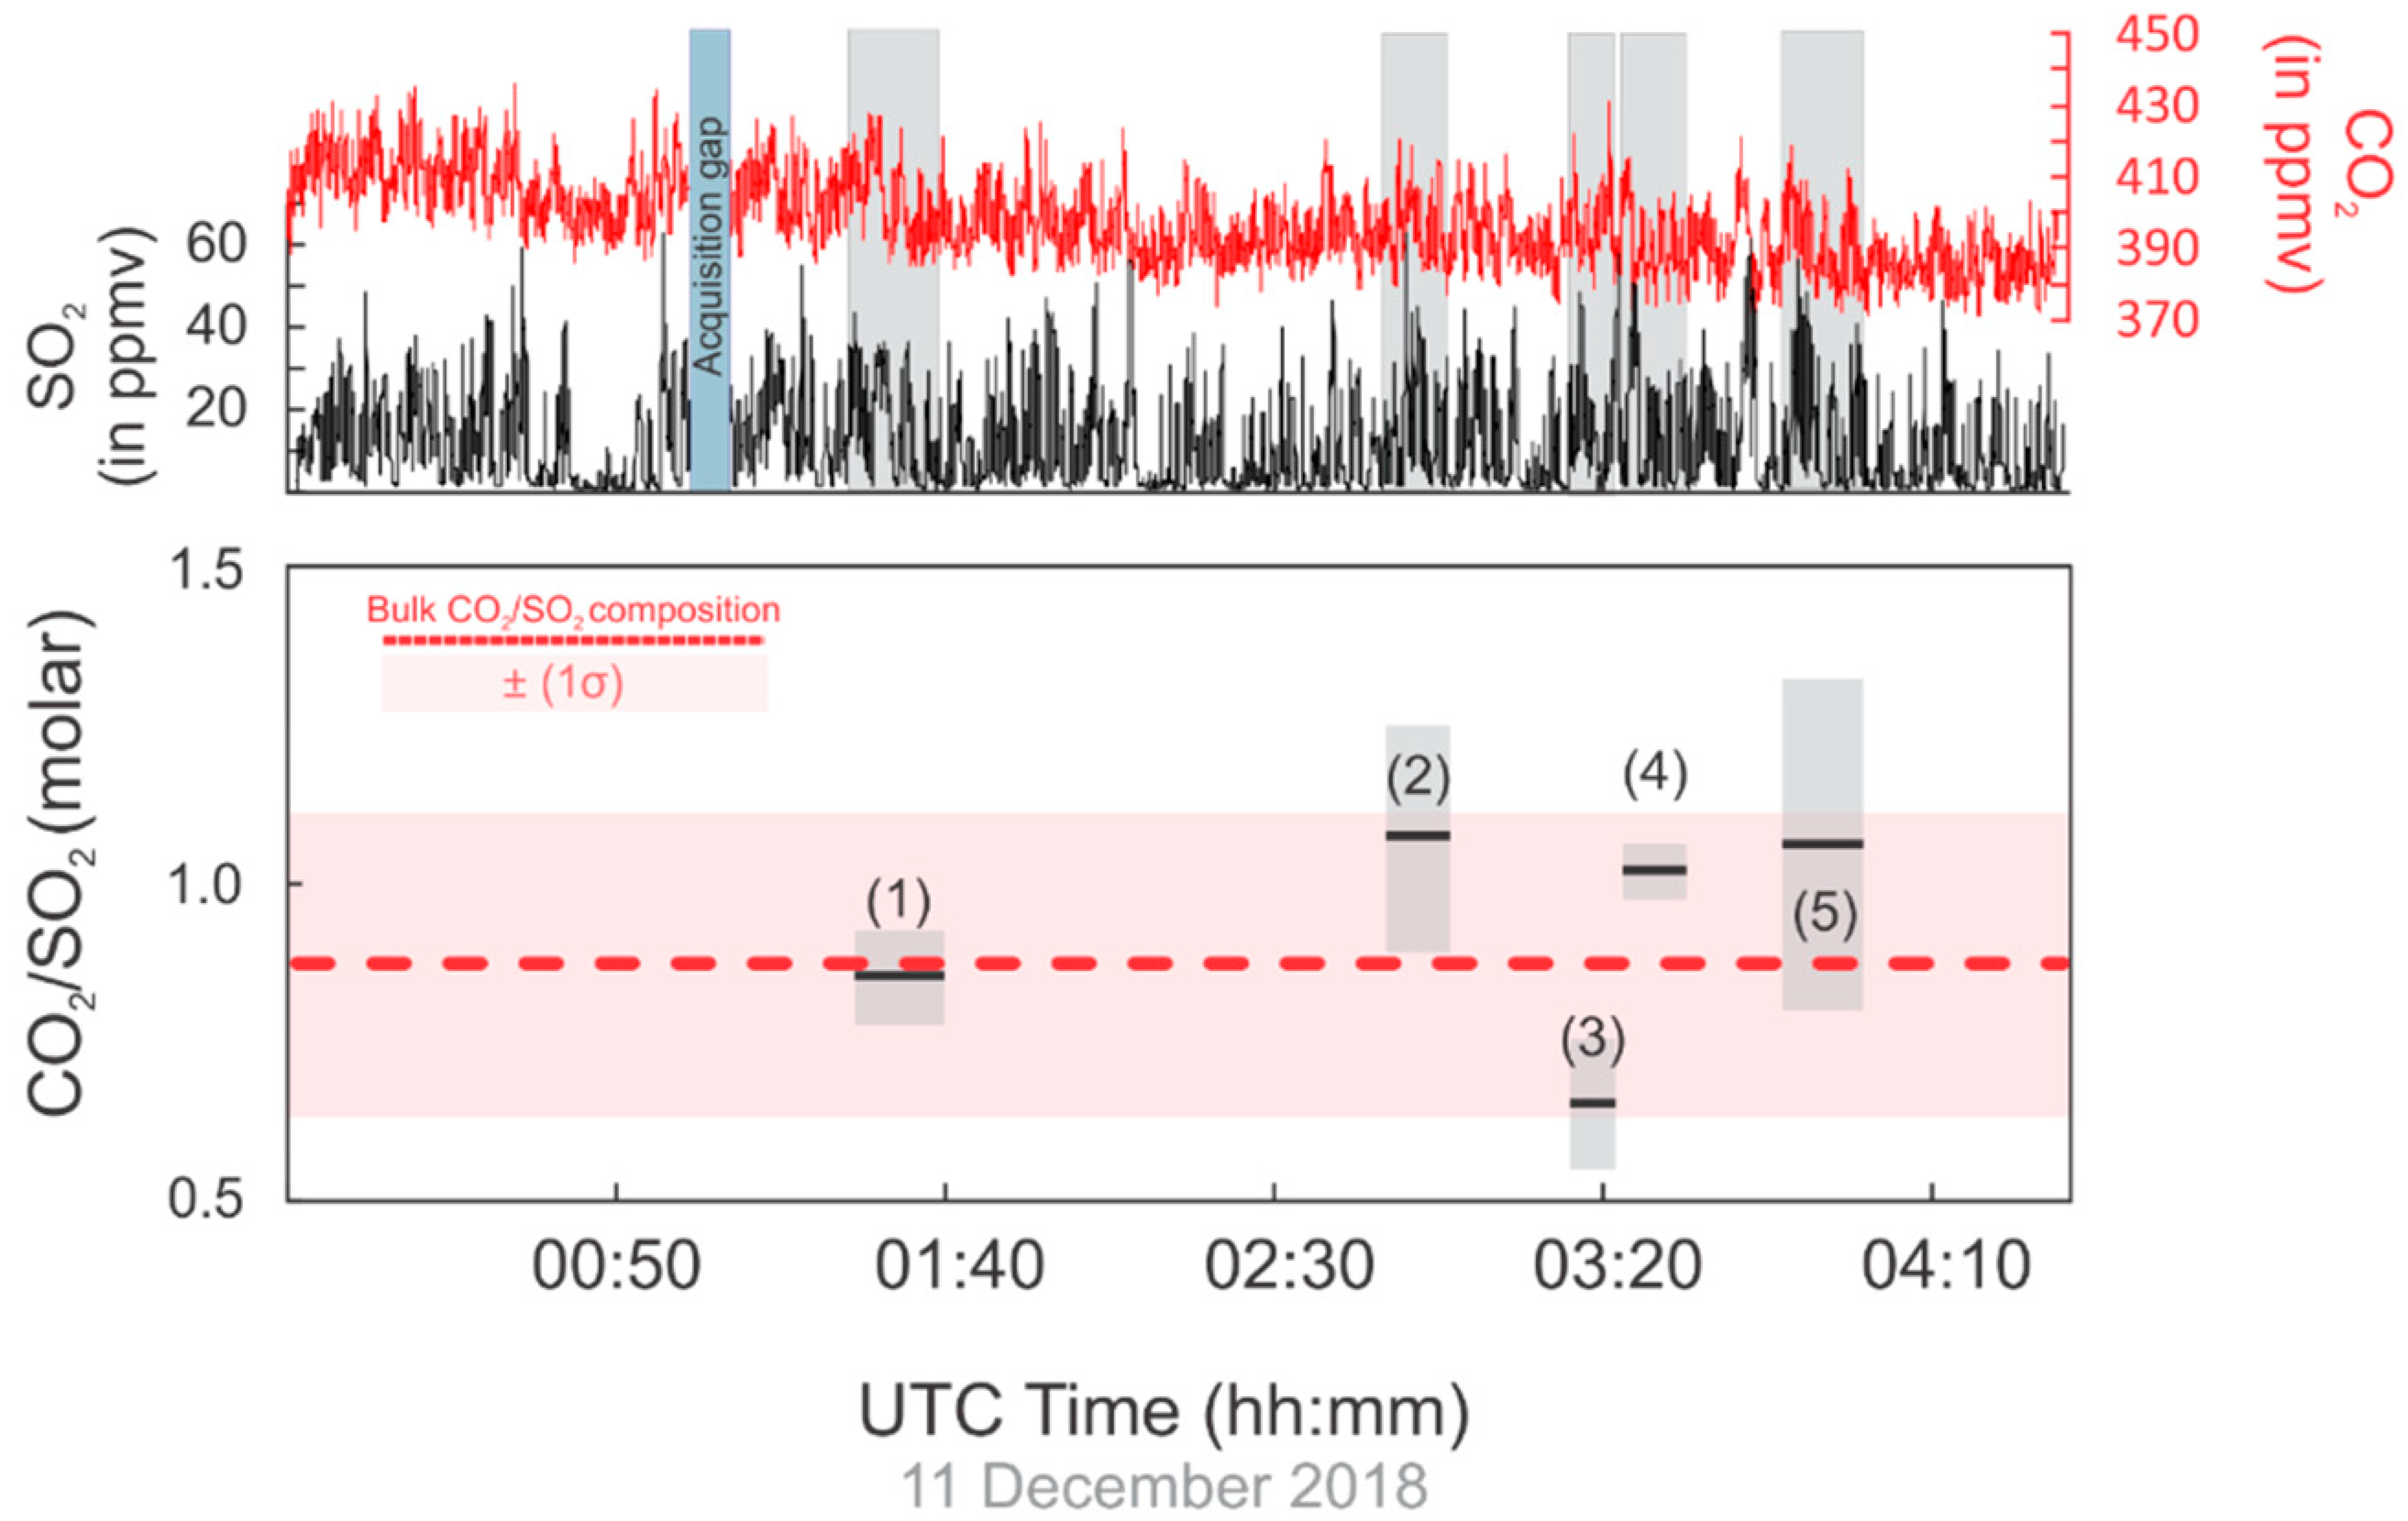
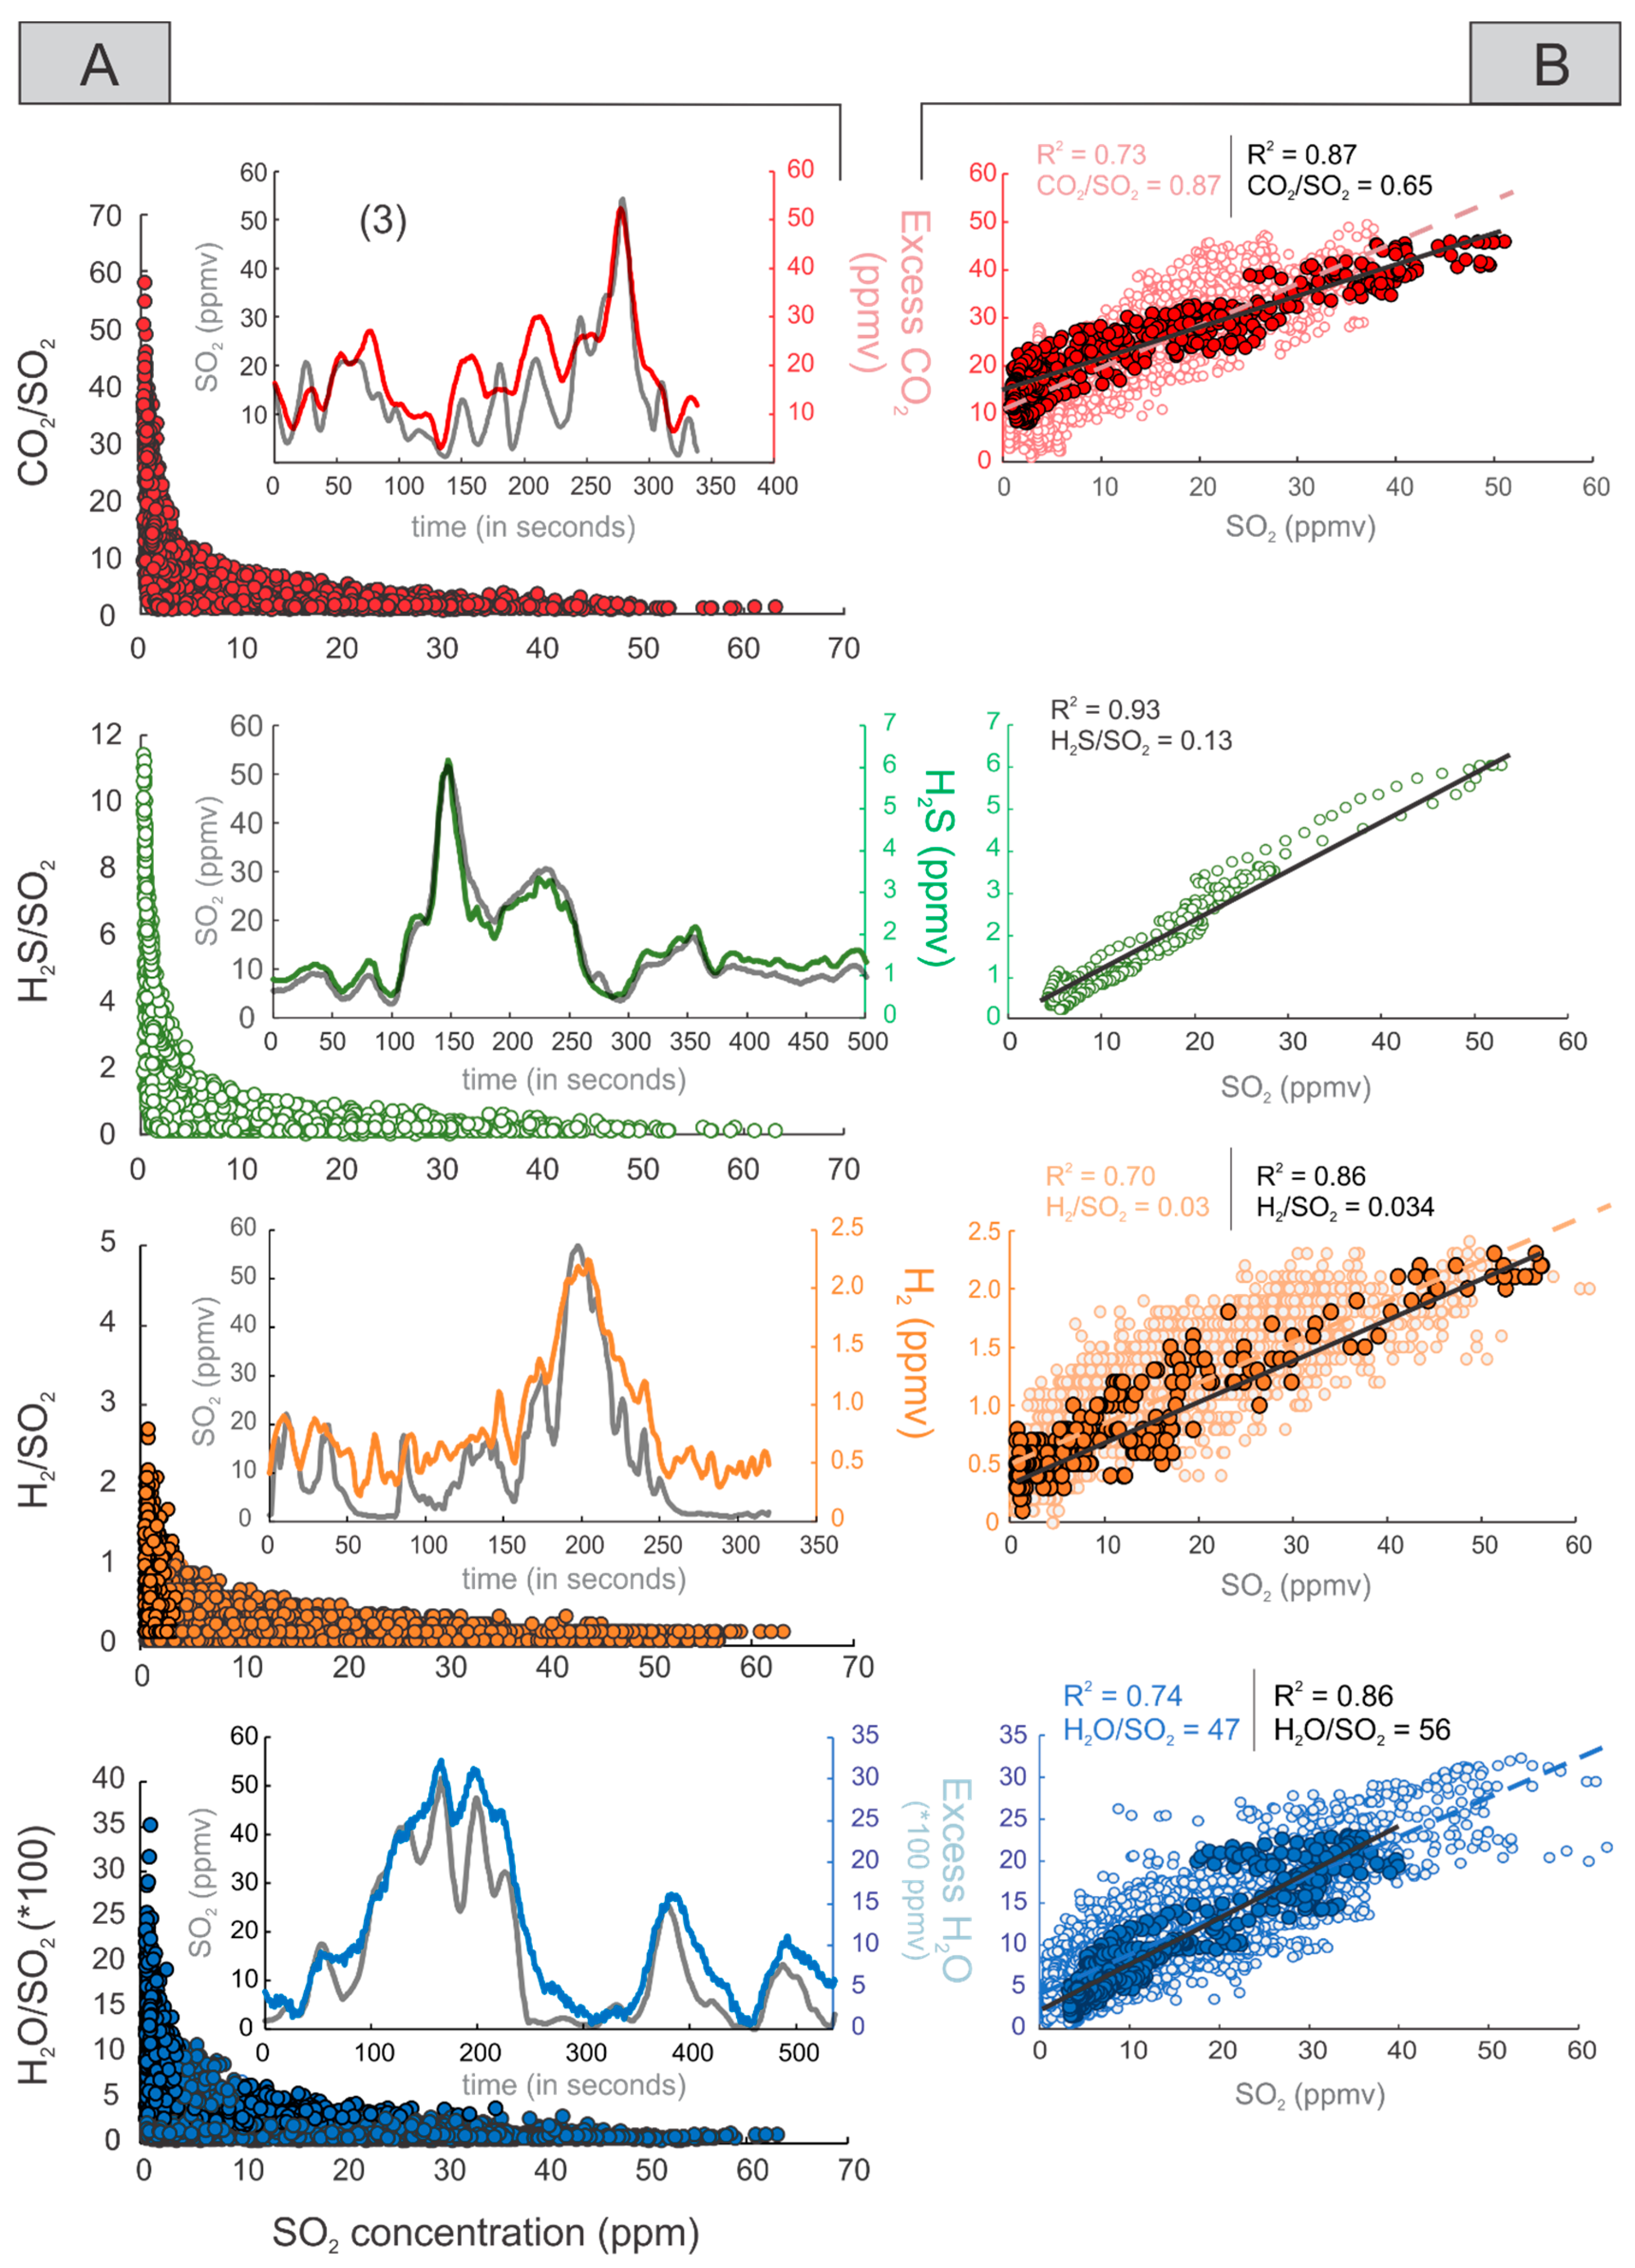
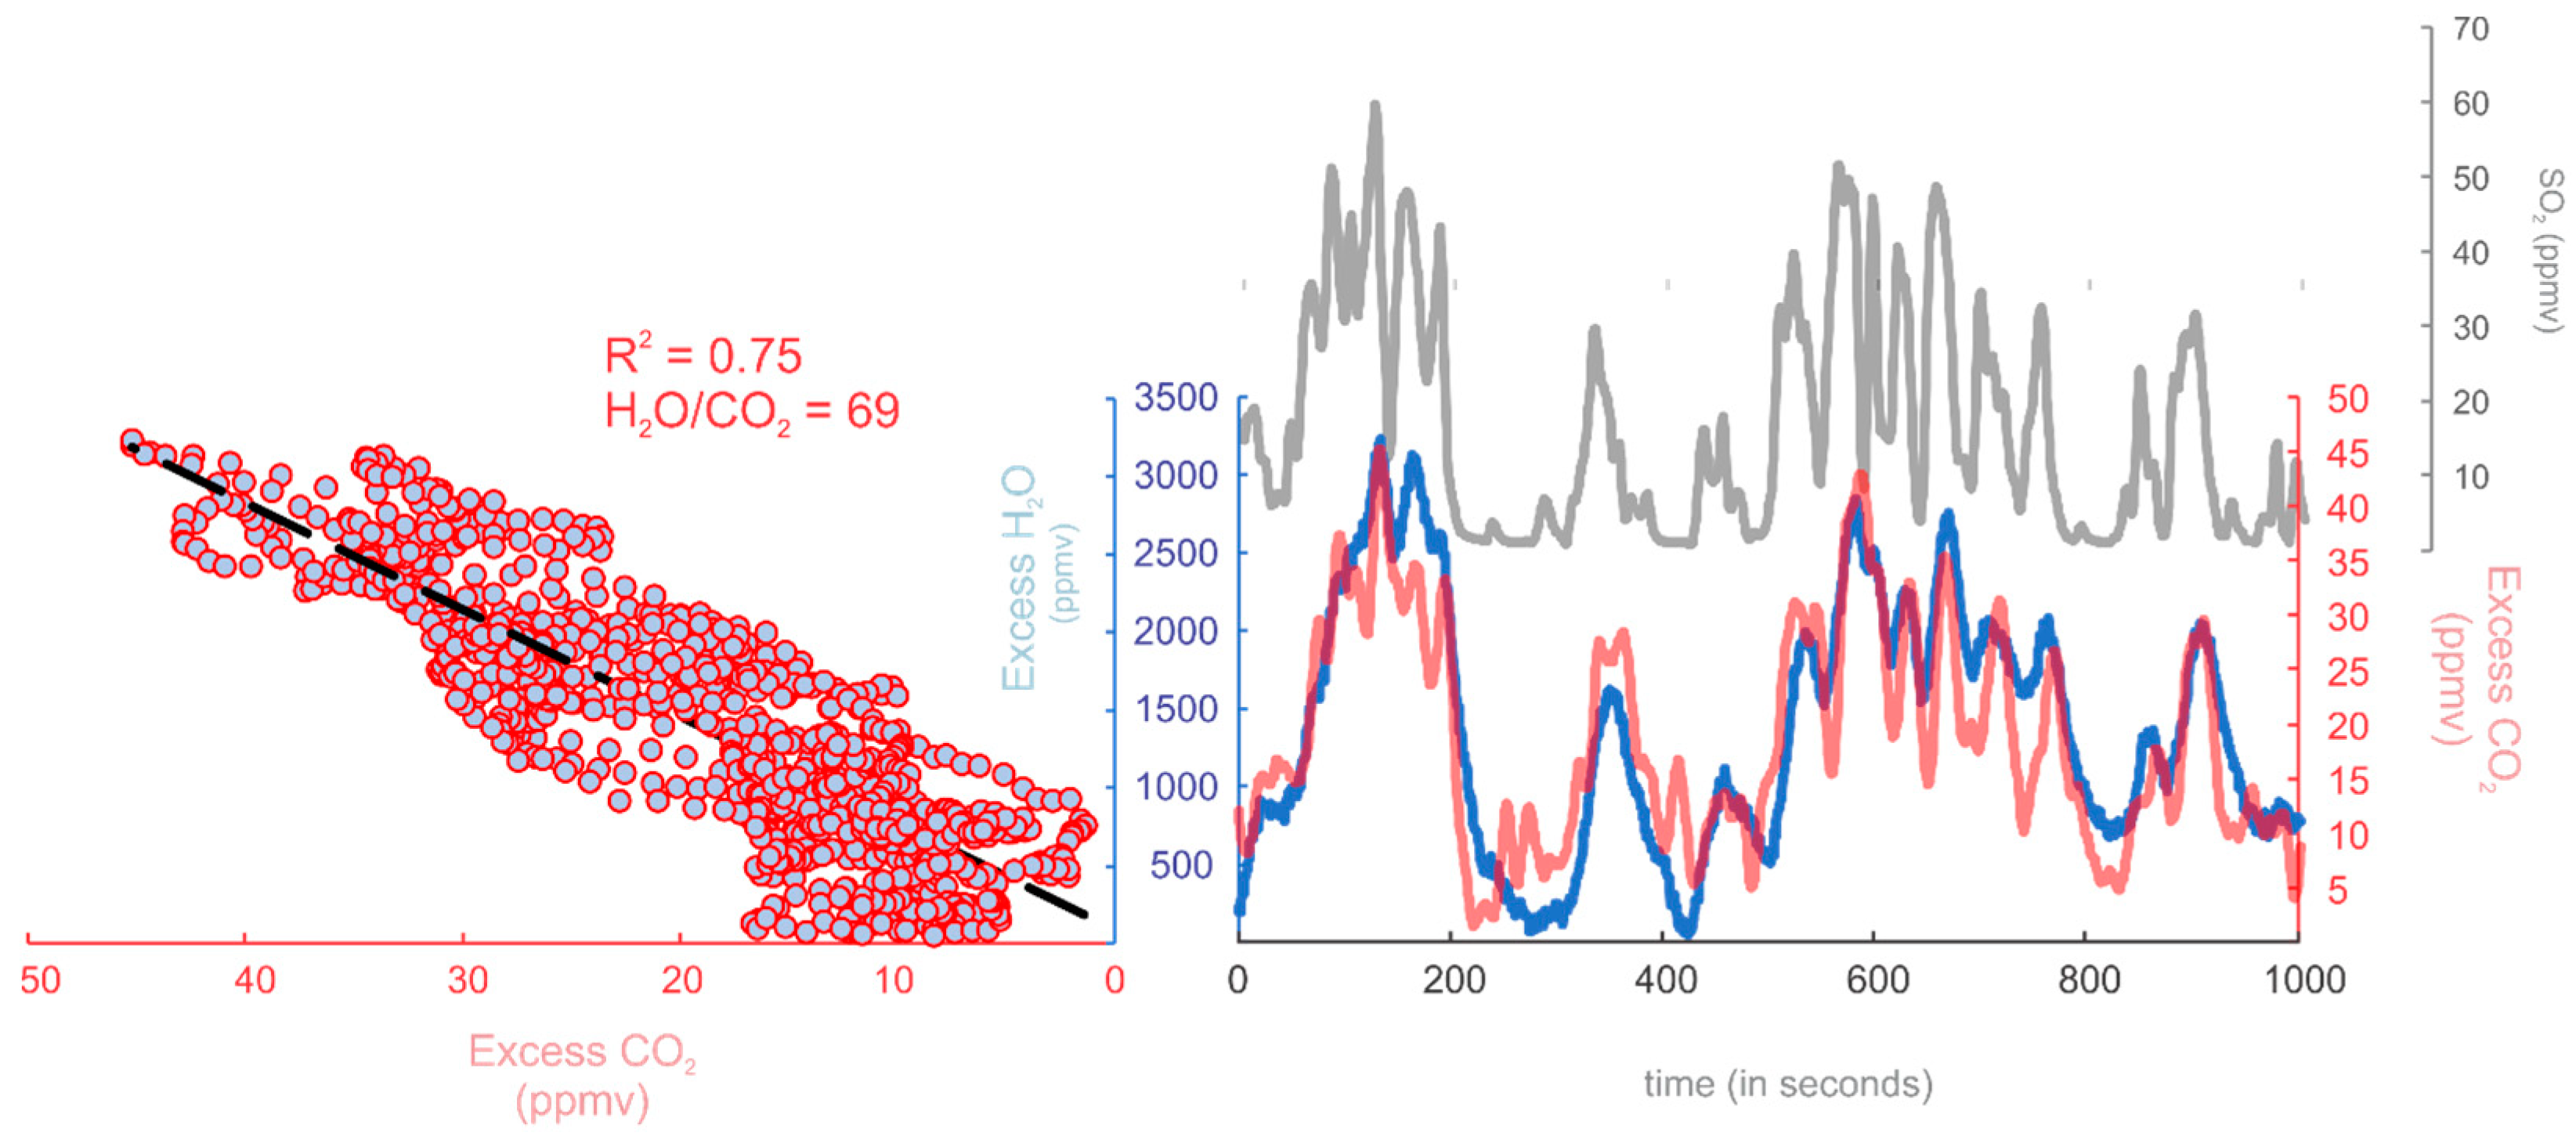
Volcanic Gas Composition

Gas emissions at Mount Garet were measured at close proximity to the southeast crater. Therefore, over the non-continuous, 4-h measurement period, the multi-GAS consistently captured a strong plume signal (up to ~70 ppm SO2). Background air-corrected CO2 concentrations varied from <1 to ~60 ppm (Figure 3 and Figure 4). Rare plume batches yielded H2S concentrations above the 14% cross-sensitivity to SO2 but occasionally reached in-plume concentrations up to ~7 ppm (Figure 3). We recorded H2 concentrations up to 3 ppm (Figure 3). The volcanic H2O signal (up to ~3500 ppm; Figure 3 and Figure 4) was intermittently resolvable from background noise caused by high humidity conditions characteristic of tropical environments.
Derived volatile ratios (in the form of x/SO2 ratios; where x is either H2O, CO2, H2S, or H2) for Mount Garet were obtained in measurement windows where strong positive co-variations (R2 ≥ 0.70) were observed between SO2 and the other volatile species measured (Figure 3). Interference-corrected H2S/SO2 ratio and H2/SO2 ratios (0.13 ± 0.01 and 0.03 ± 0.01, respectively) remained constant throughout the entire measurement period. Likewise, CO2/SO2 ratios varied narrowly between 0.65 and 1.07 (avg. 0.87 ± 0.24). Due to variable mixing between atmospheric H2O and the magmatic plume, H2O/SO2 measurements were more variable, ranging from ~40 to ~56 (avg. 47.2 ± 5.7; Table 1 and Table 2). Similarly, H2O/CO2 ratios also showed wide variations across the entire 4-h window, reaching values as low as ~40 and as high as ~70. However, the best correlation (R2 = 0.75) was found at the upper limit of that range, yielding a H2O/CO2 ratio of ~69 (Figure 4). The volcanic plume composition of Mount Garet was estimated at 95.9 mol% H2O, 1.8 mol% CO2, 2.0 mol% SO2, 0.3 mol% H2S, and 0.06 mol% H2 (uncertainties reported in Table 2 are expressed as the standard error of the regression analysis and subsequent error propagation).

5. Discussion

Our observations constrain the gas plume composition at Gaua as hydrous (~95.9 mol% H2O), with SO2 dominating over H2S (H2S/SO2 of 0.13 ± 0.01), and with a H2/H2O ratio of ~0.001.
Therefore, by using gas-phase H2/H2O (~0.001) and H2S/SO2 (~8.4) redox couples and using published thermodynamic constants [52,53], we can estimate the oxygen fugacity (fO2) of Mount Garet’s volcanic gases (e.g., Moussallam et al., 2019). Equations (1) and (2) also provide the means to estimate the gas-melt equilibrium temperature:
l o g H 2 H 2 O = 12707 T + 2.548 1 2 l o g f O 2
l o g S O 2 H 2 S = 27377 T + 3 2 l o g f O 2 l o g f H 2 O
The value of fH2O used in (2) is 0.959 given that, at ~1 bar the (Ptot × nH2O)/ntot = [(1 bar) (0.959ntot)]/(ntot) = 0.959 bar (where fugacity of a gas is equal to its partial pressure and that P(H2O) = P is the pressure in bar and ni the amount of species i in mol%) [54].
Solution yields an equilibrium temperature of ~641 °C and a logfO2 equivalent to ΔQFM = +2.0 where QFM refers to the quartz-fayalite-magnetite buffer [55], and where ΔQFM = logfO2−logfO2 of QFM at the corresponding temperature range estimated above. This solution plots well within the global trend highlighted in [22].
As such, an equilibrium temperature of ~641 °C is higher than the temperature at which sulfur partitioning into the liquid hydrothermal system or gas scrubbing reactions in a shallow subsurface environment may occur [56,57]. Therefore, the absence of contamination of Gaua’s magmatic gas allows for comparison with other high-temperature arc gases worldwide (Figure 5) [17,22,28]. Being the first for Gaua, our results contribute to our understating of volcanic gas signature and fluxes along the Vanuatu arc, as discussed below.

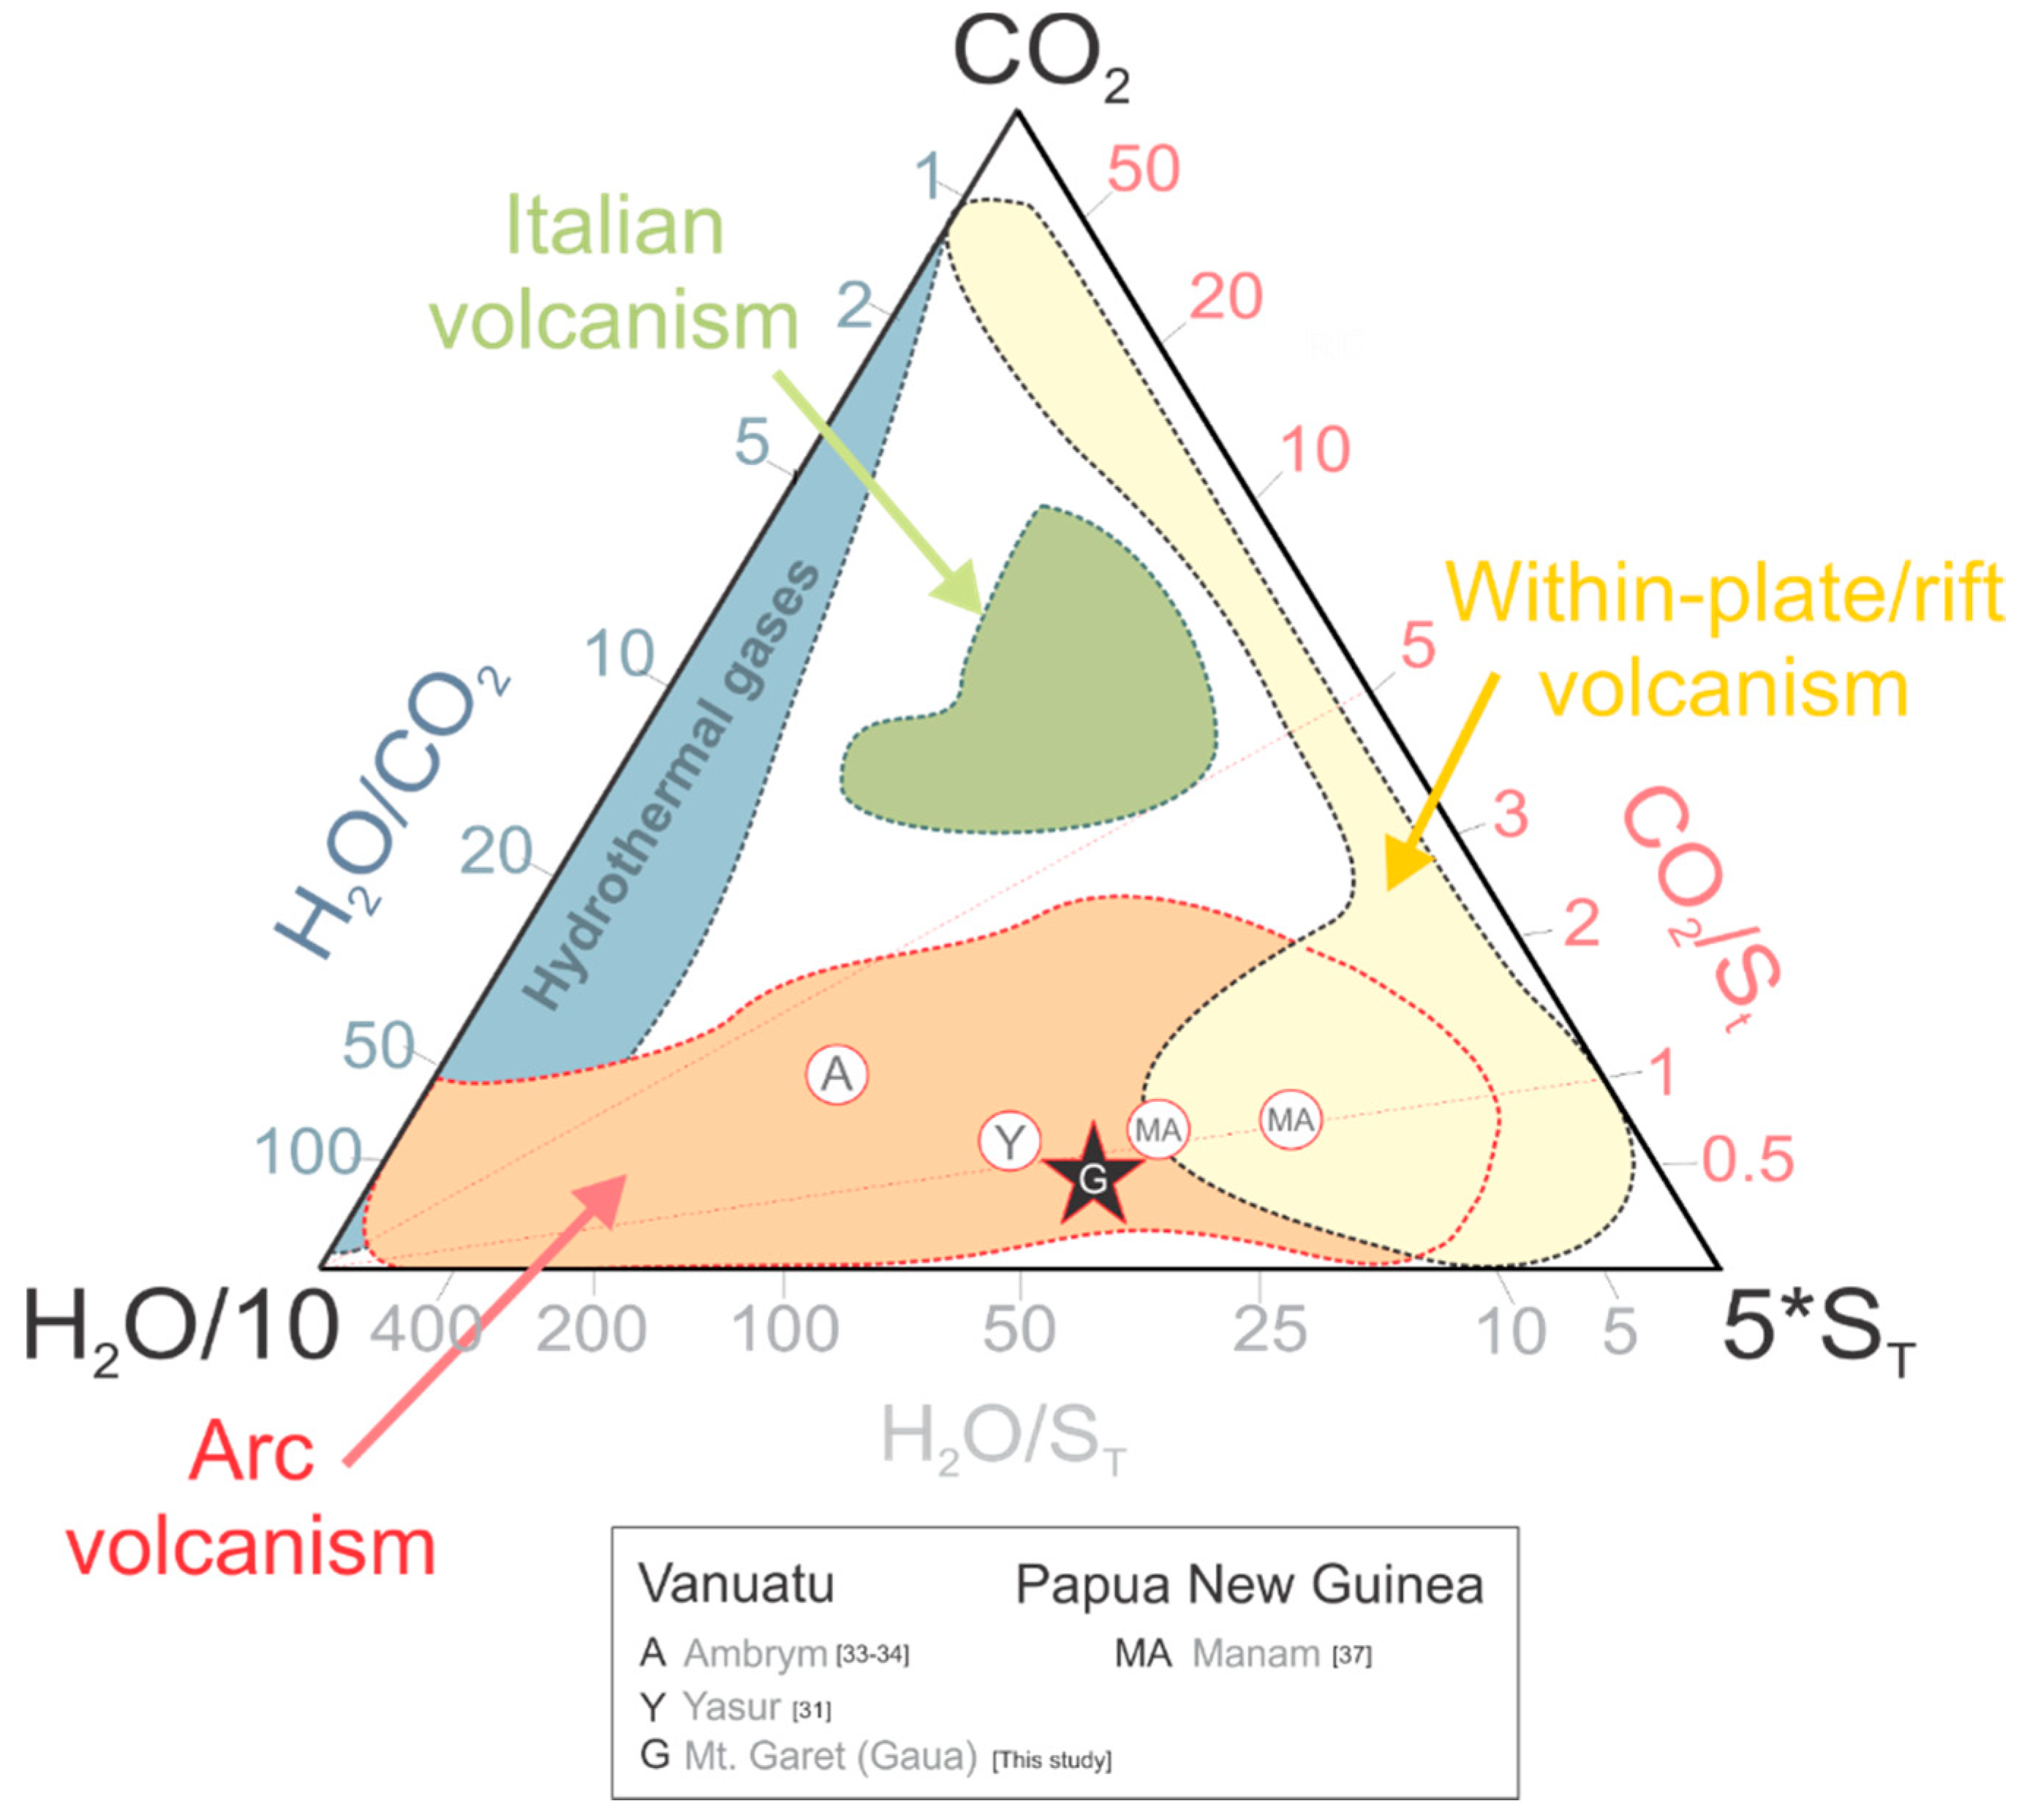
5.1. Along-Arc and Inter-Arc Volcanic Gas CO2/ST Variations

Recent global volcanic gas compilations have revealed systematic inter-arc and along-arc variations in gas CO2/ST ratios [15,21] which are thought to be mainly governed by variations in mineralogy and chemistry of sediments (especially their C load) subducted at the corresponding trenches [6,7]. A better understanding of these global correlations between arc inputs (sediments) and outputs (volcanic gases) requires extending volcanic gas measurements to remote, poorly studied arc regions, such as Melanesia. Indeed, as noted by Aiuppa et al. [15,21] several of the top volcanic arc emitters have yet to be measured for their CO2/ST ratios, due to their remote location and/or high level of volcanic activity.
The results we report here add new data to this global dataset to allow a more complete characterization of the source, fate and cycling of volatiles, especially C, in subduction zones. In this section, we focus the discussion of our results within the context of recently collected gas data for other Melanesian volcanoes.
As two of the most active volcanoes in the world, volcanic gas emissions at Yasur and Ambrym (Vanuatu; see Figure 1) have been studied extensively in recent years. First reports on volcanic plume chemistry at Ambrym were presented by Allard et al. [33,34], while Oppenheimer et al. [30], Métrich et al. [31] and Woitischek et al. [32] reported on gas compositions at Yasur volcano. These studies inferred the plume volcanic gas CO2/ST ratios at ~1.5 [15,33,34] and ~1.6 [31] at Ambrym and Yasur, respectively, within the range of CO2-poor (Group 1) volcanic gases (CO2/ST < 2) [15,21].
Aiuppa et al. [15,21] noted that this CO2-poor volcanic gas composition for the Vanuatu arc, as inferred from observations at Ambrym and Yasur, is somewhat at odds with the relatively high C content of sediment in the subducting slab (bulk sediments in the Vanuatu trench contain up to 4 wt.% CO2) [6]. In other arc sectors where C is subducted via sediments (e.g., Central and northern Southern America) [7], volcanic gases are typically more C-rich, and display characteristics of those volcanoes in the Group 2 category (2 < CO2/ST < 4) [15,21,50,58]. In contrast, the Vanuatu gas compositions measured thus far resemble more closely those of subduction zones of the NW Pacific (the Kuril–Kamchatka and Marianas–Japan arc segments) [15], all of which exhibit low C content in subducting sediments [6].
Our results here provide a first insight into the CO2/ST signature of volcanic gases in the northern part of the Vanuatu arc. Our average volcanic gas CO2/ST estimate at Gaua is ~0.9, for measurements performed in very dense plume conditions (up to >50 ppmv SO2). The 2018 Gaua gas composition also plots at the low-CO2 end of the population of volcanic arc gases worldwide (Figure 5). Notably, a similarly C-poor gas measurement was recently obtained further to the north at Manam volcano, in Papua New Guinea, for which Liu et al. [37] quoted a CO2/ST ratio of ~1.
The relatively high C content of sediments at the Vanuatu trench led Aiuppa et al., [21] to predict a CO2/ST ratio of ~2.5 for Gaua, well in excess of our 2018 measured ratio of ~0.9. Thus, the C-rich nature of the subducted sedimentary input in the region does not appear to translate into a C-rich volcanic gas output, as seen elsewhere (e.g., central and northern Southern America). The possibility that the sedimentary C input into the subduction zone is accreted to the accretionary wedge (rather than being subducted) is inconsistent with the results of Von Huene and Scholl [59], who classified the Vanuatu arc as a non-accreting margin, with effectively no accretionary prism present. Further, seismic reflection data indicate that most of the sediments are indeed subducted [60]. In fact, the same authors argue that, in the region, the addition of a significant subducted sediment component has variably modified the mantle wedge over time. Within the less-surveyed northern Vanuatu region, distinct geochemical patterns can be observed. For instance, lavas from Gaua have lower 143Nd/144Nd than lavas from Merelava, despite similar Sr- and Pb-isotope compositions. This can be explained in terms of a common Indian-MORB-like mantle source but would indeed require a higher contribution from subducted sediments to Gaua lavas [60]. Ultimately, the mismatch between the high C input (sediments) and the low C output (volcanic gases) may simply reflect a limited C recycling by fluids delivered by the slab, leading to sedimentary C transport deep in the mantle [7].
We caution, however, that our discussion is based on one single, brief campaign at Gaua, while more continuous and prolonged gas records would be required to fully capture the volcano’s time-averaged degassing behavior and gas composition. Indeed, gas compositions exhibit both long-term changes in response to changes in volcano behavior (e.g., as persistent degassing activity transitions into unrest and finally eruption) [19], and also more subtle short-term changes related to rapid events of gas segregation and explosive burst. At Yasur volcano, for example, the bulk composition appears to have remained relatively stable since the 2000s, yet with CO2/ST ratios spanning between 1.6 and 2.2 [30,31,32]. In addition, short-term (timescales of seconds to minutes) fluctuations in gas compositions between ‘passive’ (CO2/ST~1.9) and ‘active’ (CO2/ST~2.9; during strombolian explosions) degassing regimes have also been observed [30,32]. Ultimately, additional gas observations at Gaua and other Vanuatu volcanoes is required for a more robust assessment of C recycling efficiency along the arc.

5.2. Implications for the Vanuatu Arc Volatile Budget

Vanuatu hosts two of the largest volcanic gas emission sources globally. Ambrym, a volcanic island known for frequently hosting the lava lakes of Benbow and Marum until its 2018 eruption [61] appears first on the list of subaerial SO2 emissions measured from space between 2005–2015 [23]. The 10-year averaged SO2 emission inventory ranks Yasur volcano (located in the island of Tanna; see Figure 1) at number 11 in the list. Notably, Bagana, Tavurvur and Manam, from the nearby archipelago of Papua New Guinea, are all in the top 10. Clearly, the southwest pacific is a major contributor to global volcanic gas release.
Vigorous volcanic SO2 degassing in Vanuatu had been reported previously by Bani et al. [36]. Using repeated DOAS (differential optical absorption spectroscopy) ground measurements (2004–2009) and satellite OMI data (2004–2011), (Bani et al., 2012) estimated that on average 3 Tg y−1 of volcanic SO2 are emitted into the atmosphere along the Vanuatu arc, to which Ambrym reportedly contributed to about a third. Such estimates did not include sporadic eruptions and/or extreme passive degassing events, but nonetheless represented about one-fifth of currently estimated global volcanic SO2 emissions. The study also marked the first ground-based SO2 flux estimates for Mount Garet volcano. During October and December 2009, seven DOAS traverses yielded a mean SO2 emission rate of ~2959 t d−1 [36]. These measurements were taken during the 2009–2010 eruption that started in September (see cfr. 2 for details) and most probably reflected the high degassing rates registered in the first few months of the eruption [36,44].
In fact, Carn et al. [23] found much lower SO2 emission rates for the period of 2005–2015 at Gaua. They reported a 10-year maximum of ~1418 t d−1 in 2012, and a 10-year average of ~434 t d−1 of SO2. Mismatches between ground and satellite-based emission inventories may arise from several factors [62]. Especially during the course of the 2009–2010 eruption (OMI satellite data yielded yearly averaged emissions of ~490 and 605 t d−1 for 2009 and 2010, respectively) [23], discrepancies may originate from difficulties in accurately measuring SO2 in proximal ash-laden plumes, like the ones originated, for instance, in the explosive events of November 2009 [44]. Due to the low altitude of Mount Garet (~797 m a.s.l.), it is also possible for some passive degassing emission rates measured via satellite to be underestimated. That is because the detection limit will be lowest for low-latitude volcanoes, which benefit from more satellite observations under optimal conditions (e.g., low solar zenith angles) [23,62].
No SO2 flux record was obtained during our 2018 survey. We therefore combine the 10-year (2005–2015) average volcanic SO2 flux of Carn et al. [23] with our in-situ measurements of volcanic gas compositions (2018) to estimate, for the first time, Mount Garet’s emission inventory for H2O, CO2, H2S and H2. In doing so, we assume the 2005–2015 average [23] as the available best proxy for the characteristic SO2 emission behavior during the volcano’s persistent (yet quiescent) degassing behavior (as observed during our in-situ survey in 2018). Using Bani et al. [36] SO2 flux dataset would have led to substantially higher fluxes, yet most likely biased due to the fact that the large pulses in SO2 release in the Bani et al. [44] dataset correspond to degassing behaviors associated with the 2009–2010 explosive eruptions and are markedly distinct from the passive degassing observed in 2018. Our estimated fluxes are thus H2O ~5758 t d−1, CO2 ~259 t d−1, H2S ~30 t d−1, and H2 ~0.5 t d−1, and correspond to a total volatile flux (TVF) of about 6482 t d−1 for Mount Garet.
Our inferred CO2 fluxes are especially relevant because they contribute new data to recent cataloguing efforts [19,20,21,29] aimed at a more robust quantification of the global volcanic CO2 output. Such global estimates have remained poorly constrained until recently, because technical challenges in volcanic CO2 measurements have resulted in sparse and incomplete global CO2 flux catalogues. With a CO2 flux of ~259 t d−1, Mount Garet ranks as intermediate-size volcanic CO2 source (the median volcanic CO2 flux in catalogues [20,29] is ~320 t d−1). Notably, our measured Gaua CO2 flux is a factor ~3 lower than the CO2 flux (~745 t d−1) predicted by Aiuppa et al. [21]. The latter authors circumvented the lack of direct gas measurements at Gaua (unavailable at the time of their study) by predicting the time-averaged volcanic gas CO2/ST ratio from trace element compositions (Ba/La and Sr/Nd ratio) of Gaua lavas and global gas vs. trace element relationships. The mismatch between the direct (this study) and indirect [21] estimates reflect the difference between measured and predicted CO2/ST ratio (0.9 vs. 2.5), as discussed above (cfr. 5.1).
Our results suggest persistent degassing at Mt Garet (Gaua) contributes an additional ~2% to CO2 emissions along the Vanuatu arc, which during the 2005–2015 period appeared dominated by prodigious lava lake degassing at Ambrym [33,34] (the inferred 2005–2015 average is ~7586 t d−1 [21]) and, to a lesser extent, by open-vent degassing at Aoba and Yasur (inferred 2005–2015 averages of ~4933 and ~1549 t d−1, respectively) [21].

6. Conclusions

Global inventories of volcanic gas data remain sparse and incomplete, especially for remotely located volcanic centers such as Mount Garet, in Gaua. Less than 60 of the several hundred currently degassing Holocene volcanoes have been characterized geochemically for their gas emissions and less than a few (<10) volcanoes have permanent in-situ instrumentation operating in real-time.
In this study we presented volcanic gas composition data from Mount Garet volcano. Our survey provides the first characterization of plume chemistry for this volcano. Although results reported here are punctual, they set unprecedented information on the composition and flux of volcanic gases at Mount Garet during a quiescent activity period (December 2018). By combining our results with satellite-based SO2 flux measurements (average of 434 t d−1 over the 2005–2015 period) we estimated H2O, CO2, H2S, and H2 outputs of ~5758 t d−1, ~259 t d−1, ~30 t d−1, and ~0.5 t d−1. These results rank Mount Garet as an intermediate-size volcanic CO2 point source, well below the intense CO2 emissions derived for nearby Ambrym (until its 2018 eruption) and Yasur volcanoes further south in the same Vanuatu arc. We caution that our observations are only likely to be reprehensive of Mt. Garet’s quiescent emissions, while much higher CO2 and total volatile fluxes are likely to be associated with eruptive phases, as for instance supported by the high SO2 flux emissions measured during the 2009–2010 period of unrest (for which no gas composition is unfortunately available). Our results thus confirm the need to better constrain the temporal variability of gas compositions through periodic and/or continuous surveys. Resolving the volatile output for both quiescent and unrest phases, along with newly reported volcanic gas plume compositions, would foster the ability to interpret volcanic gas monitoring signals and perform hazard assessments in the future.
Our volcanic gas survey has also revealed an especially C-poor composition (CO2/ST ~0.9) for Mount Garet volcano, well below the compositions derived for nearby Ambrym and Yasur (CO2/ST ~1.5 to 1.6), and un-matching with the previously predicted volcanic gas compositions for the same volcano (CO2/ST ~2.5). The contrast between the relatively high C content of sediments at the Vanuatu trench and the CO2-poor nature of volcanic gases measured at Mount Garet during our 2018 field campaign is intriguing. In other volcanic arcs where C is subducted through sediments (northern segments of the Andean Volcanic Belt, for example), volcanic gases typically display higher CO2/ST ratios (~2–4). Furthermore, despite the fact that recent gas studies at other persistently degassing Melanesian volcanoes have reported similar in-plume volatile signatures, more volcanic gas surveys are needed to accurately assess the apparent mismatch between the high C input (sediments) and the low C output (volcanic gases). That will ultimately allow for more robust arc-scale interpretations of the nature of gas emissions from Southwest Pacific volcanism, a region of much relevance to arc CO2 budgets globally, and their implications for our overall understanding of global geochemical cycles and atmospheric evolution over time.

Supplementary Materials

The following are available online at https://www.mdpi.com/2076-3417/10/20/7293/s1, Supplementary Material S1: “specifications on multi-GAS infrared (IR) and electrochemical sensors and gas standards used for instrument calibration” is available for consultation.

Author Contributions

Conceptualization, J.L., Y.M., P.B. and N.P.; project administration, Y.M.; data acquisition, J.L., Y.M., P.B. and N.P.; data curation, J.L.; graphical editing, J.L.; writing—original draft preparation, J.L., Y.M., P.B., N.P., A.A., M.B., G.G.; writing—review and editing, J.L. All authors have read and agreed to the current version of the manuscript.

Funding

This research was conducted as part of the Trail by Fire II—Closing the Ring Project (PI: Y. Moussallam) funded by the National Geographic Society (grant number CP-122R-17), the Rolex Awards for Enterprise and the French national Research Institute for Development (IRD). J.L. also acknowledges travel funding support from Ministero dell’istruzione, dell’università e della ricerca (MIUR;) under grant n. PRIN2017-2017LMNLAW).

Acknowledgments

We thank the Vanuatu Meteorology and Geohazards department scientists and staff for their collaboration and support throughout our field campaign in Vanuatu (December 2018). We would also like to thank Charles and Angela Bice at the Wongrass Bungallow for their incredible hospitality and logistical help during our stay in the island of Gaua.

Conflicts of Interest

The authors declare no conflict of interest.

References

  1. Kerrick, D.M.; Connolly, J.A.D. Metamorphic devolatilization of subducted marine sediments and the transport of volatiles into the Earth’s mantle. Nature 2001, 411, 293–296. [Google Scholar] [CrossRef]
  2. Kerrick, D.; Connolly, J. Metamorphic devolatilization of subducted oceanic metabasalts: Implications for seismicity, arc magmatism and volatile recycling. Earth Planet. Sci. Lett. 2001, 189, 19–29. [Google Scholar] [CrossRef]
  3. Schmidt, M.; Poli, S. Devolatilization during Subduction. In Treatise on Geochemistry, The Crust, 2nd ed.; Holland, H.D., Turekian, K.K., Eds.; Elsevier: Amsterdam, The Netherlands, 2014; pp. 669–701. [Google Scholar]
  4. Plank, T.; Langmuir, C.H. Tracing trace elements from sediment input to volcanic output at subduction zones. Nature 1993, 362, 739–743. [Google Scholar] [CrossRef]
  5. Plank, T.; Langmuir, C.H. The chemical composition of subducting sediment and its consequences for the crust and mantle. Chem. Geol. 1998, 145, 325–394. [Google Scholar] [CrossRef]
  6. Plank, T. The Chemical Composition of Subducting Sediments. In Treatise on Geochemistry, The Crust, 2nd ed.; Holland, H.D., Turekian, K.K., Eds.; Elsevier: Amsterdam, The Netherlands, 2014; Volume 4, pp. 607–629. [Google Scholar]
  7. Plank, T.; Manning, C.E. Subducting carbon. Nat. Cell Biol. 2019, 574, 343–352. [Google Scholar] [CrossRef] [Green Version]
  8. Alt, J.C.; Shanks, W.C.; Jackson, M.C. Cycling of sulfur in subduction zones: The geochemistry of sulfur in the Mariana Island Arc and back-arc trough. Earth Planet. Sci. Lett. 1993, 119, 477–494. [Google Scholar] [CrossRef] [Green Version]
  9. Jarrard, R.D. Subduction fluxes of water, carbon dioxide, chlorine, and potassium. Geochem. Geophys. Geosyst. 2003, 4, 8905. [Google Scholar] [CrossRef]
  10. Rüpke, L. Serpentine and the subduction zone water cycle. Earth Planet. Sci. Lett. 2004, 223, 17–34. [Google Scholar] [CrossRef]
  11. Alt, J.C.; Garrido, C.J.; Shanks, W.C.; Turchyn, A.V.; Padrón-Navarta, J.A.; Sánchez-Vizcaíno, V.L.; Pugnaire, M.T.G.; Marchesi, C. Recycling of water, carbon, and sulfur during subduction of serpentinites: A stable isotope study of Cerro del Almirez, Spain. Earth Planet. Sci. Lett. 2012, 327–328, 50–60. [Google Scholar] [CrossRef]
  12. Alt, J.C.; Schwarzenbach, E.M.; Früh-Green, G.L.; Shanks, W.C.P.; Bernasconi, S.M.; Garrido, C.J.; Crispini, L.; Gaggero, L.; Padrón-Navarta, J.A.; Marchesi, C. The role of serpentinites in cycling of carbon and sulfur: Seafloor serpentinization and subduction metamorphism. Lithos 2013, 178, 40–54. [Google Scholar] [CrossRef]
  13. Saal, A.E.; Hauri, E.; Langmuir, C.H.; Perfit, M.R. Vapour undersaturation in primitive mid-ocean-ridge basalt and the volatile content of Earth’s upper mantle. Nature 2002, 419, 451–455. [Google Scholar] [CrossRef] [PubMed]
  14. Freundt, A.; Grevemeyer, I.; Rabbel, W.; Hansteen, T.H.; Hensen, C.; Wehrmann, H.; Kutterolf, S.; Halama, R.; Frische, M. Volatile (H2O, CO2, Cl, S) budget of the Central American subduction zone. Int. J. Earth. Sci. 2014, 103, 2101–2127. [Google Scholar] [CrossRef]
  15. Aiuppa, A.; Fischer, T.P.; Plank, T.; Robidoux, P.; Di Napoli, R. Along-arc, inter-arc and arc-to-arc variations in volcanic gas CO2/S T ratios reveal dual source of carbon in arc volcanism. Earth Sci. Rev. 2017, 168, 24–47. [Google Scholar] [CrossRef]
  16. Andres, R.J.; Kasgnoc, A.D. A time-averaged inventory of subaerial volcanic sulfur emissions. J. Geophys. Res. 1998, 103, 25251–25261. [Google Scholar] [CrossRef]
  17. Fischer, T.P. Fluxes of volatiles (H2O, CO2, N2, Cl, F) from arc volcanoes. Geochem. J. 2008, 42, 21–38. [Google Scholar] [CrossRef] [Green Version]
  18. Burton, M.R.; Sawyer, G.M.; Granieri, D. Deep Carbon Emissions from Volcanoes. Rev. Miner. Geochem. 2013, 75, 323–354. [Google Scholar] [CrossRef] [Green Version]
  19. Werner, C.; Cynthia Fischer, T.P.; Aiuppa, A.; Edmonds, M.; Cardellini, C.; Carn, S.; Chiodini, G.; Cottrell, E.; Burton, M.; Shinohara, H.; et al. Carbon Dioxide Emissions from Subaerial Volcanic Regions. In Deep Carbon: Past to Present; Orcutt, B.N., Daniel, I., Dasgupta, R., Eds.; Cambridge University Press (CUP): Cambridge, UK, 2019. [Google Scholar] [CrossRef] [Green Version]
  20. Fischer, T.; Arellano, S.; Carn, S.A.; Aiuppa, A.; Galle, B.; Allard, P.; Lopez, T.; Shinohara, H.; Kelly, P.; Werner, C.; et al. The emissions of CO2 and other volatiles from the world’s subaerial volcanoes. Sci. Rep. 2019, 9, 18716. [Google Scholar] [CrossRef] [Green Version]
  21. Aiuppa, A.; Fischer, T.P.; Plank, T.; Bani, P. CO2 flux emissions from the Earth’s most actively degassing volcanoes, 2005–2015. Sci. Rep. 2019, 9, 5442. [Google Scholar] [CrossRef]
  22. Moussallam, Y.; Oppenheimer, C.; Scaillet, B. On the relationship between oxidation state and temperature of volcanic gas emissions. Earth Planet. Sci. Lett. 2019, 520, 260–267. [Google Scholar] [CrossRef]
  23. Carn, S.A.; Fioletov, V.E.; McLinden, C.A.; Li, C.; Krotkov, N.A. A decade of global volcanic SO2 emissions measured from space. Sci. Rep. 2017, 7, 44095. [Google Scholar] [CrossRef] [Green Version]
  24. Aiuppa, A.; Federico, C.; Giudice, G.; Gurrieri, S. Chemical mapping of a fumarolic field: La Fossa Crater, Vulcano Island (Aeolian Islands, Italy). Geophys. Res. Lett. 2005, 32, L13309. [Google Scholar] [CrossRef] [Green Version]
  25. Shinohara, H. A new technique to estimate volcanic gas composition: Plume measurements with a portable multi-sensor system. J. Volcanol. Geotherm. Res. 2005, 143, 319–333. [Google Scholar] [CrossRef]
  26. Oppenheimer, C.; Fischer, T.P.; Scaillet, B. Volcanic Degassing: Process and Impact, 2nd ed.; Treatise on Geochemistry: Second Edition; Elsevier Ltd.: Amsterdam, The Netherlands, 2013. [Google Scholar] [CrossRef]
  27. Fischer, T.P.; Chiodini, G. Volcanic, Magmatic and Hydrothermal Gases. In The Encyclopedia of Volcanoes; Elsevier: Cambridge, MA, USA, 2015; Volume 2, pp. 779–797. [Google Scholar] [CrossRef]
  28. Aiuppa, A. Volcanic-Gas Monitoring. In Volcanism and Global Environmental Change; Cambridge University Press (CUP): Cambridge, UK, 2015; pp. 81–96. [Google Scholar] [CrossRef]
  29. Fischer, T.; Aiuppa, A. AGU Centennial Grand Challenge: Volcanoes and Deep Carbon Global CO2 Emissions from Subaerial Volcanism—Recent Progress and Future Challenges. Geochem. Geophys. Geosystems 2020, 21, 2019gc008690. [Google Scholar] [CrossRef]
  30. Oppenheimer, C.; Tsanev, V.I.; Braban, C.F.; Cox, R.A.; Adams, J.W.; Aiuppa, A.; Bobrowski, N.; Delmelle, P.; Barclay, J.; Mcgonigle, A.J.S. BrO formation in volcanic plumes. Geochim. Cosmochim. Acta 2006, 70, 2935–2941. [Google Scholar] [CrossRef]
  31. Métrich, N.; Allard, P.; Aiuppa, A.; Bani, P.; Bertagnini, A.; Shinohara, H.; Parello, F.; Di Muro, A.; Garaebiti, E.; Belhadj, O.; et al. Magma and Volatile Supply to Post-collapse Volcanism and Block Resurgence in Siwi Caldera (Tanna Island, Vanuatu Arc). J. Pet. 2011, 52, 1077–1105. [Google Scholar] [CrossRef] [Green Version]
  32. Woitischek, J.; Woods, A.W.; Edmonds, M.; Oppenheimer, C.; Aiuppa, A.; Pering, T.D.; Ilanko, T.; D’Aleo, R.; Garaebiti, E. Strombolian eruptions and dynamics of magma degassing at Yasur Volcano (Vanuatu). J. Volcanol. Geotherm. Res. 2020, 398, 106869. [Google Scholar] [CrossRef]
  33. Allard, P.; Aiuppa, A.; Bani, P.; Métrich, N.; Bertagnini, A.; Gauthier, P.-J.; Shinohara, H.; Sawyer, G.; Parello, F.; Bagnato, E.; et al. Prodigious emission rates and magma degassing budget of major, trace and radioactive volatile species from Ambrym basaltic volcano, Vanuatu island Arc. J. Volcanol. Geotherm. Res. 2016, 322, 119–143. [Google Scholar] [CrossRef]
  34. Allard, P.; Burton, M.; Sawyer, G.; Bani, P.; Burton, M.R. Degassing dynamics of basaltic lava lake at a top-ranking volatile emitter: Ambrym volcano, Vanuatu arc. Earth Planet. Sci. Lett. 2016, 448, 69–80. [Google Scholar] [CrossRef] [Green Version]
  35. Bani, P.; Oppenheimer, C.; Tsanev, V.I.; Carn, S.A.; Cronin, S.; Crimp, R.; Calkins, J.A.; Charley, D.; Lardy, M.; Roberts, T.R. Surge in sulphur and halogen degassing from Ambrym volcano, Vanuatu. Bull. Volcanol. 2009, 71, 1159–1168. [Google Scholar] [CrossRef]
  36. Bani, P.; Oppenheimer, C.; Allard, P.; Shinohara, H.; Tsanev, V.; Carn, S.; Lardy, M.; Garaebiti, E. First estimate of volcanic SO2 budget for Vanuatu island arc. J. Volcanol. Geotherm. Res. 2012, 211–212, 36–46. [Google Scholar] [CrossRef] [Green Version]
  37. Liu, E.J.; Aiuppa, A.; Alan, A.; Arellano, S.; Bitetto, M.; Bobrowski, N.; Carn, S.; Clarke, R.; Corrales, E.; de Moor, J.M.; et al. Aerial Strategies Advance Volcanic Gas Measurements at Inaccessible, Strongly Degassing Volcanoes. Sci. Adv. 2020, in press. [Google Scholar]
  38. Pelletier, B.; Calmant, S.; Pillet, R. Current tectonics of the Tonga–New Hebrides region. Earth Planet. Sci. Lett. 1998, 164, 263–276. [Google Scholar] [CrossRef]
  39. Calmant, S.; Pelletier, B.; Lebellegard, P.; Bevis, M.; Taylor, F.W.; Phillips, D.A. New insights on the tectonics along the New Hebrides subduction zone based on GPS results. J. Geophys. Res. Space Phys. 2003, 108, 2319–2339. [Google Scholar] [CrossRef]
  40. Ridge-Arc Collision: Timing and Deformation Determined by Leg 134 Drilling, Central New Hebrides Island Arc. In Proceedings of the Ocean Drilling Program, 134 Scientific Results, Tokyo, Japan, May 1994; Volume 134, pp. 609–621. [CrossRef]
  41. Fisher, M.; Crawford, A. Neogene Tectonic Evolution of the New Hebrides Island Arc: A Review Incorporating ODP Drilling Results. In Proceedings of the Ocean Drilling Program, 134 Scientific Results, Tokyo, Japan, May 1994; Volume 134, pp. 19–46. [Google Scholar] [CrossRef]
  42. Monzier, M.; Robin, C.; Eissen, J.-P.; Cotten, J. Geochemistry vs. seismo-tectonics along the volcanic New Hebrides Central Chain (Southwest Pacific). J. Volcanol. Geotherm. Res. 1997, 78, 1–29. [Google Scholar] [CrossRef]
  43. Robin, C.; Eissen, J.-P.; Monzier, M. Mafic pyroclastic flows at Santa Maria (Gaua) Volcano, Vanuatu: The caldera formation problem in mainly mafic island arc volcanoes. Terra Nova 1995, 7, 436–443. [Google Scholar] [CrossRef]
  44. Bani, P.; Boudon, G.; Balcone-Boissard, H.; Delmelle, P.; Quiniou, T.; Lefèvre, J.; Bule, E.G.; Hiroshi, S.; Lardy, M. The 2009–2010 eruption of Gaua volcano (Vanuatu archipelago): Eruptive dynamics and unsuspected strong halogens source. J. Volcanol. Geotherm. Res. 2016, 322, 63–75. [Google Scholar] [CrossRef]
  45. Mallick, D.I.J.; Ash, R.P. Geology of the southern Banks Islands. New Hebrides Geol. Surv. Reg. Rep. 1975, 33, 46. [Google Scholar]
  46. Beaumais, A. Géochimie de l’arc du Vanuatu: Evolution Spatio-Temporelle des Edifices Volcaniques et des Sources Mantelliques. Ph.D Thesis, Universite de Bretagne Occidentale, Brest, France, 2013; p. 310p. [Google Scholar]
  47. Tamburello, G. Ratiocalc: Software for processing data from multicomponent volcanic gas analyzers. Comput. Geosci. 2015, 82, 63–67. [Google Scholar] [CrossRef] [Green Version]
  48. Tamburello, G.; Agusto, M.; Caselli, A.T.; Tassi, F.; Vaselli, O.; Calabrese, S.; Rouwet, D.; Capaccioni, B.; Di Napoli, R.; Cardellini, C.; et al. Intense magmatic degassing through the lake of Copahue volcano, 2013–2014. J. Geophys. Res. Solid Earth 2015, 120, 6071–6084. [Google Scholar] [CrossRef]
  49. Moussallam, Y.; Tamburello, G.; Peters, N.; Apaza, F.; Schipper, C.I.; Curtis, A.; Aiuppa, A.; Masías, P.; Boichu, M.; Bauduin, S.; et al. Volcanic gas emissions and degassing dynamics at Ubinas and Sabancaya volcanoes; implications for the volatile budget of the central volcanic zone. J. Volcanol. Geotherm. Res. 2017, 343, 181–191. [Google Scholar] [CrossRef]
  50. Lages, J.; Chacón, Z.; Burbano, V.; Meza, L.; Arellano, S.; Liuzzo, M.; Giudice, G.; Aiuppa, A.; Bitetto, M.; López, C. Volcanic Gas Emissions along the Colombian Arc Segment of the Northern Volcanic Zone (CAS-NVZ): Implications for volcano monitoring and volatile budget of the Andean Volcanic Belt. Geochem. Geophys. Geosyst. 2019, 20, 5057–5081. [Google Scholar] [CrossRef] [Green Version]
  51. Roberts, T.; Saffell, J.; Oppenheimer, C.; Lurton, T. Electrochemical sensors applied to pollution monitoring: Measurement error and gas ratio bias—A volcano plume case study. J. Volcanol. Geotherm. Res. 2014, 281, 85–96. [Google Scholar] [CrossRef]
  52. Chase, M.W. National Institute of Standards and Technology (U.S.). In NIST-JANAF Thermochemical Tables. American Chemical Society; American Institute of Physics for the National Institute of Standards and Technology: Washington, DC, USA; Woodbury, NY, USA, 1998. [Google Scholar]
  53. Stull, D.R.; Westrum, E.F.; Sinke, G.C. The Chemical Thermodynamics of organic Compounds; Wiley: Hoboken, NJ, USA, 1969. [Google Scholar]
  54. Moussallam, Y.; Peters, N.; Masías, P.; Apaza, F.; Barnie, T.; Schipper, C.I.; Curtis, A.; Tamburello, G.; Aiuppa, A.; Bani, P.; et al. Magmatic gas percolation through the old lava dome of El Misti volcano. Bull. Volcanol. 2017, 79, 46. [Google Scholar] [CrossRef] [PubMed]
  55. Frost, B.R. Introduction to oxygen fugacity and its petrologic importance. Rev. Mineral. Geochem. 1991, 25, 1–9. [Google Scholar]
  56. Symonds, R.; Gerlach, T.; Reed, M. Magmatic gas scrubbing: Implications for volcano monitoring. J. Volcanol. Geotherm. Res. 2001, 108, 303–341. [Google Scholar] [CrossRef]
  57. Gerlach, T.M.; McGee, K.A.; Doukas, M.P. Emission rates of CO2, SO2, and H2S, scrubbing, and preeruption excess volatiles at Mount St. Helens, 2004–2005. US Geol. Surv. Prof. Pap. 2008, 1750, 543–572. [Google Scholar] [CrossRef]
  58. Aiuppa, A.; Robidoux, P.; Tamburello, G.; Condé, V.; Galle, B.; Avard, G.; Bagnato, E.; De Moor, J.; Martinez, M.; Munoz, A. Gas measurements from the Costa Rica–Nicaragua volcanic segment suggest possible along-arc variations in volcanic gas chemistry. Earth Planet. Sci. Lett. 2014, 407, 134–147. [Google Scholar] [CrossRef] [Green Version]
  59. Von Huene, R.; Scholl, D.W. Observations at convergent margins concerning sediment subduction, subduction erosion, and the growth of continental crust at convergent ocean margins. Rev. Geophys. 1991, 29, 279–316. [Google Scholar] [CrossRef] [Green Version]
  60. David, W.; Peate, J.A.P.; Hawkesworth, C.J.; Colley, H.; Edwards, C.M.H.; Hirose, K. Geochemical variations in Vanuatu arc lavas: The role of subducted material and a variable mantle wedge composition. J. Mol. Struct. 1997, 38, 1331–1358. [Google Scholar] [CrossRef]
  61. Shreve, T.; Grandin, R.; Boichu, M.; Garaebiti, E.; Moussallam, Y.; Ballu, V.; Delgado, F.; Leclerc, F.; Vallée, M.; Henriot, N.; et al. From prodigious volcanic degassing to caldera subsidence and quiescence at Ambrym (Vanuatu): The influence of regional tectonics. Sci. Rep. 2019, 9, 1–13. [Google Scholar] [CrossRef] [Green Version]
  62. Carn, S.A. Multi-Satellite Volcanic Sulfur Dioxide L4 Long-Term Global Database V2, Version 2; Goddard Earth Science Data and Information Services Center (GES DISC): Greenbelt, MD, USA, 2015. Available online: Ftp://measures.gsfc.nasa.gov/data/s4pa/SO2/MSVOLSO2L4.2/ (accessed on 16 June 2016).
Figure 1. On the left: illustration of the overall tectonic context of the Vanuatu Island Arc, with currently active volcanoes and their location marked in red triangles. In the center: digital elevation model (DEM) of the island of Gaua; land features above 700 m (a.s.l.), including Mount Garet’s summit crater, are highlighted in red. On the right: photos of Mount Garet and its currently degassing southeast crater (December 2019); photos of National Geographic property.
Applsci 10 07293 g001
Figure 2. CO2/SO2 mixing ratios estimated across the 4-h survey period. At the bottom, the dash red line represents the regression analysis of all 5 CO2/SO2 ratios (Table 1) combined. SO2 and CO2 concentration (in ppmv) time series at the top illustrates plume conditions at which individual ratios were calculated. Note that CO2/SO2 ratio (3) is then shown in Figure 3 for detailed calculation procedure.
Applsci 10 07293 g002
Figure 3. x/SO2 Mixing ratios in the Mount Garet plume. (A): scatterplot of dot-to-dot x/SO2 molar ratios versus SO2 concentrations, showing that the ratios converge to a single value at high SO2 concentration (Tamburello, 2015); and concentration (ppmv) time series of each species (CO2 in red, H2S in green, H2 in orange and H2O in blue) with SO2 (in black) in the Mount Garet plume (note that the x-axis gives the duration of the each survey in seconds). (B): Least-square regression analysis are shown for each species versus SO2; Slope and R2 regression values in black correspond to the specific time window shown in A; colored values correspond to the regression analysis of bulk data reported in Table 1.
Applsci 10 07293 g003
Figure 4. On the left: scatter plot of H2O vs. CO2 mixing ratio in the Mount Garet plume; the least-square regression line is shown as black dashed line on each plot (R2 = 0.75). On the right: concentration (ppmv) time series of H2O (blue) and CO2 (red) recorded at a frequency of 1 Hz; in black, SO2 concentration (ppmv) is given as an analog for plume density during our measurement period.
Applsci 10 07293 g004
Figure 5. H2O–CO2–ST (ST = SO2 + H2S) ternary plot with gas composition for Mount Garet volcano (in black). Ambrym [33,34] and Yasur [31] are also plotted for comparison, as well as Manam (Papua New Guinea) [37]. For within-plot field delimitations (e.g., hydrothermal gases and arc volcanism) see [28].
Applsci 10 07293 g005
Table 1. Individual x/SO2 molar ratios measured by the multi-component gas analyzer system (multi-GAS) in the Mount Garet’s plume. These correspond to time windows showing good temporal correlation between gas species (R2 ≥ 0.70) and strong volcanic gas signal (≥30 ppm of SO2). Ratios and associated errors correspond to the slope and the R2 value of the best-fit regression line, respectively.
Gas SpeciesMolar Ratio
x/SO2
R2Error (±)SO2 Max
(Plume Marker; in ppm)
Nr. of Samples
H20.040.730.00636.1713
0.040.700.00739.9804
0.030.860.00956.8288
0.030.780.00561.9534
0.030.740.00756.3480
Bulk composition0.03
±0.006
H2O40.50.707.463.2431
40.00.735.743.81006
47.80.786.361.91387
55.50.863.739.9544
53.20.714.739.91538
Bulk composition47.2
±5.7
CO20.850.820.07636.6557
1.070.710.18237.8473
0.650.870.04550.9451
1.020.760.26531.8439
1.060.700.65337.3725
Bulk composition0.87
±0.24
H2S0.130.930.01152.9526
H2O/CO268.60.7510.061.91019
Table 2. Bulk composition of Mount Garet’s plume; x/SO2 ratios correspond to the gradients of the best-fit regression lines of all combined ratios reported in Table 1 for a given x/SO2 pair. Errors are expressed as the standard error of the regression analysis and subsequent error propagation.
Gas SpeciesMolar Ratio
x/SO2
± (1σ)%ErrComposition
(mol%)
± (1σ)
H2O47.25.71295.8811.58
CO20.870.24241.770.49
SO21.00------2.03---
H2S0.130.0180.260.02
H20.030.01200.060.01
Publisher’s Note: MDPI stays neutral with regard to jurisdictional claims in published maps and institutional affiliations.

