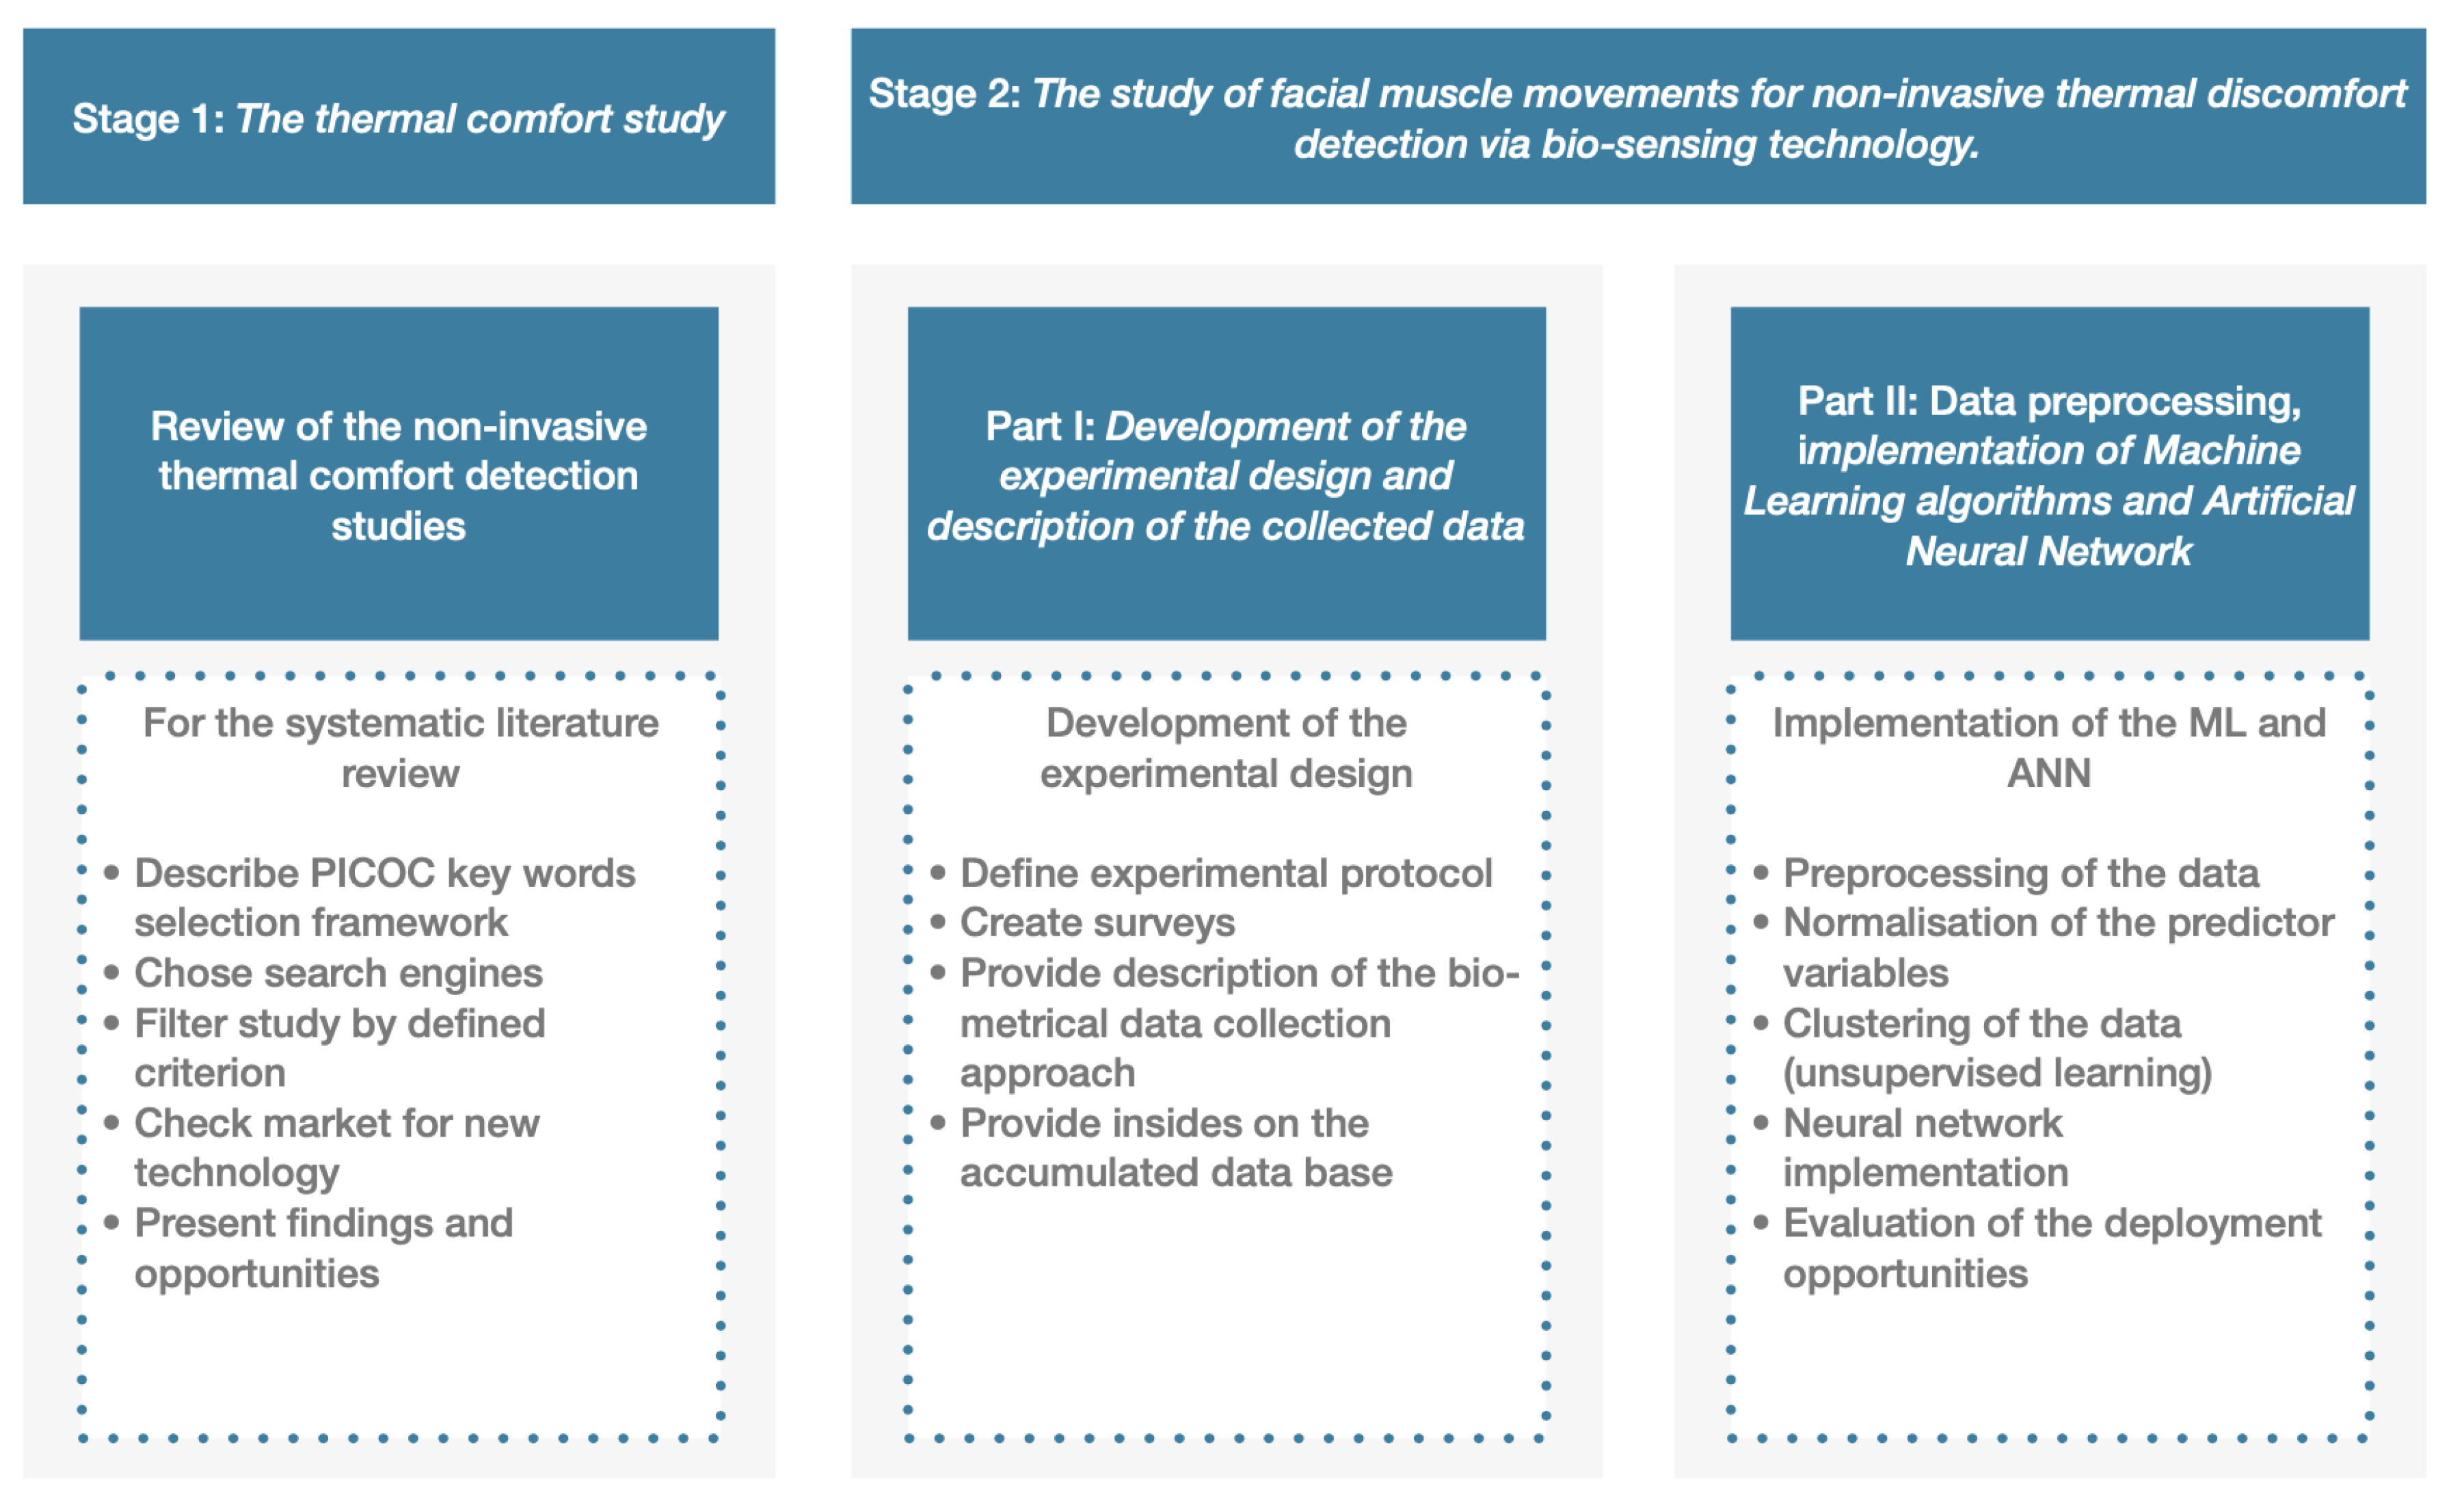
The Study of Facial Muscle Movements for Non-Invasive Thermal Discomfort Detection via Bio-Sensing Technology. Part I: Development of the Experimental Design and Description of the Collected Data


Abstract
:1. Introduction
2. Experimental Design Approach
“The facial feedback hypothesis postulates that selective activation or inhibition of facial muscles has a strong impact on the emotional response to the stimuli”
- Define the research problem and research questions
- Define the population of interest
- Describe the needs for sampling
- Design of the experiment
3. Methodology
3.1. Sampling Strategy
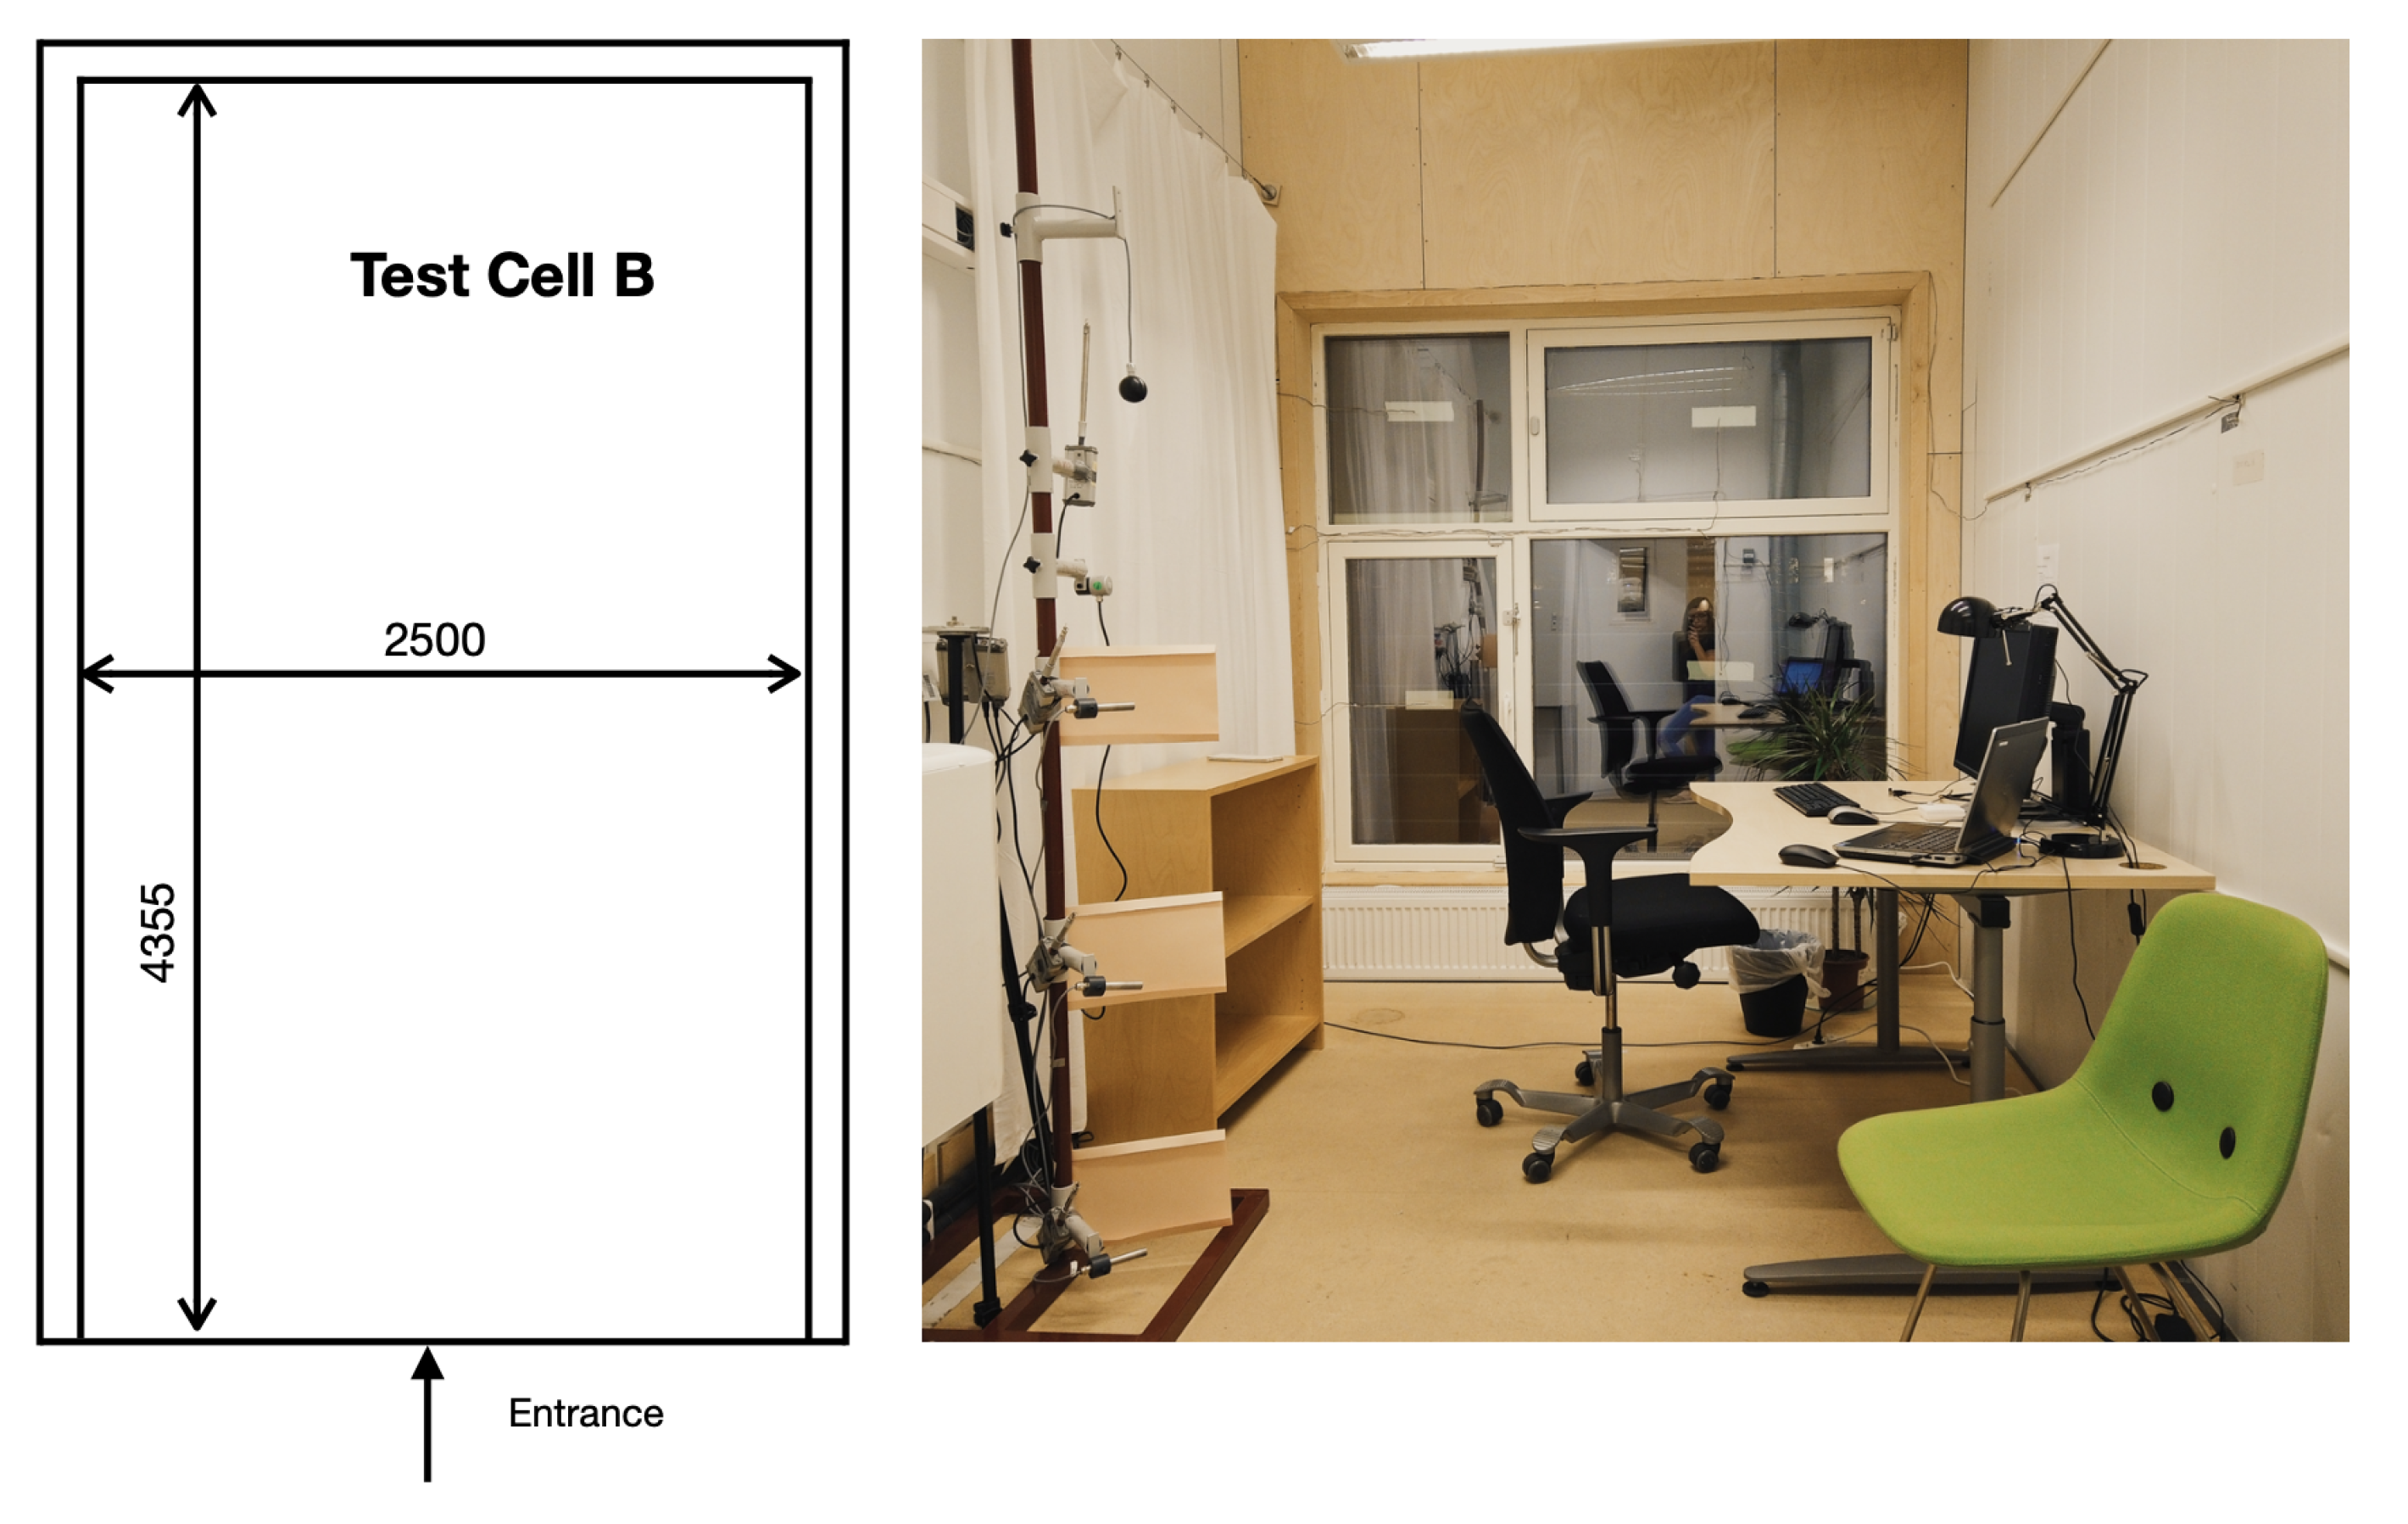
3.2. Experiment Location and Facility
4. Results
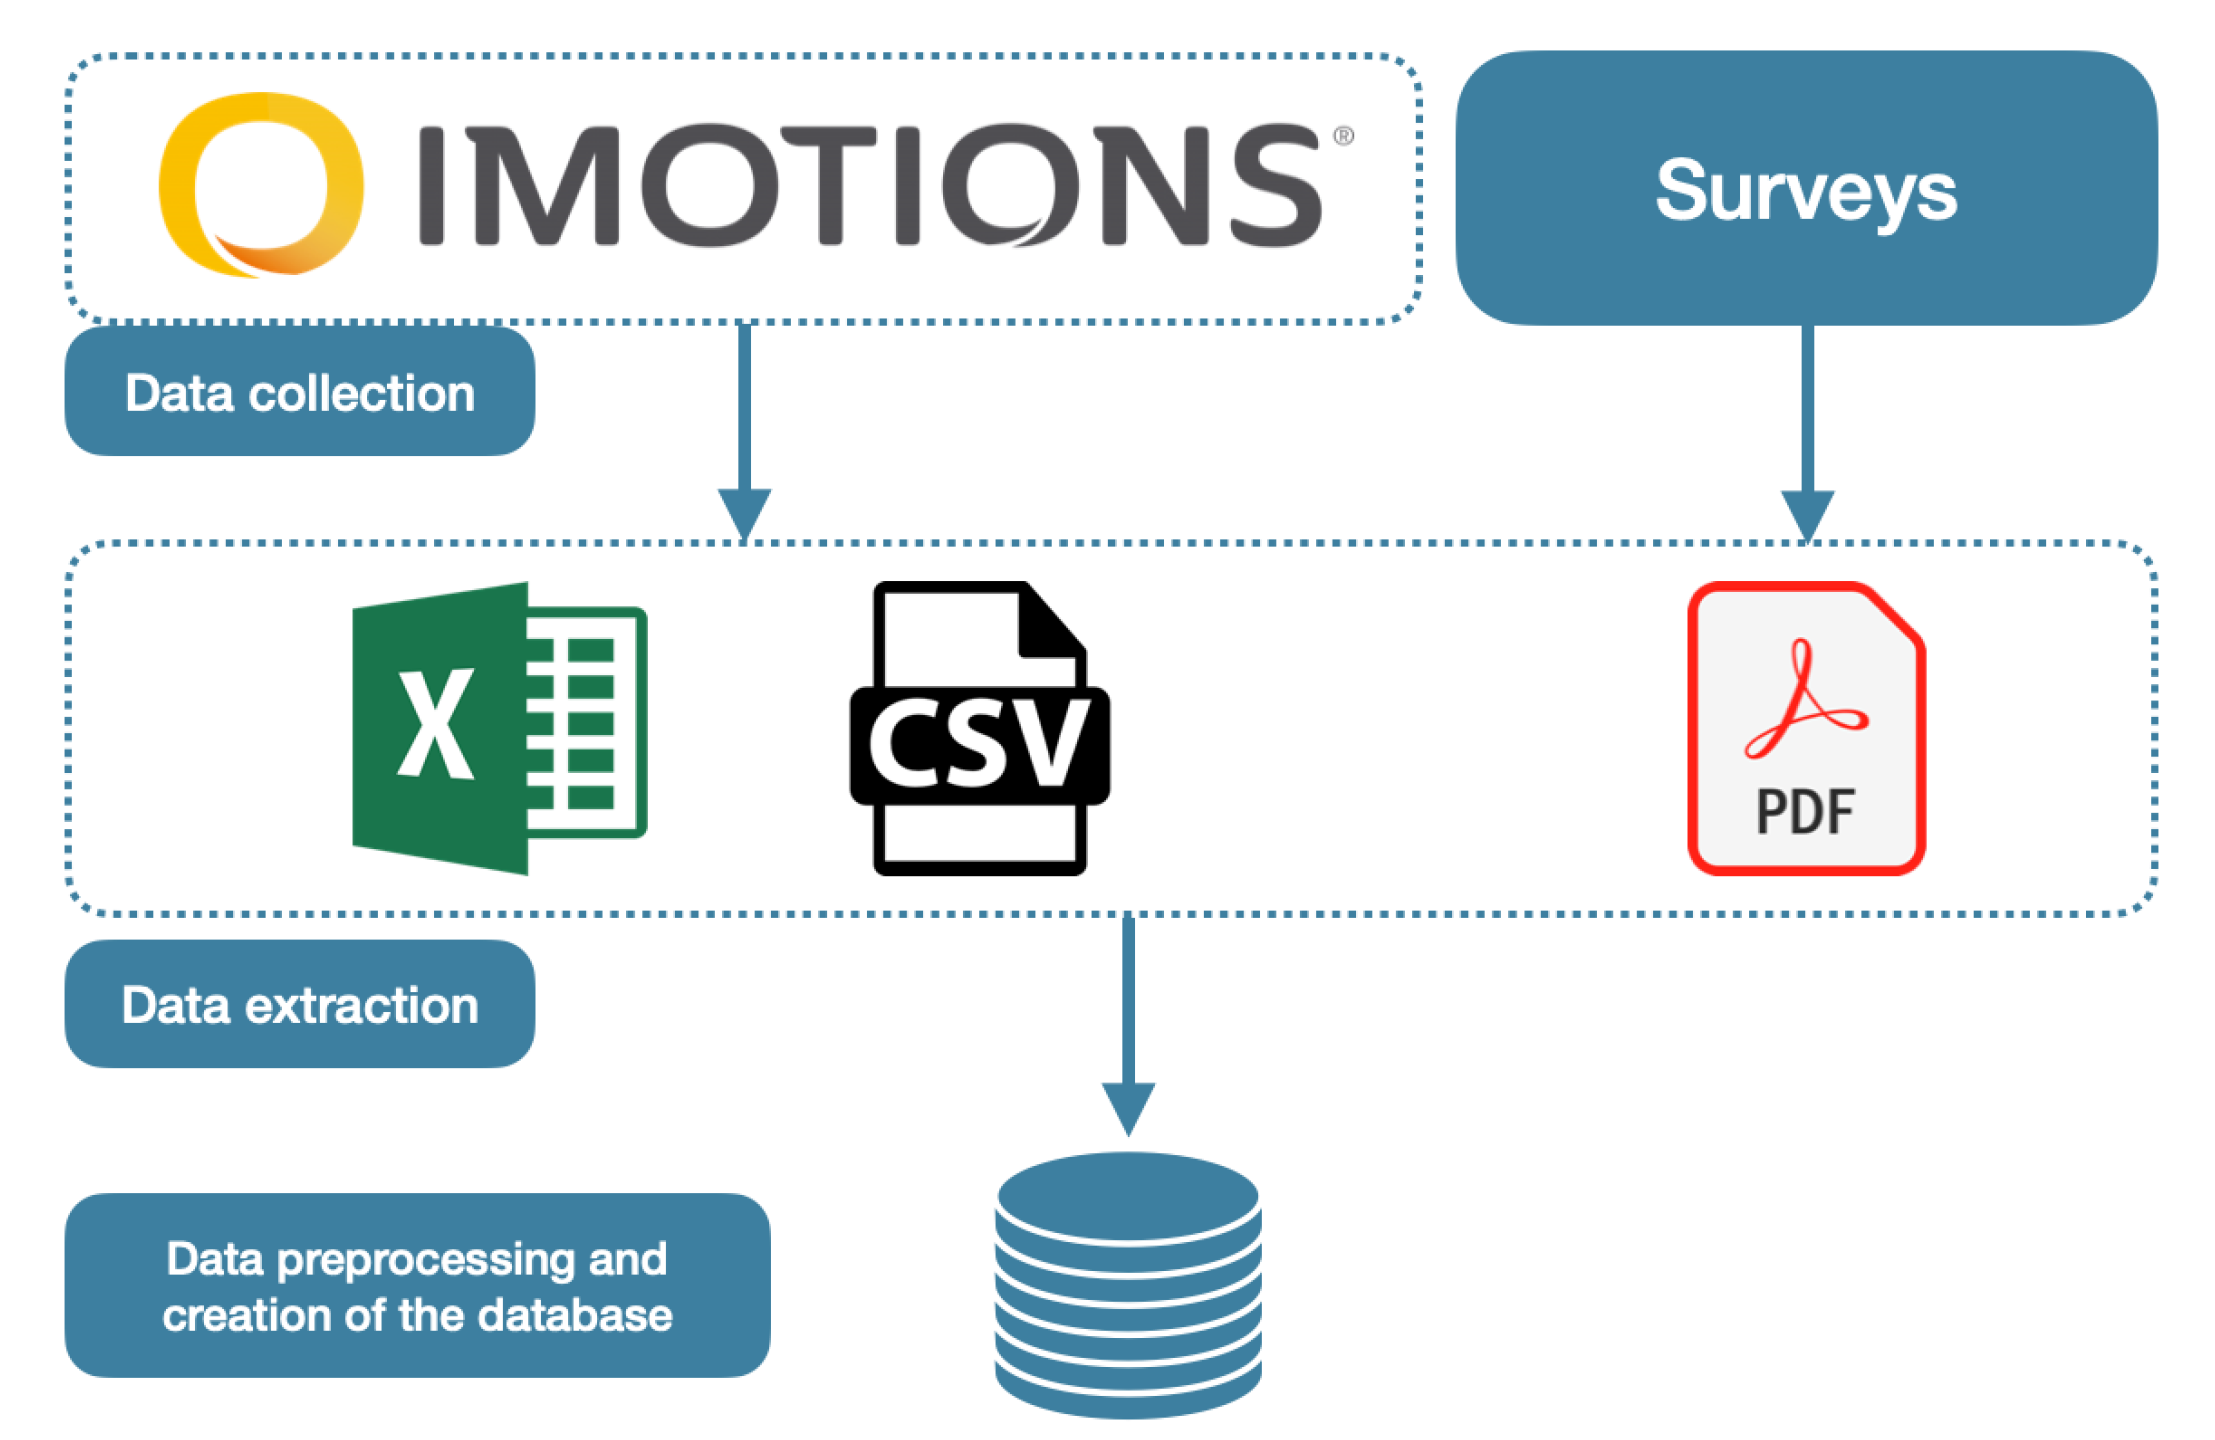
- Step: preparationOne subject is located in the test cell with thermally comfortable conditions for 1 h. Meanwhile instruments are going to be assembled on body parts. Administration of the Preassessment thermal comfort questionnaire. Data collection on:
- Comfort assessment questionnaire; CLO; Fat percentage % Height [m]; Weight [kg]; Age; Gender; Amount of time spent in Norway
Instruction of the experiment subjects and signing of the consent form. - Step: experiment
- Air velocity (fixed variable); Relative humidity (no control); Black globe temperature [deg.C] (variable); Air temperature (degrees C) (variable); Galvanic skin response (variable); Hart rate (variable); Facial Expressions (variable); Event of discomfort
- Blocked variables:
- CLO; Position of the desk
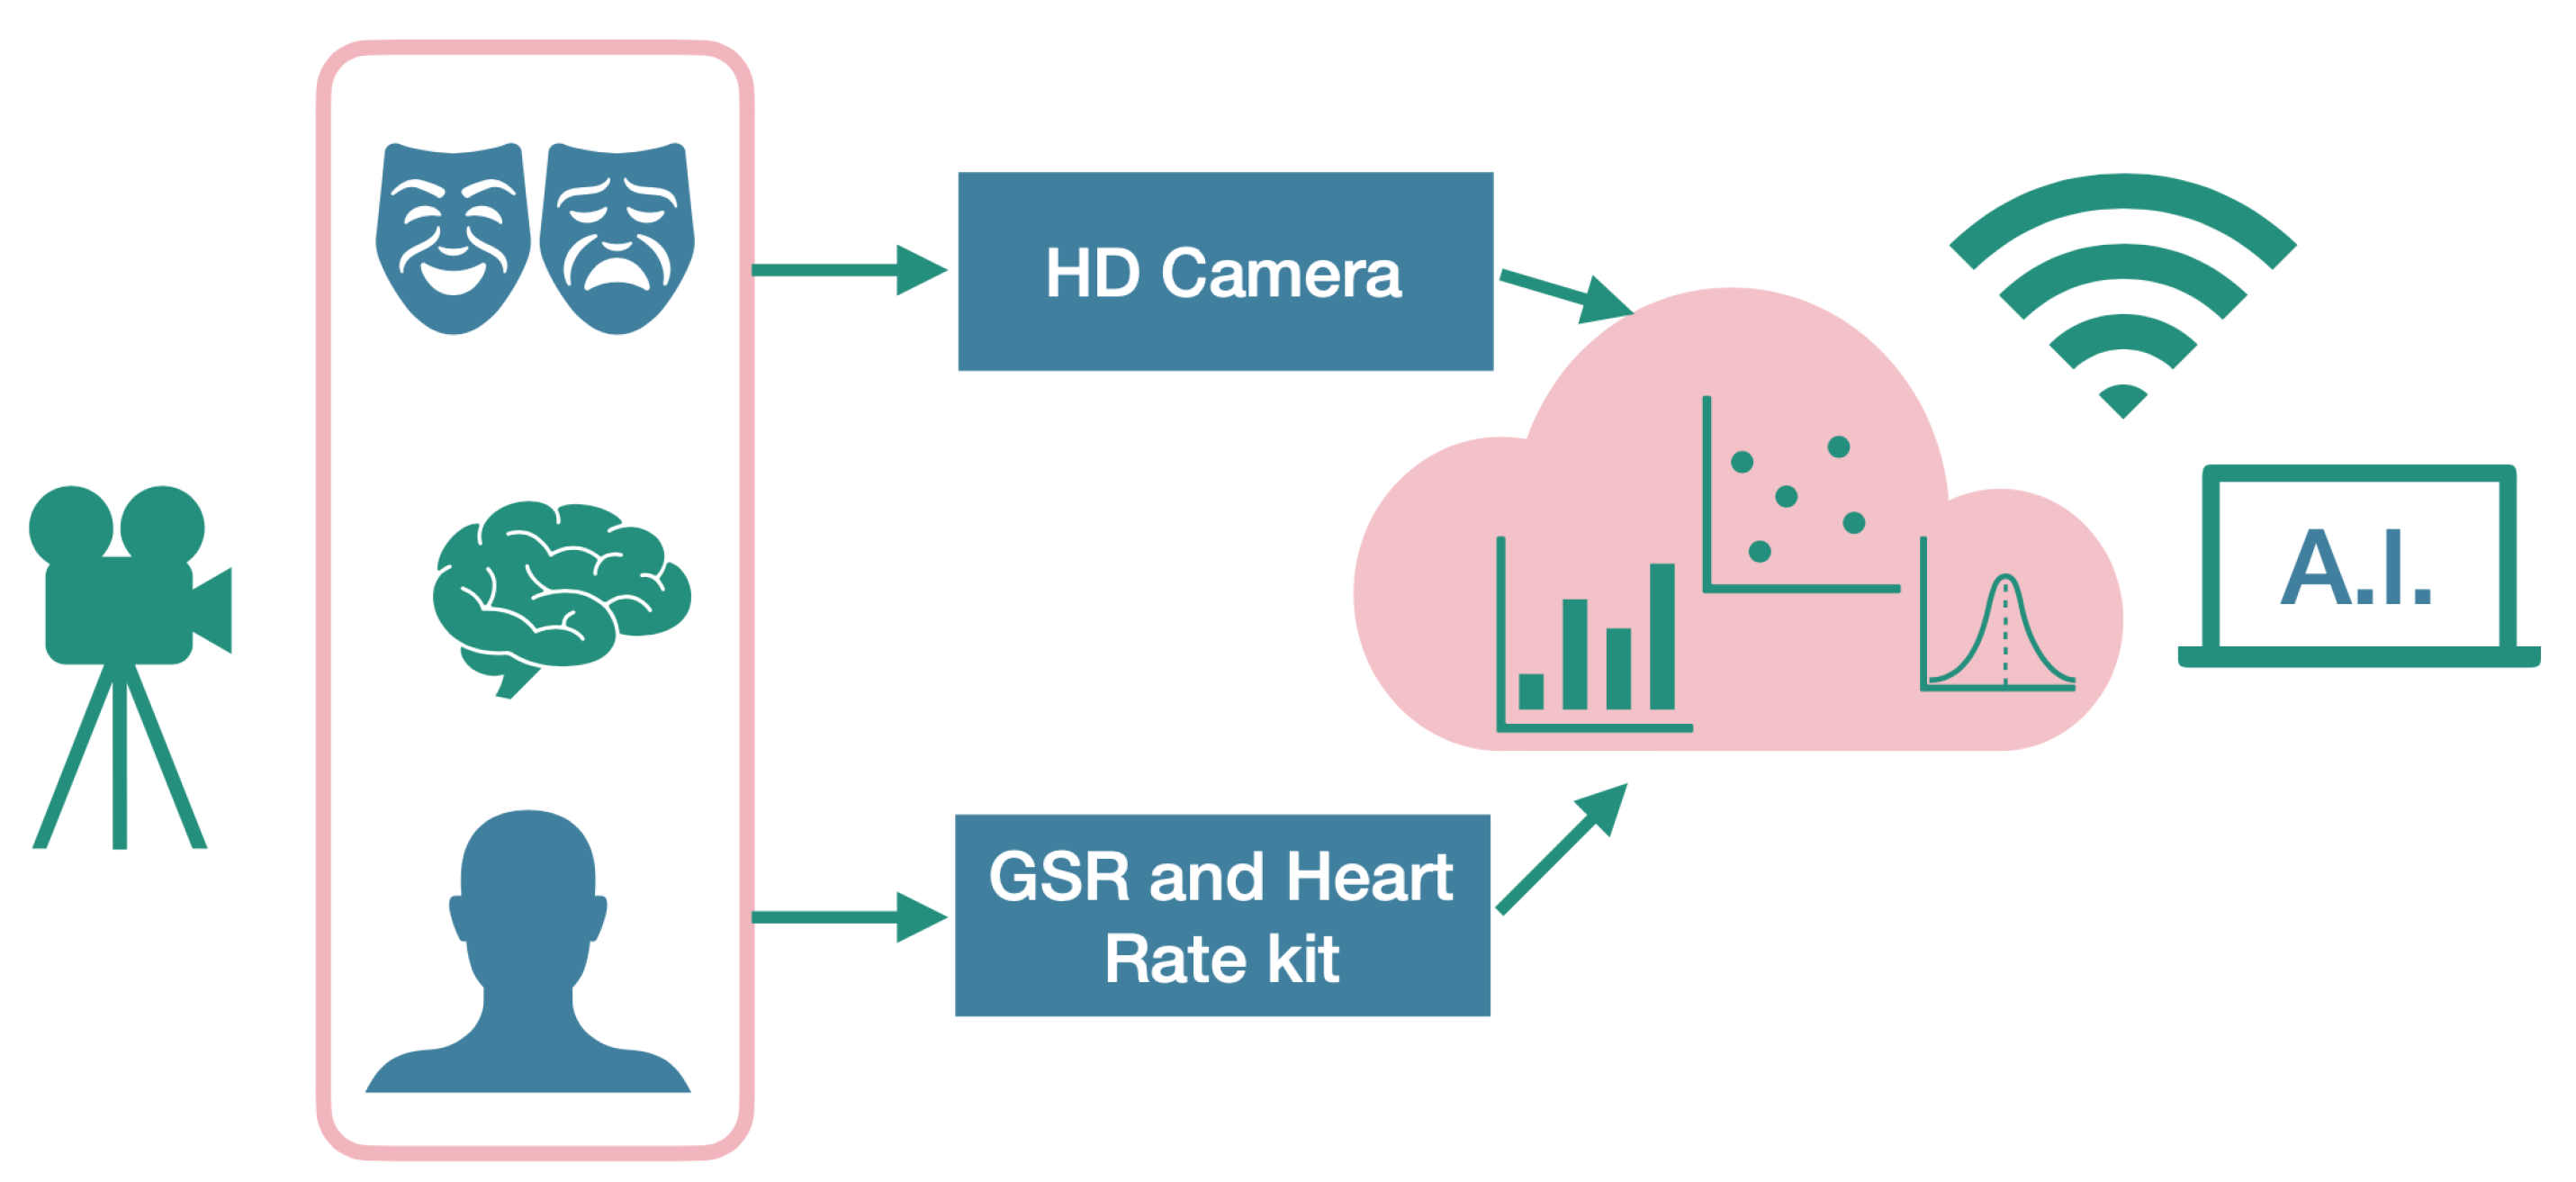
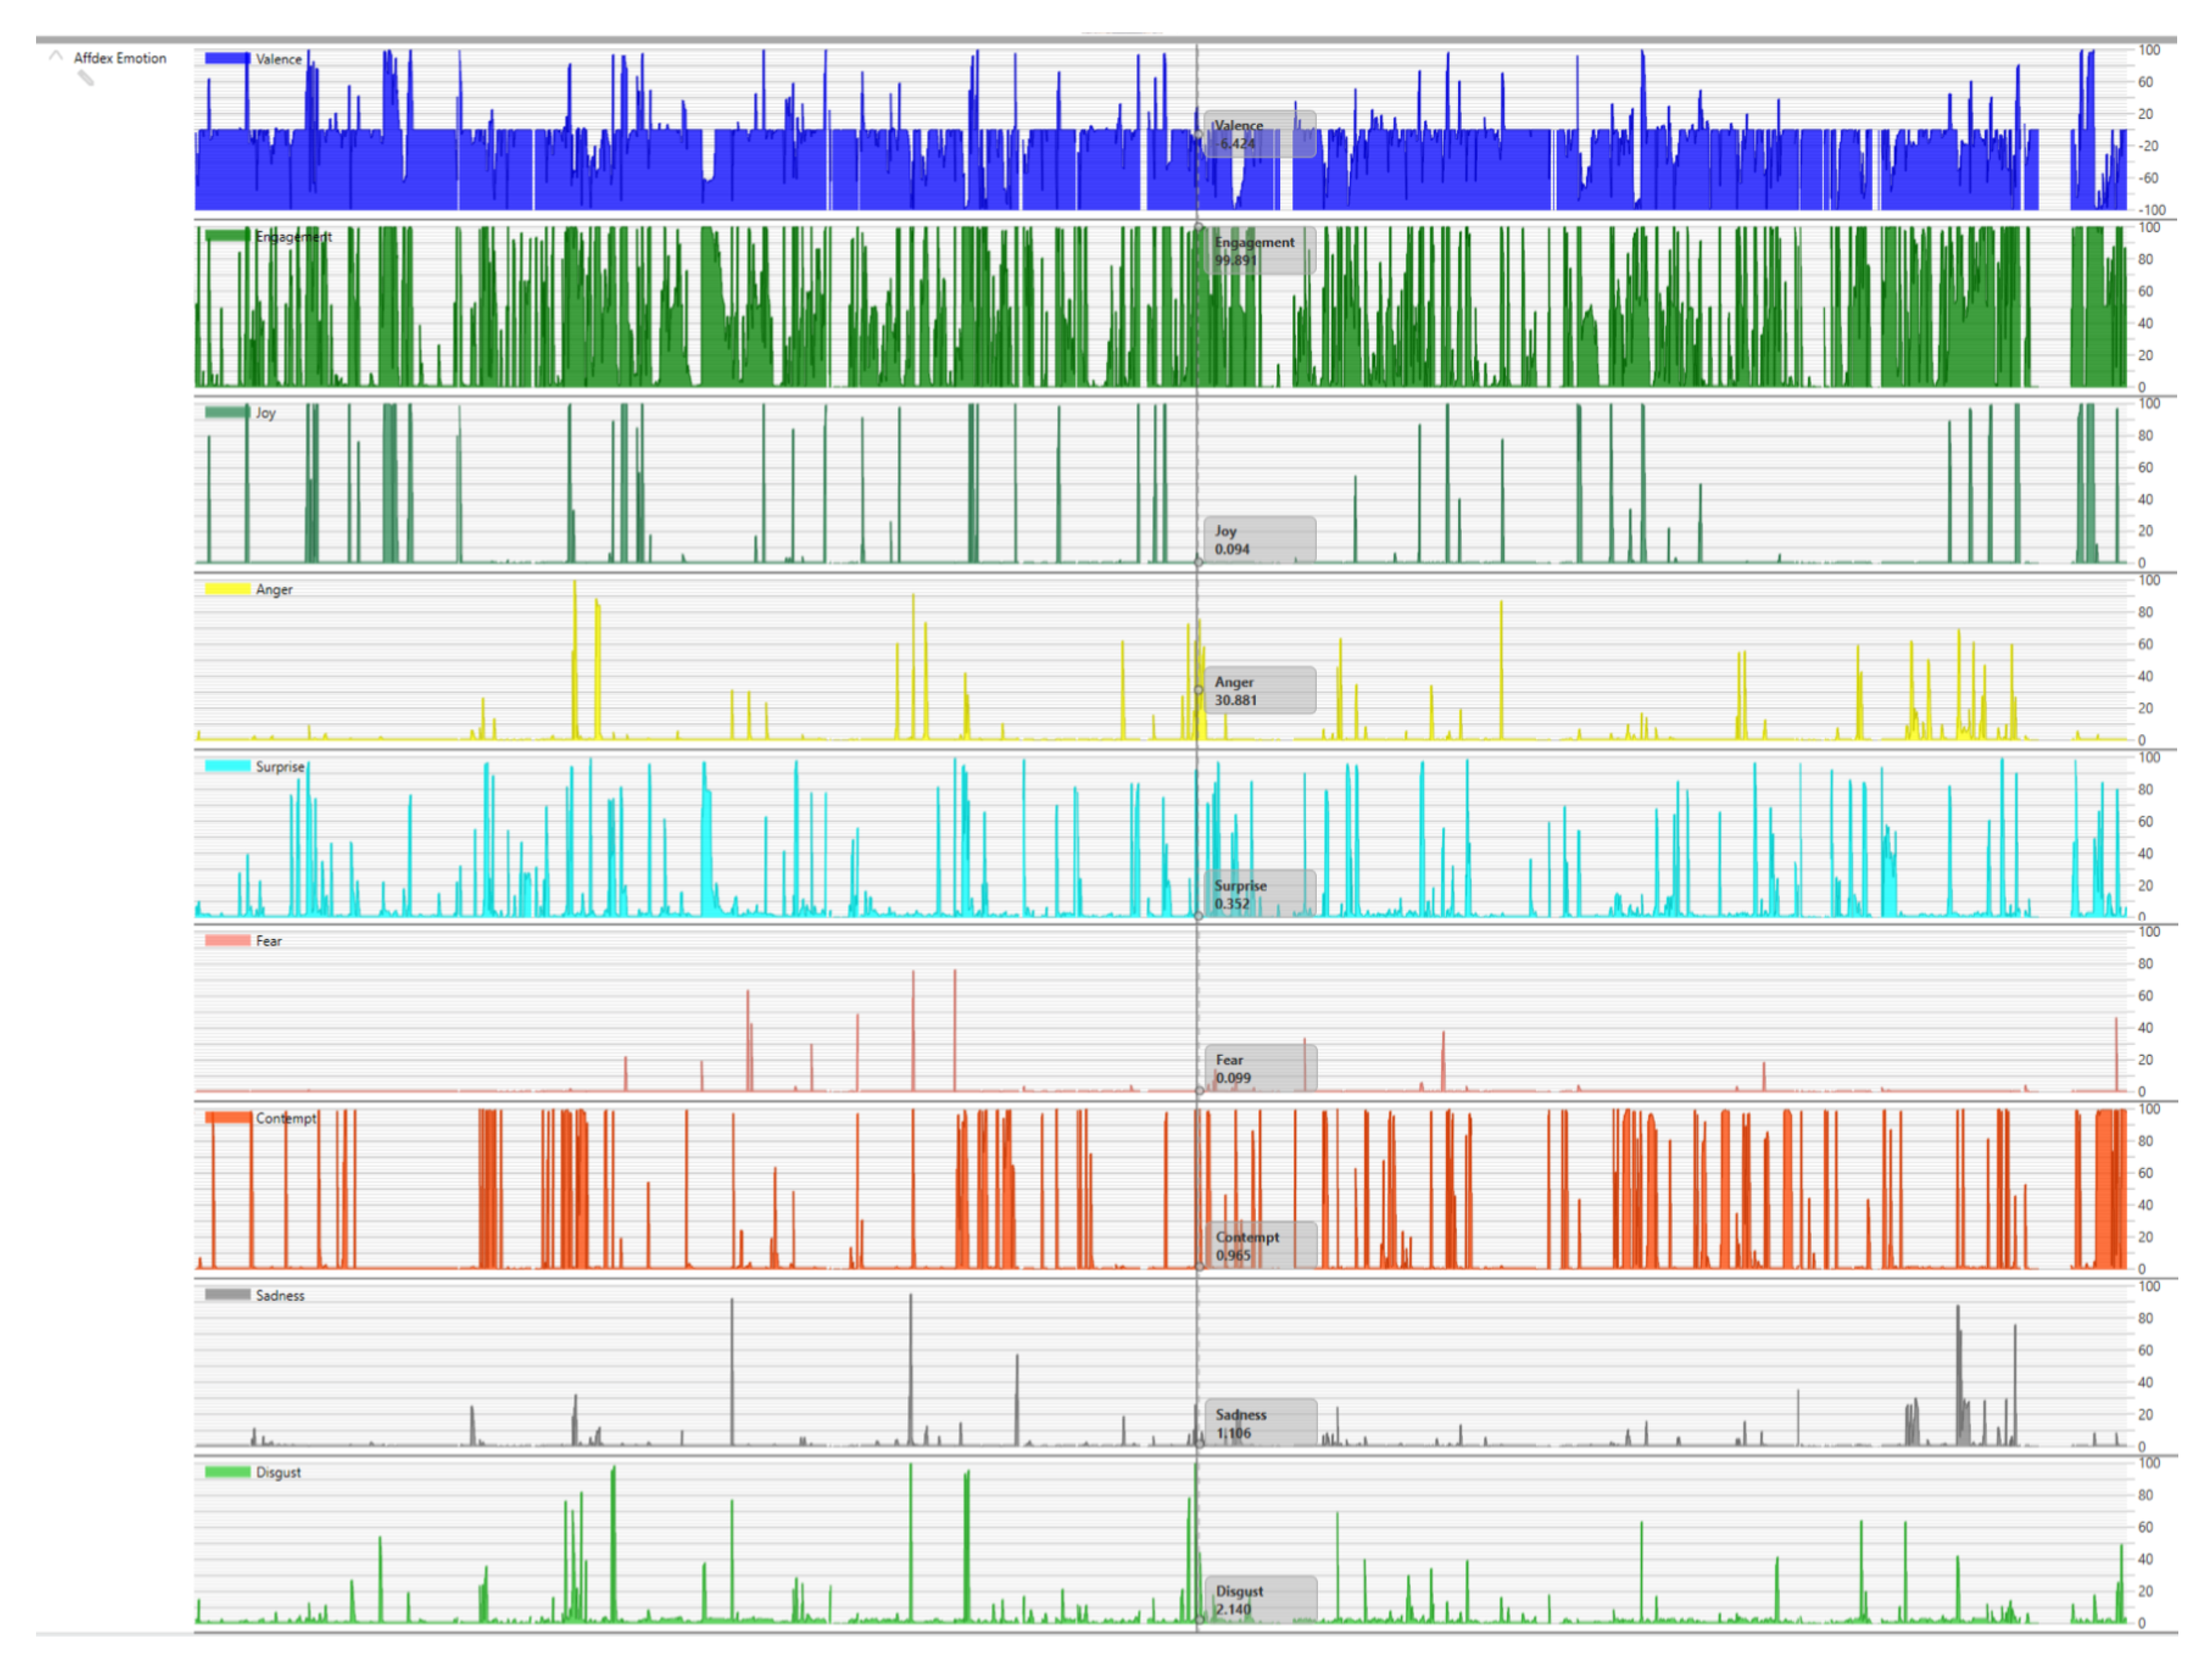
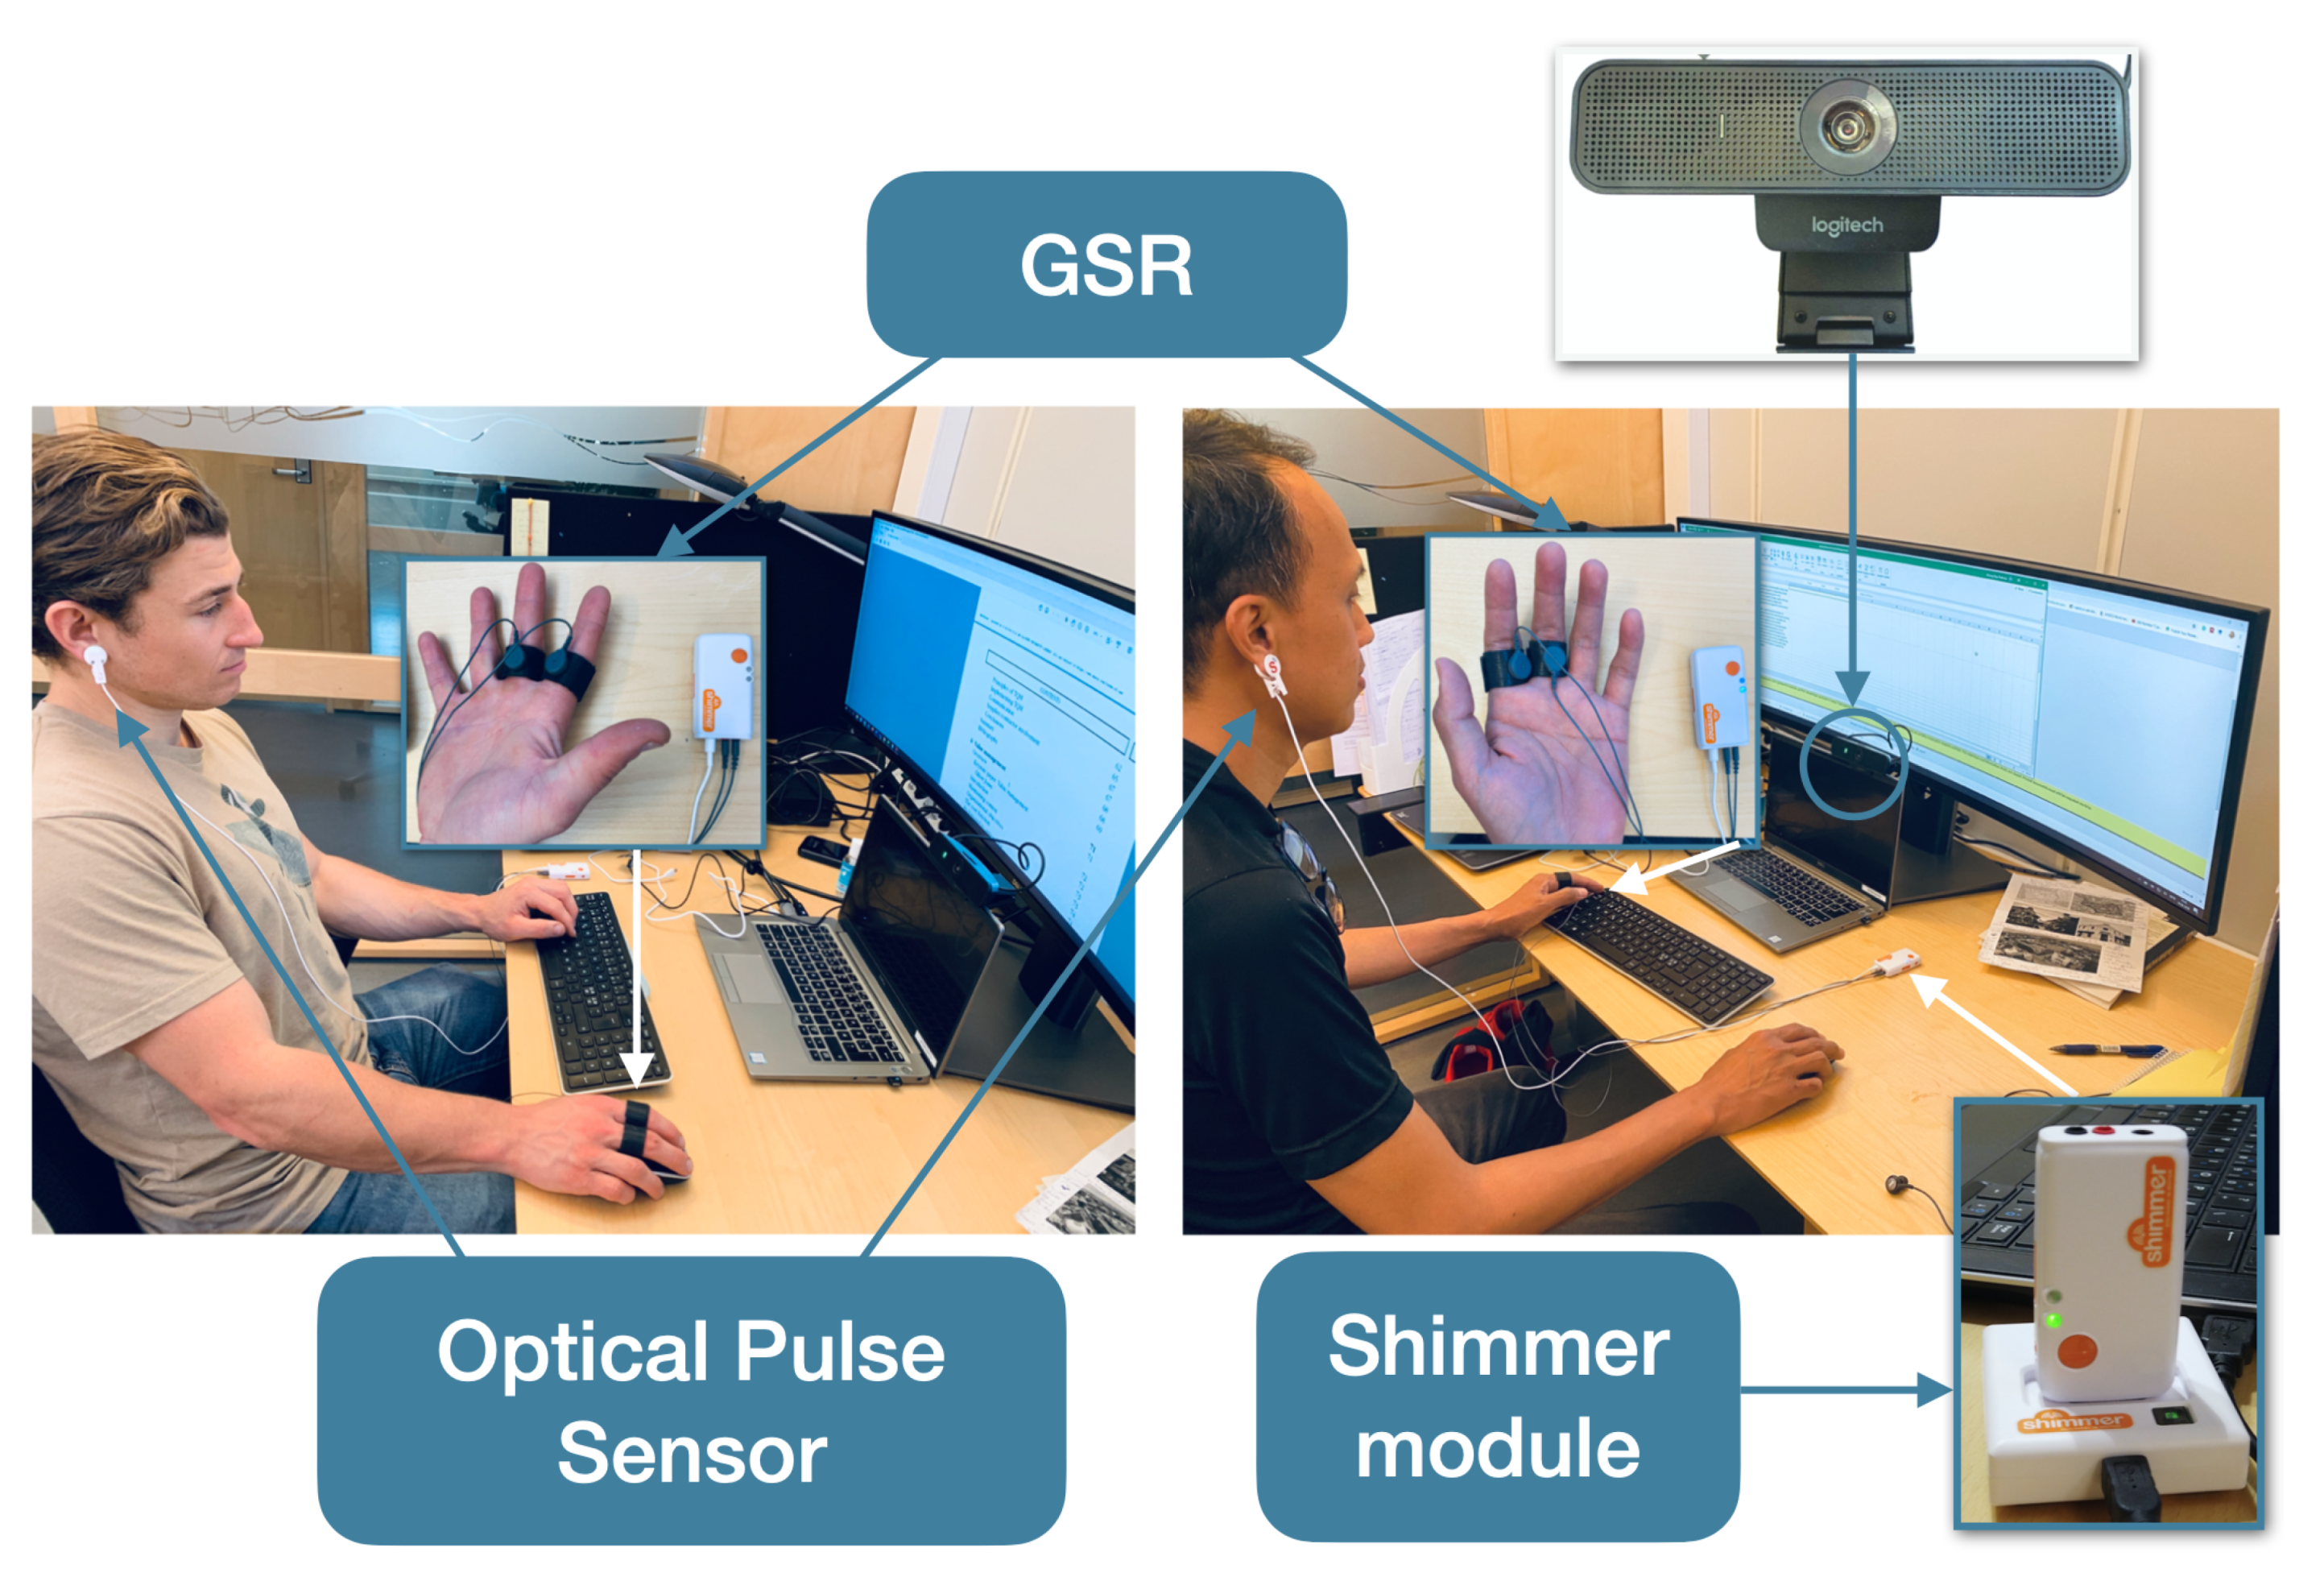
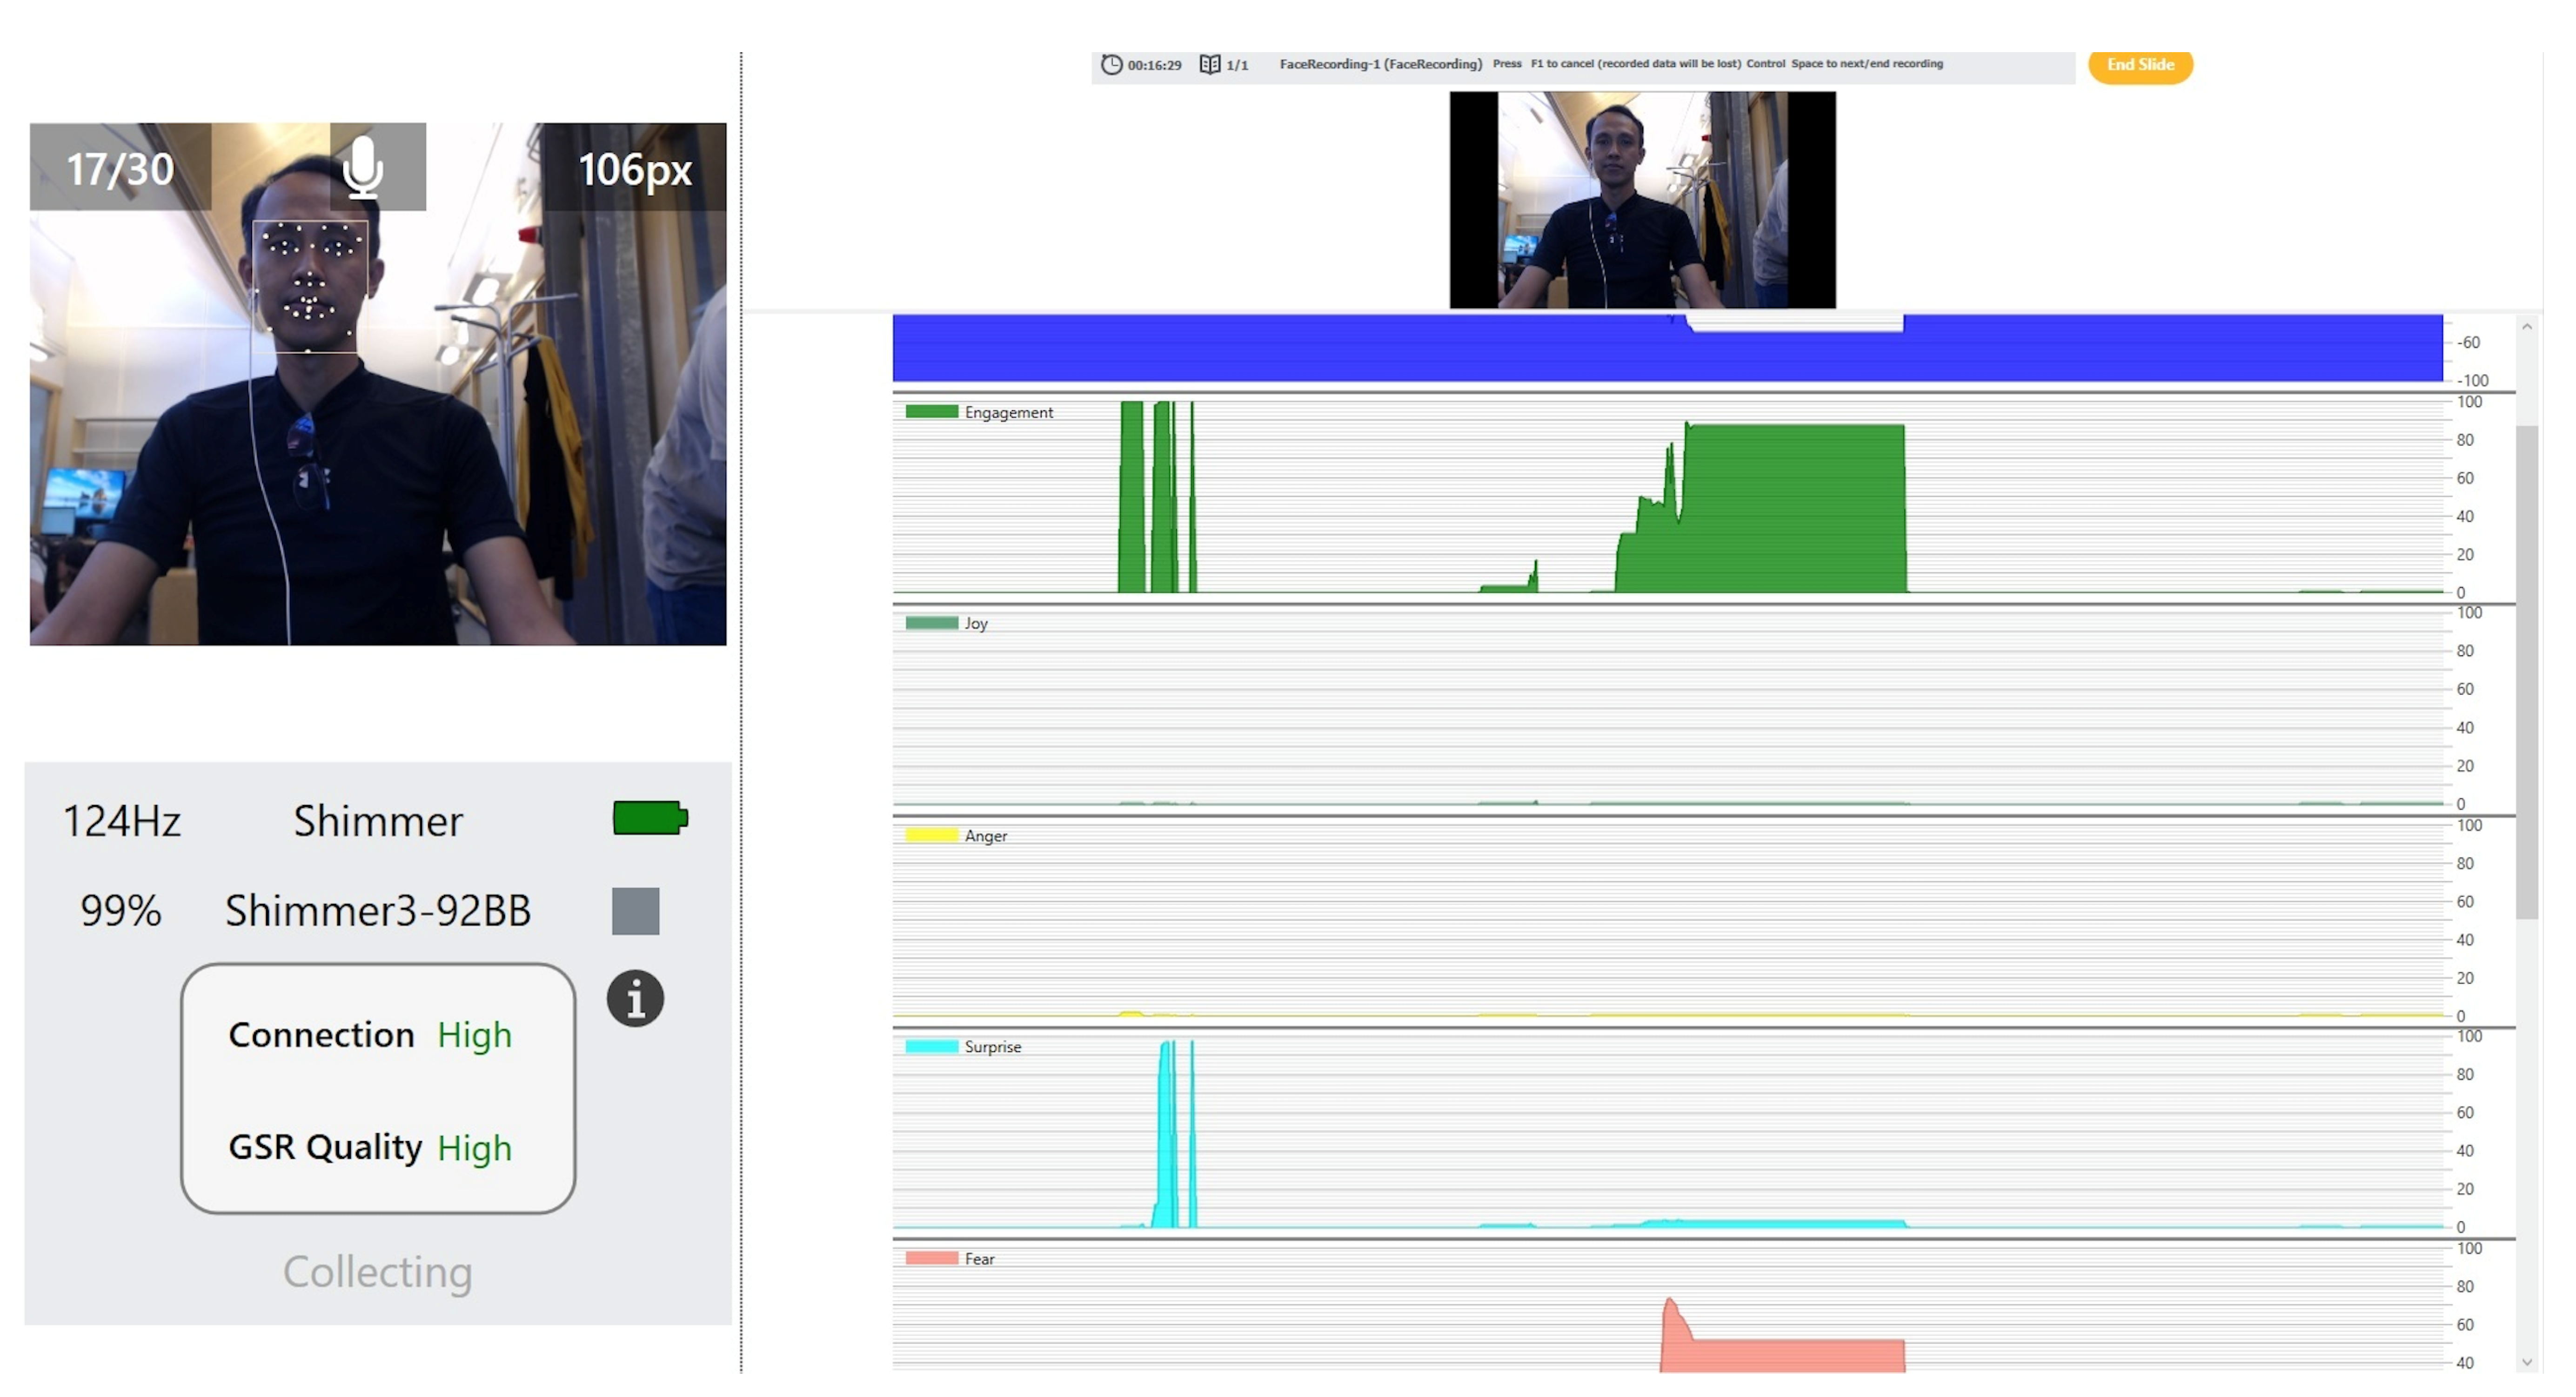
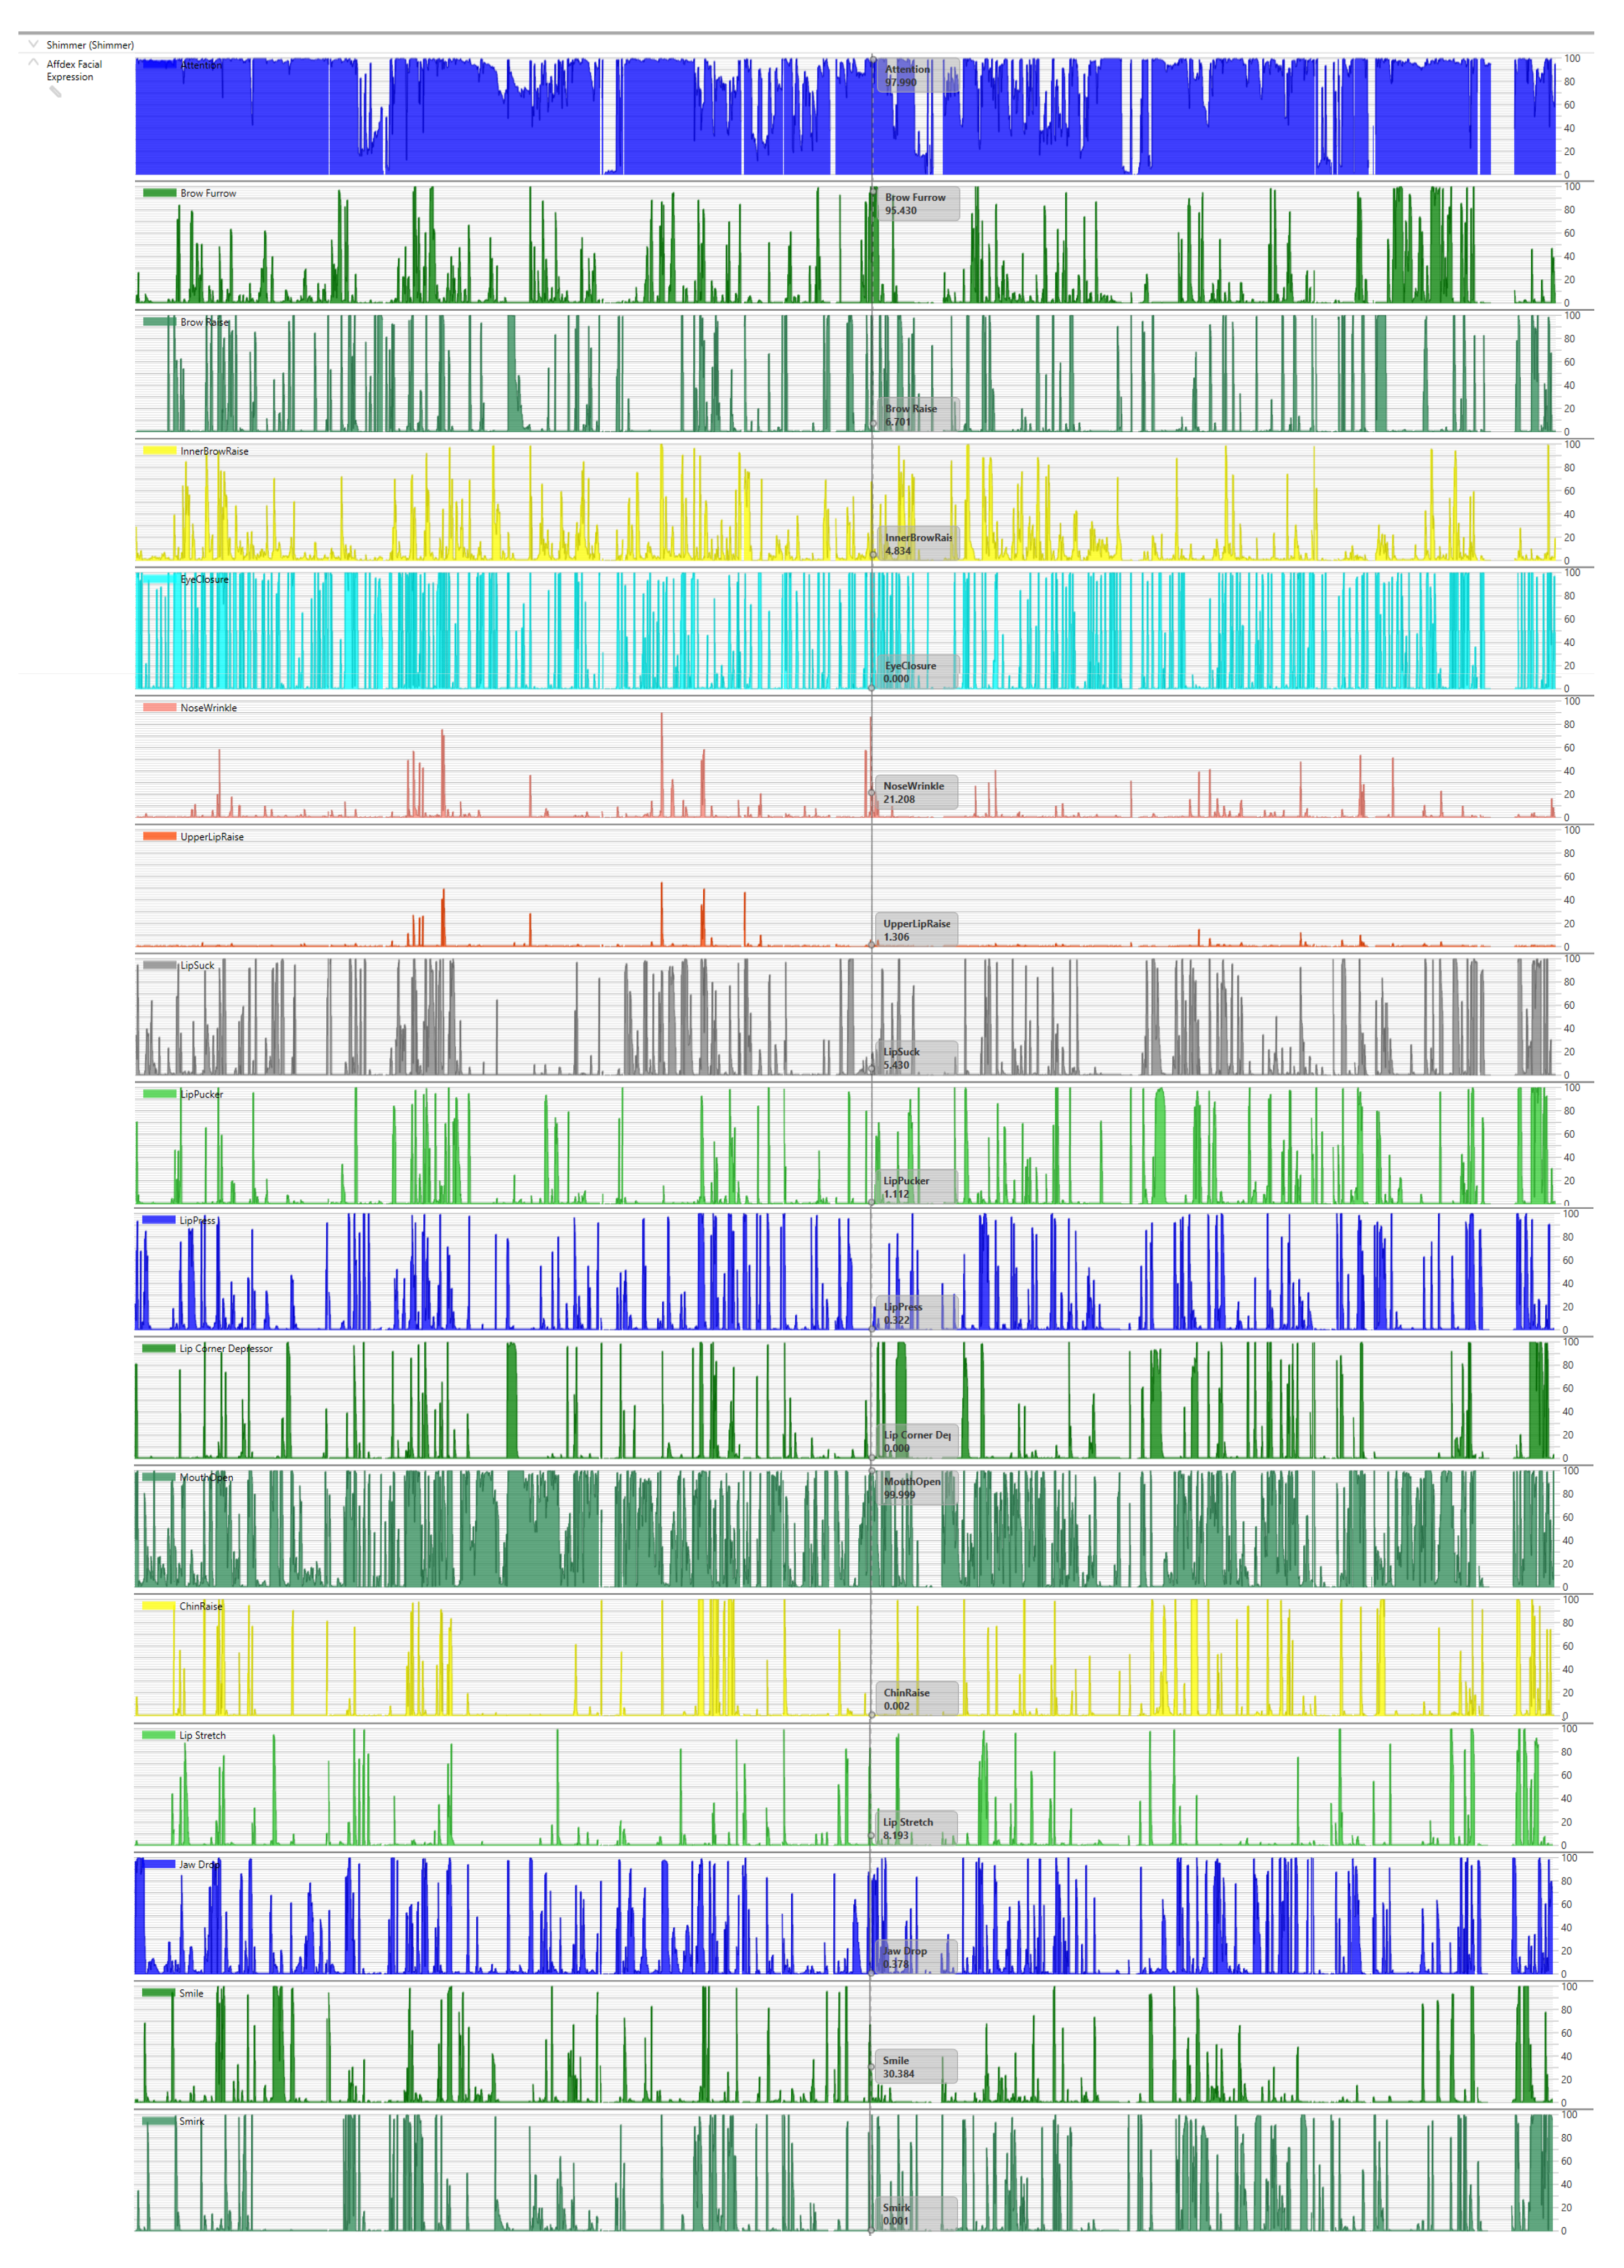
4.1. Facial Mapping and Bio-Sensing Equipment
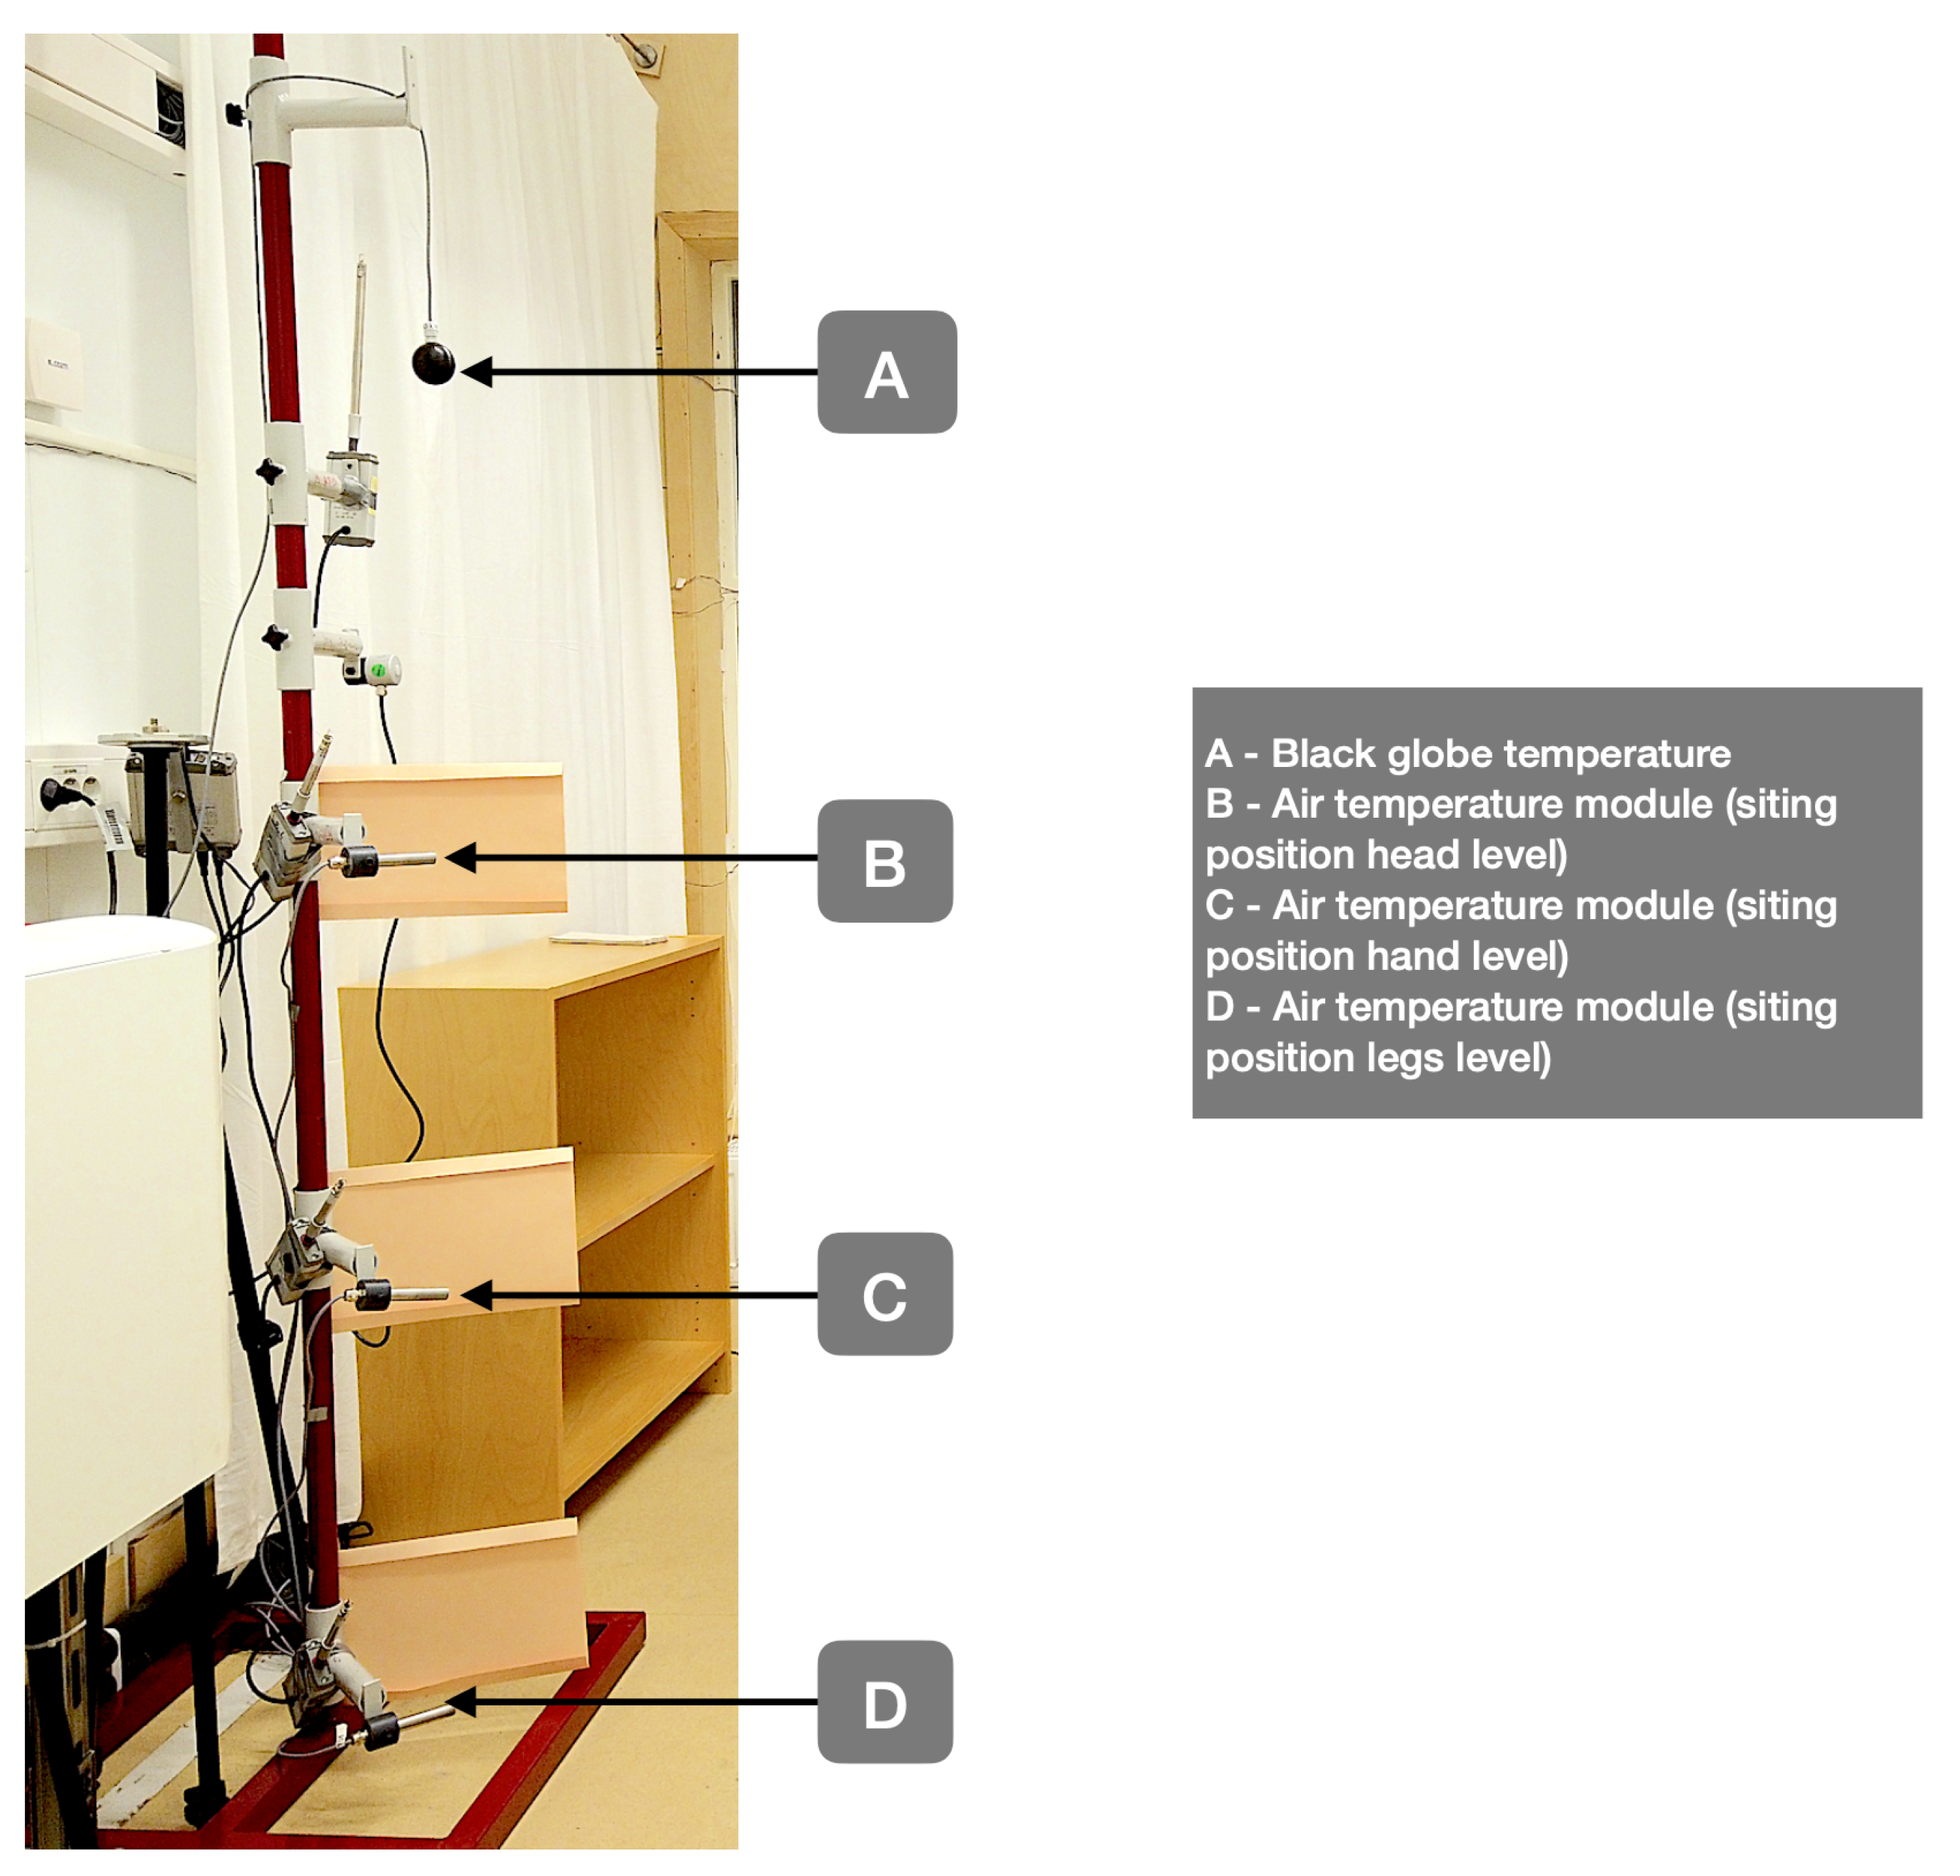
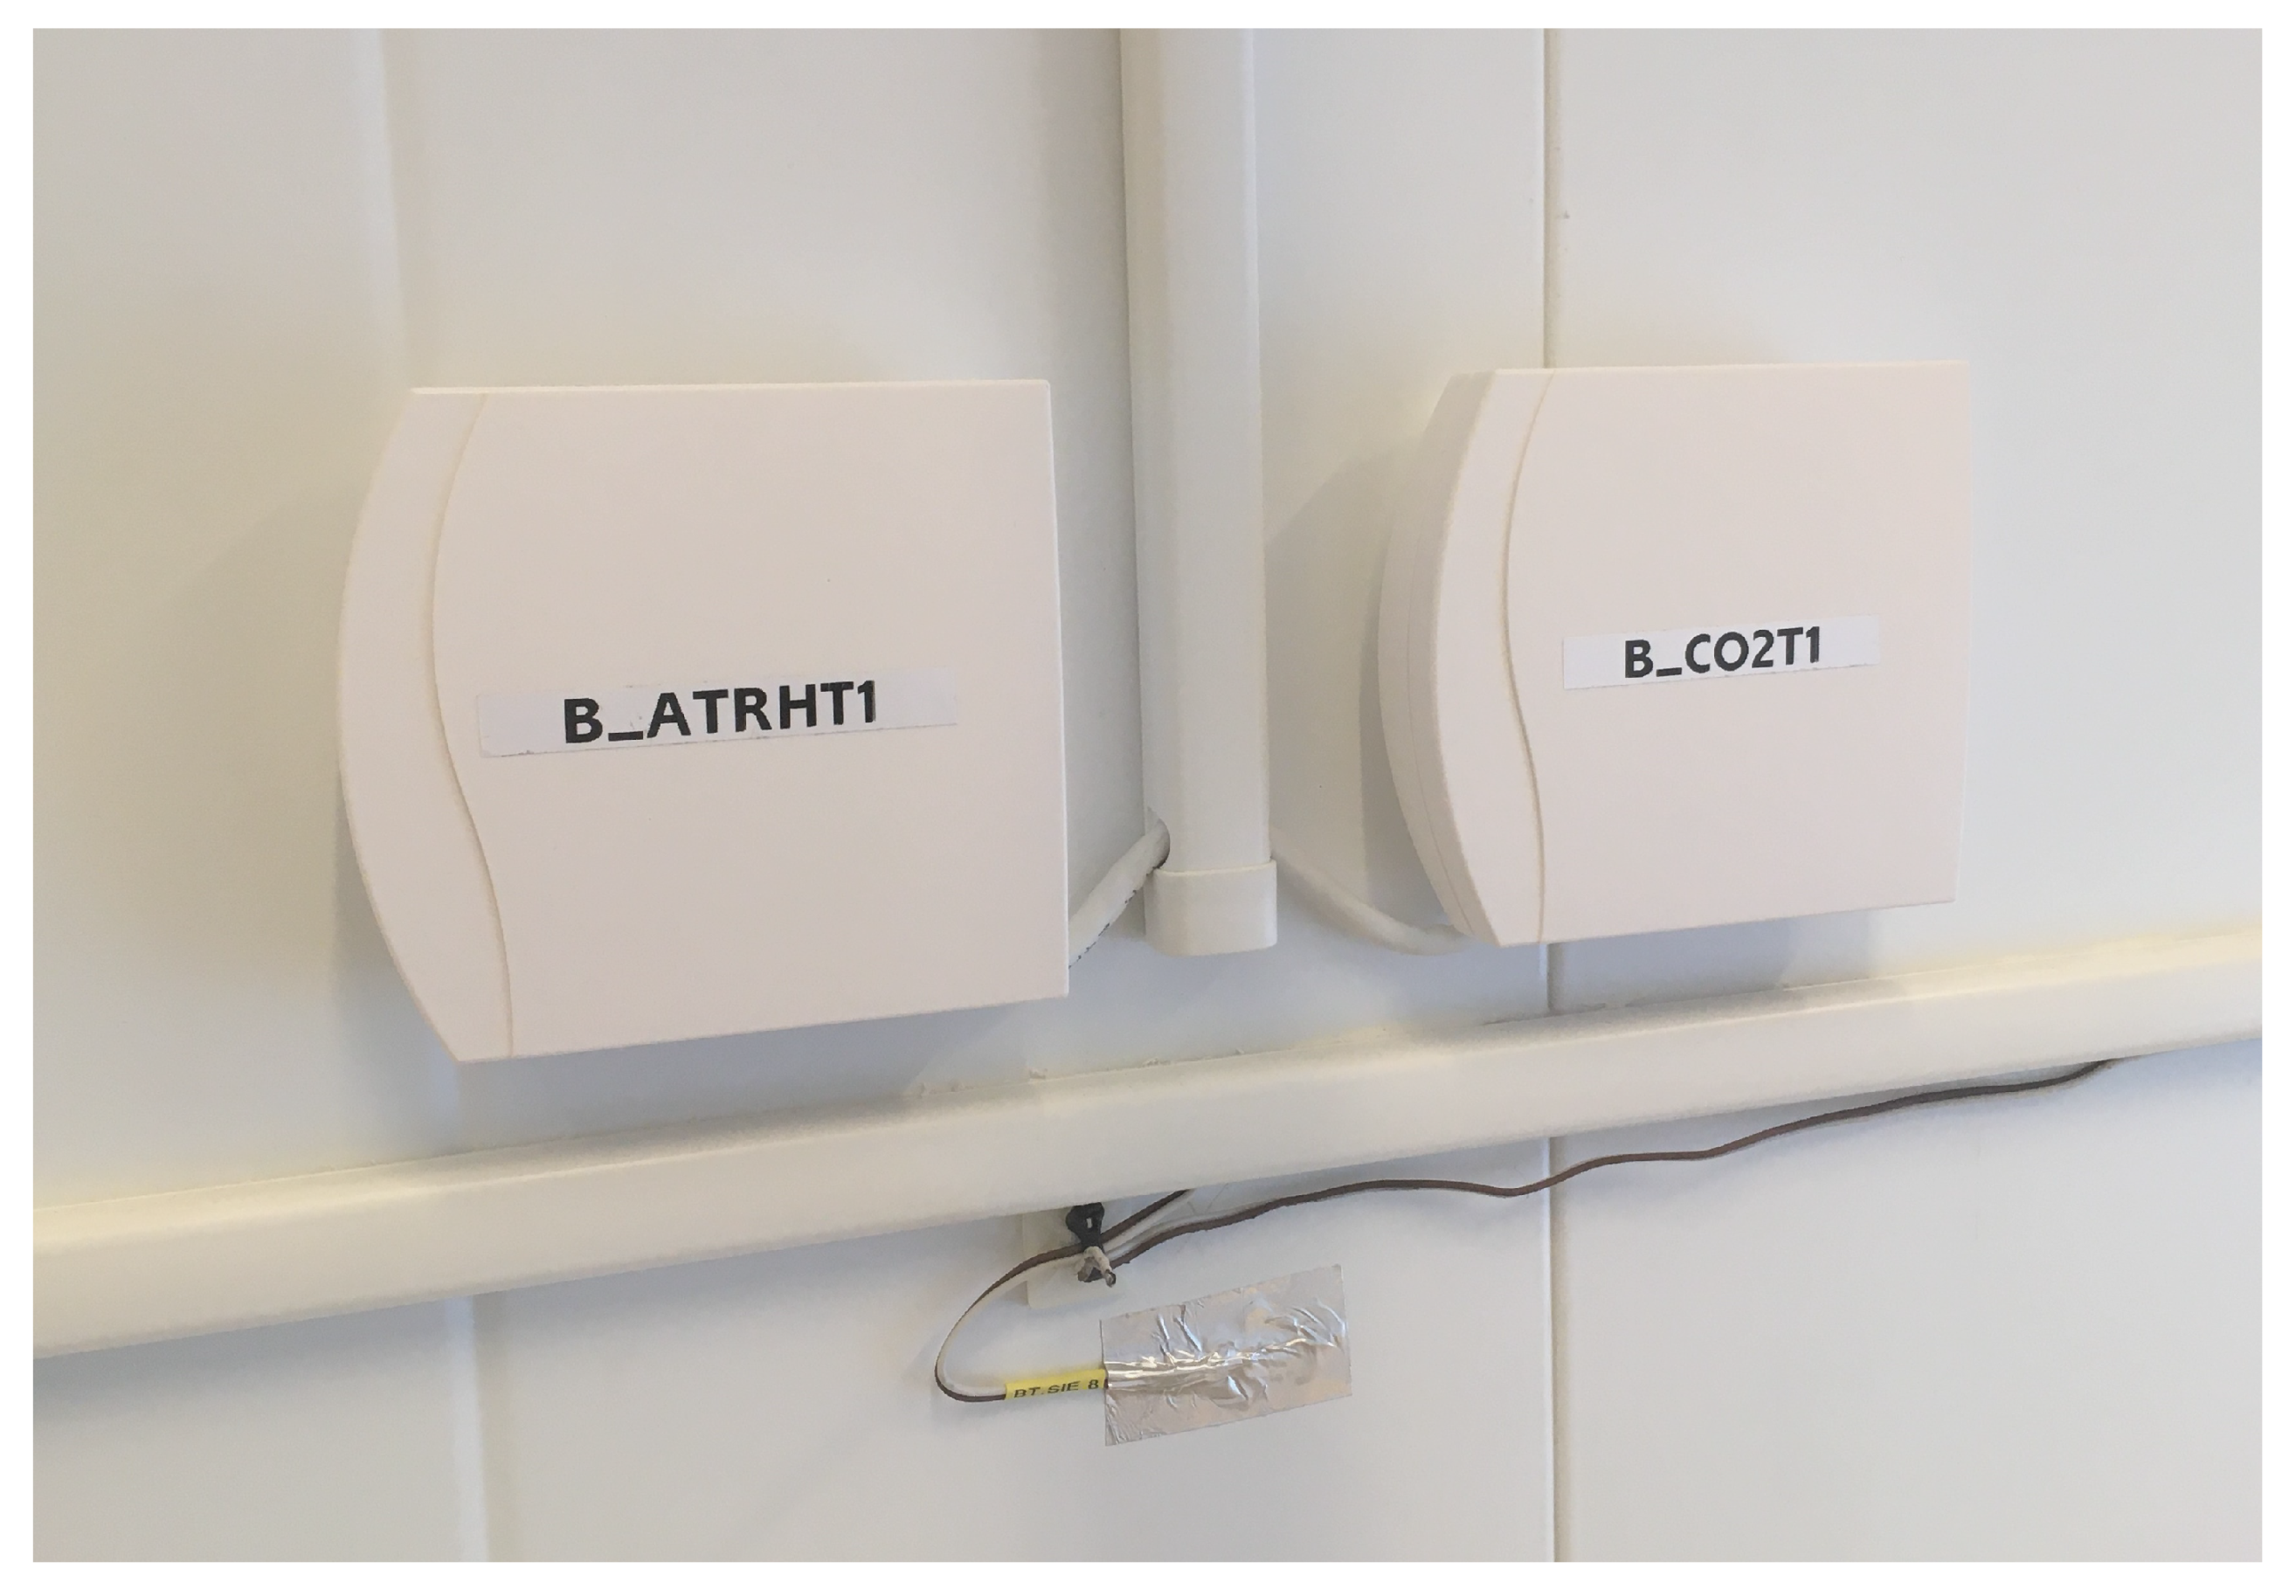
4.2. Monitoring of IE Parameters
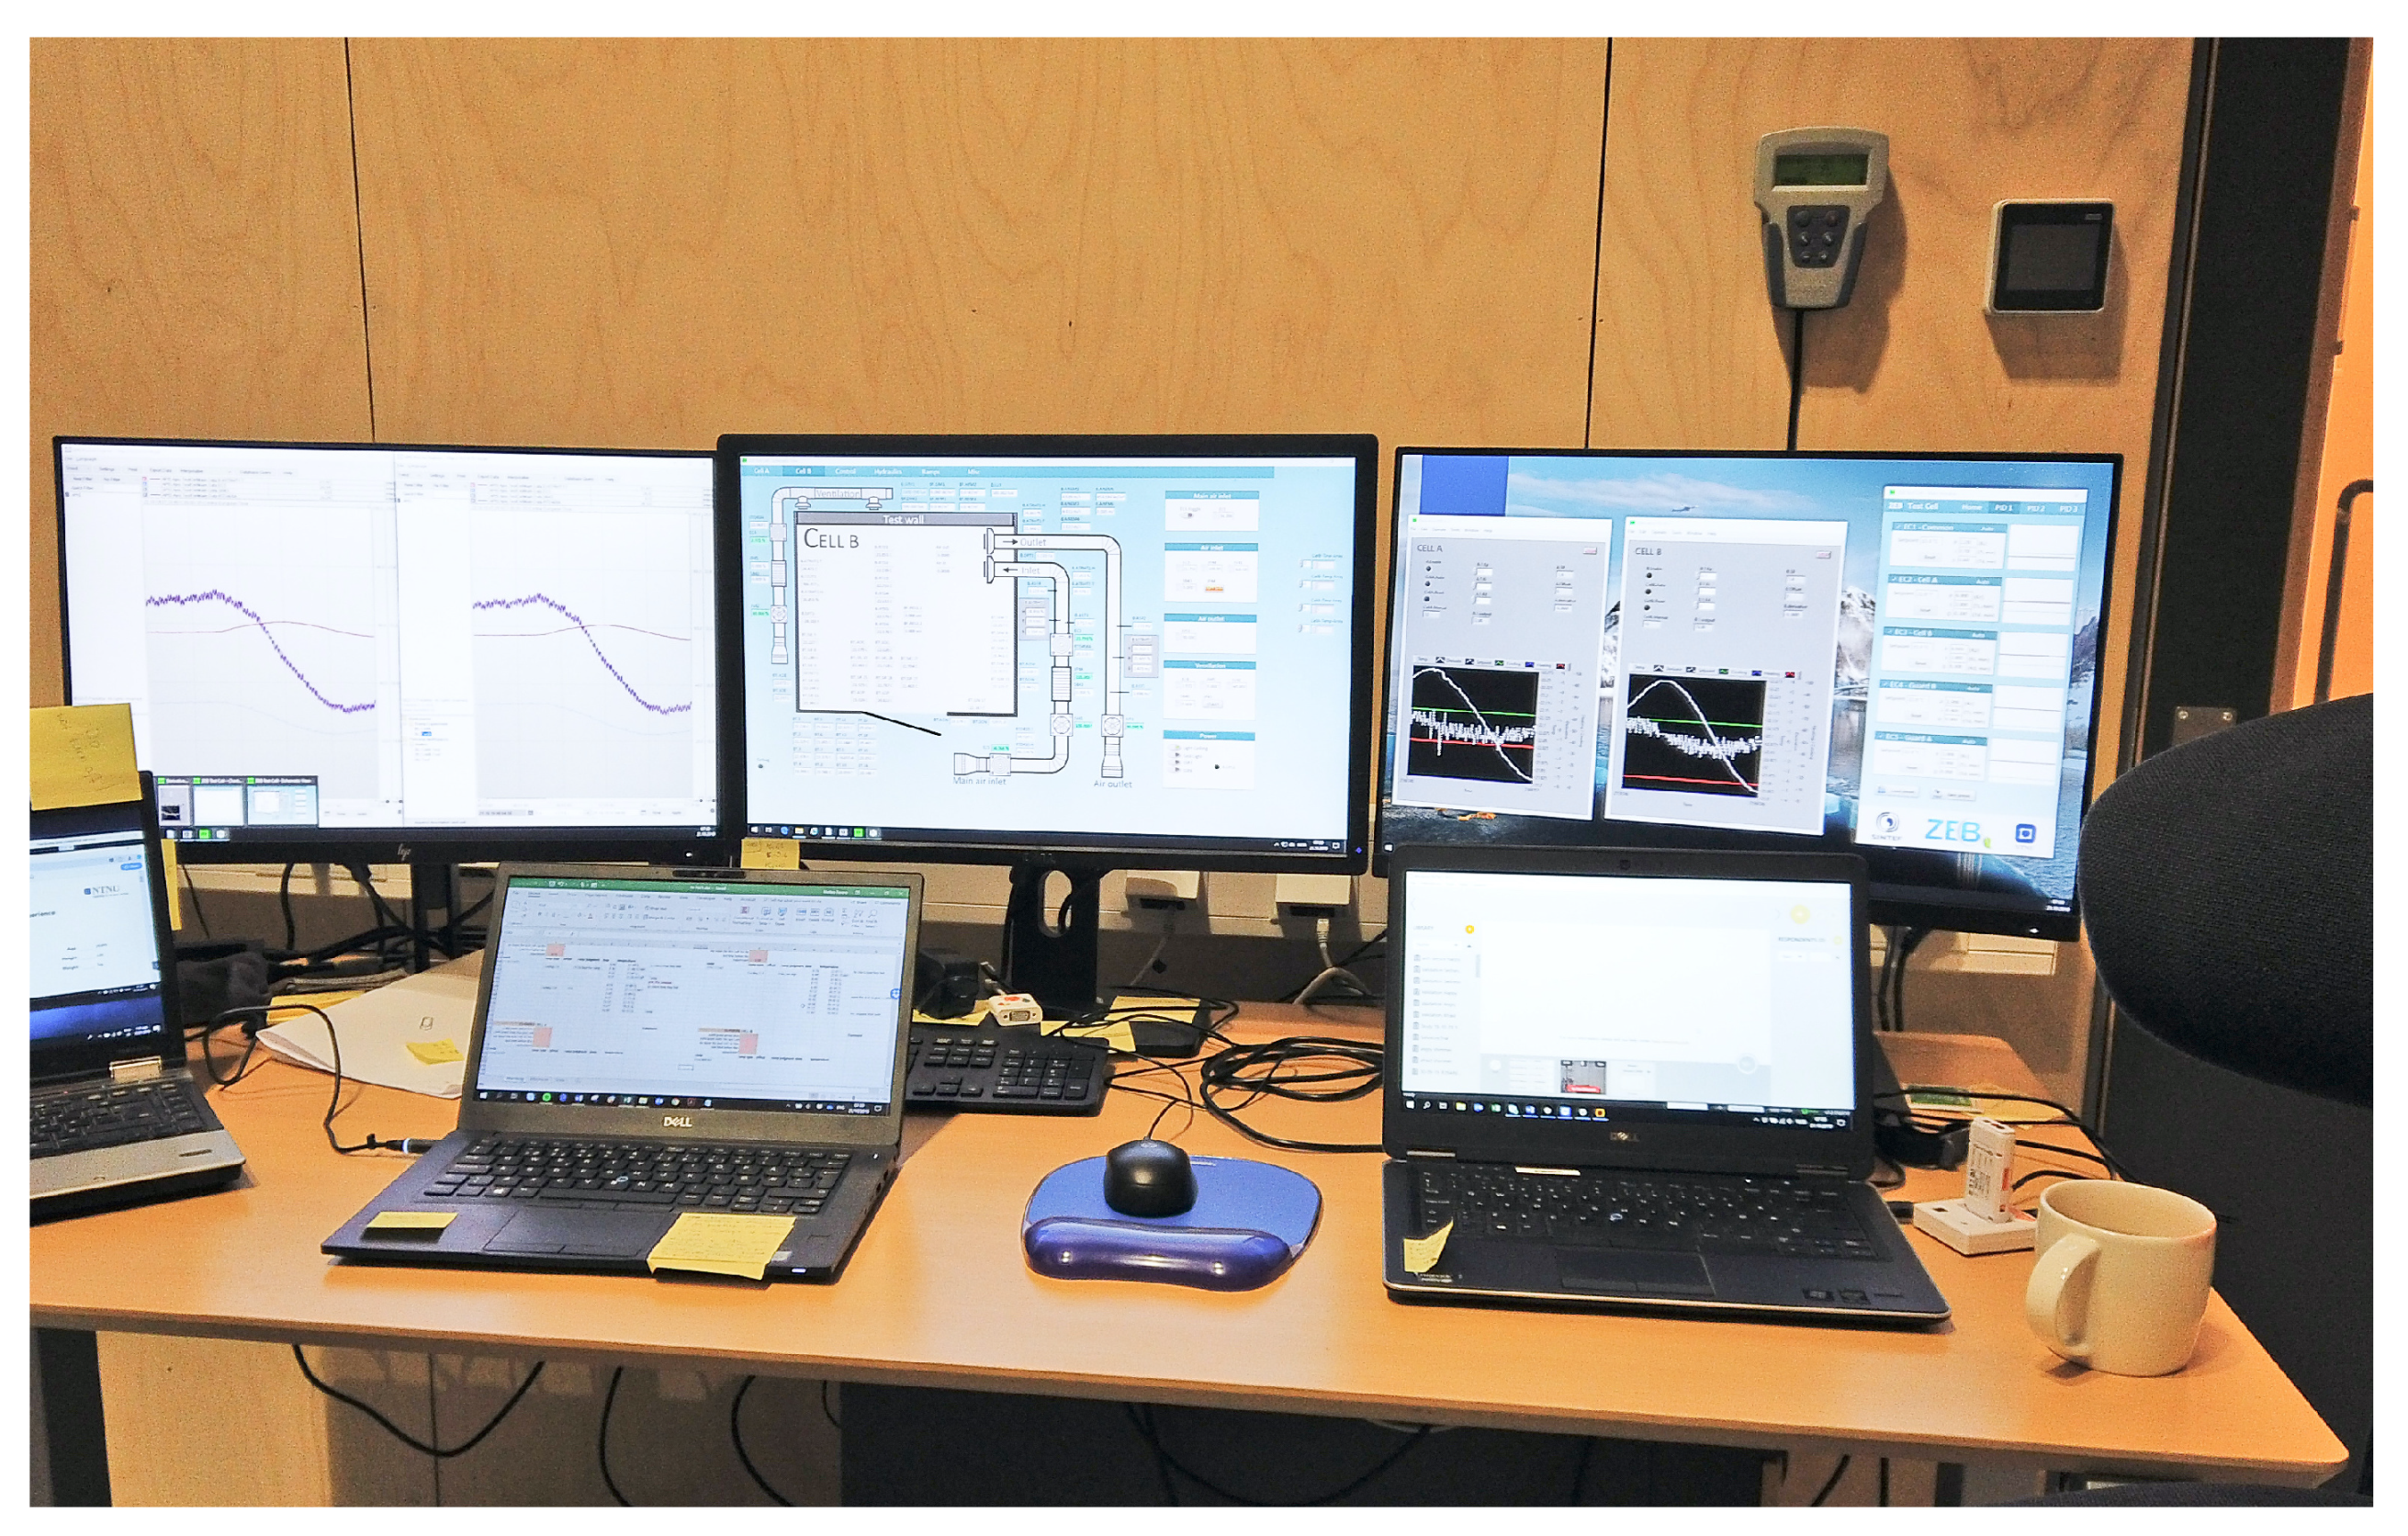
4.3. Equipment Installation and Utilization during the Experiment
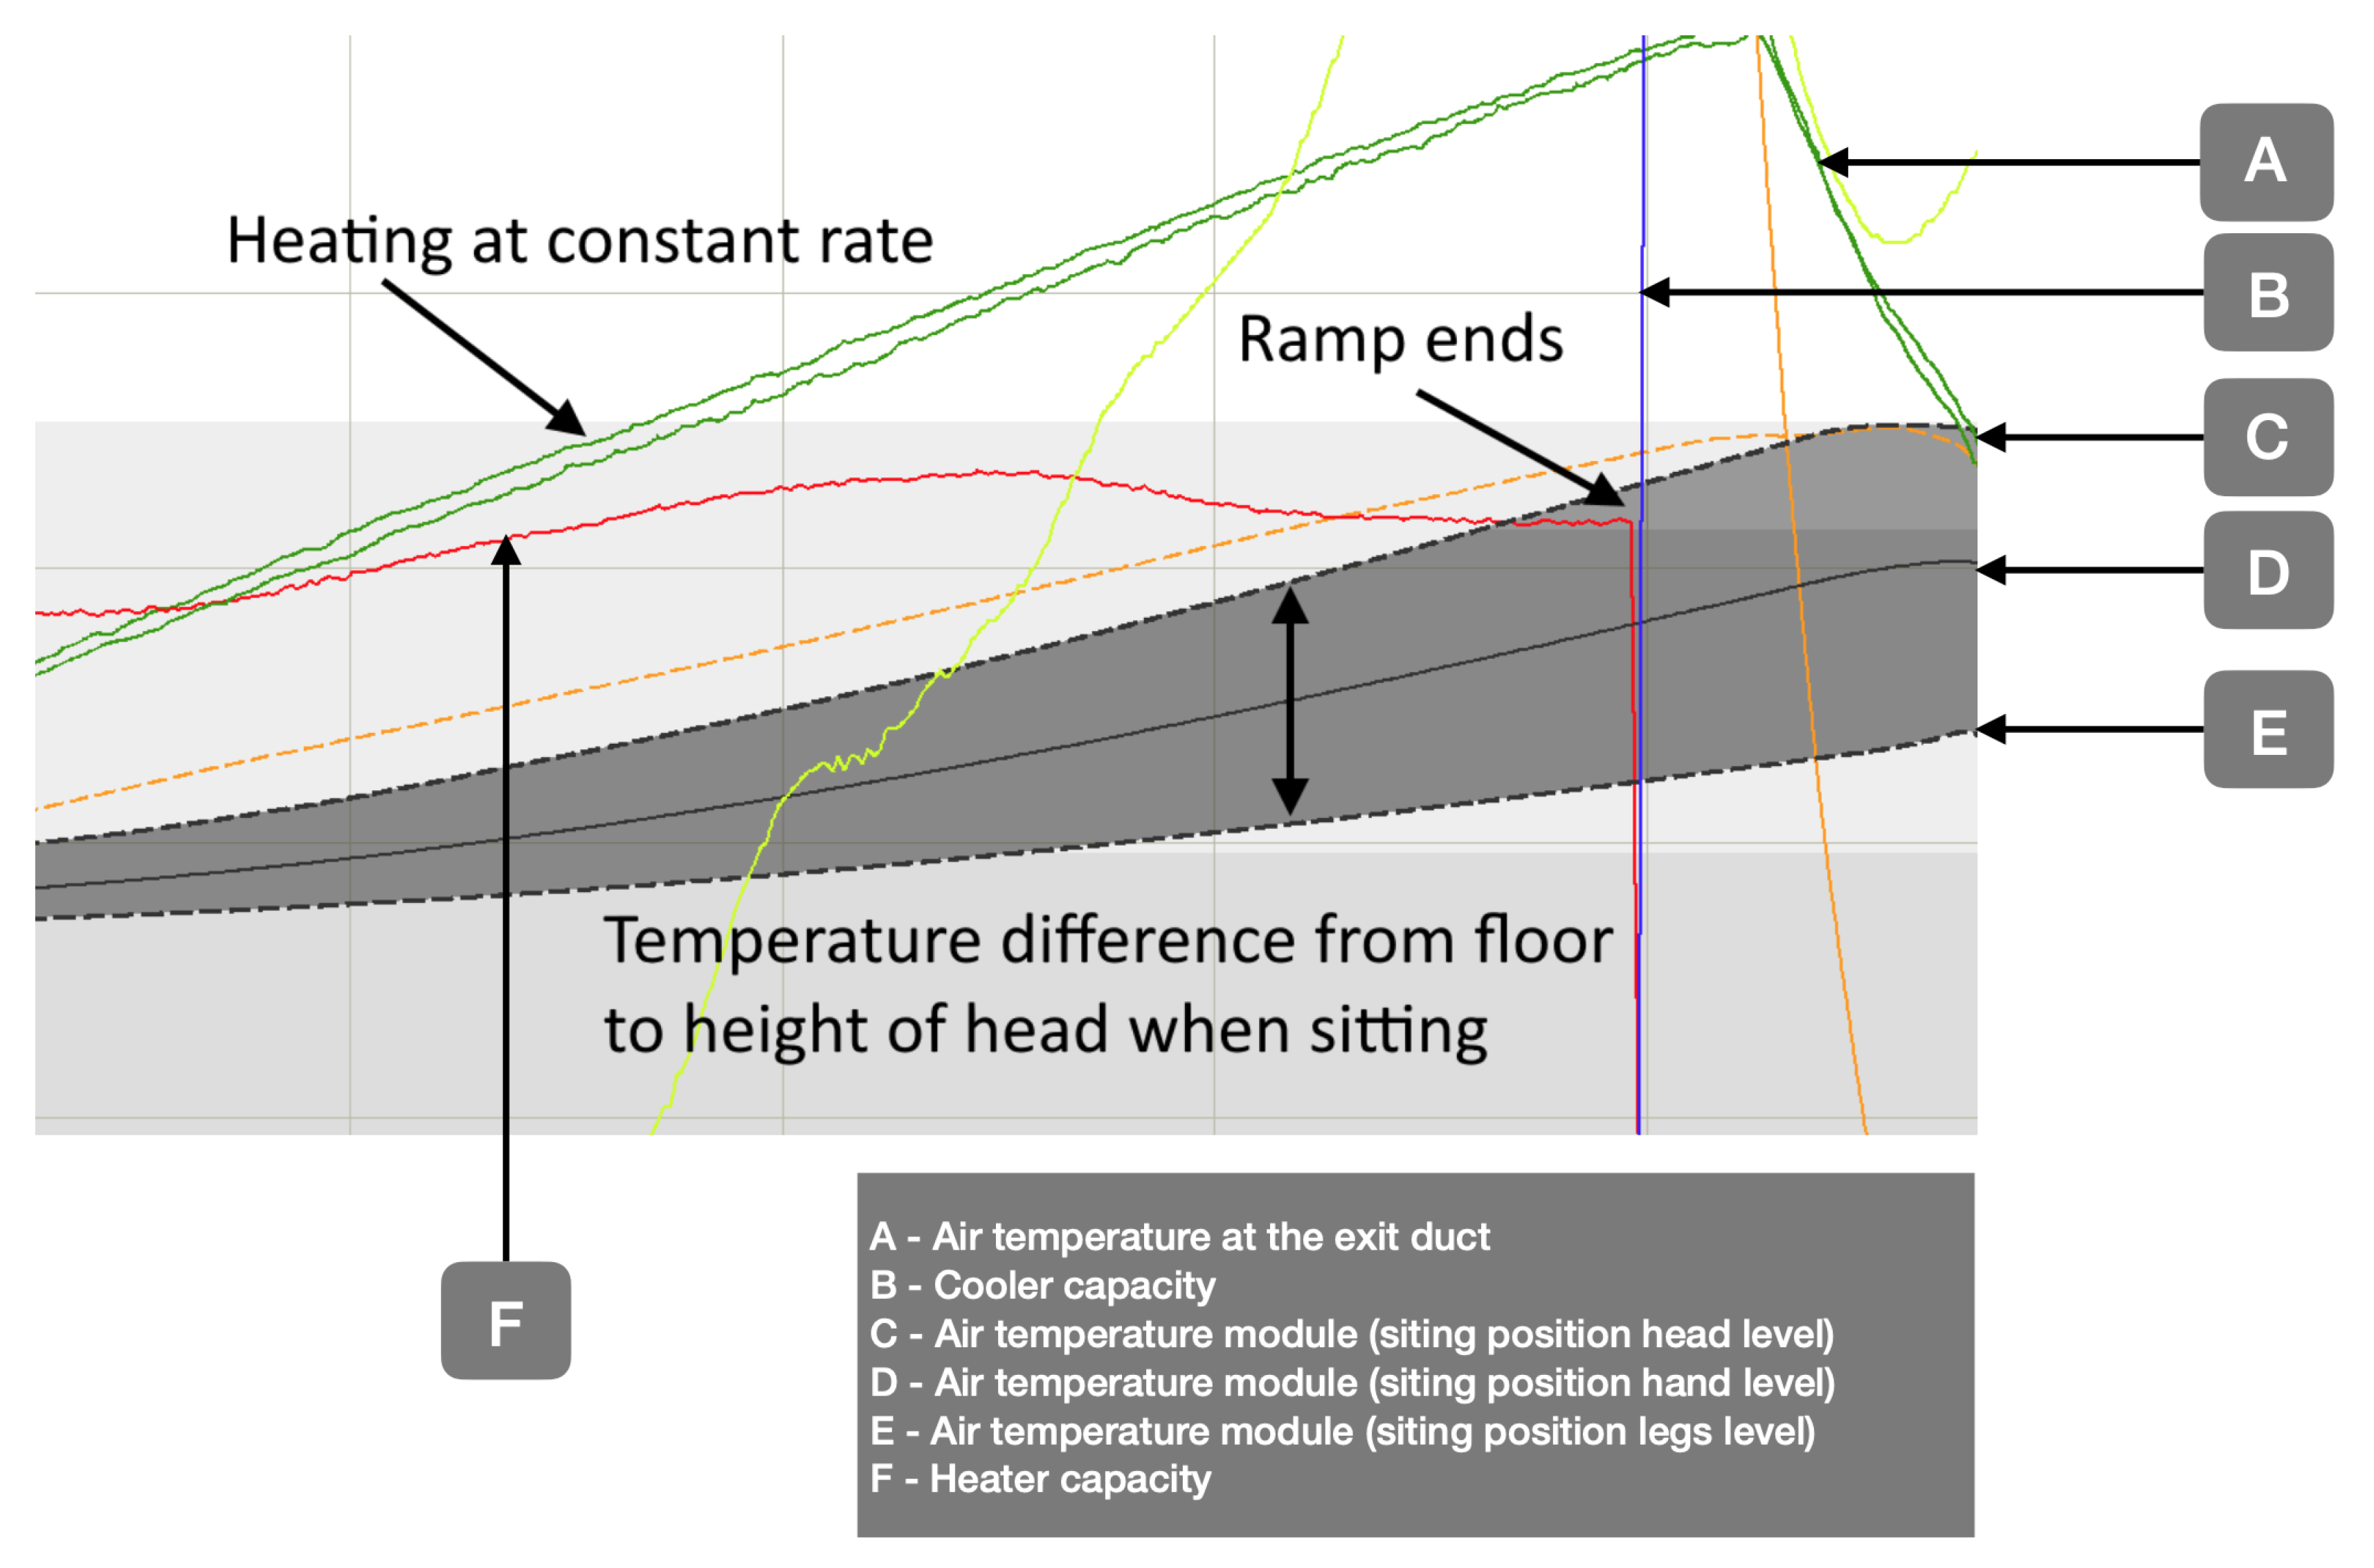
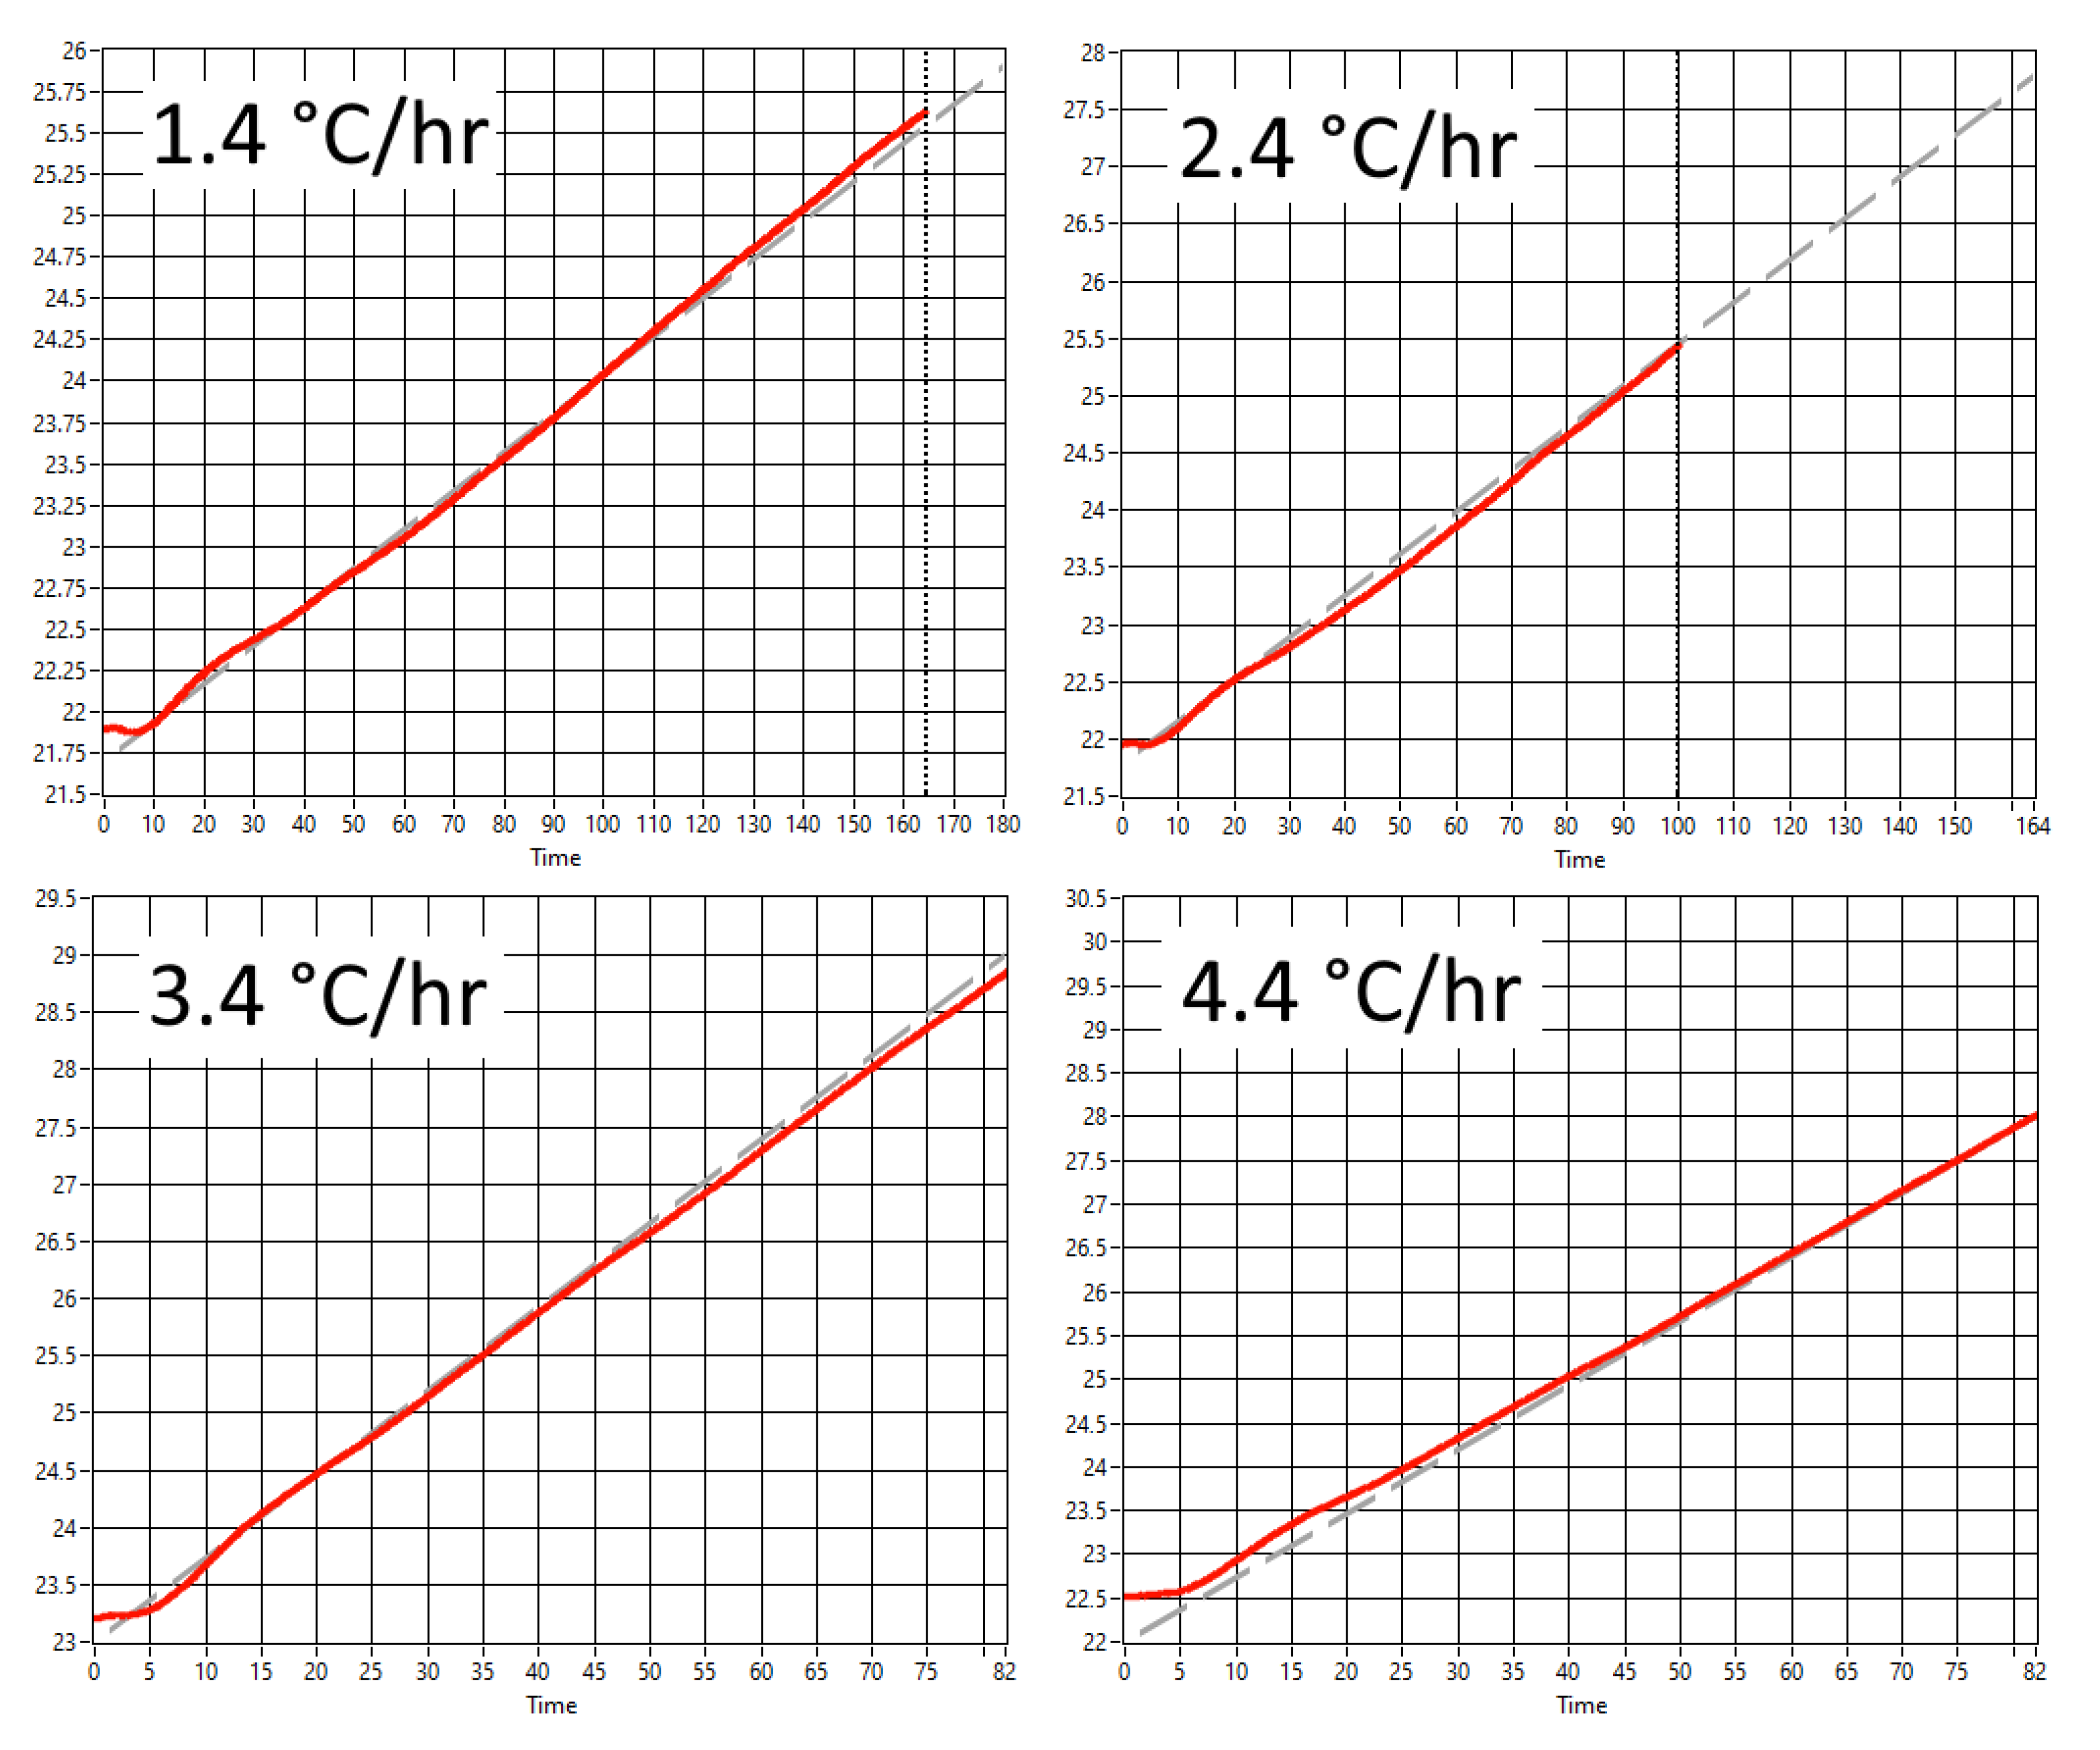
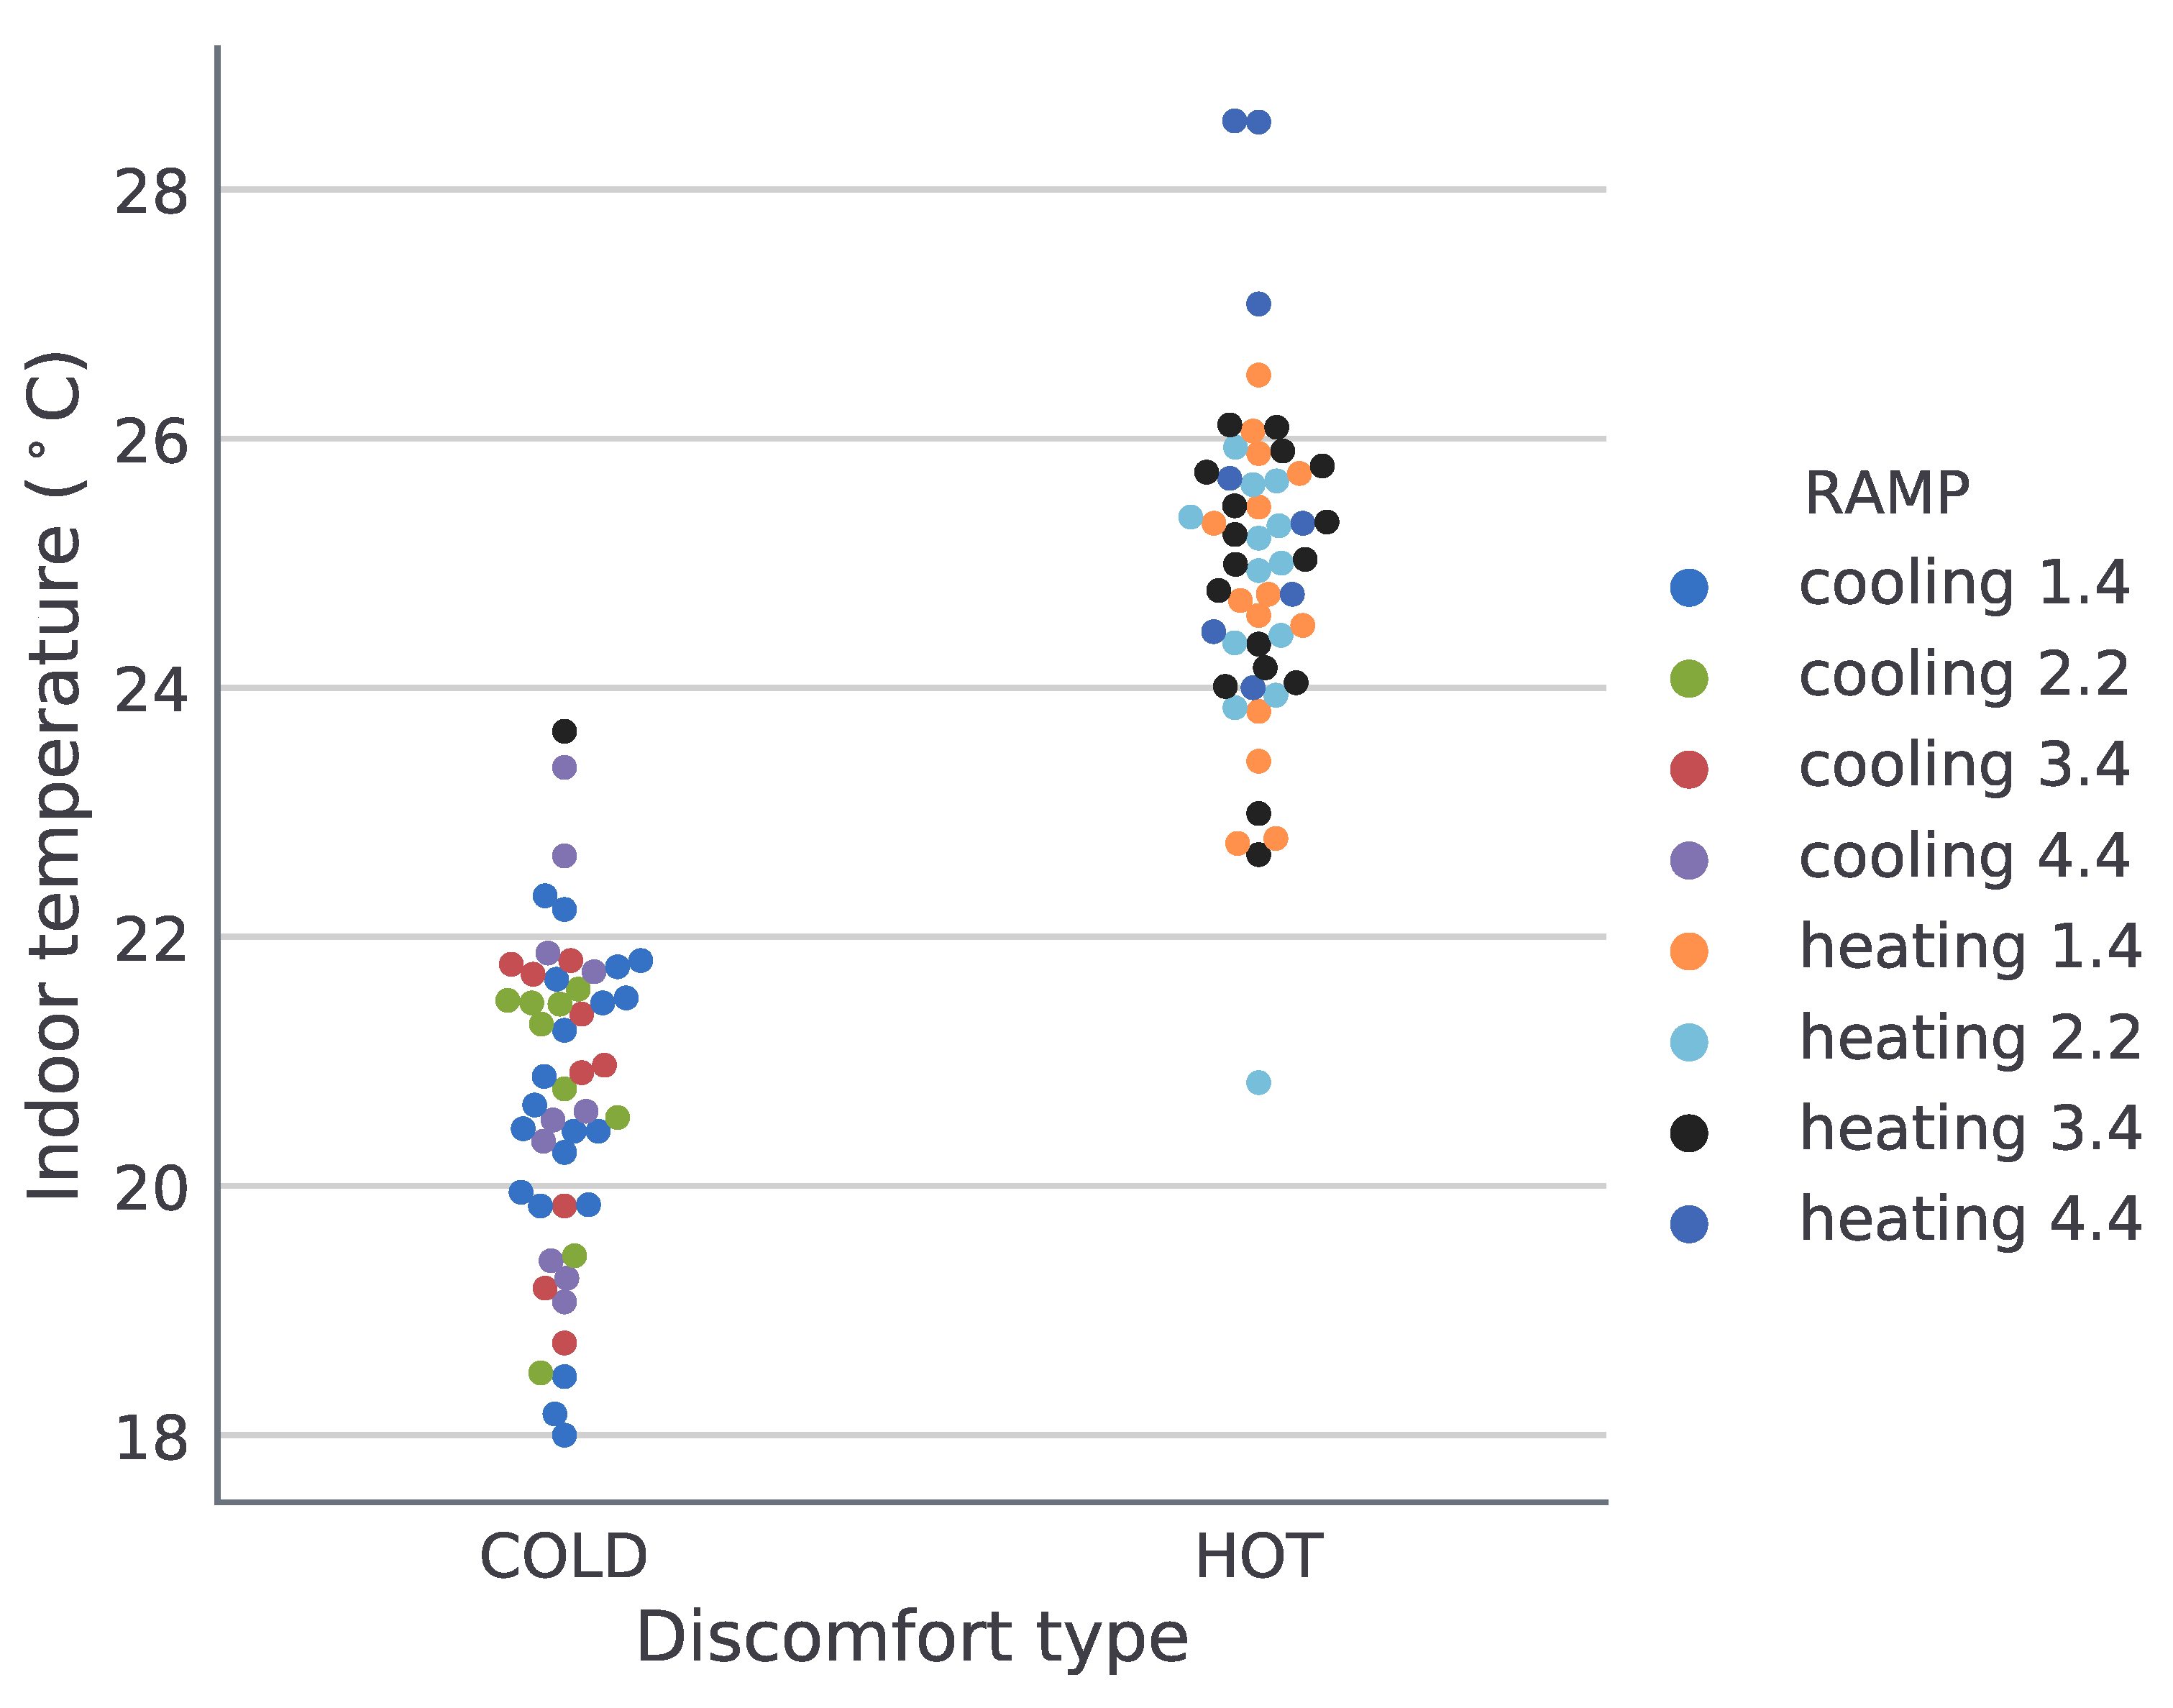
- heating 1.4 ramp = +1.4 C per hour
- heating 2.2 ramp = +2.2 C per hour
- heating 3.4 ramp = +3.4 C per hour
- heating 4.4 ramp = +4.4 C per hour
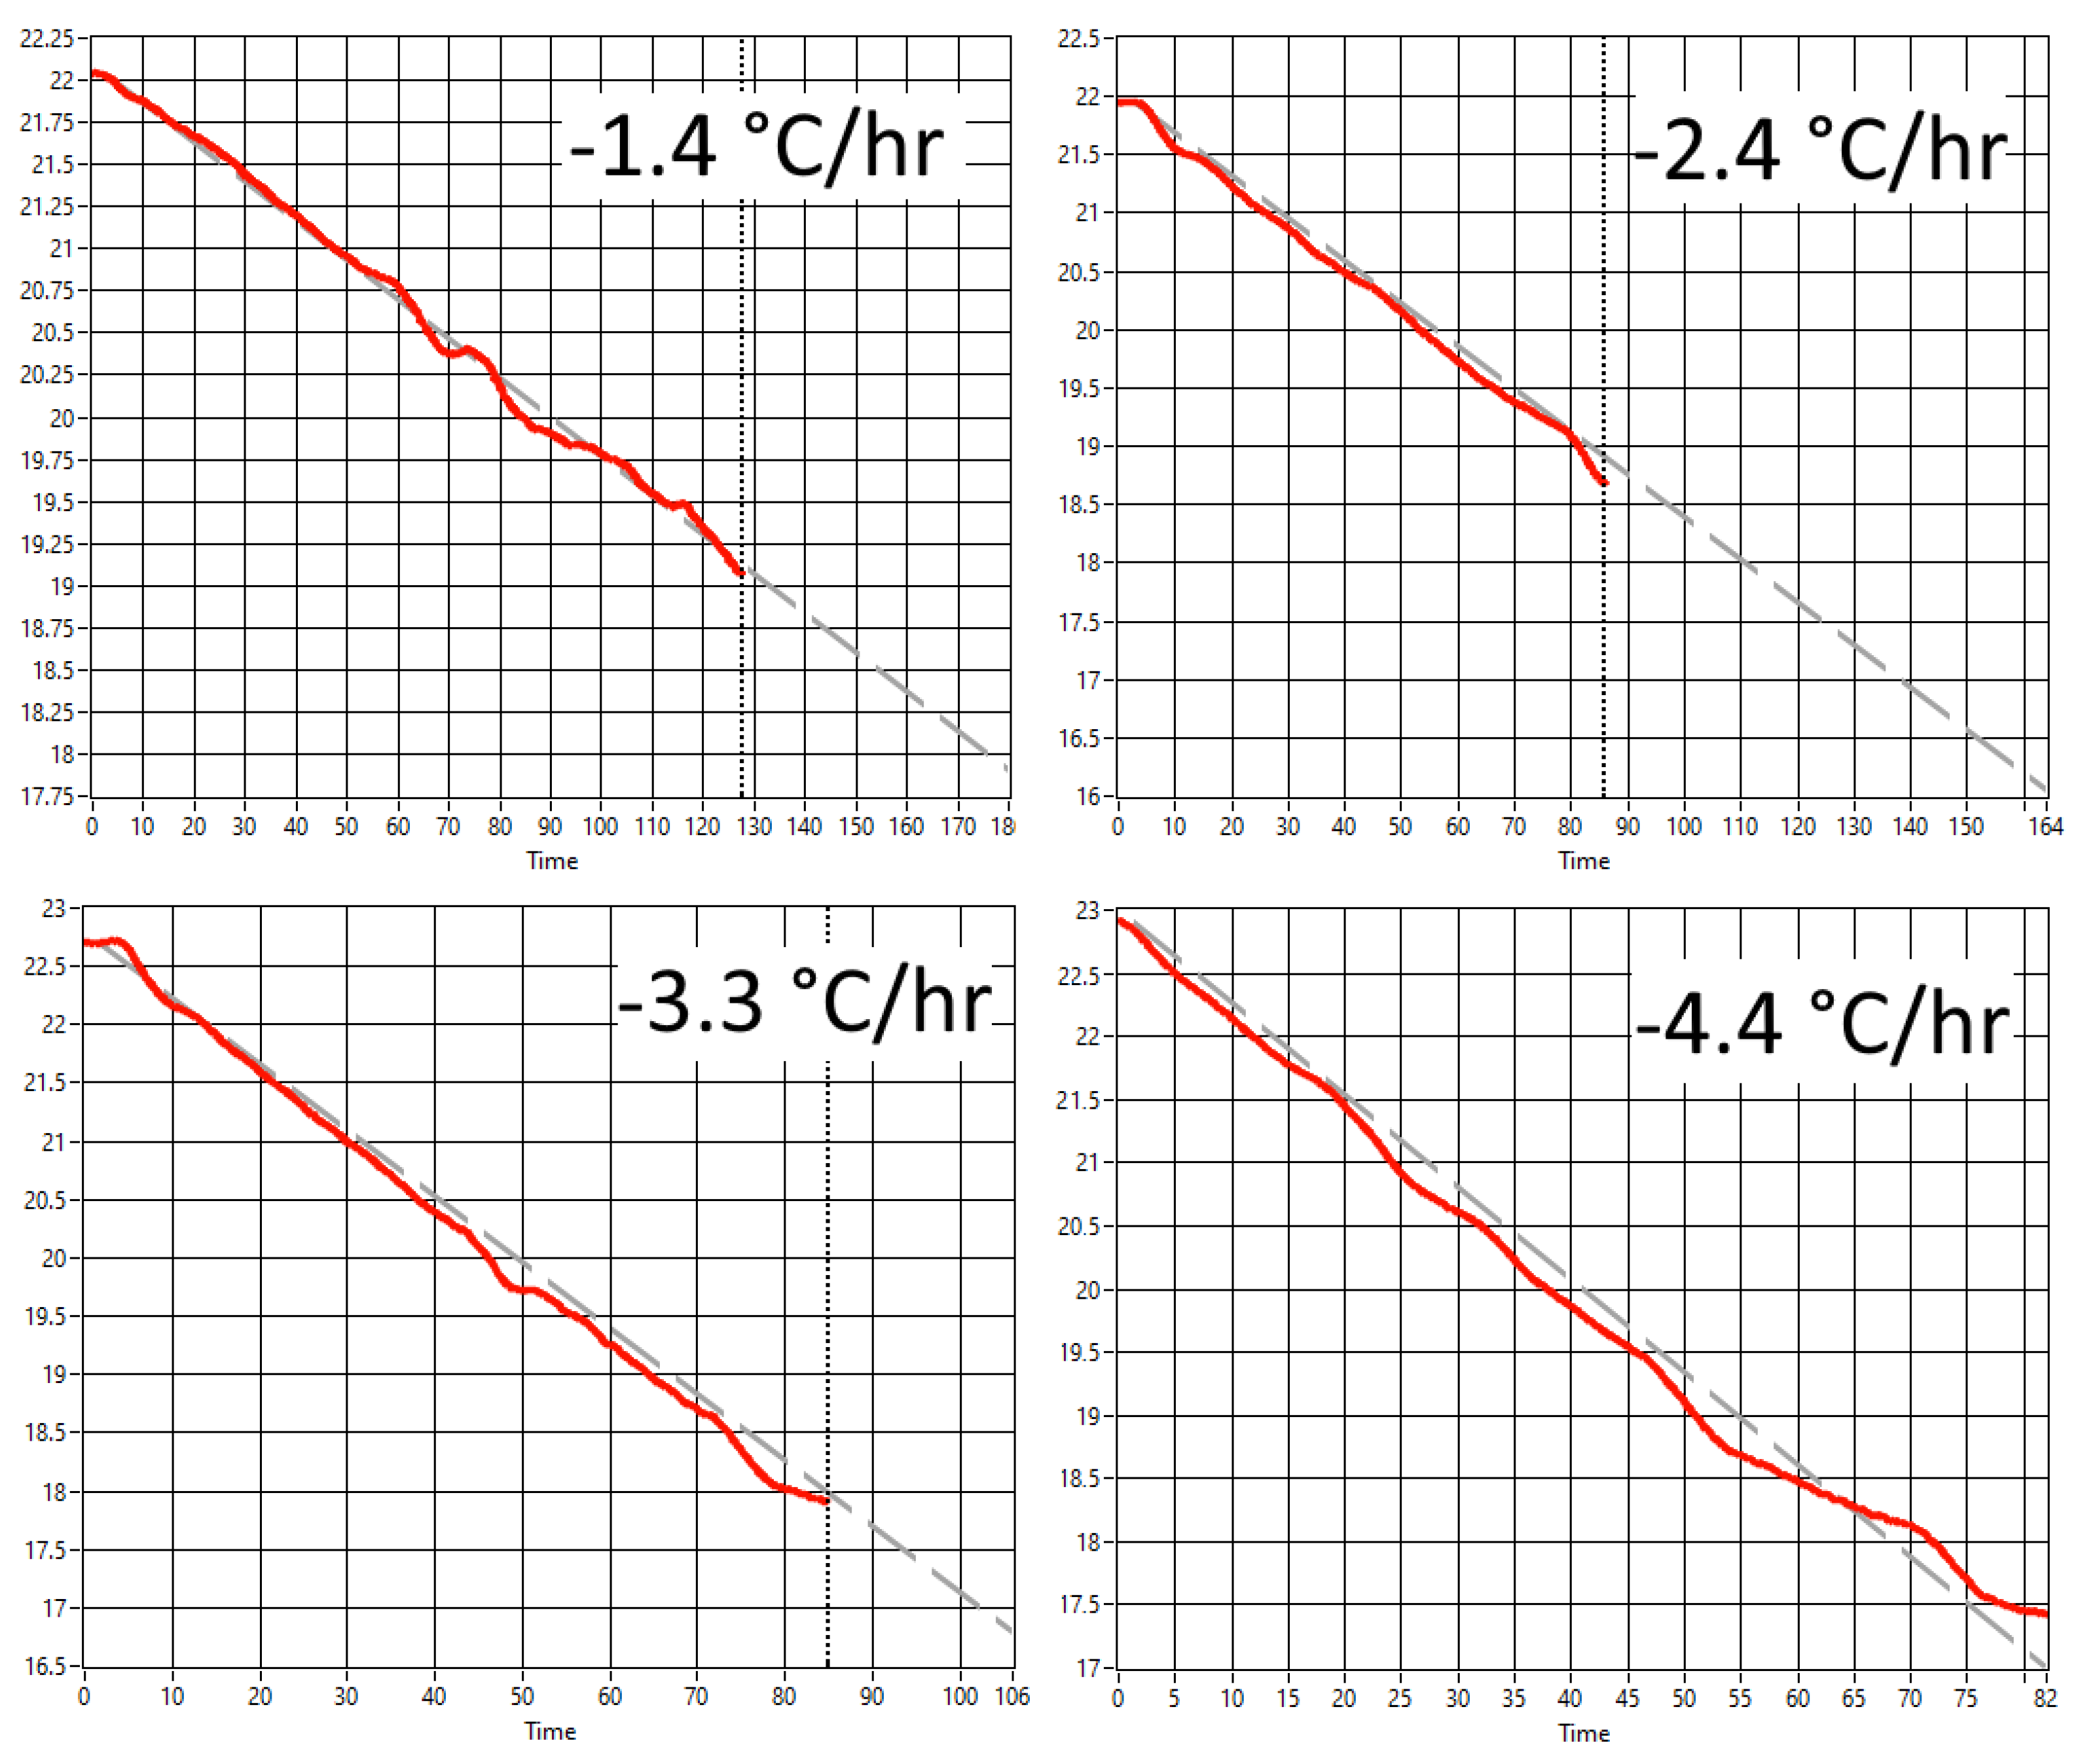
- cooling 1.4 ramp = −1.4 C per hour
- cooling 2.2 ramp = −2.2 C per hour
- cooling 3.4 ramp = −3.4 C per hour
- cooling 4.4 ramp = −4.4 C per hour
4.4. Temperature Ramps Implemented during Experiment
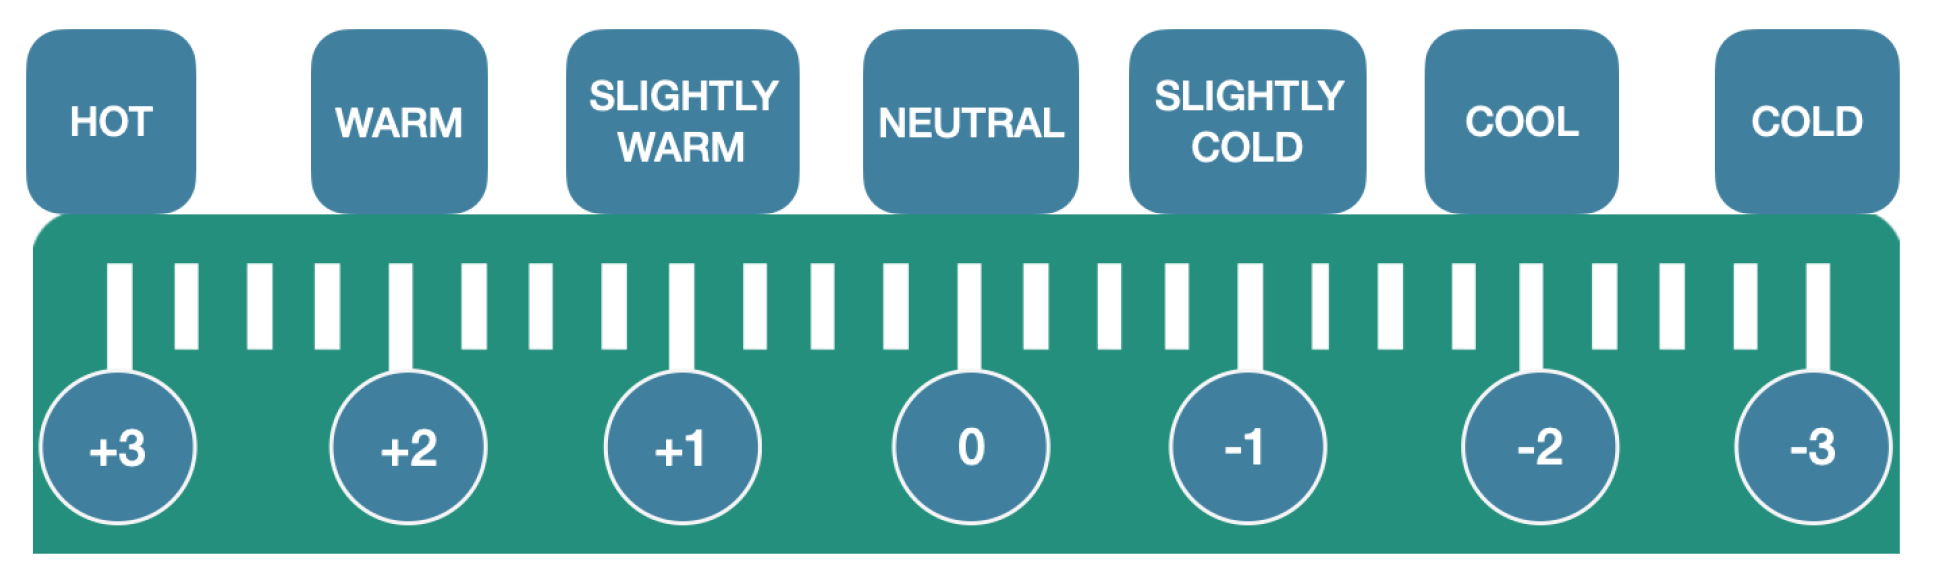
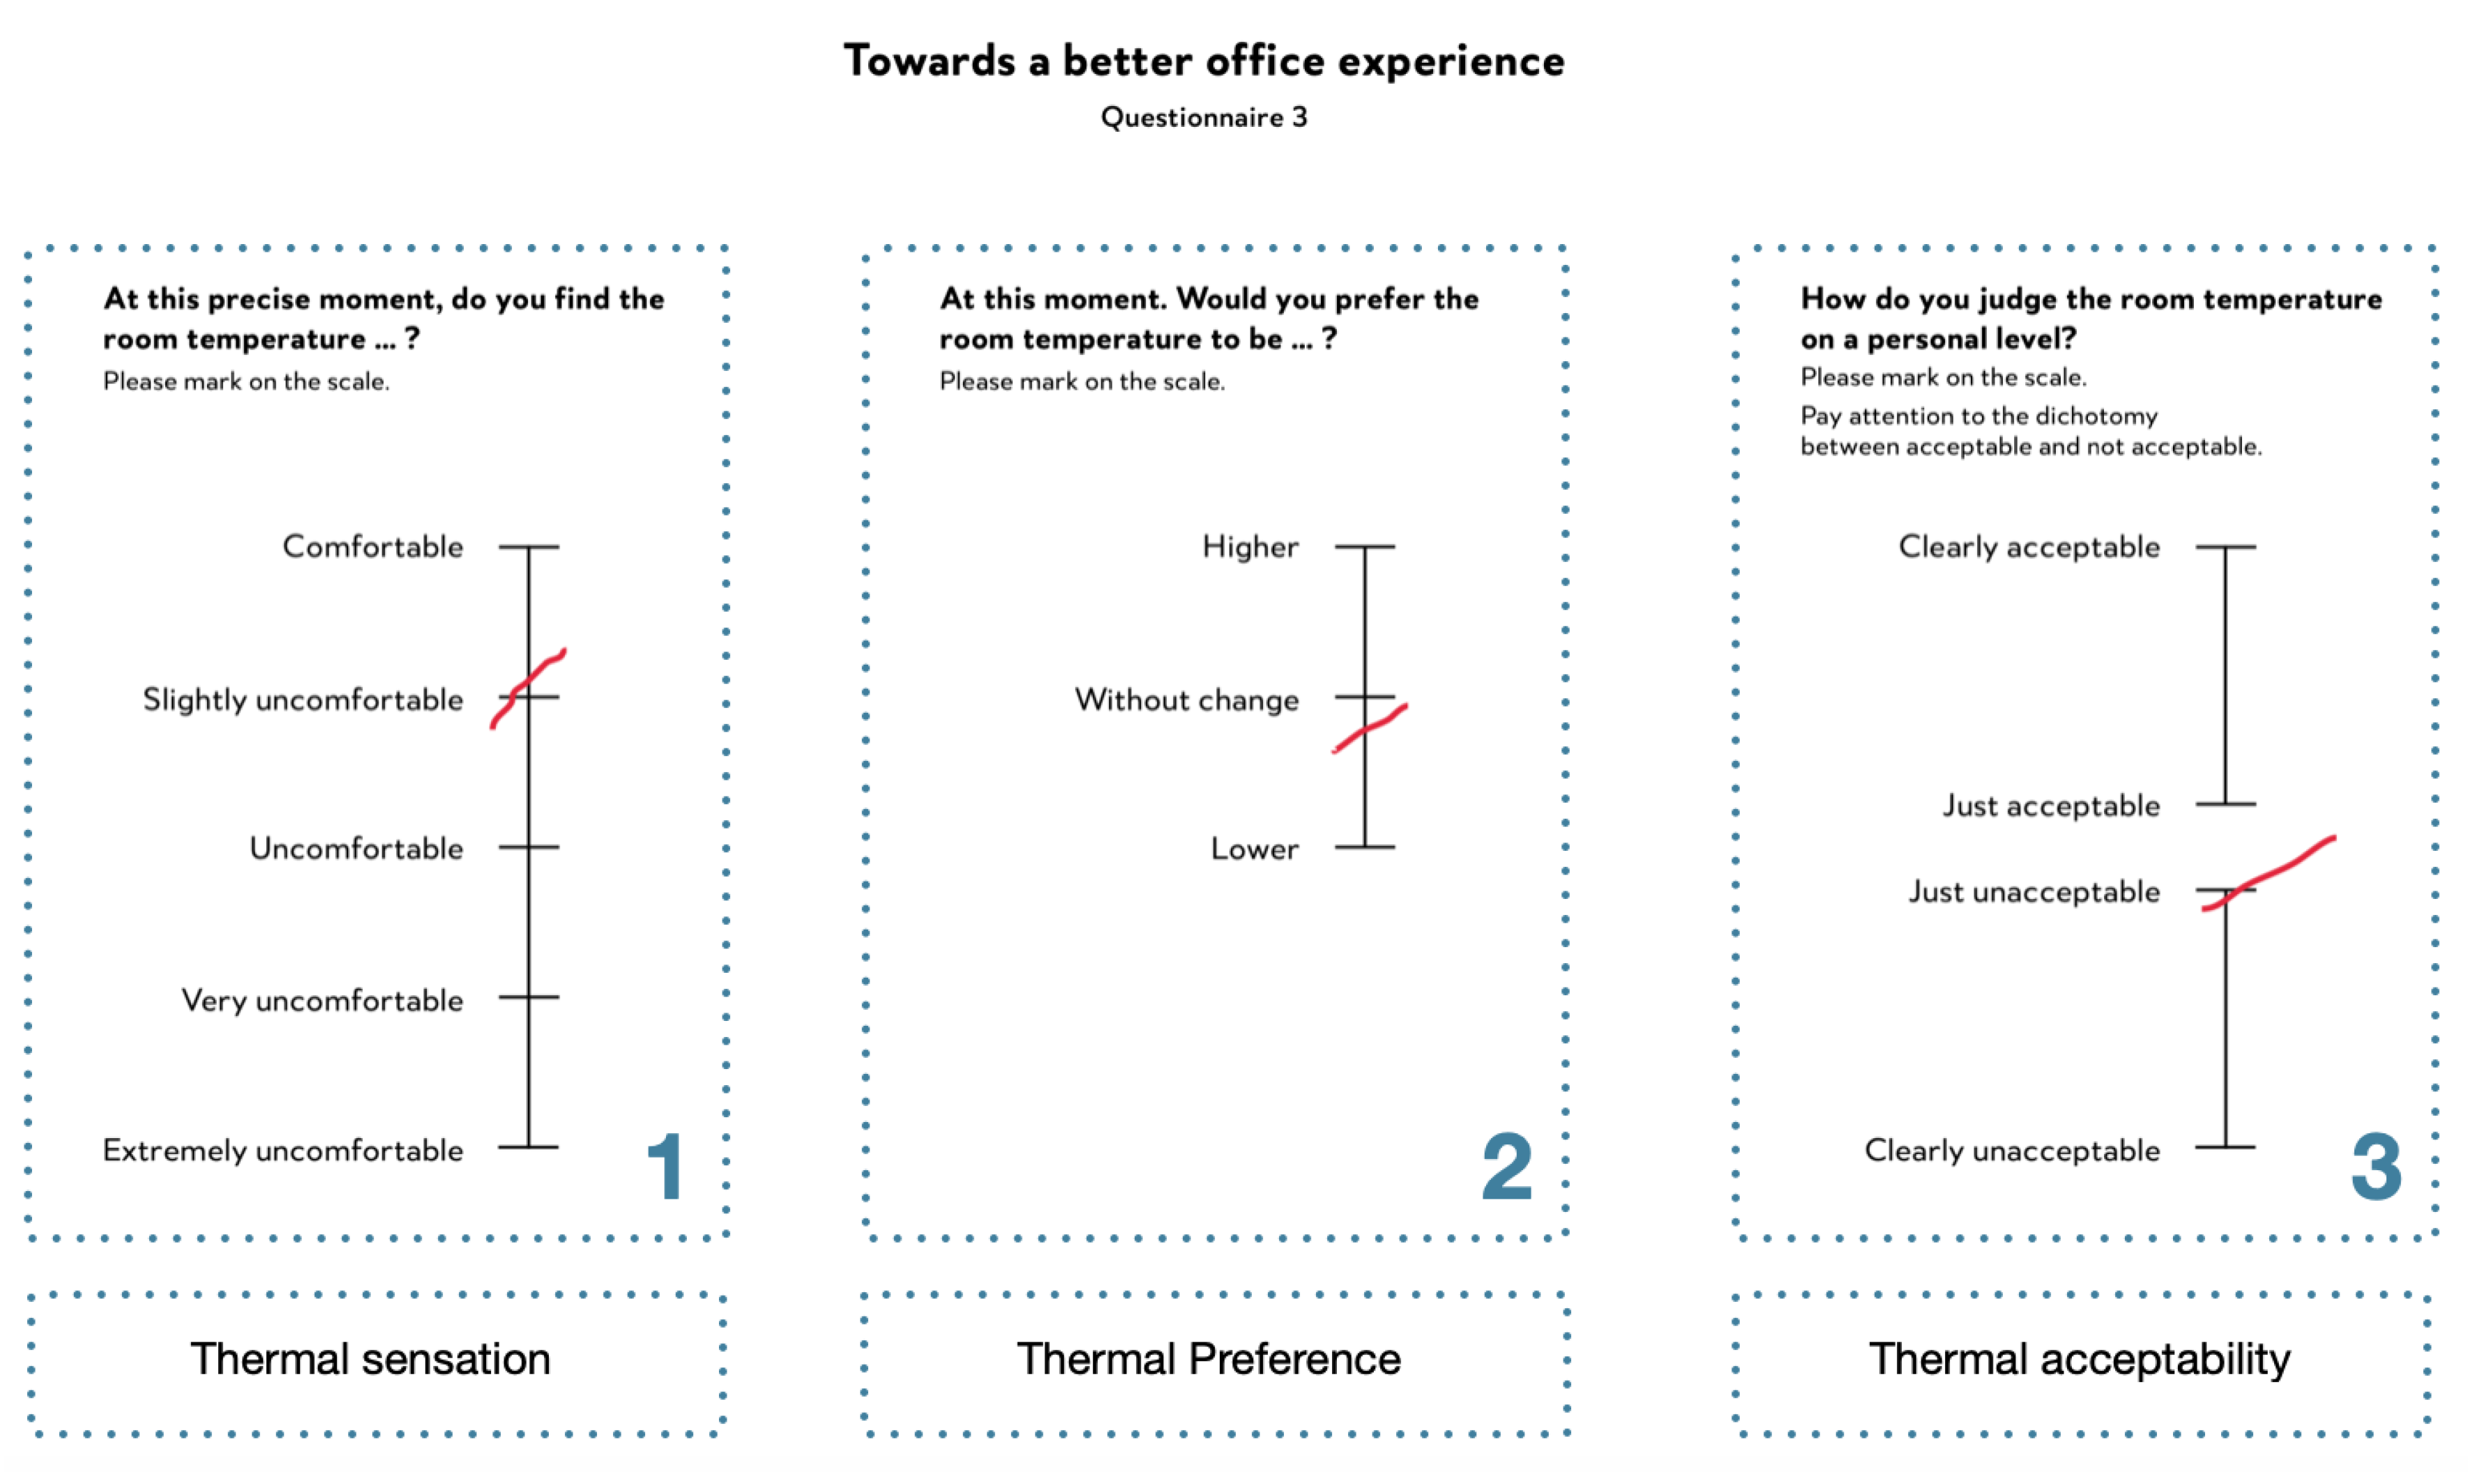
4.5. Comfort Evaluation and Survey Structures
4.6. Action Protocol
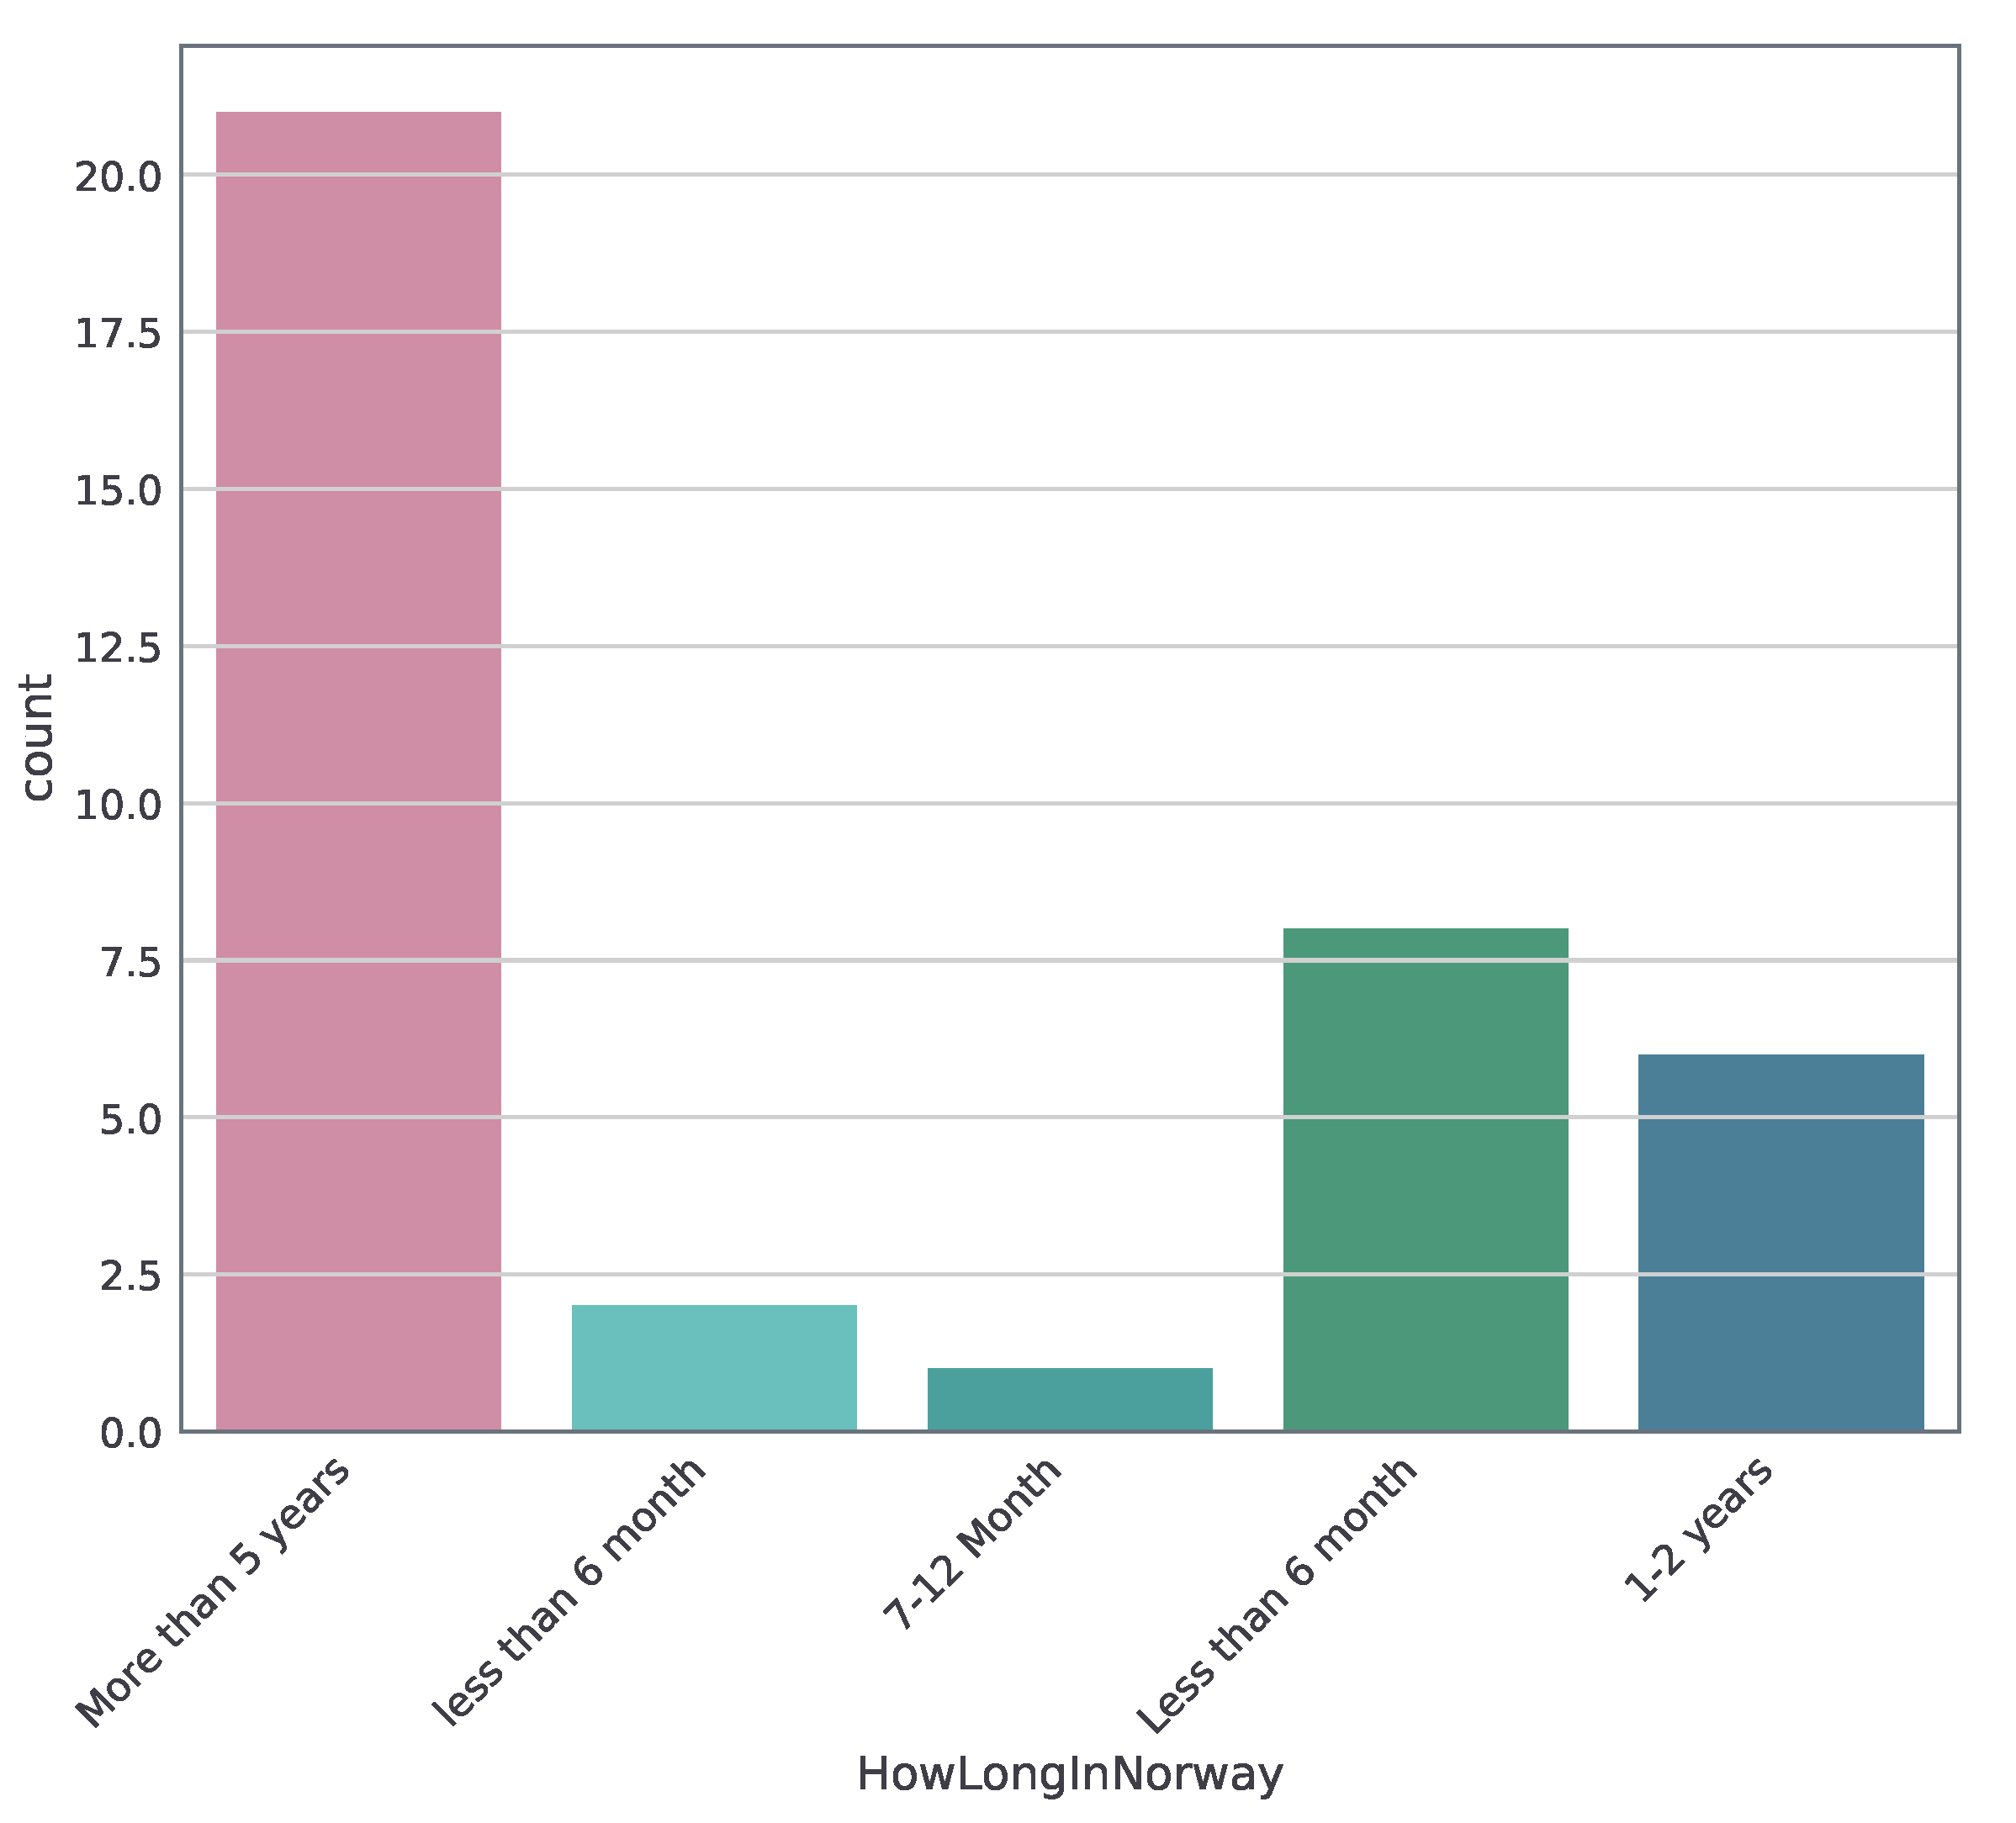
4.7. The Overview of Collected Data
- 20–30 years old—27 participants
- 30–40 years old—8 participants
- 40–50 years old—2 participants
- 60–70 years old—1 participant
5. Discussion
6. Conclusions
Author Contributions
Funding
Acknowledgments
Conflicts of Interest
Abbreviations
| ZEB | Zero Emission Building |
| IE | Indoor Environment |
| IEQ | Indoor Environmental Quality |
| ITC | Indoor Thermal Comfort |
| ASHRAE | The American Society of Heating, Refrigerating and Air-Conditioning Engineers |
| TC | Thermal Comfort |
| PMV | Predicted Mean Vote |
| PPD | Predicted Percentage of Dissatisfied |
| ISO | International Organization for Standardization |
| BMI | Body Mass Index |
| EEG | Electroencephalogram |
| ECG | Electrocardiogram |
| fEMG | Facial electromyography |
| FACS | Facial Action Coding System |
| AFC | Automatic Facial Coding |
| NTNU | Norwegian University of Science and Technology |
| NSD | Norwegian Center for Research Data |
| CLO | Clothing Insulation |
| cRIO | Compact real-time embedded industrial controller |
Appendix A


References
- Frontczak, M.; Schiavon, S.; Goins, J.; Arens, E.; Zhang, H.; Wargocki, P. Quantitative relationships between occupant satisfaction and satisfaction aspects of indoor environmental quality and building design. Indoor Air 2012, 22, 119–131. [Google Scholar] [CrossRef] [PubMed] [Green Version]
- Vischer, J.C. The concept of workplace performance and its value to managers. Calif. Manag. Rev. 2007, 49, 62–79. [Google Scholar] [CrossRef] [Green Version]
- Seppänen, O.A.; Fisk, W. Some quantitative relations between indoor environmental quality and work performance or health. HVAC R Res. 2006, 12, 957–973. [Google Scholar] [CrossRef] [Green Version]
- Baričič, A.; Salaj, A. The impact of office workspace on the satisfaction of employees and their overall health-research presentation. Zdravniški Vestnik 2014, 83, 217–231. [Google Scholar]
- Akimoto, T.; Tanabe, S.i.; Yanai, T.; Sasaki, M. Thermal comfort and productivity-Evaluation of workplace environment in a task conditioned office. Build. Environ. 2010, 45, 45–50. [Google Scholar] [CrossRef]
- Salaj, A.T. The synergetic effect of the observer on the built environment. Urbani Izziv 2005, 16, 163–167. [Google Scholar] [CrossRef]
- Jowkar, M.; Rijal, H.B.; Montazami, A.; Brusey, J.; Temeljotov-Salaj, A. The influence of acclimatization, age and gender-related differences on thermal perception in university buildings: Case studies in Scotland and England. Build. Environ. 2020, 106933. [Google Scholar] [CrossRef]
- Alfano, F.R.d.; Olesen, B.W.; Palella, B.I.; Riccio, G. Thermal comfort: Design and assessment for energy saving. Energy Build. 2014, 81, 326–336. [Google Scholar] [CrossRef]
- Allab, Y.; Pellegrino, M.; Guo, X.; Nefzaoui, E.; Kindinis, A. Energy and comfort assessment in educational building: Case study in a French university campus. Energy Build. 2017, 143, 202–219. [Google Scholar] [CrossRef]
- Homaei, S.; Hamdy, M. A robustness-based decision making approach for multi-target high performance buildings under uncertain scenarios. Appl. Energy 2020, 267, 114868. [Google Scholar] [CrossRef]
- Standard 55-2010. Thermal Environmental Conditions for Human Occupancy; American Society of Heating, Refrigerating, and Air-Conditioning Engineers (ASHRAE): Atlanta, GA, USA, 2010. [Google Scholar]
- Croitoru, C.; Nastase, I.; Bode, F.; Meslem, A.; Dogeanu, A. Thermal comfort models for indoor spaces and vehicles—Current capabilities and future perspectives. Renew. Sustain. Energy Rev. 2015, 44, 304–318. [Google Scholar] [CrossRef]
- Attia, S.; Hensen, J.L. Investigating the impact of different thermal comfort models for zero energy buildings in hot climates. In Proceedings of the 1st International Conference on Energy and Indoor Environment for Hot Climates, College Park, MD, USA, 24–26 February 2014. [Google Scholar]
- Humphreys, M.A.; Nicol, J.F.; Raja, I.A. Field studies of indoor thermal comfort and the progress of the adaptive approach. Adv. Build. Energy Res. 2007, 1, 55–88. [Google Scholar] [CrossRef]
- Fanger, P.O. Thermal Comfort. Analysis and Applications in Environmental Engineering; Danish Technical Press: Copenhagen, Denmark, 1970. [Google Scholar]
- Yang, L.; Yan, H.; Lam, J.C. Thermal comfort and building energy consumption implications—A review. Appl. Energy 2014, 115, 164–173. [Google Scholar] [CrossRef]
- ISO 7730. Ergonomics of the Thermal Environment. Analytical Determination and Interpretation of Thermal Comfort Using Calculation of the PMV and PPD Indices and Local Thermal Comfort Criteria; ISO: London, UK, 2005; p. 10. [Google Scholar]
- Sivaram, M.; Porkodi, V.; Mohammed, A.S.; Manikandan, V. Detection of Accurate Facial Detection Using Hybrid Deep Convolutional Recurrent Neural Network. ICTACT J. Soft Comput. 2019, 9. [Google Scholar] [CrossRef]
- Cheng, X.; Yang, B.; Tan, K.; Isaksson, E.; Li, L.; Hedman, A.; Olofsson, T.; Li, H. A Contactless Measuring Method of Skin Temperature based on the Skin Sensitivity Index and Deep Learning. Appl. Sci. 2019, 9, 1375. [Google Scholar] [CrossRef] [Green Version]
- Lopez, G.; Takahashi, K.; Nkurikiyeyezu, K.; Yokokubo, A. Development of a wearable thermo-conditioning device controlled by human factors based thermal comfort estimation. In Proceedings of the 2018 12th France-Japan and 10th Europe-Asia Congress on Mechatronics, Tsu, Japan, 10–12 September 2018; pp. 255–259. [Google Scholar]
- Wang, C.; Lee, H. Economical and Non-Invasive Residential Human Presence Sensing via Temperature Measurement. In Proceedings of the ASME 2018 International Mechanical Engineering Congress and Exposition, Pittsburgh, PA, USA, 9–15 November 2018. [Google Scholar]
- Gwak, J.; Shino, M.; Ueda, K.; Kamata, M. Effects of changes in the thermal factor on arousal level and thermal comfort. In Proceedings of the 2015 IEEE International Conference on Systems, Man, and Cybernetics, Kowloon, China, 9–12 October 2015; pp. 923–928. [Google Scholar]
- Li, W.; Zhang, J.; Zhao, T. Indoor thermal environment optimal control for thermal comfort and energy saving based on online monitoring of thermal sensation. Energy Build. 2019, 197, 57–67. [Google Scholar] [CrossRef]
- Vesely, M.; Zeiler, W. Fingertip temperature as a control signal for personalized heating. In Proceedings of the 13th International Conference on Indoor Air Quality and Climate (Indoor Air 2014), Hong Kong, China, 7–12 June 2014; pp. 464–470. [Google Scholar]
- Jin, Q.; Duanmu, L. Experimental study of thermal sensation and physiological response during step changes in non-uniform indoor environment. Sci. Technol. Built Environ. 2016, 22, 237–247. [Google Scholar] [CrossRef]
- Marchenko, A.; Temeljotov-Salaj, A. A Systematic Literature Review of Non-Invasive Indoor Thermal Discomfort Detection. Appl. Sci. 2020, 10, 4085. [Google Scholar] [CrossRef]
- Chaudhuri, T.; Zhai, D.; Soh, Y.C.; Li, H.; Xie, L.; Ou, X. Convolutional neural network and kernel methods for occupant thermal state detection using wearable technology. In Proceedings of the 2018 International Joint Conference on Neural Networks (IJCNN), Rio de Janeiro, Brazil, 8–13 July 2018; pp. 1–8. [Google Scholar]
- Cosma, A.C.; Simha, R. Machine learning method for real-time non-invasive prediction of individual thermal preference in transient conditions. Build. Environ. 2019, 148, 372–383. [Google Scholar] [CrossRef]
- Katić, K.; Li, R.; Verhaart, J.; Zeiler, W. Neural network based predictive control of personalized heating systems. Energy Build. 2018, 174, 199–213. [Google Scholar] [CrossRef]
- Li, D.; Menassa, C.C.; Kamat, V.R. Non-intrusive interpretation of human thermal comfort through analysis of facial infrared thermography. Energy Build. 2018, 176, 246–261. [Google Scholar] [CrossRef]
- Lu, S.; Wang, W.; Wang, S.; Cochran Hameen, E. Thermal Comfort-Based Personalized Models with Non-Intrusive Sensing Technique in Office Buildings. Appl. Sci. 2019, 9, 1768. [Google Scholar] [CrossRef] [Green Version]
- Meyer, B.U.; Werhahn, K.; Rothwell, J.; Roericht, S.; Fauth, C. Functional organisation of corticonuclear pathways to motoneurones of lower facial muscles in man. Exp. Brain Res. 1994, 101, 465–472. [Google Scholar] [CrossRef] [PubMed]
- Nordstrom, M.A.; Miles, T.S.; Gooden, B.R.; Butler, S.L.; Ridding, M.C.; Thompson, P.D. Motor cortical control of human masticatory muscles. In Progress in Brain Research; Elsevier: Amsterdam, The Netherlands, 1999; Volume 123, pp. 203–214. [Google Scholar]
- Fischer, U.; Hess, C.W.; Rösler, K.M. Uncrossed cortico-muscular projections in humans are abundant to facial muscles of the upper and lower face, but may differ between sexes. J. Neurol. 2005, 252, 21–26. [Google Scholar] [CrossRef] [Green Version]
- Yildiz, N.; Ertekin, C.; Ozdemirkıran, T.; Yildiz, S.K.; Aydogdu, I.; Uludag, B.; Secil, Y. Corticonuclear innervation to facial muscles in normal controls and in patients with central facial paresis. J. Neurol. 2005, 252, 429–435. [Google Scholar] [CrossRef]
- Farnsworth, B. EEG (Electroencephalography): The Complete Pocket Guide; Global HQ: Copenhagen, Denmark, 2019. [Google Scholar]
- Forgas, J.P.; Williams, K.D.; Laham, S.M.; Von Hippel, W.; Durik, A.M.; Barron, K.E.; Pyszcymski, T.; Greenberg, J.; Solomon, S.; Wood, W.; et al. Social Motivation: Conscious and Unconscious Processes; Cambridge University Press: Cambridge, UK, 2005; Volume 5. [Google Scholar]
- Coles, N.; March, D.; Marmolejo-Ramos, F.; Banaruee, H.; Butcher, N.; Cavallet, M.; Gorbunova, E. A Multi-Lab Test of the Facial Feedback Hypothesis by the Many Smiles Collaboration. 2019. Available online: https://psyarxiv.com/cvpuw?fbclid=IwAR06oqW6rhP6VRPIZkvZk7dPuava8gUE5DcVrqgHYtdVWLSwPgcICtBZ20E (accessed on 20 February 2020).
- Bless, H.; Bohner, G.; Schwarz, N.; Strack, F. Mood and persuasion: A cognitive response analysis. Personal. Soc. Psychol. Bull. 1990, 16, 331–345. [Google Scholar] [CrossRef]
- Strack, F. From Data to Truth in Psychological Science. A Personal Perspective. Front. Psychol. 2017, 8, 702. [Google Scholar] [CrossRef] [Green Version]
- Strack, F.; Martin, L.L.; Stepper, S. Inhibiting and facilitating conditions of the human smile: A nonobtrusive test of the facial feedback hypothesis. J. Personal. Soc. Psychol. 1988, 54, 768. [Google Scholar] [CrossRef]
- Coles, N.A.; March, D.S.; Marmolejo-Ramos, F.; Banaruee, H.; Butcher, N.; Cavallet, M.; Dagaev, N.; Eaves, D.; Foroni, F.; Gorbunova, E.; et al. The Many Smiles Collaboration: A Multi-Lab Foundational Test of the Facial Feedback Hypothesis. Nat. Hum. Behav. 2020. [Google Scholar] [CrossRef]
- Wilson, P.I.; Fernandez, J. Facial feature detection using Haar classifiers. J. Comput. Sci. Colleges 2006, 21, 127–133. [Google Scholar]
- Abbs, J.H.; Gracco, V.L.; Blair, C. Functional muscle partitioning during voluntary movement: Facial muscle activity for speech. Exp. Neurol. 1984, 85, 469–479. [Google Scholar] [CrossRef]
- Ekman, P.; Friesen, W.V. Measuring facial movement. Environ. Psychol. Nonverbal Behav. 1976, 1, 56–75. [Google Scholar] [CrossRef]
- Wolf, K. Measuring facial expression of emotion. Dialog. Clin. Neurosci. 2015, 17, 457. [Google Scholar]
- Bartlett, M.S.; Hager, J.C.; Ekman, P.; Sejnowski, T.J. Measuring facial expressions by computer image analysis. Psychophysiology 1999, 36, 253–263. [Google Scholar] [CrossRef] [PubMed]
- Cohn, J.F.; Ekman, P. Measuring Facial Action; Oxford University Press: Oxford, UK, 2005. [Google Scholar]
- Ekman, P. Methods for measuring facial action. In Handbook of Methods in Nonverbal Behavior Research; Cambridge University Press: Cambridge, UK, 1982; pp. 45–90. [Google Scholar]
- Ekman, P.; Freisen, W.V.; Ancoli, S. Facial signs of emotional experience. J. Personal. Soc. Psychol. 1980, 39, 1125. [Google Scholar] [CrossRef] [Green Version]
- Hager, J.C. A comparison of units for visually measuring facial actions. Behav. Res. Methods Instrum. Comput. 1985, 17, 450–468. [Google Scholar] [CrossRef] [Green Version]
- Ekman, R. What the Face Reveals: Basic and Applied Studies of Spontaneous Expression Using the Facial Action Coding System (FACS); Oxford University Press: Oxford, MI, USA, 1997. [Google Scholar]
- Zhang, Z.; Luo, P.; Loy, C.C.; Tang, X. Facial Landmark Detection by Deep Multi-Task Learning; European Conference on Computer Vision; Springer: Berlin, Germany, 2014; pp. 94–108. [Google Scholar]
- Segundo, M.P.; Silva, L.; Bellon, O.R.P.; Queirolo, C.C. Automatic face segmentation and facial landmark detection in range images. IEEE Trans. Syst. Man Cybern. Part B Cybern. 2010, 40, 1319–1330. [Google Scholar] [CrossRef]
- Xiao, S.; Feng, J.; Xing, J.; Lai, H.; Yan, S.; Kassim, A. Robust Facial Landmark Detection via Recurrent Attentive-Refinement Networks; European Conference on Computer Vision; Springer: Berlin, Germany, 2016; pp. 57–72. [Google Scholar]
- Wu, Y.; Hassner, T.; Kim, K.; Medioni, G.; Natarajan, P. Facial landmark detection with tweaked convolutional neural networks. IEEE Trans. Pattern Anal. Mach. Intell. 2017, 40, 3067–3074. [Google Scholar] [CrossRef] [Green Version]
- Creswell, J. Research Design; SAGE Publication Inc.: Lincoln, NE, USA, 2012. [Google Scholar]
- Peckham, P.D.; Glass, G.V.; Hopkins, K.D. The experimental unit in statistical analysis. J. Spec. Educ. 1969, 3, 337–349. [Google Scholar] [CrossRef]
- Dimberg, U.; Lundquist, L.O. Gender differences in facial reactions to facial expressions. Biol. Psychol. 1990, 30, 151–159. [Google Scholar] [CrossRef]
- McDuff, D.; Kodra, E.; Kaliouby, R.E.; LaFrance, M. A large-scale analysis of sex differences in facial expressions. PLoS ONE 2017, 12, e0173942. [Google Scholar] [CrossRef] [Green Version]
- Ueda, M.; Taniguchi, Y.; Aoki, H. A new method to predict the thermal sensation of an occupant using a neural network and its application to the automobile HVAC system. JSME Int. J. Ser. B Fluids Therm. Eng. 1997, 40, 166–174. [Google Scholar] [CrossRef] [Green Version]
- Cheng, X.; Yang, B.; Olofsson, T.; Liu, G.; Li, H. A pilot study of online non-invasive measuring technology based on video magnification to determine skin temperature. Build. Environ. 2017, 121, 1–10. [Google Scholar] [CrossRef]
- Ueda, M.; Taniguchi, Y.; Asano, A.; Mochizuki, M.; Ikegami, T.; Kawai, T. An automobile heating, ventilating and air conditioning (HVAC) system with a neural network for controlling the thermal sensations felt by a passenger. JSME Int. J. Ser. B Fluids Therm. Eng. 1997, 40, 469–477. [Google Scholar] [CrossRef] [Green Version]
- Matalucci, B.; Phillips, K.; Walf, A.A.; Dyson, A.; Draper, J. An experimental design framework for the personalization of indoor microclimates through feedback loops between responsive thermal systems and occupant biometrics. Int. J. Arch. Comput. 2017, 15, 54–69. [Google Scholar] [CrossRef]
- Bermejo, P.; Redondo, L.; de la Ossa, L.; Rodríguez, D.; Flores, J.; Urea, C.; Gámez, J.A.; Puerta, J.M. Design and simulation of a thermal comfort adaptive system based on fuzzy logic and on-line learning. Energy Build. 2012, 49, 367–379. [Google Scholar] [CrossRef]
- Lee, H.M.; Cho, C.K.; Yun, M.H.; Lee, M.W. Development of a temperature control procedure for a room air-conditioner using the concept of just noticeable difference (JND) in thermal sensation. Int. J. Ind. Ergon. 1998, 22, 207–216. [Google Scholar] [CrossRef]
- Lopez, G.; Tokuda, T.; Isoyama, N.; Hosaka, H.; Itao, K. Development of a wrist-band type device for low-energy consumption and personalized thermal comfort. In Proceedings of the 2016 11th France-Japan & 9th Europe-Asia Congress on Mechatronics (MECATRONICS)/17th International Conference on Research and Education in Mechatronics (REM), Compiegne, France, 15–17 June 2016; pp. 209–212. [Google Scholar]
- Zhai, D.; Chaudhuri, T.; Soh, Y.C. Energy efficiency improvement with k-means approach to thermal comfort for ACMV systems of smart buildings. In Proceedings of the 2017 Asian Conference on Energy, Power and Transportation Electrification (ACEPT), Singapor, 24–26 October 2017; pp. 1–6. [Google Scholar]
- Ghahramani, A.; Castro, G.; Becerik-Gerber, B.; Yu, X. Infrared thermography of human face for monitoring thermoregulation performance and estimating personal thermal comfort. Build. Environ. 2016, 109, 1–11. [Google Scholar] [CrossRef] [Green Version]
- Salamone, F.; Belussi, L.; Currò, C.; Danza, L.; Ghellere, M.; Guazzi, G.; Lenzi, B.; Megale, V.; Meroni, I. Integrated method for personal thermal comfort assessment and optimization through users’ feedback, IoT and machine learning: A case study. Sensors 2018, 18, 1602. [Google Scholar] [CrossRef] [Green Version]
- Chaudhuri, T.; Zhai, D.; Soh, Y.C.; Li, H.; Xie, L. Random forest based thermal comfort prediction from gender-specific physiological parameters using wearable sensing technology. Energy Build. 2018, 166, 391–406. [Google Scholar] [CrossRef]
- Pavlin, B.; Pernigotto, G.; Cappelletti, F.; Bison, P.; Vidoni, R.; Gasparella, A. Real-time monitoring of occupants’ thermal comfort through infrared imaging: A preliminary study. Buildings 2017, 7, 10. [Google Scholar] [CrossRef]
- Yang, Y.; Wu, W.; Fang, Q.; Zhu, X.; Zhang, R.; Wang, M. Research on Human Thermal Comfort Model Based on Multiple Physiological Parameters. In International Conference on Smart City and Intelligent Building; Springer: Berlin, Germany, 2018; pp. 11–21. [Google Scholar]
- Choi, J.H.; Yeom, D. Study of data-driven thermal sensation prediction model as a function of local body skin temperatures in a built environment. Build. Environ. 2017, 121, 130–147. [Google Scholar] [CrossRef]
- Barrios, L.; Kleiminger, W. The Comfstat-automatically sensing thermal comfort for smart thermostats. In Proceedings of the 2017 IEEE International Conference on Pervasive Computing and Communications (PerCom), Kona, HI, USA, 13–17 March 2017; pp. 257–266. [Google Scholar]
- Cosma, A.C.; Simha, R. Thermal comfort modeling in transient conditions using real-time local body temperature extraction with a thermographic camera. Build. Environ. 2018, 143, 36–47. [Google Scholar] [CrossRef]
- Ghahramani, A.; Castro, G.; Karvigh, S.A.; Becerik-Gerber, B. Towards unsupervised learning of thermal comfort using infrared thermography. Appl. Energy 2018, 211, 41–49. [Google Scholar] [CrossRef] [Green Version]
- Burzo, M.; Abouelenien, M.; Pérez-Rosas, V.; Wicaksono, C.; Tao, Y.; Mihalcea, R. Using infrared thermography and biosensors to detect thermal discomfort in a building’s inhabitants. In Proceedings of the ASME International Mechanical Engineering Congress and Exposition, Montreal, QC, Canada, 14–20 November 2014; Volume 46521, p. V06BT07A015. [Google Scholar]
- Cattarin, G.; Pagliano, L.; Causone, F.; Kindinis, A.; Goia, F.; Carlucci, S.; Schlemminger, C. Empirical validation and local sensitivity analysis of a lumped-parameter thermal model of an outdoor test cell. Build. Environ. 2018, 130, 151–161. [Google Scholar] [CrossRef] [Green Version]
- Degtyarev, N.; Seredin, O. Comparative testing of face detection algorithms. In International Conference on Image and Signal Processing; Springer: Berlin, Germany, 2010; pp. 200–209. [Google Scholar]
- Morency, L.P.; Sidner, C.; Lee, C.; Darrell, T. Head gestures for perceptual interfaces: The role of context in improving recognition. Artif. Intell. 2007, 171, 568–585. [Google Scholar] [CrossRef] [Green Version]
- Hakeem, A.; Shah, M. Learning, detection and representation of multi-agent events in videos. Artif. Intell. 2007, 171, 586–605. [Google Scholar] [CrossRef] [Green Version]
- Förster, J.; Strack, F. Motor actions in retrieval of valenced information: A motor congruence effect. Percept. Mot. Skills 1997, 85, 1419–1427. [Google Scholar] [CrossRef]
- Donato, G.; Bartlett, M.S.; Hager, J.C.; Ekman, P.; Sejnowski, T.J. Classifying facial actions. IEEE Trans. Pattern Anal. Mach. Intell. 1999, 21, 974–989. [Google Scholar] [CrossRef] [Green Version]
- Zhang, Y.; Wang, J.; Chen, H.; Zhang, J.; Meng, Q. Thermal comfort in naturally ventilated buildings in hot-humid area of China. Build. Environ. 2010, 45, 2562–2570. [Google Scholar] [CrossRef]
- Lu, S.; Cochran Hameen, E. Integrated IR Vision Sensor for Online Clothing Insulation Measurement; In Proceedings of the 23rd Annual Conference of the Association for Computer-Aided Architectural Design Research in Asia, 2018; Tsinghua University, Beijing, China; 2018; Volume 1.
- Banire, B.; Al Thani, D.; Qaraqe, M.; Mansoor, B.; Makki, M. Impact of mainstream classroom setting on attention of children with autism spectrum disorder: An eye-tracking study. Univers. Access Inf. Soc. 2020, 1–11. [Google Scholar] [CrossRef]
- Jo, C.W.; Chae, Y.H.; Seong, P.H. Performance Estimation using Deep Learning Based Facial Expression Analysis. Presented at Transactions of the Korean Nuclear Society Virtual Spring Meeting, Knoxville, TN, USA, 9–10 July 2020. [Google Scholar]
- Charlie, M.K.X.J.W.D. Determining Consumer Preferences for Floral Design Elements. Ph.D. Thesis, Department of Agricultural Economics, Texas A&M University, College Station, TX, USA.
- Thomsen, M.; Heiselberg, L. Arousing the audience: The two-peak structure of drama film trailers. J. Scand. Cinema 2020, 10, 45–65. [Google Scholar] [CrossRef]
- Gero, J.S.; Milovanovic, J. A framework for studying design thinking through measuring designers’ minds, bodies and brains. Des. Sci. 2020, 6, e19. [Google Scholar] [CrossRef]


| Method | Benefits | Limitations |
|---|---|---|
| fEMG | non-invasive method | needs electrodes and other equipment |
| has no language dependency | electrode placement may contribute to experiment subject awareness regarding measurements being collected | |
| doesn’t require cognitive effort | sensitive to motions | |
| able to measure even subtle facial muscle activity | analysis is expensive because it can only be performed by a specialist with biosensor processing skills | |
| FACS | very reliable | requires high quality video resolution |
| non-intrusive | requires a trained expert to perform score evaluation | |
| contains a 5 step intensity rating | expensive with respect to the time needed for expert video processing | |
| AFC | reliable | requires high quality video resolution |
| non-invasive | requires acomputer vision specialist who is also familiar with FACS | |
| easy to use | requires a number of pre- and post-processing stages |
| Reference: | Publication Type | Year | Number of People | Age |
|---|---|---|---|---|
| Cheng et al. [19] | Journal article | 2019 | 16 | 20–29 |
| Ueda et al. [61] | Journal article | 1997 | 62 | 22–36 |
| Cheng et al. [62] | Journal article | 2017 | 16 | 20–29 |
| Ueda et al. [63] | Journal article | 1997 | 11 | 29–41 |
| Matalucci et al. [64] | Journal article | 2017 | 12 | 18–36 |
| Chaudhuri et al. [27] | Conference Paper | 2018 | 20 | 21–25 |
| Bermejo et al. [65] | Journal article | 2012 | 3 | NaN |
| Lee et al. [66] | Journal article | 1998 | 13 | NaN |
| Lopez et al. [20] | Conference Paper | 2018 | 1 | NaN |
| Lopez et al. [67] | Conference Paper | 2016 | 5 | 20–29 |
| Zhai et al. [68] | Conference Paper | 2017 | 20 | 21–26 |
| Vesely and Zeiler [24] | Conference Paper | 2014 | 6 | NaN |
| Li et al. [23] | Journal article | 2019 | 10 | NaN |
| Ghahramani et al. [69] | Journal article | 2016 | 15 | NaN |
| Salamone et al. [70] | Journal article | 2018 | 8 | 33–61 |
| Cosma and Simha [28] | Journal article | 2019 | 24 | NaN |
| Katić et al. [29] | Journal article | 2018 | 2 | 29 |
| Li et al. [30] | Journal article | 2018 | 12 | 22–27 |
| Chaudhuri et al. [71] | Journal article | 2018 | 20 | 21–25 |
| Pavlin et al. [72] | Journal article | 2017 | 10 | 27–28 |
| Yang et al. [73] | Conference Paper | 2019 | 22 | 23–26 |
| Choi and Yeom [74] | Journal article | 2017 | 15 | 30–39 |
| Barrios and Kleiminger [75] | Conference Paper | 2017 | 7 | 23–30 |
| Cosma and Simha [76] | Journal article | 2018 | 30 | 20–42 |
| Lu et al. [31] | Journal article | 2019 | 2 | NaN |
| Ghahramani et al. [77] | Journal article | 2018 | 10 | NaN |
| Burzo et al. [78] | Conference Paper | 2014 | 14 | 22–35 |
| Time | Procedure | Comments |
|---|---|---|
| 8:30 | Participants are expected to arrive. They are invited to the acclimatization area, asked to take off non-needed clothes i.e., jacket (it will be saved in special space during experiment). | Participants should not adjust their clothes during the experiment. |
| 8:35 | Instructions will be provided to participants. Afterwards they need to sign a consent form. IMPORTANT: Participants should NOT take part in the experiment if they do not agree to sign the consent form. | |
| 8:55 | Survey is handed out to experiment participants. They have 5 min to fill in answers. In case they do not fill in all of the questions—they can take the survey to the experiment room and finalize it there. Afterwards, the survey should be placed on the corner of the desk. | |
| 9:00 | Start of the experiment. Participant asked to get inside test room and start to work on his/her regular tasks. During given period it is not allowed to change clothes, open windows or walk around the room. Participant should be allocated within given experiment space. | Participants should use adjustment (discomfort) BUTTON which is situated at their tables to indicate event of discomfort. |
| 12:30 | Lunch brake. Opportunity to drink coffee will be provided. Participant can leave test space for 1 hour. During this time, window in the room will be opened to provide fresh air, completed questionnaires will be collected. It is forbidden to perform sport activities or do any other actions which increase heart rate (e.g., running, jumping or smoking). | During this period, a new study should be generated with unique ID since some participants would stay for only half of the day and a new person would arrive for the afternoon. |
| 13:30 | Lunch brake is over. Opportunity to take one cup of coffee with you and return to the test cell. It is important that person’s don’t forget to visit the WC before the experiment starts to avoid interruptions. | Participants should use the adjustment (discomfort) BUTTON which is located at their tables to indicate an event of discomfort. |
| 16:30 | The end of the experiment, opportunity to drink more coffee, finalize surveys and agree on the schedule for the next meeting. Person should not lose code which was assigned to the participant at the beginning of the experiment | All collected data within a given day of experiment should be collected on the hard drive and backup files should be generated. |
| Physical Feature | 1st Place | 2nd Place | 3rd Place |
|---|---|---|---|
| ViewFromTheWindows | 2 | 0 | 0 |
| AcousticComfort | 6 | 11 | 6 |
| OfficeLayout | 1 | 1 | 2 |
| VisualComfort | 4 | 4 | 5 |
| AirQuality | 14 | 7 | 7 |
| Cleanliness | 2 | 1 | 4 |
| ThermalComfort | 15 | 10 | 5 |
| Privacy | 3 | 1 | 5 |
Publisher’s Note: MDPI stays neutral with regard to jurisdictional claims in published maps and institutional affiliations. |
© 2020 by the authors. Licensee MDPI, Basel, Switzerland. This article is an open access article distributed under the terms and conditions of the Creative Commons Attribution (CC BY) license (http://creativecommons.org/licenses/by/4.0/).
Share and Cite
Marchenko, A.; Temeljotov-Salaj, A.; Rizzardi, V.; Oksavik, O. The Study of Facial Muscle Movements for Non-Invasive Thermal Discomfort Detection via Bio-Sensing Technology. Part I: Development of the Experimental Design and Description of the Collected Data. Appl. Sci. 2020, 10, 7315. https://doi.org/10.3390/app10207315
Marchenko A, Temeljotov-Salaj A, Rizzardi V, Oksavik O. The Study of Facial Muscle Movements for Non-Invasive Thermal Discomfort Detection via Bio-Sensing Technology. Part I: Development of the Experimental Design and Description of the Collected Data. Applied Sciences. 2020; 10(20):7315. https://doi.org/10.3390/app10207315
Chicago/Turabian StyleMarchenko, Alla, Alenka Temeljotov-Salaj, Victor Rizzardi, and Odne Oksavik. 2020. "The Study of Facial Muscle Movements for Non-Invasive Thermal Discomfort Detection via Bio-Sensing Technology. Part I: Development of the Experimental Design and Description of the Collected Data" Applied Sciences 10, no. 20: 7315. https://doi.org/10.3390/app10207315