Exploring the Function of Ion-Exchange Membrane in Membrane Capacitive Deionization via a Fully Coupled Two-Dimensional Process Model


1
Department of Chemical Engineering, Texas Tech University, Lubbock, TX 79409-3121, USA
2
Department of Civil, Environmental, and Construction Engineering, Texas Tech University, Lubbock, TX 79409-1023, USA
*
Author to whom correspondence should be addressed.
Processes 2020, 8(10), 1312; https://doi.org/10.3390/pr8101312
Submission received: 13 September 2020
/
Revised: 12 October 2020
/
Accepted: 16 October 2020
/
Published: 19 October 2020
(This article belongs to the Special Issue Design, Control and Optimization of Desalination Processes)
Abstract
:In the arid west, the freshwater supply of many communities is limited, leading to increased interest in tapping brackish water resources. Although reverse osmosis is the most common technology to upgrade saline waters, there is also interest in developing and improving alternative technologies. Here we focus on membrane capacitive deionization (MCDI), which has attracted broad attention as a portable and energy-efficient desalination technology. In this study, a fully coupled two-dimensional MCDI process model capable of capturing transient ion transport and adsorption behaviors was developed to explore the function of the ion-exchange membrane (IEM) and detect MCDI influencing factors via sensitivity analysis. The IEM enhanced desalination by improving the counter-ions’ flux and increased adsorption in electrodes by encouraging retention of ions in electrode macropores. An optimized cycle time was proposed with maximal salt removal efficiency. The usage of the IEM, high applied voltage, and low flow rate were discovered to enhance this maximal salt removal efficiency. IEM properties including water uptake volume fraction, membrane thickness, and fixed charge density had a marginal impact on cycle time and salt removal efficiency within certain limits, while increasing cell length and electrode thickness and decreasing channel thickness and dispersivity significantly improved overall performance.
1. Introduction
Freshwater is essential in our daily life with diverse demands for drinking water, agricultural irrigation, and industrial water. Demand for freshwater, combined with the potential for supply disruptions from climate change, has exacerbated freshwater scarcity [1]. Alternative technologies for providing freshwater are increasingly sought including desalinating saline water due to abundant seawater and brackish groundwater resources [2,3,4]. Although thermal distillation and reverse osmosis are the most popular desalination techniques [4], capacitive deionization (CDI) exhibits potential advantages including tunable effluent concentration, selective ion removal capability, high and flexible water recovery, simple pretreatment procedures, and reduced fouling and scaling problems, particularly when treating low salinity brackish water [5,6]. CDI may be particularly appropriate for a low volume of water desalination [7]. Developments such as flow-electrode CDI, increased productivity and continuous electrosorption have expanded its applicability [8,9].
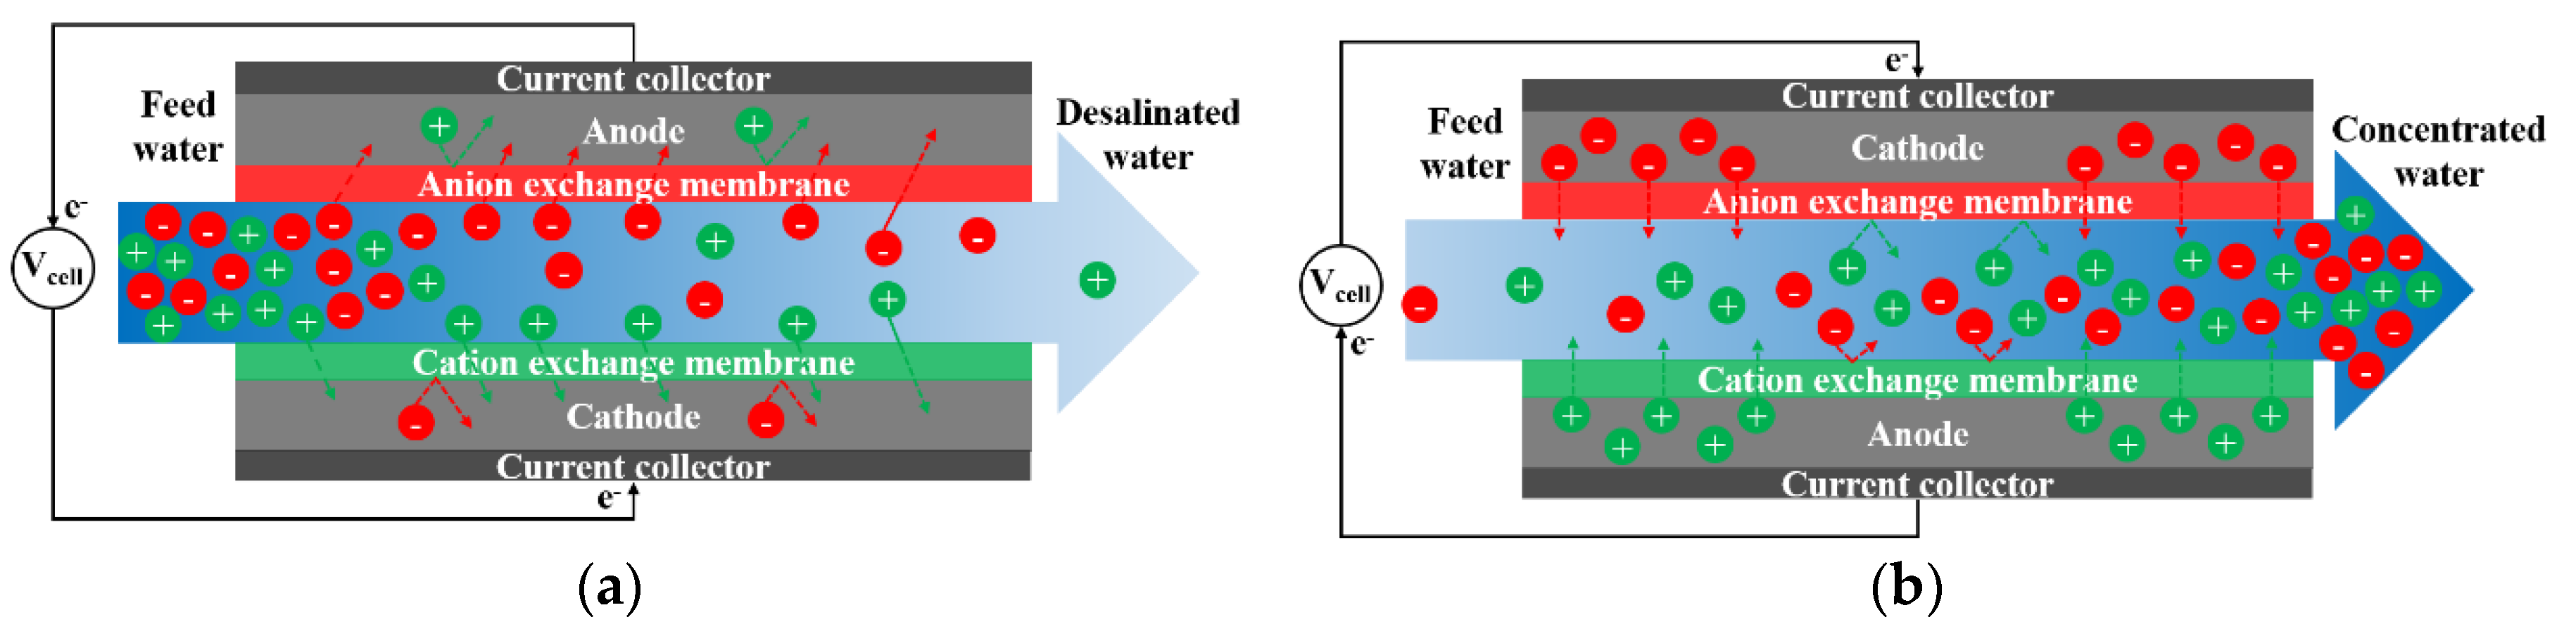
Membrane capacitive deionization (MCDI) is a modification of conventional CDI that has an ion-exchange membrane (IEM) on electrodes [6,10]. Schematic graphs of MCDI depicting both desalination and regeneration processes are shown in Figure 1. A cation-exchange membrane (CEM) and an anion-exchange membrane (AEM) are inserted between a spacer-filled channel and a pair of porous electrodes. During desalination, ions are collected on the oppositely charged electrode. During regeneration, the captured ions are repelled back into the channel, generating a concentrated stream. The IEM helps to slow co-ions’ migration, which refers to the ions with the same charge as the fixed charge on the IEM. This maintains the majority of the co-ions inside the electrode during desalination and slows the co-ions’ penetration from the channel solution into the electrode during regeneration [11].
Lee et al. [12] first proposed MCDI and achieved a higher salt removal rate compared to CDI when desalinating power plant wastewater. Advantages of MCDI compared to conventional CDI include higher salt removal efficiency [13,14,15,16], higher current efficiency [14,15,17,18], faster desalination rate [16], and lower energy consumption [18,19]. The feasibility of energy recovery in MCDI further decreases the net energy consumption [20,21]. Properties of the electrode [22] and the IEM [23], feed water quality [10], and operating conditions [19,24,25] including operating mode, applied voltage/current, flow rate, water recovery, and adsorption duration directly control cell performance, such as the number of ions removed, the water quality of the desalinated stream, and the energy efficiency of MCDI.
Building a comprehensive and accurate MCDI process model is essential to better understand the mechanisms and analyze the key influences on cell performance. An MCDI process model should capture ion transport and adsorption dynamics in the electrode, IEM, and the channel. A model of a porous electrode has been proposed treating electrode macropores as an ion transport pathway, and electrode micropores as adsorption sites [11,26]. The small size of micropores suggests that the electric double layer (EDL) in these pores overlap, creating a nearly uniform potential distribution throughout much of the micropores [26,27]. Ion electrosorption behavior in micropores has been simulated via the Gouy–Chapman–Stern (GCS) model [28,29], classical Donnan theory [30], and modified Donnan theory [11,26,31,32,33,34]. The modified Donnan theory expands classical Donnan theory by introducing a Stern layer between the micropore surface and diffuse layer and considering non-electrostatic attractions [35] from the micropore surface towards the approaching ions [32]. The macroscopic porous electrode (MPE) model [36,37] approximates microscopic pores as volume averaged adsorption sites. The MPE theory avoids dealing with the complicated morphology of the porous electrode and treats the sub-grid scale behavior of the micropores as an adsorptive sink term in macroscopic transport equations [31,36,38,39]. The Nernst–Planck (NP) equation has been applied to describe ion transport in both macropores [31,34,39] and the IEM [10,11,34,40]. In reality, co-ion transport through the IEM always occurs. When the concentration of the solution is getting closer to the fixed charge density of the IEM, Donnan exclusion becomes weakened, resulting in non-negligible co-ion transport through the IEM [41]. The non-ideal IEM theory has been proposed to include both counter-ion and co-ion transport through the IEM [11,25]. Donnan equilibrium has been widely used as the boundary condition on IEM [10,11,33,34]. In a few studies, ion transport in the channel is modeled as a well-mixed bulk solution with a mass transfer boundary layer [10,28,39]. A porous media spacer is commonly used in the channel of (M)CDI to prevent short-circuiting, break concentration polarization, and improve ion mixing [13,42]. However, dispersion [43,44] as a result of non-uniform flow in the porous spacer is rarely considered in existing models.
Although one-dimensional models possess the advantages of simplicity and easy implementation, they neglect ion transport in the direction of the flow in the channel. Several semi-two-dimensional models have been developed by dividing the channel into several well-stirred units in the flow direction to simulate bi-dimensional ion transport in (M)CDI [10,11,25,26,34]. Hemmatifar et al. [31] proposed a two-dimensional CDI model by fully coupling axial and lateral ion transport and adsorption equations to capture the multi-dimensional effects on ion concentration and potential distributions inside the cell. The MPE model and modified Donnan theory were used to characterize the adsorption behavior, and the NP equation was used to model ion transport in the cell [31].
In this study, a two-dimensional MCDI model was developed by modifying Hemmatifar’s CDI model [31], which has facilitated the implementation of fully coupled two-dimensional models to explore cell performance characteristics in recent studies [45,46]. The goals of this study include exploring the function of the IEM on desalination rate and adsorption capability and evaluating the impacts of hydraulic dispersion, IEM properties, and cell configuration on cell performance via a series of sensitivity analyses. The novelties of this model lie in that: (1) this model is the first fully coupled two-dimensional process model for MCDI considering non-ideal IEM; (2) hydraulic dispersion effects caused by fluid flowing through the porous spacer are included; (3) cycle time with maximal salt removal efficiency is proposed as an optimized operating mode. The implementation of this model contributes to a more convenient optimization of cell design and operating conditions of MCDI.
2. Model Framework
2.1. MCDI Parameters and Operating Conditions
This model simulates ion dynamics in a single-pass [6] CV mode MCDI. Figure 2 shows the two-dimensional MCDI assembly containing a cathode, CEM, spacer-filled channel, AEM, and an anode successively. The first dimension (length dimension) is in the flow direction parallel to the electrodes and the second dimension (thickness dimension) is perpendicular to the electrodes (the desalination or regeneration flux dimension). The dimensions and other key device parameters employed in this model are shown in Table 1.
A sodium chloride aqueous solution over the concentration range of 0–100 mol/m3 is chosen to mimic brackish water. Electrode properties including macropore and micropore void fractions and capacitance are from Hemmatifar’s paper [31]. Due to the incomplete data for a specific IEM, IEM properties including thickness, water uptake volume fraction, and fixed charge density are set among a reasonable range of the reported commercial IEM values [47,48,49]. Water in the IEM causes IEM swelling and aids salt permeability through the IEM [50,51]. Here, the water volume fraction represents the volume fraction of water content in the swollen IEM. Fixed charge density refers to the molar concentration of fixed charge groups per liter of absorbed water in a swollen IEM [52]. A fixed charge on IEM contributes to counter-ions’ transport but suppresses co-ions’ penetration through the IEM [41]. Higher fixed charge density increases this permselectivity. The key membrane properties may vary between CEM and AEM in reality [53]. In this study, CEM and AEM were set to share the same geometry, water uptake volume fraction, and fixed charge density for the sake of simplification and controlling variables. Non-woven cloth with a porosity of 0.71 and a mean pore size of 20 μm was chosen to simulate the spacer [54].
Hydraulic dispersion is mainly related to hydrodynamic characteristics and is unaffected by the electric field at these salinities [55]. Hydraulic dispersivity in porous media was indicated to be scale-dependent and approximated among micrometer to decimeter magnitude for centimeter-magnitude scales [56,57]. Transverse dispersivity, the dispersivity perpendicular to the main flow, was varied over a range of 1–10% of the axial dispersivity as inputs in our model, which was consistent with the observation of Bear and Verruijt [58], where transverse dispersivity was 1–20% of the axial dispersivity. Transverse dispersivity did not exert a significant influence on cell performance in the simulated results. The ratio of 1:10 (10%) was finally selected for subsequent simulation efforts.
To effectively avoid Faradaic reactions in (M)CDI, the applied voltage in the constant voltage (CV) mode should not exceed 0.8 V [59,60]. The applied voltage ranged from 0.5 V to 0.8 V in this study. The feed water concentration and flow rate were in a reasonable range of the reported (M)CDI operating conditions [5,22,61]. Detailed operating conditions are listed in Table 1. The parameters marked by asterisks are taken from ref. [25] and are only used as inputs for model validation.
2.2. Mathematical Development
2.2.1. Assumptions
An ideal solution was assumed on the basis of the dilute feed water concentration range in this study. Complete dissociation of NaCl was assumed. The flow of water was incompressible and isothermal. Neither Faradaic reaction nor electrode electronic resistance was considered under the range of applied voltage [59,60] and feed water concentration [34], respectively. The electrostatic effect of the charges of the IEM and the electrodes on diffusivity was assumed negligible [52,62,63]. The spacer-filled channel, IEM, and the distribution of electrode macropores and micropores were all assumed homogeneous. Electroneutrality was valid in the spacer-filled channel and electrode macropores, which is in accord with the principle that charge separation only occurs within the distance of Debye–Hückel length [64].
The pore Reynolds (Re) number is calculated by:
where, u is the interstitial velocity in the channel, dp is the mean pore size of the porous spacer, ρ and µ are the density and viscosity of the solution, respectively. Darcy flow is valid in the channel [65].
2.2.2. Ion Transport in the Spacer-Filled Channel
A modified NP equation incorporating hydraulic dispersion, electromigration, and advection terms was used to describe the motion of charged species in the porous spacer-filled channel:
where, ɛs is the porosity of the spacer, ci is the concentration of species i in the channel, t is the operating time, zi is the ion valence of species i, F is Faraday’s constant (96,485 C/mol), R is the universal gas constant (8.314 J/mol/K), T is ambient temperature, φ is the electrolyte potential in the channel, U is the Darcy velocity, Ddisp is the hydrodynamic dispersion coefficient expressed by dispersivity λ [57]:
where Di is the effective diffusion coefficient of species i in the spacer-filled channel corrected by porosity and tortuosity [66]:
where Di0 is the diffusion coefficient of species i in solution, and τ is the tortuosity in the spacer-filled channel. Hydraulic dispersion effects on electromigration were neglected. Considering electroneutrality in the channel, we arrive at:
2.2.3. Ion Transport in the IEM
The NP equation is also applicable for ion transport in the IEM:
where, cm,i is the concentration of species i in the IEM, φm is the electrolyte potential in the IEM, and Dm,i is the effective diffusion coefficient of species i in the IEM amended by Mackie and Meares’s model [67]:
where, ɛw is the water uptake volume fraction of the IEM. Fixed charges on the IEM are balanced by the ions in the solution:
where zF is the ion valence of the fixed charge on the IEM and cF is the fixed charge density on the IEM.
2.2.4. Ion Transport and Adsorption in the Electrode
Ion transport in macropores is described by an NP equation incorporating ion adsorption into micropores via a sink term on the left-hand side:
where, cma,i and cmi,i are the concentrations of species i in macropores and micropores, respectively, ɛma and ɛmi are the porosities of macropores and micropores, respectively, φma is the electrolyte potential in macropores, and Dma,i is the effective diffusion coefficient of species i in macropores corrected by porosity and tortuosity [66]:
Electroneutrality is also valid in macropores:
Modified Donnan theory without non-electrostatic terms is applied to account for ion adsorption in micropores:
where, φst is Stern layer potential drop, Cst is micropore volumetric capacitance, and φd is Donnan potential representing the potential difference between the micropore’s diffuse layer and its adjacent macropore.
Equation (14) indicates that the applied electric potential on the electrode equals to the sum of the Stern layer potential drop, Donnan potential, and macropore electrolyte potential:
where Vcell is the applied voltage. Assuming MCDI is symmetric with a zero electrolyte potential along the symmetry axis, the potential is set as half negative applied voltage and half positive applied voltage for cathode and anode, respectively.
2.2.5. Boundary Conditions
Donnan equilibrium serves as the boundary conditions of both the IEM-channel boundary (15) and IEM-electrode boundary (16):
where, φm,c and φm,e are the electrolyte potentials in the IEM on the IEM-channel boundary and IEM-electrode boundary, respectively.
Ion flux and current density are continuous on the IEM’s boundaries. No ion flux is out of the cell. The inlet of the influent solution obeys Danckwerts’ flux boundary condition. The derivatives of all variables were set to zero at the outlet.
3. Results
The set of non-linear partial differential equations (PDE) were solved by COMSOL Multiphysics 5.4 software through building a fine mesh near the boundaries of the IEM to help convergence and simulation accuracy. The final mesh consists of 364,212 degrees of freedom with 35,000 domain elements and 1300 boundary elements, which balances accuracy and simulation time. A preliminary evaluation showed that this discretization provided mesh independent results.
3.1. Model Validation
A semi-quantitative model validation was conducted by comparing the trends of simulated effluent concentration curves under varying applied voltage and varying flow rates with published experimental observations [10,68]. The general behavior observed experimentally is qualitatively reproduced by this model with a rapid decrease to a minimum effluent concentration and then a slow return to influent concentration as the electrode becomes saturated. Increasing applied voltage achieves greater sorption and results in a lower minimum effluent concentration, as observed by Lee and Choi [68]. Decreasing flow rate reduces the minimum effluent concentration with a prolonged time to approach equilibrium, also known as adsorption saturation. With the same equilibrium adsorption amount, the time to reach equilibrium is inversely proportional to the desalination rate, which is an important indicator of (M)CDI performance [26]. Similar trends from varying flow rates were observed by Biesheuvel and Van der Wal [10].
A quantitative model validation was then carried out by setting up MCDI device parameters and operating conditions based on those in ref. [25] (see Table 1), and adjusting effective micropore volume and hydraulic dispersivity, two parameters that were not measured, to fit the observed performance. Figure 3 shows that by adjusting effective micropore volume to 55% of the total micropore volume, and dispersivity to 0.172 m, the simulated salt adsorption per cycle curve agrees with experimental observations [25].
This validated model was subsequently utilized to explore the function of the IEM in MCDI and conduct sensitivity analysis to evaluate influencing factors of MCDI performance.
3.2. Function of IEM in MCDI
3.2.1. Desalination Rate
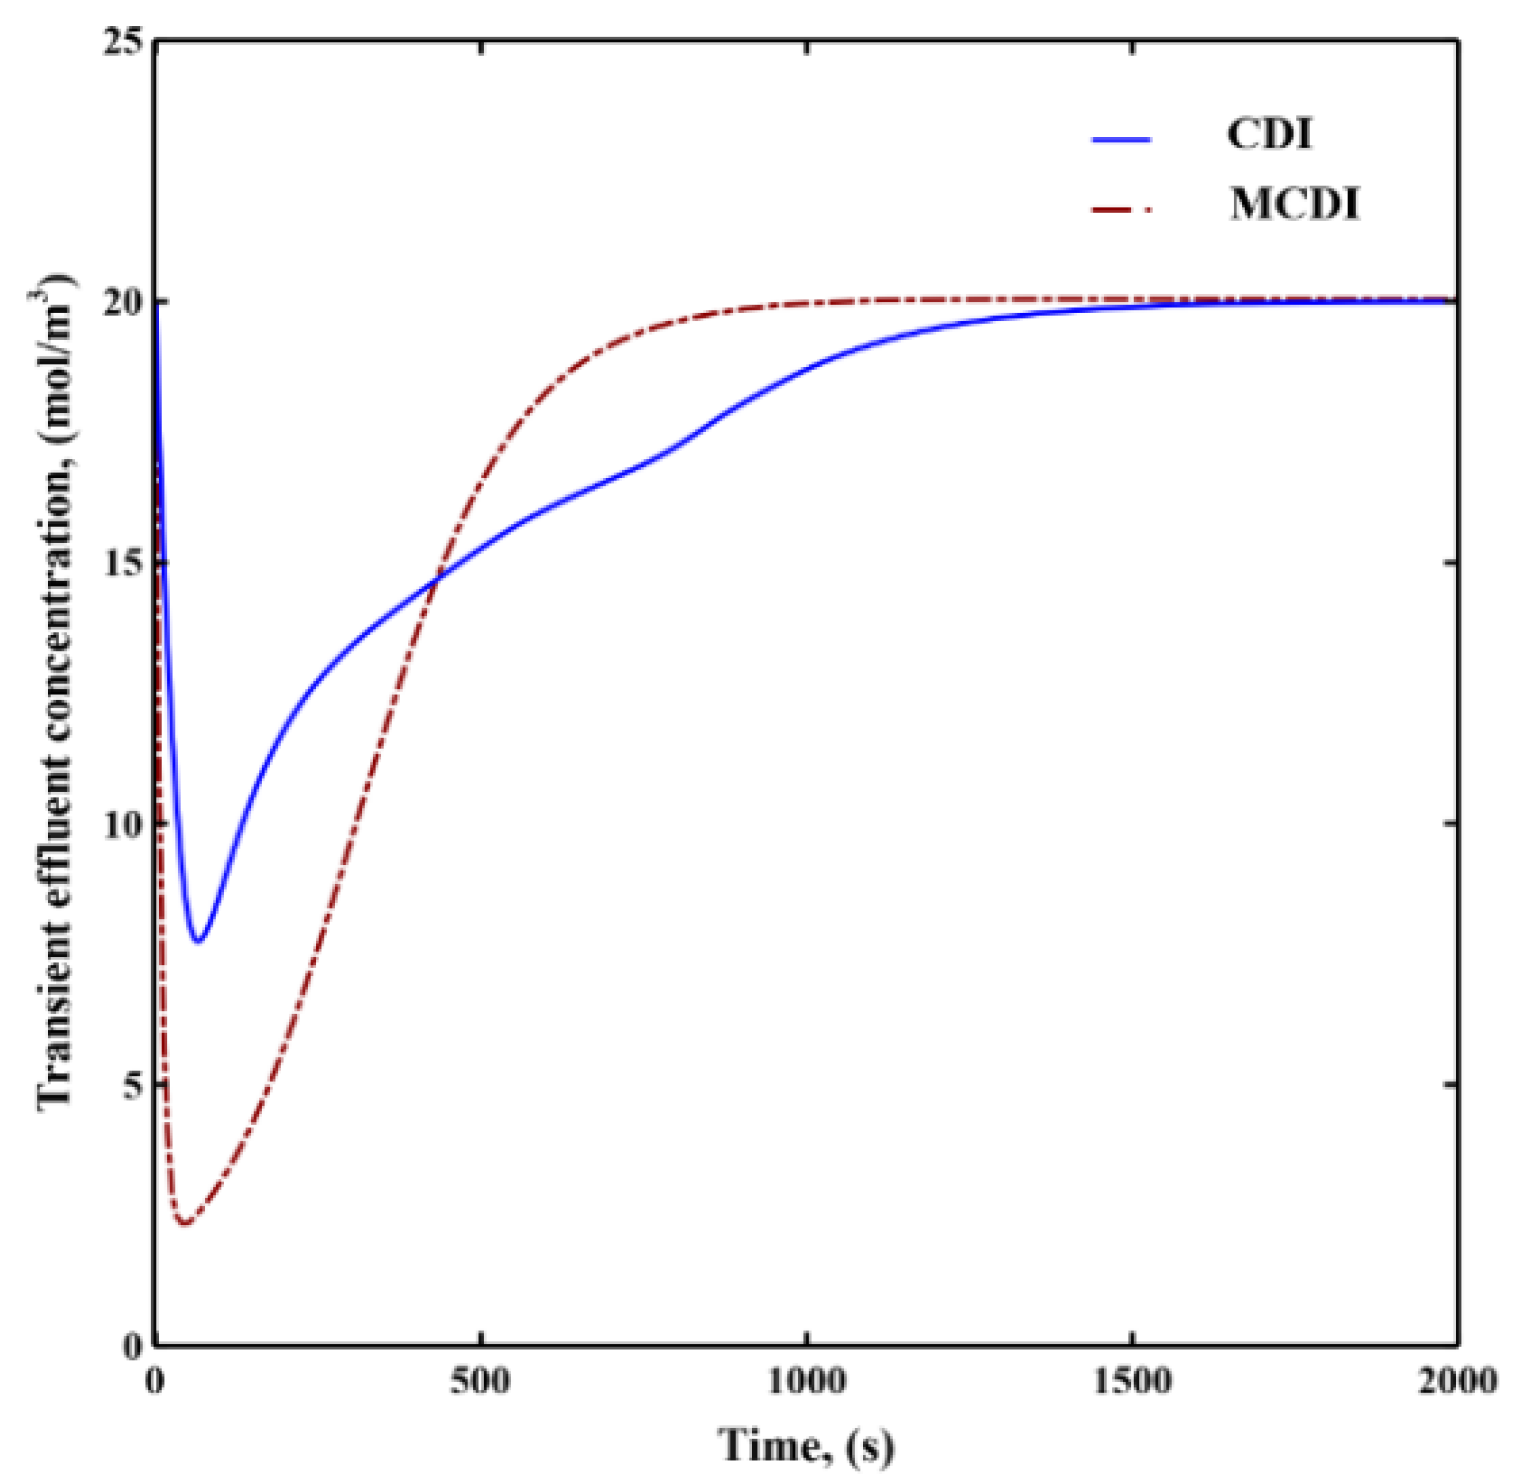
Figure 4 compares transient effluent concentration curves of CDI and MCDI at an applied voltage of 0.8 V, a flow rate of 10 mL/min, and a feed water concentration of 20 mol/m3. The time to reach equilibrium in MCDI is roughly half as much as that in CDI, indicating that counter-ion transport is enhanced with the aid of the IEM. The improved desalination rate in MCDI is consistent with experimental observations [11,16,18,69].
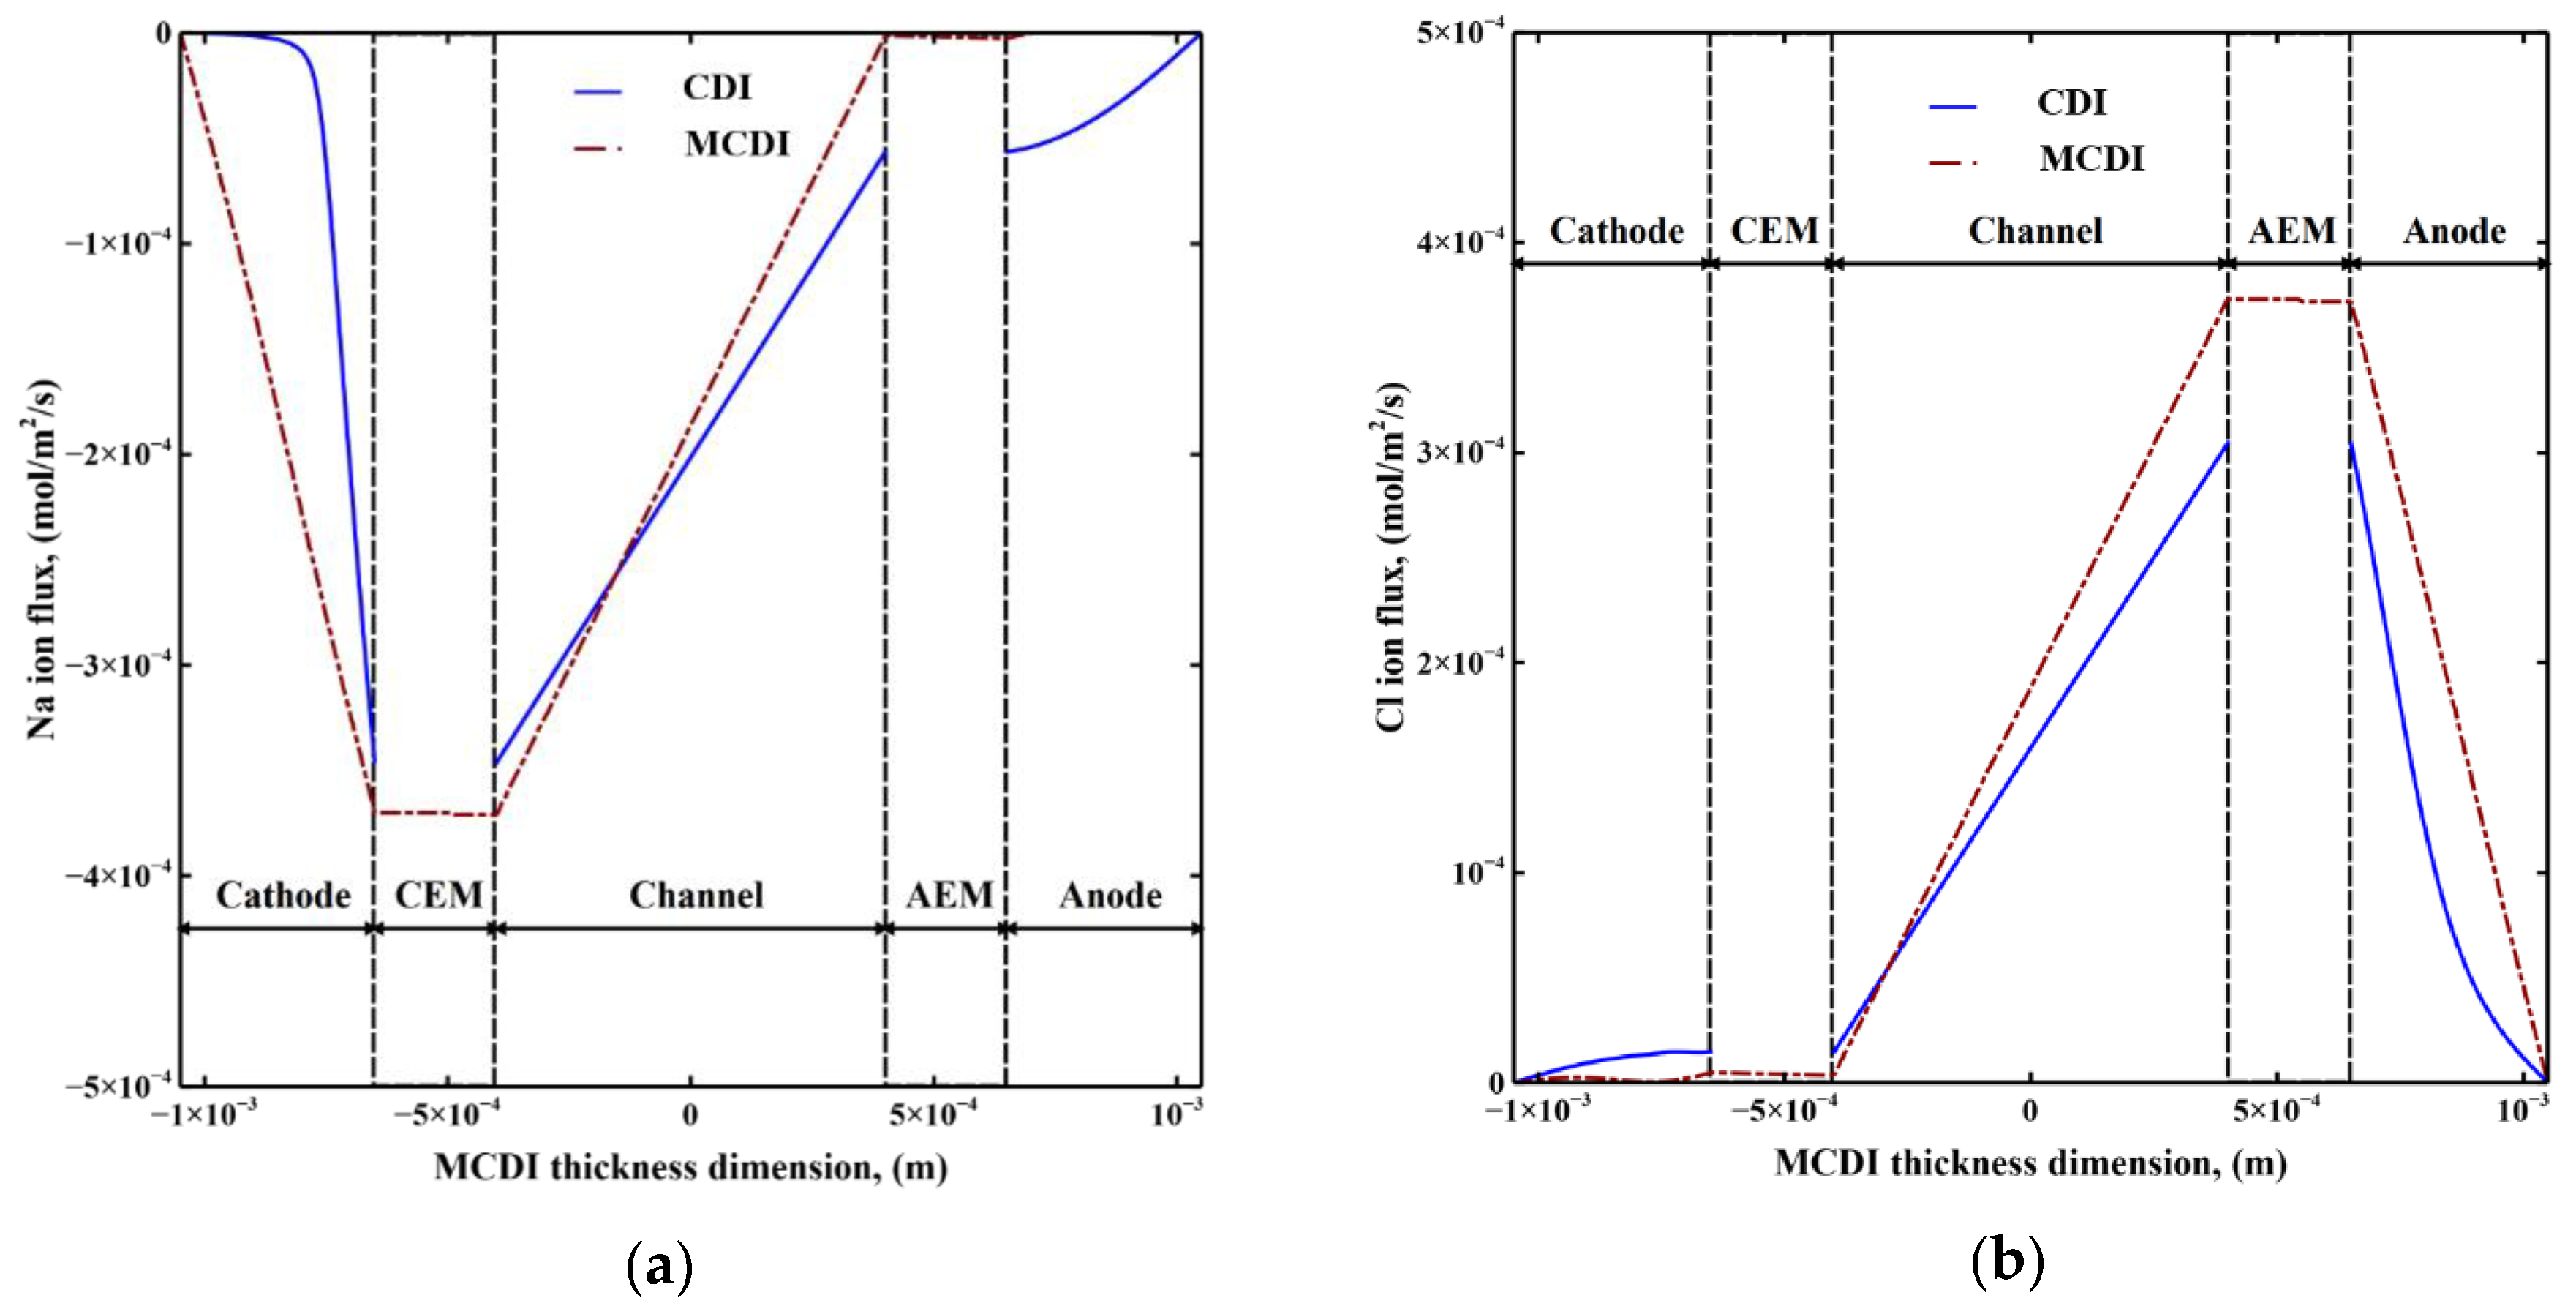
The ion flux distributions of sodium ions and chloride ions along a cross-sectional line of CDI and MCDI at t = 50 s under the same operating conditions of a flow rate of 10 mL/min, an applied voltage of 0.8 V, and a feed water concentration of 20 mol/m3 are displayed in Figure 5a,b, respectively. The time of 50 s was chosen because it is near the minimum effluent concentration and the maximum changes in concentration profile across both cells, making sure the absolute values of ion fluxes are large enough to show a clear deviation between CDI and MCDI.
Negative values imply ion transport towards the cathode (and positive values towards the anode). A fixed charge on the IEM enhances counter-ions’ flux in the vicinity of the IEM and inhibits co-ions’ flux out of the electrode. The enhanced counter-ion flux into macropores helps facilitate counter-ions’ adsorption into the adjacent micropores, resulting in a shortened equilibrium time and thus an improved rate of desalination in MCDI compared to CDI.
3.2.2. Adsorption Capacity
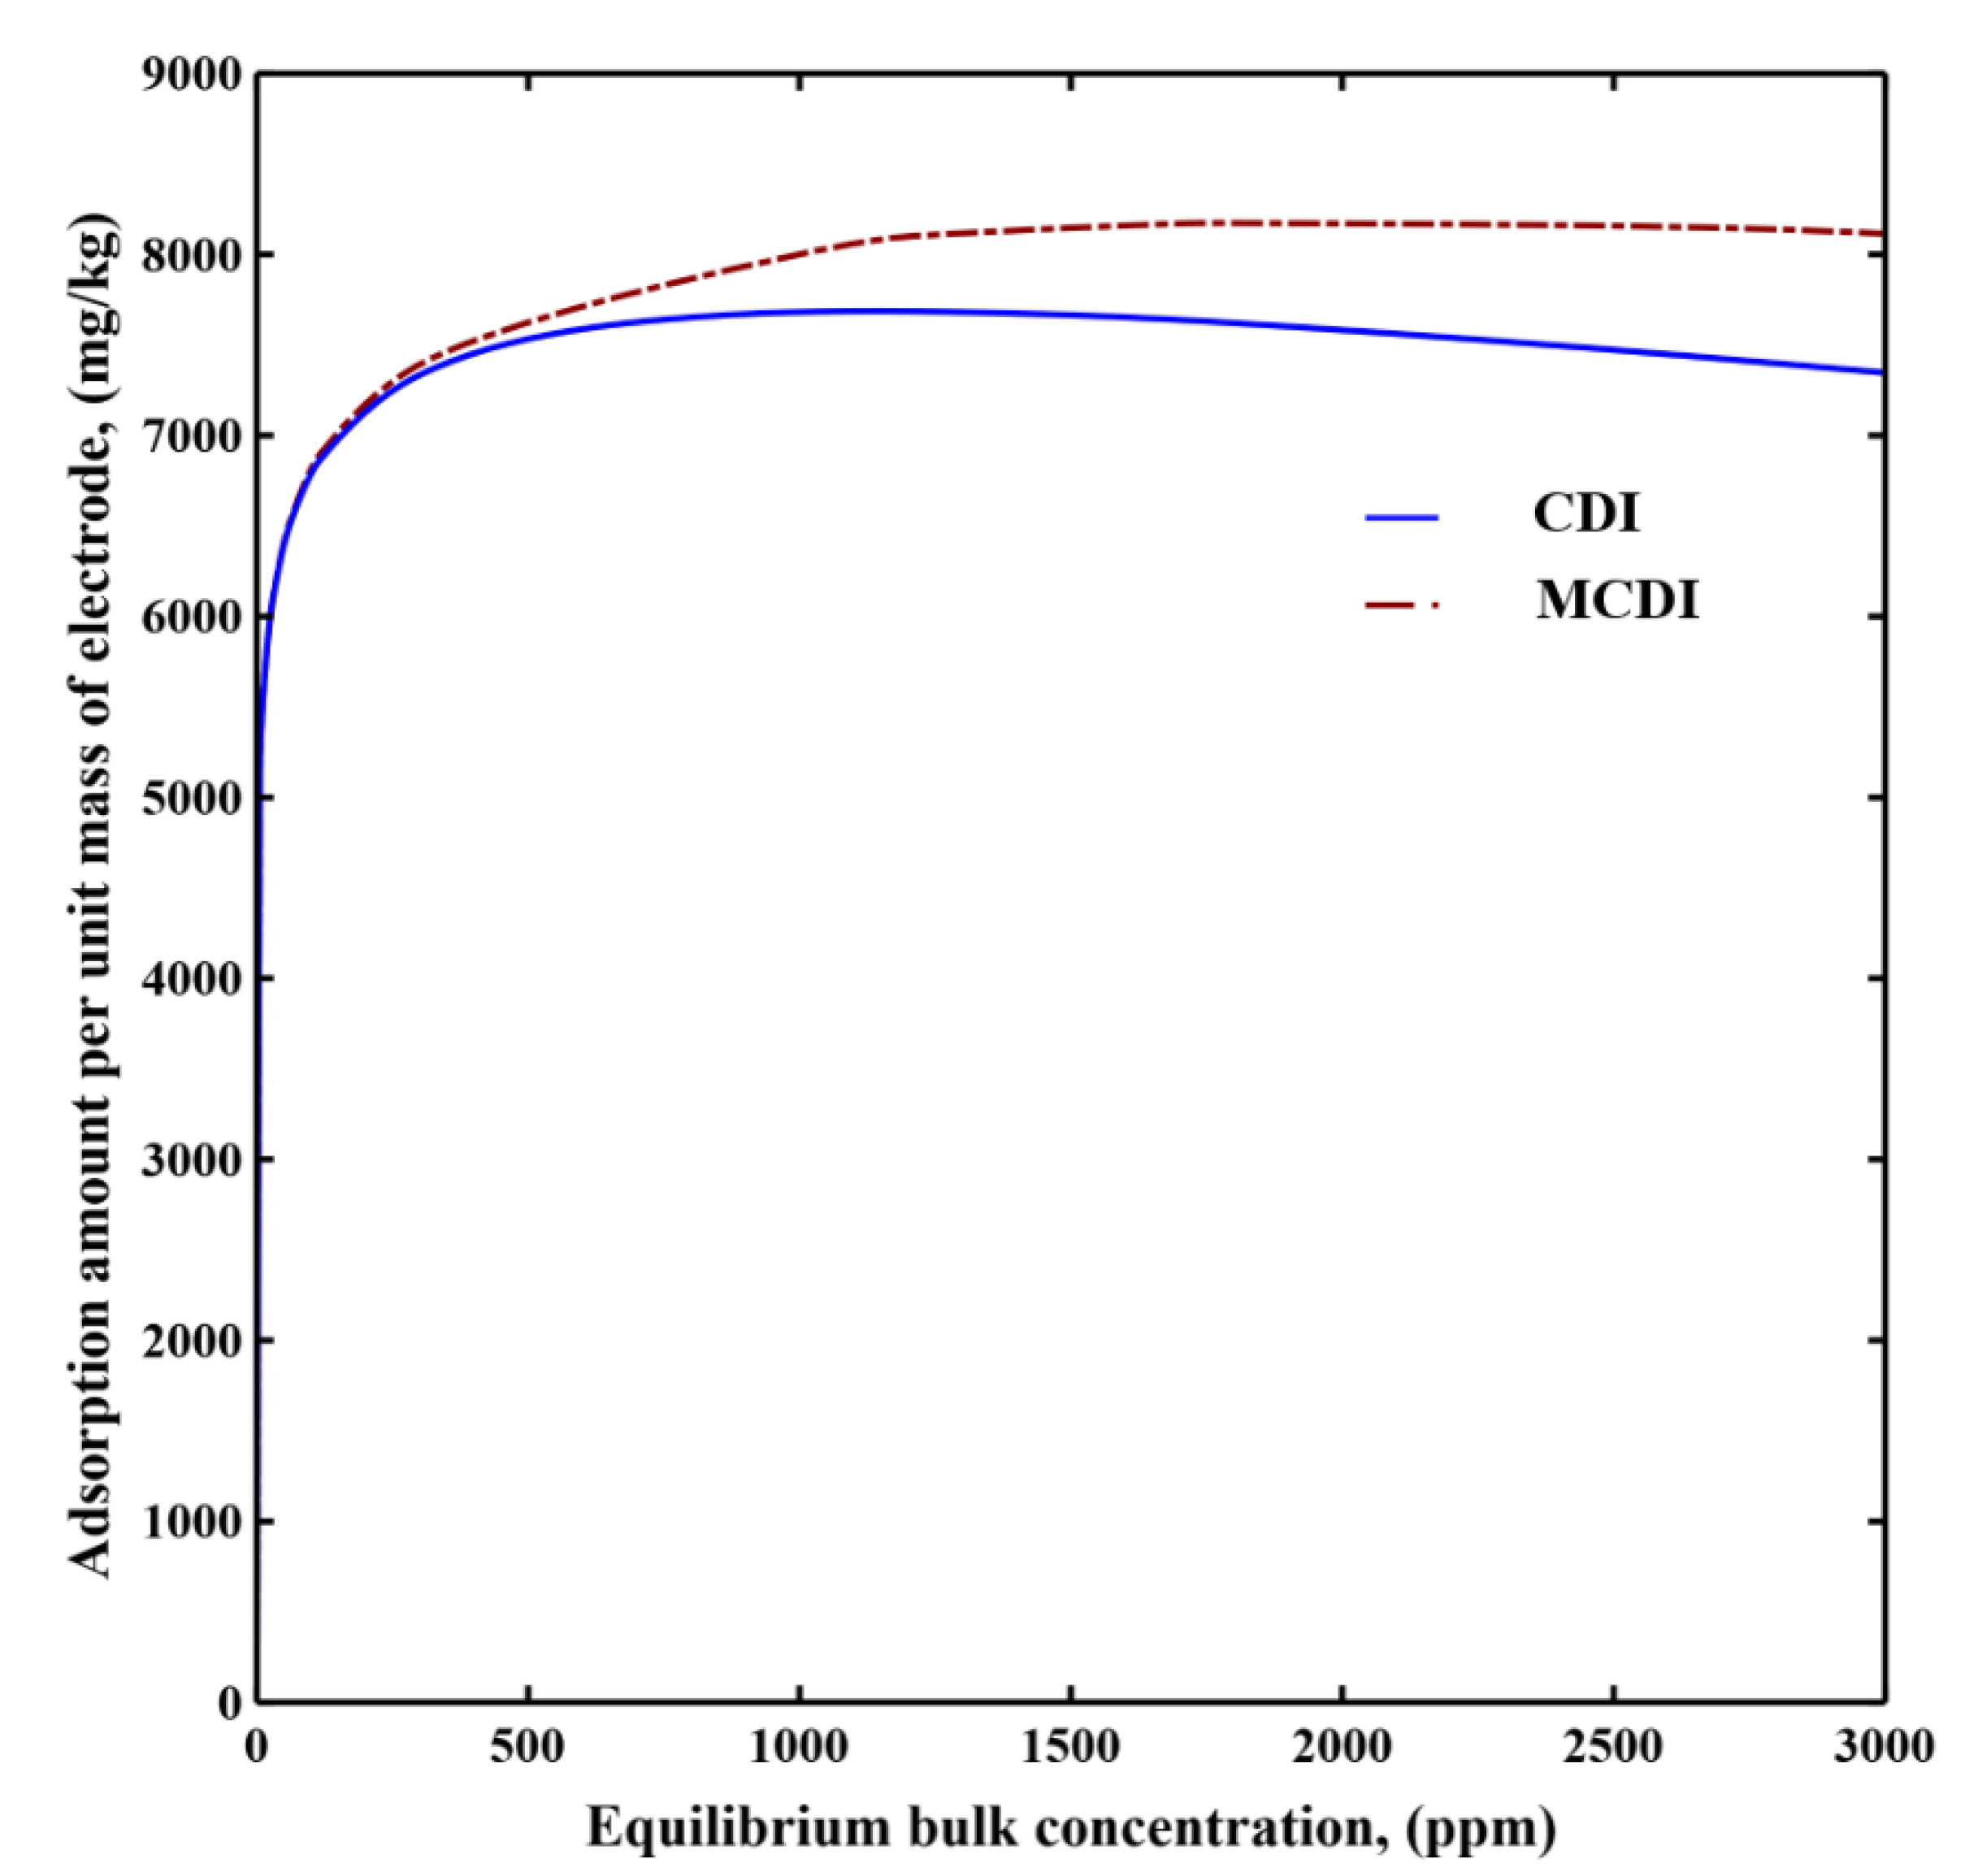
Adsorption isotherms in CDI and MCDI were plotted as a function of equilibrium bulk concentration under the same operating conditions of a flow rate of 10 mL/min and applied voltage of 0.8 V in Figure 6. This adsorption amount refers to the total adsorbed salt (NaCl) per unit mass of both the cathode and anode. Equilibrium bulk concentration is identical to the feed water concentration in single-pass mode. Both cells achieve peak adsorption before an equilibrium bulk concentration of 1500 ppm with MCDI exhibiting a higher capacity than CDI. Since the co-ion repulsion effects [70] become significant at higher concentrations in CDI, the adsorption capability of CDI is affected, showing a decrease in unit adsorption amount at a high equilibrium concentration range. With the aid of the IEM, MCDI does not exhibit significant reductions in adsorption capacity at higher concentrations. This enhanced adsorption in MCDI compared to CDI was also captured by the experimentally observed shapes [11,71].
In order to better understand the equilibrium adsorption, the equilibrium molar adsorption of sodium chloride in electrode micropores, electrode macropores, and the IEM were estimated separately using this model, and the corresponding equilibrium adsorption percentage is shown in Table 2.
The micropores were responsible for the vast majority of the sorption suggesting that the primary function of the IEM is to enhance the rate of adsorption rather than the ultimate capacity. The IEM, however, also aids in the retention of ions in the macropores and that represents the bulk of the difference with CDI shown in Figure 6. Increasing applied voltage enhances the adsorption ability of micropores, reducing the adsorption proportion of IEM and macropores. Increasing concentration reduces the adsorption capacity of micropores and augments the ion accumulation in macropores and IEM, which increases the adsorption proportion of macropores and the IEM. Changing the flow rate does not affect the adsorption capacity of MCDI, so almost no changes in adsorption percentage.
3.2.3. Cycle Time
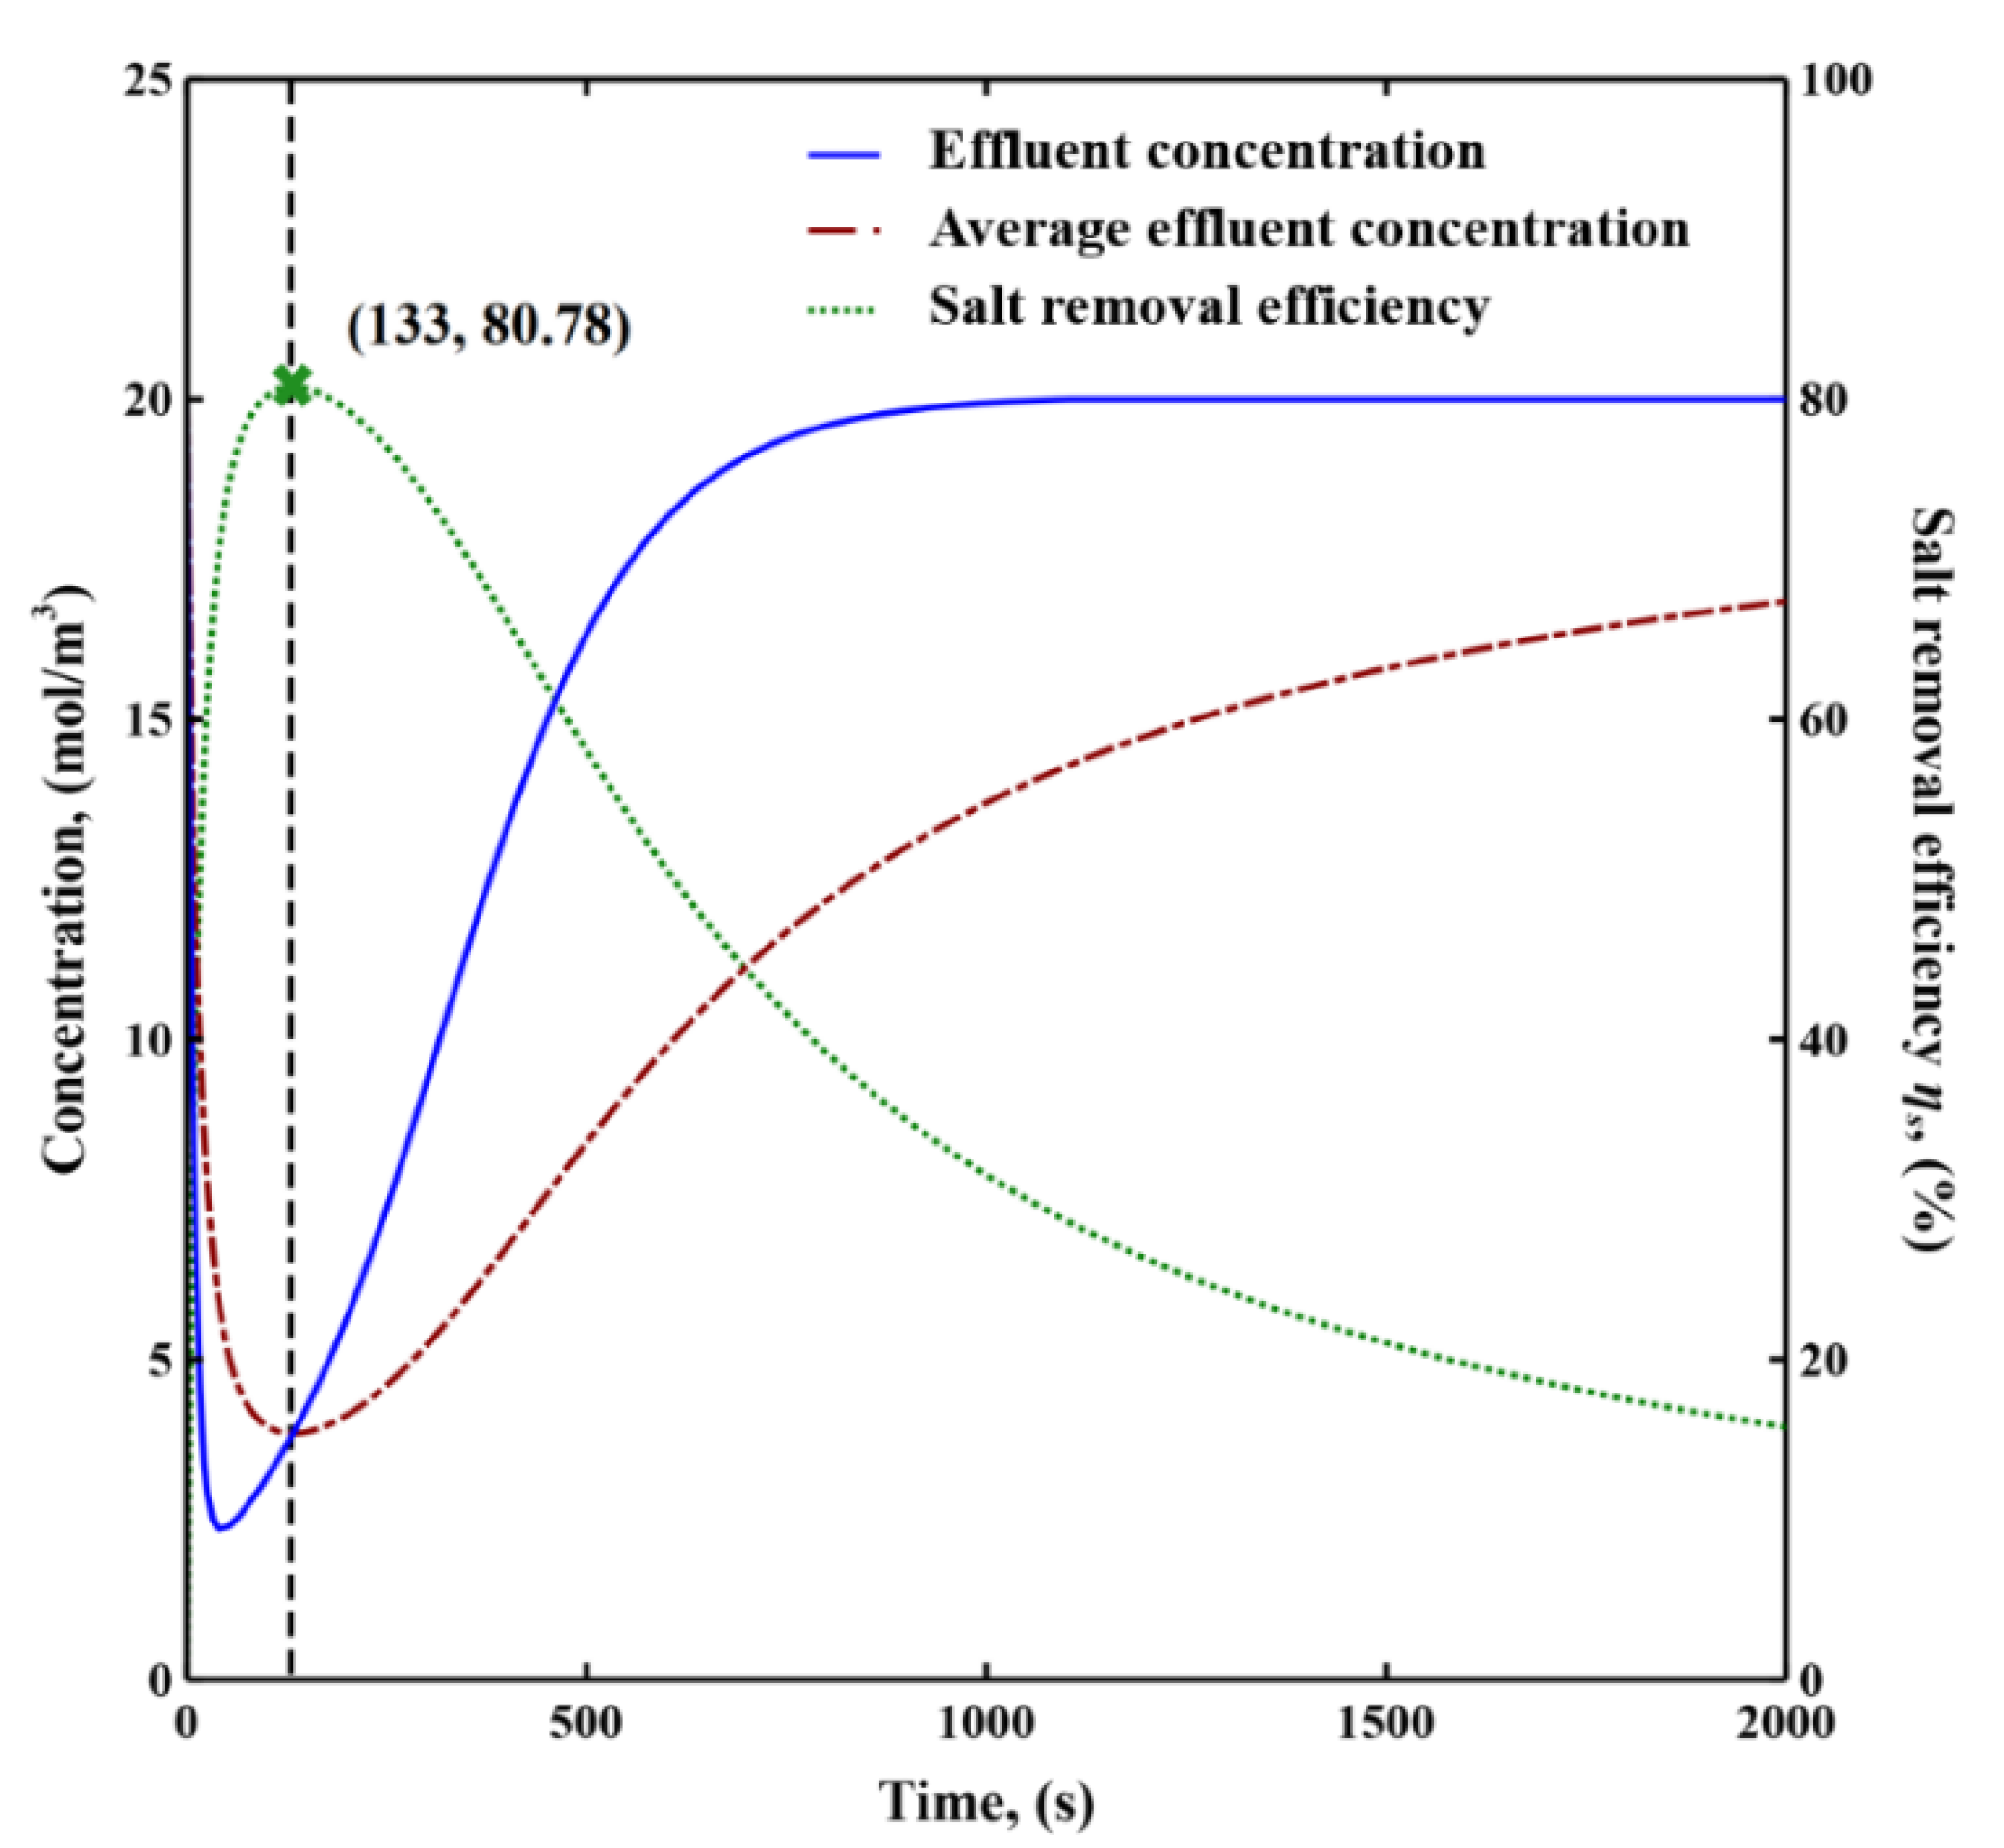
(M)CDI is usually operated till equilibrium during desalination in CV mode [5,61], which is not the most efficient operation considering the less functional duration close to equilibrium (see Figure 4). Here, we proposed an operating approach based upon maximizing salt removal efficiency to control the cycle time, which is the time before equilibrium to switch to the regeneration of the electrode.
The transient average effluent concentration and salt removal efficiency are shown in (17) and (18), respectively:
where, cout,ave is transient average effluent concentration, cout is transient effluent concentration, t is operating time during desalination step, ηs is transient salt removal efficiency, and c0 is feed water concentration.
Figure 7 displays the transient effluent concentration, transient average effluent concentration, and the transient salt removal efficiency curves of MCDI under the operating conditions of applied voltage of 0.8 V, a flow rate of 10 mL/min, and a feed water concentration of 20 mol/m3. The cycle time based upon maximizing salt removal efficiency is shown with an “x”. The corresponding salt removal efficiency of MCDI achieves several-fold improvement compared to operating till equilibrium.
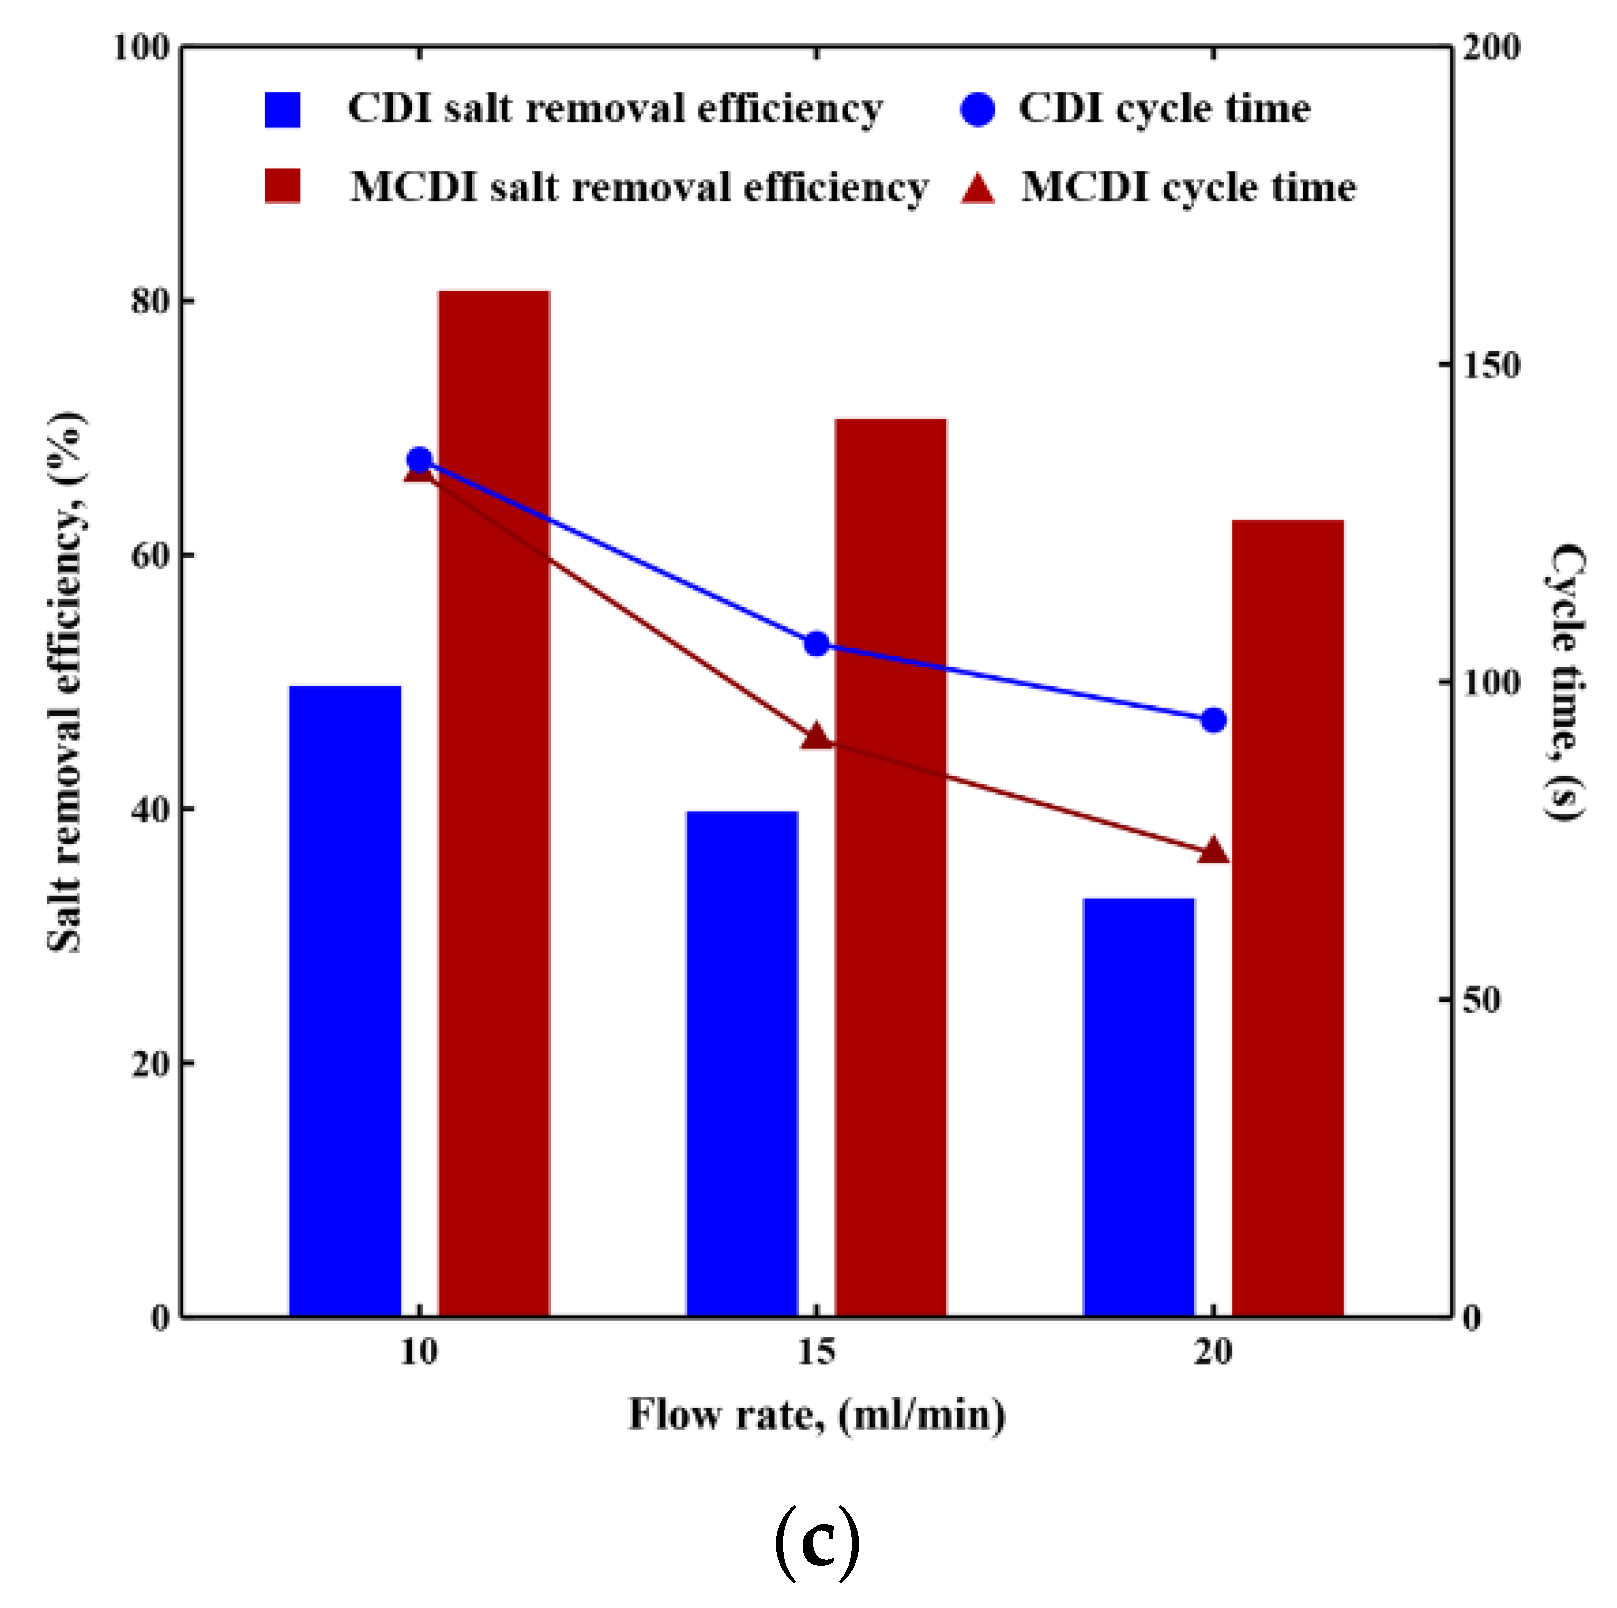
The maximum salt removal efficiency and the corresponding cycle time of CDI and MCDI under varying operating conditions are shown in Figure 8. The operating conditions in Figure 8a are a flow rate of 10 mL/min, feed water concentration of 20 mol/m3, and applied voltage of 0.5 V, 0.6 V, 0.7 V, and 0.8 V. Those in Figure 8b are an applied voltage of 0.8 V, a flow rate of 10 mL/min, and feed water concentration of 20 mol/m3, 50 mol/m3, and 80 mol/m3, and Figure 8c are a feed water concentration of 20 mol/m3, applied voltage of 0.8 V, and flow rate of 10 mL/min, 15 mL/min, and 20 mL/min.
Overall, MCDI possesses a shorter cycle time with a greater salt removal efficiency compared to CDI, which is the result of the rapid achievement of a lower minimum effluent salt concentration during MCDI desalination (see Figure 4). Increasing applied voltage increases salt removal efficiency for both CDI and MCDI by increasing the salt removal capacity of electrode micropores. Electromigration indicates the motion of the diffusing ionic species relative to the electrolyte induced by electrostatic forces. Increasing feed water concentration increases electromigration and indirectly improves diffusive and dispersive ion fluxes, resulting in a faster desalination rate and rapid achievement of the maximum salt removal efficiency. The decreased salt removal efficiency with increasing equilibrium concentration is related to the adsorption capacity of the electrode. Decreasing flow rate extends the residence time of the solution in the channel, allowing more ions to be transported and adsorbed per volume of treated water, which leads to an improved salt removal efficiency. The reduced velocity, however, reduces convective and dispersive ion fluxes and lengthens the time to maximum salt removal efficiency. Similar trends of salt removal efficiency under varying applied voltage, flow rate, and feed water concentration were captured in experimental observations [10,68].
3.3. Sensitivity Analysis
Sensitivity analysis was conducted aiming at investigating hydraulic dispersivity, key IEM properties, and cell configuration on MCDI performance.
Table 3 shows the maximum salt removal efficiency and the corresponding cycle time of MCDI at an applied voltage of 0.8 V, a flow rate of 10 mL/min, and a feed water concentration of 20 mol/m3 and how it changes with varying dispersivity. Hydraulic dispersion varies with transport distance, saturation degree of flow conditions, and the interactive effects of lateral scale, flow rate, and porous media texture [57]. Larger dispersivity results in the improvement of hydraulic dispersion in flow direction compared to the lateral direction, resulting in a faster longitudinal ion mixing and a shorter residence time of the ions. Hence, the corresponding salt removal efficiency is lowered. Dispersion does not affect the equilibrium adsorption amount of MCDI, but a higher dispersivity requires a longer time to reach equilibrium. This results in an unchanged time to minimum effluent concentration under varying dispersivity and thus an unchanged cycle time.
Not many studies have analyzed IEM properties’ effects on MCDI performance. Tian et al. [72] revealed that moderate cross-linking of the IEM benefited MCDI adsorption since highly cross-linked IEM possessed low hydrophilicity, inhibiting the penetration of hydrated counter-ions. Chang et al. [73] pointed out that high ion charge capacity, which was defined as the molar concentration of fixed charge groups per gram of dry polymer, low resistance, and moderate water content contributed to good cell performance since too much water in the IEM would increase ionic transfer resistance. We can evaluate the effects of the IEM properties in this model. Table 4 shows the maximum salt removal efficiency and the corresponding cycle time of MCDI at an applied voltage of 0.8 V, a flow rate of 10 mL/min, and a feed water concentration of 20 mol/m3 and how it changes with the IEM water uptake volume fraction, IEM thickness, and IEM fixed charge density. Varying IEM thicknesses exerts minimal impacts on the cycle time and magnitude of maximum salt removal efficiency. This suggests that thin IEM-electrode composites with lower resistance may be favorable alternatives to commercial IEMs [23]. Increasing the IEM fixed charge density increases ion storage in electrode macropores and thus achieves an improved salt removal efficiency. Overall, IEM properties exhibit marginal effects on MCDI performance within the parameter ranges in this study.
Table 5 shows the maximum salt removal efficiency and the corresponding cycle time of MCDI at an applied voltage of 0.8 V, a flow rate of 10 mL/min, and a feed water concentration of 20 mol/m3 with varying cell length, electrode thickness, and channel thickness. Increasing cell length and electrode thickness enhances salt adsorption ability by increasing the total mass of the sorptive electrode and extends the active area, increasing the maximum salt removal efficiency. Increasing the channel thickness prolongs the ion transport path toward the electrodes and increases the residence time of the solution in the channel, which results in a longer time to a reduced maximum salt removal efficiency. Porada et al. [74] achieved similar trends of salt removal efficiency when increasing electrode and channel thicknesses in CDI.
4. Discussion
A fully coupled two-dimensional MCDI process model was developed, validated, and applied for exploring the role of the IEM and evaluating influencing factors of cell performance. The main results are as follows: (1) A near doubling in desalination rate in MCDI compared to CDI was achieved due to the enhanced counter-ions’ flux in the vicinity of the IEM; (2) Electrode macropores exhibited 4–9% of total ion storage ability because of reduced co-ions’ flux through the IEM; (3) An optimized cycle time was proposed to achieve several-fold improvement of salt removal efficiency compared to operating cell till equilibrium. The use of an IEM, application of high voltage and reduced flow rate increased maximum salt removal efficiency; (4) Sensitivity analysis indicated that increasing cell length and electrode thickness improved salt removal efficiency, while increasing dispersivity and channel thickness lowered salt removal efficiency. This model can be applied to help optimize cell design and operating conditions based on desalination objectives.
Temperature effects, energetic properties, and systemic resistances have been analyzed in other studies. Huang and Tang [75] revealed that high temperature fastened desalination rate but affected the adsorption capacity of CDI. Energy consumption of MCDI is determined by water recovery and salt removal efficiency and can be improved with energy recovery [76]. Energy losses in MCDI largely depend on systematic resistances, including external circuit electronic resistance, electrode electronic resistance, and ionic transfer resistance [34]. Ionic transfer resistance is positively correlated to transport distance and is negatively correlated to ionic concentration and porosity of transfer media [34]. Ionic transfer resistance is captured by the NP equations in this model. Palakkal et al. [77] discovered that thin IEMs with high ion conductivity possessed low resistance and reduced energy consumption. This model can be extended by modifying the transport and adsorption terms to incorporate the effects of temperature, electronic resistances, Faradaic reactions, and special affinity towards specific ions with a surface-modified electrode and IEM.
Author Contributions
Conceptualization, X.Z. and D.R.; methodology, X.Z.; software, X.Z.; validation, X.Z.; writing—original draft preparation, X.Z.; writing—review and editing, X.Z. and D.R.; supervision, D.R.; funding acquisition, D.R. All authors have read and agreed to the published version of the manuscript.
Funding
This research was funded by the Donovan Maddox Distinguished Engineering Chaired Professorship sponsored by the J.F Maddox Foundation.
Conflicts of Interest
The authors declare no conflict of interest. The funders had no role in the design of the study; in the collection, analyses, or interpretation of data; in the writing of the manuscript, or in the decision to publish the results.
Nomenclature
| AEM | Anion-exchange membrane |
| CDI | Capacitive deionization |
| CEM | Cation-exchange membrane |
| CV | Constant voltage |
| EDL | Electric double layer |
| IEM | Ion-exchange membrane |
| MCDI | Membrane capacitive deionization |
| (M)CDI | (Membrane) capacitive deionization |
| MPE | Macroscopic porous electrode |
| NP | Nernst–Planck |
References
- Mekonnen, M.M.; Hoekstra, A.Y. Four billion people facing severe water scarcity. Sci. Adv. 2016, 2, e1500323. [Google Scholar] [CrossRef] [PubMed] [Green Version]
- Honarparvar, S.; Zhang, X.; Chen, T.; Na, C.; Reible, D. Modeling technologies for desalination of brackish water—Toward a sustainable water supply. Curr. Opin. Chem. Eng. 2019, 26, 104–111. [Google Scholar] [CrossRef]
- Ghaffour, N.; Missimer, T.M.; Amy, G.L. Technical review and evaluation of the economics of water desalination: Current and future challenges for better water supply sustainability. Desalination 2013, 309, 197–207. [Google Scholar] [CrossRef] [Green Version]
- Elimelech, M.; Phillip, W.A. The future of seawater desalination: Energy, technology, and the environment. Science 2011, 333, 712–717. [Google Scholar] [CrossRef]
- Suss, M.; Porada, S.; Sun, X.; Biesheuvel, P.; Yoon, J.; Presser, V. Water desalination via capacitive deionization: What is it and what can we expect from it? Energy Environ. Sci. 2015, 8, 2296–2319. [Google Scholar] [CrossRef] [Green Version]
- Porada, S.; Zhao, R.; Van Der Wal, A.; Presser, V.; Biesheuvel, P. Review on the science and technology of water desalination by capacitive deionization. Prog. Mater. Sci. 2013, 58, 1388–1442. [Google Scholar] [CrossRef] [Green Version]
- AlMarzooqi, F.A.; Al Ghaferi, A.A.; Saadat, I.; Hilal, N. Application of capacitive deionisation in water desalination: A review. Desalination 2014, 342, 3–15. [Google Scholar] [CrossRef]
- Ma, J.; Ma, J.; Zhang, C.; Song, J.; Dong, W.; Waite, T.D. Flow-electrode capacitive deionization (FCDI) scale-up using a membrane stack configuration. Water Res. 2020, 168, 115186. [Google Scholar] [CrossRef]
- Yang, S.; Jeon, S.I.; Kim, H.; Choi, J.; Yeo, J.G.; Park, H.R.; Kim, D.K. Stack design and operation for scaling up the capacity of flow-electrode capacitive deionization technology. ACS Sustain. Chem. Eng. 2016, 4, 4174–4180. [Google Scholar] [CrossRef]
- Biesheuvel, P.; Van der Wal, A. Membrane capacitive deionization. J. Membr. Sci. 2010, 346, 256–262. [Google Scholar] [CrossRef]
- Biesheuvel, P.; Zhao, R.; Porada, S.; Van der Wal, A. Theory of membrane capacitive deionization including the effect of the electrode pore space. J. Colloid Interface Sci. 2011, 360, 239–248. [Google Scholar] [CrossRef] [PubMed] [Green Version]
- Lee, J.B.; Park, K.K.; Eum, H.M.; Lee, C.W. Desalination of a thermal power plant wastewater by membrane capacitive deionization. Desalination 2006, 196, 125–134. [Google Scholar] [CrossRef]
- Li, H.; Gao, Y.; Pan, L.; Zhang, Y.; Chen, Y.; Sun, Z. Electrosorptive desalination by carbon nanotubes and nanofibres electrodes and ion-exchange membranes. Water Res. 2008, 42, 4923–4928. [Google Scholar] [CrossRef]
- Kim, Y.J.; Choi, J.H. Enhanced desalination efficiency in capacitive deionization with an ion-selective membrane. Sep. Purif. Technol. 2010, 71, 70–75. [Google Scholar] [CrossRef]
- Kim, Y.J.; Choi, J.H. Improvement of desalination efficiency in capacitive deionization using a carbon electrode coated with an ion-exchange polymer. Water Res. 2010, 44, 990–996. [Google Scholar] [CrossRef] [PubMed]
- Li, H.; Zou, L. Ion-exchange membrane capacitive deionization: A new strategy for brackish water desalination. Desalination 2011, 275, 62–66. [Google Scholar] [CrossRef]
- Kim, Y.J.; Hur, J.; Bae, W.; Choi, J.H. Desalination of brackish water containing oil compound by capacitive deionization process. Desalination 2010, 253, 119–123. [Google Scholar] [CrossRef]
- Zhao, Y.; Wang, Y.; Wang, R.; Wu, Y.; Xu, S.; Wang, J. Performance comparison and energy consumption analysis of capacitive deionization and membrane capacitive deionization processes. Desalination 2013, 324, 127–133. [Google Scholar] [CrossRef]
- Zhao, R.; Biesheuvel, P.; Van der Wal, A. Energy consumption and constant current operation in membrane capacitive deionization. Energy Environ. Sci. 2012, 5, 9520–9527. [Google Scholar] [CrossRef] [Green Version]
- Kang, J.; Kim, T.; Shin, H.; Lee, J.; Ha, J.I.; Yoon, J. Direct energy recovery system for membrane capacitive deionization. Desalination 2016, 398, 144–150. [Google Scholar] [CrossRef]
- Długołęcki, P.; van der Wal, A. Energy recovery in membrane capacitive deionization. Environ. Sci. Technol. 2013, 47, 4904–4910. [Google Scholar] [CrossRef]
- Landon, J.; Gao, X.; Omosebi, A.; Liu, K. Progress and outlook for capacitive deionization technology. Curr. Opin. Chem. Eng 2019, 25, 1–8. [Google Scholar] [CrossRef]
- Hassanvand, A.; Wei, K.; Talebi, S.; Chen, G.Q.; Kentish, S.E. The role of ion exchange membranes in membrane capacitive deionisation. Membranes 2017, 7, 54. [Google Scholar] [CrossRef] [Green Version]
- Zhao, R.; Porada, S.; Biesheuvel, P.; Van der Wal, A. Energy consumption in membrane capacitive deionization for different water recoveries and flow rates, and comparison with reverse osmosis. Desalination 2013, 330, 35–41. [Google Scholar] [CrossRef]
- Zhao, R.; Satpradit, O.; Rijnaarts, H.; Biesheuvel, P.; Van der Wal, A. Optimization of salt adsorption rate in membrane capacitive deionization. Water Res. 2013, 47, 1941–1952. [Google Scholar] [CrossRef] [PubMed]
- Porada, S.; Borchardt, L.; Oschatz, M.; Bryjak, M.; Atchison, J.; Keesman, K.; Kaskel, S.; Biesheuvel, P.; Presser, V. Direct prediction of the desalination performance of porous carbon electrodes for capacitive deionization. Energy Environ. Sci. 2013, 6, 3700–3712. [Google Scholar] [CrossRef] [Green Version]
- Qu, W.; Li, D. A model for overlapped EDL fields. J. Colloid Interface Sci. 2000, 224, 397–407. [Google Scholar] [CrossRef]
- Biesheuvel, P.; Van Limpt, B.; Van der Wal, A. Dynamic adsorption/desorption process model for capacitive deionization. J. Phys. Chem. C 2009, 113, 5636–5640. [Google Scholar] [CrossRef]
- Donnan, F.G. The theory of membrane equilibria. Chem. Rev. 1924, 1, 73–90. [Google Scholar] [CrossRef]
- Müllier, M.; Kastening, B. The double layer of activated carbon electrodes: Part 1. The contribution of ions in the pores. J. Electroanal. Chem. 1994, 374, 149–158. [Google Scholar] [CrossRef]
- Hemmatifar, A.; Stadermann, M.; Santiago, J.G. Two-dimensional porous electrode model for capacitive deionization. J. Phys. Chem. C 2015, 119, 24681–24694. [Google Scholar] [CrossRef]
- Biesheuvel, P.; Fu, Y.; Bazant, M. Electrochemistry and capacitive charging of porous electrodes in asymmetric multicomponent electrolytes. Russ. J. Electrochem. 2012, 48, 580–592. [Google Scholar] [CrossRef] [Green Version]
- Rommerskirchen, A.; Ohs, B.; Hepp, K.A.; Femmer, R.; Wessling, M. Modeling continuous flow-electrode capacitive deionization processes with ion-exchange membranes. J. Membr. Sci. 2018, 546, 188–196. [Google Scholar] [CrossRef]
- Dykstra, J.; Zhao, R.; Biesheuvel, P.; Van der Wal, A. Resistance identification and rational process design in capacitive deionization. Water Res. 2016, 88, 358–370. [Google Scholar] [CrossRef]
- Kastening, B.; Heins, M. Properties of electrolytes in the micropores of activated carbon. Electrochim. Acta 2005, 50, 2487–2498. [Google Scholar] [CrossRef]
- Newman, J.; Thomas-Alyea, E.K. Electrochemical Systems; John Wiley & Sons: New York, NY, USA, 2004. [Google Scholar]
- Johnson, A.; Newman, J. Desalting by means of porous carbon electrodes. J. Electrochem. Soc. 1971, 118, 510–517. [Google Scholar] [CrossRef]
- Shocron, A.N.; Suss, M.E. The effect of surface transport on water desalination by porous electrodes undergoing capacitive charging. J. Phys. Condens. Matter 2017, 29, 084003. [Google Scholar] [CrossRef] [PubMed] [Green Version]
- Biesheuvel, P.; Bazant, M. Nonlinear dynamics of capacitive charging and desalination by porous electrodes. Phys. Rev. E 2010, 81, 031502. [Google Scholar] [CrossRef] [PubMed] [Green Version]
- Volgin, V.; Davydov, A. Ionic transport through ion-exchange and bipolar membranes. J. Membr. Sci. 2005, 259, 110–121. [Google Scholar] [CrossRef]
- Luo, T.; Abdu, S.; Wessling, M. Selectivity of ion exchange membranes: A review. J. Membr. Sci. 2018, 555, 429–454. [Google Scholar] [CrossRef]
- Hassanvand, A. Membrane Capacitive Deionisation as a Novel Approach to Wastewater Treatment. Ph.D. Thesis, The University of Melbourne, Melbourne, Australia, 2018. [Google Scholar]
- Scheidegger, A.E. General theory of dispersion in porous media. J. Geophys. Res. 1961, 66, 3273–3278. [Google Scholar] [CrossRef]
- Scheidegger, A.E. Statistical hydrodynamics in porous media. J. Appl. Phys. 1954, 25, 994–1001. [Google Scholar] [CrossRef]
- Salamat, Y.; Hidrovo, C.H. A parametric study of multiscale transport phenomena and performance characteristics of capacitive deionization systems. Desalination 2018, 438, 24–36. [Google Scholar] [CrossRef]
- Salamat, Y.; Hidrovo, C.H. Significance of the micropores electro-sorption resistance in capacitive deionization systems. Water Res. 2020, 169, 115286. [Google Scholar] [CrossRef] [PubMed]
- Kamcev, J.; Paul, D.R.; Manning, G.S.; Freeman, B.D. Ion diffusion coefficients in ion exchange membranes: Significance of counterion condensation. Macromolecules 2018, 51, 5519–5529. [Google Scholar] [CrossRef]
- Ran, J.; Wu, L.; He, Y.; Yang, Z.; Wang, Y.; Jiang, C.; Ge, L.; Bakangura, E.; Xu, T. Ion exchange membranes: New developments and applications. J. Membr. Sci. 2017, 522, 267–291. [Google Scholar] [CrossRef]
- Duan, Q.; Ge, S.; Wang, C.Y. Water uptake, ionic conductivity and swelling properties of anion-exchange membrane. J. Power Sources 2013, 243, 773–778. [Google Scholar] [CrossRef]
- Strathmann, H. Ion-Exchange Membrane Separation Processes; Elsevier: Amsterdam, The Netherlands, 2004. [Google Scholar]
- Kingsbury, R.S.; Bruning, K.; Zhu, S.; Flotron, S.; Miller, C.; Coronell, O. Influence of water uptake, charge, Manning parameter, and contact angle on water and salt transport in commercial ion exchange membranes. Ind. Eng. Chem. Res. 2019, 58, 18663–18674. [Google Scholar] [CrossRef]
- Kamcev, J.; Paul, D.R.; Manning, G.S.; Freeman, B.D. Predicting salt permeability coefficients in highly swollen, highly charged ion exchange membranes. ACS Appl. Mater. Interfaces 2017, 9, 4044–4056. [Google Scholar] [CrossRef]
- Xu, T. Ion exchange membranes: State of their development and perspective. J. Membr. Sci. 2005, 263, 1–29. [Google Scholar] [CrossRef]
- Rawal, A. Structural analysis of pore size distribution of nonwovens. J. Text. Inst. 2010, 101, 350–359. [Google Scholar] [CrossRef]
- Bear, J.; Bachmat, Y. A generalized theory on hydrodynamic dispersion in porous media. In Proceedings of the IASH Symposium on Artificial Recharge and Management of Aquifers, Haifa, Israel, 19–26 March 1967; pp. 7–16. [Google Scholar]
- Gelhar, L.W.; Welty, C.; Rehfeldt, K.R. A critical review of data on field-scale dispersion in aquifers. Water Resour. Res. 1992, 28, 1955–1974. [Google Scholar] [CrossRef]
- Vanderborght, J.; Vereecken, H. Review of dispersivities for transport modeling in soils. Vadose Zone J. 2007, 6, 29–52. [Google Scholar] [CrossRef]
- Bear, J.; Verruijt, A. Modeling Groundwater Flow and Pollution; Springer Science & Business Media: Dordrecht, The Netherlands, 2012; Volume 2. [Google Scholar]
- Lu, D.; Cai, W.; Wang, Y. Optimization of the voltage window for long-term capacitive deionization stability. Desalination 2017, 424, 53–61. [Google Scholar] [CrossRef]
- Choi, J.H. Comparison of constant voltage (CV) and constant current (CC) operation in the membrane capacitive deionisation process. Desalin. Water Treat. 2015, 56, 921–928. [Google Scholar] [CrossRef]
- Ahmed, M.A.; Tewari, S. Capacitive deionization: Processes, materials and state of the technology. J. Electroanal. Chem 2018, 813, 178–192. [Google Scholar] [CrossRef]
- Manning, G.S. Nonconvective Ionic Flow in Fixed-Charge Systems. J. Chem. Phys. 1967, 46, 2324–2333. [Google Scholar] [CrossRef]
- Manning, G.S. Limiting laws and counterion condensation in polyelectrolyte solutions II. Self-diffusion of the small ions. J. Chem. Phys. 1969, 51, 934–938. [Google Scholar] [CrossRef]
- Dickinson, E.J.; Limon-Petersen, J.G.; Compton, R.G. The electroneutrality approximation in electrochemistry. J. Solid State Electrochem. 2011, 15, 1335–1345. [Google Scholar] [CrossRef]
- Bear, J. Dynamics of Fluids in Porous Media; Dover Publications, Inc.: New York, NY, USA, 1972. [Google Scholar]
- Millington, R.; Quirk, J. Permeability of porous solids. Trans. Faraday Soc. 1961, 57, 1200–1207. [Google Scholar] [CrossRef]
- Mackie, J.; Meares, P. The diffusion of electrolytes in a cation-exchange resin membrane I. Theoretical. Proc. R. Soc. Lond. Ser. A Math. Phys. Sci. 1955, 232, 498–509. [Google Scholar]
- Lee, J.H.; Choi, J.H. The production of ultrapure water by membrane capacitive deionization (MCDI) technology. J. Membr. Sci. 2012, 409, 251–256. [Google Scholar] [CrossRef]
- Liu, Y.; Nie, C.; Pan, L.; Xu, X.; Sun, Z.; Chua, D.H. Carbon aerogels electrode with reduced graphene oxide additive for capacitive deionization with enhanced performance. Inorg. Chem. Front. 2014, 1, 249–255. [Google Scholar] [CrossRef]
- Zornitta, R.L.; Ruotolo, L.A. Simultaneous analysis of electrosorption capacity and kinetics for CDI desalination using different electrode configurations. Chem. Eng. J. 2018, 332, 33–41. [Google Scholar] [CrossRef]
- Biesheuvel, P.; Porada, S.; Levi, M.; Bazant, M.Z. Attractive forces in microporous carbon electrodes for capacitive deionization. J. Solid State Electrochem. 2014, 18, 1365–1376. [Google Scholar] [CrossRef] [Green Version]
- Tian, G.; Liu, L.; Meng, Q.; Cao, B. Preparation and characterization of cross-linked quaternised polyvinyl alcohol membrane/activated carbon composite electrode for membrane capacitive deionization. Desalination 2014, 354, 107–115. [Google Scholar] [CrossRef]
- Chang, J.; Tang, K.; Cao, H.; Zhao, Z.; Su, C.; Li, Y.; Duan, F.; Sheng, Y. Application of anion exchange membrane and the effect of its properties on asymmetric membrane capacitive deionization. Sep. Purif. Technol. 2018, 207, 387–395. [Google Scholar] [CrossRef]
- Porada, S.; Bryjak, M.; Van Der Wal, A.; Biesheuvel, P. Effect of electrode thickness variation on operation of capacitive deionization. Electrochim. Acta 2012, 75, 148–156. [Google Scholar] [CrossRef] [Green Version]
- Huang, K.Z.; Tang, H.L. Temperature and desorption mode matter in capacitive deionization process for water desalination. Environ. Technol. 2019. [Google Scholar] [CrossRef]
- Dykstra, J.; Porada, S.; Van Der Wal, A.; Biesheuvel, P. Energy consumption in capacitive deionization–Constant current versus constant voltage operation. Water Res. 2018, 143, 367–375. [Google Scholar] [CrossRef]
- Palakkal, V.M.; Rubio, J.E.; Lin, Y.J.; Arges, C.G. Low-resistant ion-exchange membranes for energy efficient membrane capacitive deionization. ACS Sustain. Chem. Eng. 2018, 6, 13778–13786. [Google Scholar] [CrossRef]
Figure 1.
Schematic diagrams of MCDI, (a) desalination process, (b) regeneration process.

Figure 2.
Two-dimensional MCDI assembly in this model.

Figure 3.
Simulated salt adsorption per cycle curve with this model and experimental data from ref. [25].
Figure 3.
Simulated salt adsorption per cycle curve with this model and experimental data from ref. [25].

Figure 4.
Transient effluent concentration curves of CDI and MCDI. The applied voltage is 0.8 V, the flow rate is 10 mL/min, and the feed water concentration is 20 mol/m3.
Figure 4.
Transient effluent concentration curves of CDI and MCDI. The applied voltage is 0.8 V, the flow rate is 10 mL/min, and the feed water concentration is 20 mol/m3.

Figure 5.
(a) Sodium ion flux distribution and (b) chloride ion flux distribution along the cross-sectional line of CDI and MCDI at t = 50 s. The applied voltage is 0.8 V, the flow rate is 10 mL/min, and the feed water concentration is 20 mol/m3.
Figure 5.
(a) Sodium ion flux distribution and (b) chloride ion flux distribution along the cross-sectional line of CDI and MCDI at t = 50 s. The applied voltage is 0.8 V, the flow rate is 10 mL/min, and the feed water concentration is 20 mol/m3.

Figure 6.
Adsorption isotherms of CDI and MCDI. The flow rate is 10 mL/min, and the applied voltage is 0.8 V.
Figure 6.
Adsorption isotherms of CDI and MCDI. The flow rate is 10 mL/min, and the applied voltage is 0.8 V.

Figure 7.
Transient effluent concentration, transient average effluent concentration, and transient salt removal efficiency curves of MCDI. The cross mark represents cycle time with the maximum salt removal efficiency. The applied voltage is 0.8 V, the flow rate is 10 mL/min, and the feed water concentration is 20 mol/m3.

Figure 8.
The maximum salt removal efficiency and the corresponding cycle time of CDI and MCDI under (a) flow rate of 10 mL/min and feed water concentration of 20 mol/m3, (b) applied voltage of 0.8 V and flow rate of 10 mL/min, and (c) feed water concentration of 20 mol/m3 and applied voltage of 0.8 V. Lines are used for guiding the eyes.


Table 1.
MCDI device parameters and operating conditions.
| Parameter | Value | Unit |
|---|---|---|
| Cell length | 8–12, 6 * | [cm] |
| Cathode/Anode thickness | 0.2–0.6, 0.362 * | [mm] |
| Macropore porosity | 0.4, 0.3 * | - |
| Micropore porosity | 0.3, 0.3 * | - |
| Micropore capacitance | 1.5, 1.2 * | [GF/m3] |
| Mass of a pair of electrodes | 4.18, 1.35 * | [g] |
| CEM/AEM thickness | 0.2–0.3, 0.17/0.14 * | [mm] |
| CEM/AEM water uptake volume fraction | 0.2–0.6 | [L(water)/L(swollen polymer)] |
| CEM/AEM fixed charge density | 500–1000 | [mol/m3] |
| Spacer-filled channel thickness | 0.8–1.2, 0.25 * | [mm] |
| Spacer porosity | 0.71 | - |
| Hydraulic dispersivity | 0.001–0.1 | [m] |
| Ratio of transverse dispersivity over axial dispersivity | 0.1 | - |
| Diffusion coefficient of Na+ in water | 1.33 × 10⁻⁹ | [m2/s] |
| Diffusion coefficient of Cl− in water | 2.03 × 10⁻⁹ | [m2/s] |
| Feed water concentration | 0–100, 20 * | [mol/m3] |
| Flow rate | 10–20, 7.5 * | [mL/min] |
| Applied voltage | 0.5–0.8, 1.2 * | [V] |
| Temperature | 298.15 | [K] |
* Parameters from ref. [25] and are only used as inputs for model validation. Parameters before the comma are used for subsequent simulation efforts.
Table 2.
Equilibrium adsorption percentage in micropores, macropores, and the IEM under varying operating conditions.
Table 2.
Equilibrium adsorption percentage in micropores, macropores, and the IEM under varying operating conditions.
| Operating Conditions | Micropores (%) | Macropores (%) | IEM (%) | |
|---|---|---|---|---|
| Variant applied voltage at a flow rate of 10 mL/min and feed water concentration of 20 mol/m3. | 0.5 V | 91.34 | 8.53 | 0.13 |
| 0.6 V | 93.19 | 6.71 | 0.10 | |
| 0.7 V | 94.42 | 5.50 | 0.08 | |
| 0.8 V | 95.35 | 4.58 | 0.07 | |
| Variant feed water concentration at an applied voltage of 0.8 V and a flow rate of 10 mL/min. | 20 mol/m3 | 95.35 | 4.58 | 0.07 |
| 30 mol/m3 | 93.96 | 5.91 | 0.13 | |
| 50 mol/m3 | 91.90 | 7.82 | 0.28 | |
| 80 mol/m3 | 90.46 | 9.05 | 0.49 | |
| Variant flow rate at an applied voltage of 0.8 V and feed water concentration of 20 mol/m3. | 5 mL/min | 95.29 | 4.64 | 0.07 |
| 10 mL/min | 95.35 | 4.58 | 0.07 | |
| 15 mL/min | 95.41 | 4.52 | 0.07 | |
| 20 mL/min | 95.48 | 4.45 | 0.07 | |
Table 3.
Effects of dispersivity on the maximum salt removal efficiency and the corresponding cycle time of MCDI.
Table 3.
Effects of dispersivity on the maximum salt removal efficiency and the corresponding cycle time of MCDI.
| Dispersivity (m) | Salt Removal Efficiency (%) | Cycle Time (s) |
|---|---|---|
| 0.001 | 86.15 | 136 |
| 0.01 | 83.31 | 133 |
| 0.1 | 73.91 | 134 |
Table 4.
Effects of the IEM water uptake volume fraction, IEM thickness, and IEM fixed charge density on the maximum salt removal efficiency and the corresponding cycle time of MCDI.
Table 4.
Effects of the IEM water uptake volume fraction, IEM thickness, and IEM fixed charge density on the maximum salt removal efficiency and the corresponding cycle time of MCDI.
| IEM Properties | Salt Removal Efficiency (%) | Cycle Time (s) | |
|---|---|---|---|
| IEM water uptake volume fraction | 0.2 | 79.30 | 136 |
| 0.4 | 80.78 | 133 | |
| 0.6 | 80.90 | 132 | |
| IEM thickness (mm) | 0.2 | 80.89 | 132 |
| 0.25 | 80.78 | 133 | |
| 0.3 | 80.64 | 133 | |
| IEM fixed charge density (mol/m3) | 500 | 79.21 | 127 |
| 750 | 80.70 | 128 | |
| 1000 | 80.78 | 133 | |
Table 5.
Effects of cell length, electrode thickness, and channel thickness on the maximum salt removal efficiency and the corresponding cycle time of MCDI.
Table 5.
Effects of cell length, electrode thickness, and channel thickness on the maximum salt removal efficiency and the corresponding cycle time of MCDI.
| Cell Configuration | Salt Removal Efficiency (%) | Cycle Time (s) | |
|---|---|---|---|
| Cell length (cm) | 8 | 75.51 | 106 |
| 10 | 80.78 | 133 | |
| 12 | 83.55 | 165 | |
| Electrode thickness (mm) | 0.2 | 76.70 | 87 |
| 0.4 | 80.78 | 133 | |
| 0.6 | 82.59 | 154 | |
| Channel thickness (mm) | 0.8 | 80.78 | 133 |
| 1.0 | 74.51 | 151 | |
| 1.2 | 68.90 | 168 | |
Publisher’s Note: MDPI stays neutral with regard to jurisdictional claims in published maps and institutional affiliations. |
© 2020 by the authors. Licensee MDPI, Basel, Switzerland. This article is an open access article distributed under the terms and conditions of the Creative Commons Attribution (CC BY) license (http://creativecommons.org/licenses/by/4.0/).
Share and Cite
MDPI and ACS Style
Zhang, X.; Reible, D. Exploring the Function of Ion-Exchange Membrane in Membrane Capacitive Deionization via a Fully Coupled Two-Dimensional Process Model. Processes 2020, 8, 1312. https://doi.org/10.3390/pr8101312
AMA Style
Zhang X, Reible D. Exploring the Function of Ion-Exchange Membrane in Membrane Capacitive Deionization via a Fully Coupled Two-Dimensional Process Model. Processes. 2020; 8(10):1312. https://doi.org/10.3390/pr8101312
Chicago/Turabian StyleZhang, Xin, and Danny Reible. 2020. "Exploring the Function of Ion-Exchange Membrane in Membrane Capacitive Deionization via a Fully Coupled Two-Dimensional Process Model" Processes 8, no. 10: 1312. https://doi.org/10.3390/pr8101312
Note that from the first issue of 2016, this journal uses article numbers instead of page numbers. See further details here.