Article

Hydrodynamics and Mass Transfer Analysis in BioFlow® Bioreactor Systems

by
Marian Kordas
1,
Maciej Konopacki
1,
Bartłomiej Grygorcewicz
2,
Adrian Augustyniak
1,3,
Daniel Musik
1,4,
Krzysztof Wójcik
1,4,
Magdalena Jędrzejczak-Silicka
5 and
Rafał Rakoczy
1,*
1
Faculty of Chemical Technology and Engineering, West Pomeranian University of Technology in Szczecin, Piastów Avenue 42, 71-065 Szczecin, Poland
2
Department of Laboratory Medicine, Pomeranian Medical University in Szczecin, al. Powstańców Wielkopolskich 72, 70-111 Szczecin, Poland
3
Chair of Building Materials and Construction Chemistry, Technische Universität Berlin, Gustav-Meyer-Allee 25, 13355 Berlin, Germany
4
ESC Global Sp. z o.o., Słoneczny Sad 4F, 72-002 Dołuje, Poland
5
Faculty of Biotechnology and Animal Husbandry, West Pomeranian University of Technology in Szczecin, Janickiego Street 32, 71-270 Szczecin, Poland
*
Author to whom correspondence should be addressed.
Processes 2020, 8(10), 1311; https://doi.org/10.3390/pr8101311
Submission received: 13 September 2020 / Revised: 8 October 2020 / Accepted: 14 October 2020 / Published: 19 October 2020
(This article belongs to the Section Advanced Digital and Other Processes)

Abstract

:
Biotechnological processes involving the presence of microorganisms are realized by using various types of stirred tanks or laboratory-scale dual-impeller commercial bioreactor. Hydrodynamics and mass transfer rate are crucial parameters describing the functionality and efficiency of bioreactors. Both parameters strictly depend on mixing applied during bioprocesses conducted in bioreactors. Establishing optimum hydrodynamics conditions for the realized process with microorganisms maximizes the yield of desired products. Therefore, our main objective was to analyze and define the main operational hydrodynamic parameters (including flow field, power consumption, mixing time, and mixing energy) and mass transfer process (in this case, gas–liquid transfer) of two different commercial bioreactors (BioFlo® 115 and BioFlo® 415). The obtained results are allowed using mathematical relationships to describe the analyzed processes that can be used to predict the mixing process and mass transfer ratio in BioFlo® bioreactors. The proposed correlations may be applied for the design of a scaled-up or scaled-down bioreactors.

Graphical Abstract

1. Introduction

Bioreactors are defined as facilities that enable the efficient operation of microbiological processes by controlling culture parameters and managing its optimal conditions while limiting the possibilities of its contamination [1,2] Bioreactors are the main part of any biotechnological processes in which living microorganisms are applied to produce a wide range of desired bioproducts with maximal efficiency. Optimization of the biotechnological processes is directly linked to intensive research work in the field of construction equipment. The basic features of various types of bioreactors are described in Table 1.
In general, the industrial production may be carried out using bioreactors divided into three groups: (i) non-stirred and non-aerated systems (~76% of all bioreactors); (ii) non-stirred but aerated systems (~11% of all bioreactors); (iii) stirred and aerated systems (~13% of all bioreactors) [3] The last group of bioreactors (aerated and stirred vessels) can be called standard bioreactors. These stirred-tank bioreactors are equipped with a different type of impeller or impellers for mixing culture media and a sparger for delivering oxygen to the cells. The conventional mixing vessel has two main advantages: a low investment capital required to set up the bioreactor and low operating costs. These systems allow full automation and the execution of bioprocess in closed systems that can be monitored and maintained at defined operational conditions.
The nutrients concentration and bioreactor operation modes influence cell growth rates and the number of products synthesized within the bioprocess. They can influence cell growth and metabolite formation in cell factories, leading to substantially differentiated productivities. In general, the bioreactors can be classified as a tank, tubular, and column devices that operate in various modes, including batch, semi-continuous, fed-batch, and continuous operation. The operating parameters in a bioreactor depend on the type of operation. The main operating parameters characteristic to the three above-mentioned modes of bioreactor operation are presented in Table 2.
Many reactor systems for the bioproduction’s have been developed in recent years. Many of these systems are commercially available. The BioFlo® bioreactors are easy to use, entry-level systems equipped with built-in controls that can operate as a microbiological or cell culture reactor. This paper focuses on the performance of two BioFlo® systems (BioFlo® 115 and BioFlo® 415), considering both mixing properties and mass transfer ratio of these multi-impeller systems. Table 3 compares BioFlo® 115 and BioFlo® 415 bioreactors.
The BioFlo® systems may be treated as fully baffled bioreactors stirred by two six-blade Rushton turbines. The unequal distribution of shear forces and energy dissipation of mixed fluid is the main flaw that characterizes the standard single-impeller stirred tanks. Nevertheless, these types of forces generated by a single impeller may be useful when the destruction of the mixed multiphase structure is required in production processes. Such conditions may affect microorganisms and, therefore, the entire bioprocess. On the other hand, the shear-forces-mediated stress produced by multi-impeller systems is particularly important for biochemical processes. Moreover, the multi-impeller mixing system of the BioFlo® leads to more efficient gas distribution and gas phase residence time by an increased hold-up. Additionally, this system is characterised by a lower power consumption per impeller in comparison to single-impeller systems. These systems may also be used to avoid the dead zones formation in the mixed fluid.
The studies on hydrodynamics have been focused in recent decades on a better understanding of the complex effects generated by two Rushton-impeller-stirred tanks. Practical applications of the double-Rushton mixer have been researched for several years [4,5,6,7,8,9,10] The comparison of the multiple- and the single-impeller-based agitation systems with a special focus on their bioprocessing applications was presented in Ref. [11].
The mixing intensities in the case of dual-impeller-based bioreactors of the dual-impeller system comprising either two Rushton impellers or one Rushton and one axial flow impeller were presented in Ref. [12] Furthermore, the application of the Rushton impeller combined with axial flow impellers in bioreactors was discussed in Ref. [13] in the yeast cultivation model. The experimental studies concerning the mixing of non-aerated bacterial, yeasts, and fungal cultures in a bioreactor stirred with a double turbine impeller were presented in Ref. [14]. The pH-response-based method of the mixing time measurement was applied by Hadjiev et al. [15] where the influence of various parameters on the dimensionless mixing time in an aerated, dual-Rushton-stirred, laboratory-scale reactor was investigated. Moreover, Bouaifi and Roustan [16] discussed the experimental results on the power consumption, mixing time, and mixing energy in a non-standard vessel equipped with various axial and mixed dual-impeller configurations. The mixing characteristics (e.g., mixing time, homogenization energy, and residence time distribution) of a gas-induced reactor with two 45°-pitched downward blade turbines were analyzed by Jafari and Mohammadzadeh [17]. In addition, oxygen mass transfer characteristics for various twin- and single-impeller systems (e.g., Rushton turbine, pitched 4-, and 2-blade impellers) were studied by Karimi et al. [18], while the power consumption and the mixing time for the non-baffled agitated vessel with a double impeller were measured by Hiraoka et al. [19], who later discussed the best set-up position and the combination of impellers. Many effects, including floating solids concentrations, the diameter of the impeller used, and the off-bottom clearance of the impeller were analyzed in Ref. [20] They also discussed the spacing between impellers concerning the critical speed of the impeller, power consumption, and mixing time. These were all recorded in the dual-impeller agitated vessel. Moreover, Woziwodzki et al. [21] indicated that the viscosity can also have an effect of the mixing parameters, which they measured in a system containing a dual eccentrically located impeller.
Based on the literature search in scientific databases (Scopus, Sciencedirect, NCBI), we assume that the research concerning the analysis of the mixing process in BioFlo® systems has not yet been performed. Therefore, we aimed at analyzing the power consumption, mixing time and energy (or homogenization energy), and mass transfer coefficient for the BioFlo® 115 and BioFlo® 415 bioreactors used under gassed and ungassed conditions.

2. Experimental Set-Up

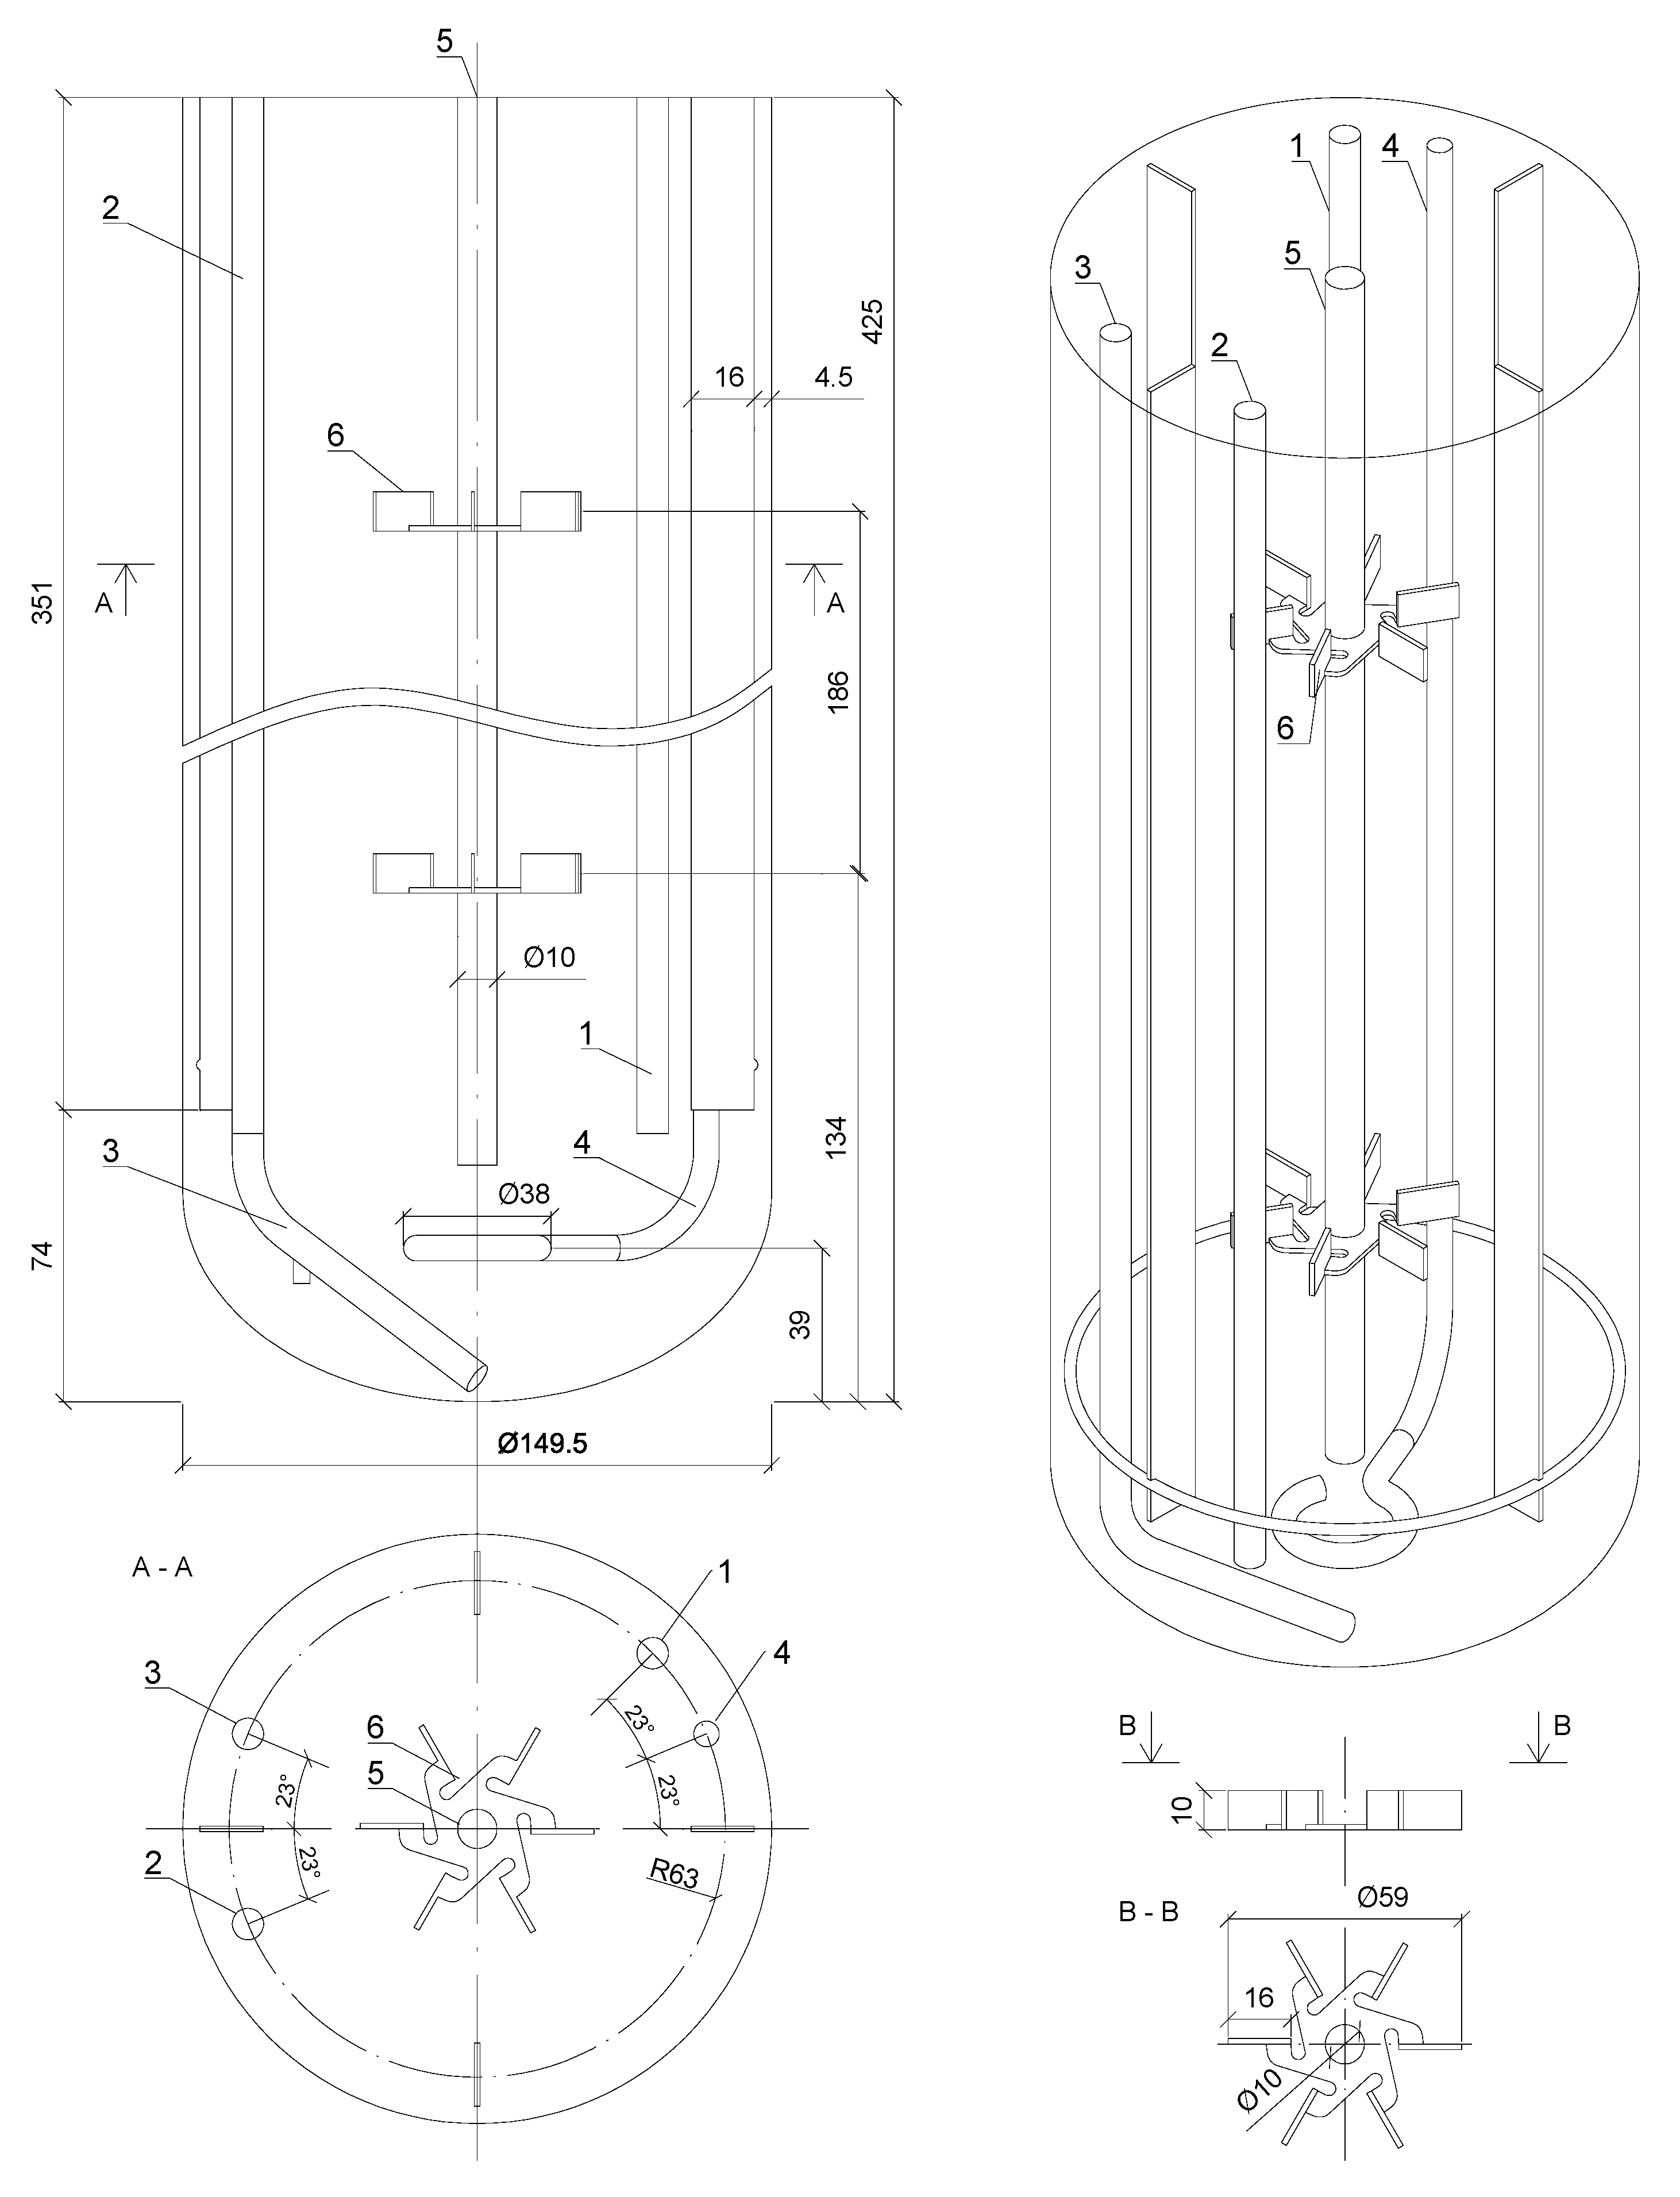
A widespread laboratory-scale stirred dual-Rushton bioreactor system marketed by BioFlo® was used in the experiments. Schematic design and the main geometrical parameters of BioFlo® 115 (Eppendorf, Enfield, CT, USA) and BioFlo® 415 (Eppendorf, Enfield, CT, USA) apparatus are presented in Figure 1 and Figure 2, respectively.
The measurements of the mixing process for BioFlo® 115 were performed in a cylindrical glass vessel with the liquid height-to-vessel-diameter ratio equal to 1.45 (HL = 180 mm; D = 124.5 mm; working volume V = 2 dm3). In the case of BioFlo® 415, the ratio was equal to 2.31 (HL = 345 mm; D = 149.5 mm; working volume V = 5.5 dm3).
Distilled water served as the experimental liquid. The mixing process in both BioFlo® systems was carried out under different values of dual-Rushton turbine rotation speed (n = 0.33–10 s−1). The dimensionless Reynolds number, Re = n d 2 ν 1 , calculated for BioFlo® 115 and BioFlo® 415 was varying in the range 900–27,000 and 2930–35,150, respectively.

3. Flow Patterns in BioFlo® Systems

The visual representation of fluid flow patterns in a stirred vessel can be generated by the use of the computational fluid dynamics (CFD) technique. The numerical simulations, with the help of CFD codes, give access to qualitative and quantitative parameters describing the mixing performance and hydrodynamics of the agitated systems. The numerical methods have led to the development of differential equations and have built distributed parameter models that are also spatially and temporally representative for the tested systems. The possibility of using CFD for the numerical simulation of the flow distribution in a mixer can significantly contribute to the understanding of the mixing processes and to providing better, faster, and cheaper optimization design [22]. This study utilized the CFD method to describe the mixing process and to analyze velocity profiles and flow patterns in the BioFlo® systems.
The geometry of the bioreactors was generated using AutoCAD software. (An identical computational model of geometries was created, which consists of 1.8 and 1.9 million tetrahedral volume elements for BioFlo® 115 and BioFlo® 415, respectively.) These geometries were imported to Design Modeler and introduced to ANSYS Meshing software to generate a CFD mesh. In the next step, the commercial CFD package ANSYS Workbench 14.5 was used to calculate the liquid flow based on the numerical computations. Flow patterns were calculated using ANSYS CFX software. The control-volume formulation was used to solve the equations of mass and momentum conservation. Reynolds-averaged Navier-Stokes (RANS) equations with the k-ω turbulence-closure model could be successfully solved with the three-dimensional finite volume CFD code. Applying appropriate corrections in the numerical approach allowed us to compute laminar and turbulent flows in the static mixers. The basic two-equations k-ω model was first introduced by Wilcox [23]. In our variant, we have introduced modifications in the model for low-Reynolds number effects, as well as compressibility and shear flow spreading. The multiple reference frame (MRF), which is a common approach in turbomachinery modelling (e.g., mixers), was employed during the CFD analysis. It consists of at least two zones—stationary and rotating (around the impeller). Specific equations were calculated inside each zone and data were exchanged at the interface. Such an approach assumed no relative motion; thus, it was similar to analyzing the instantaneous flow field with the impeller in its freeze position. The rest of the boundary conditions were set to walls, and only the liquid top surface was set with the degassing conditions.
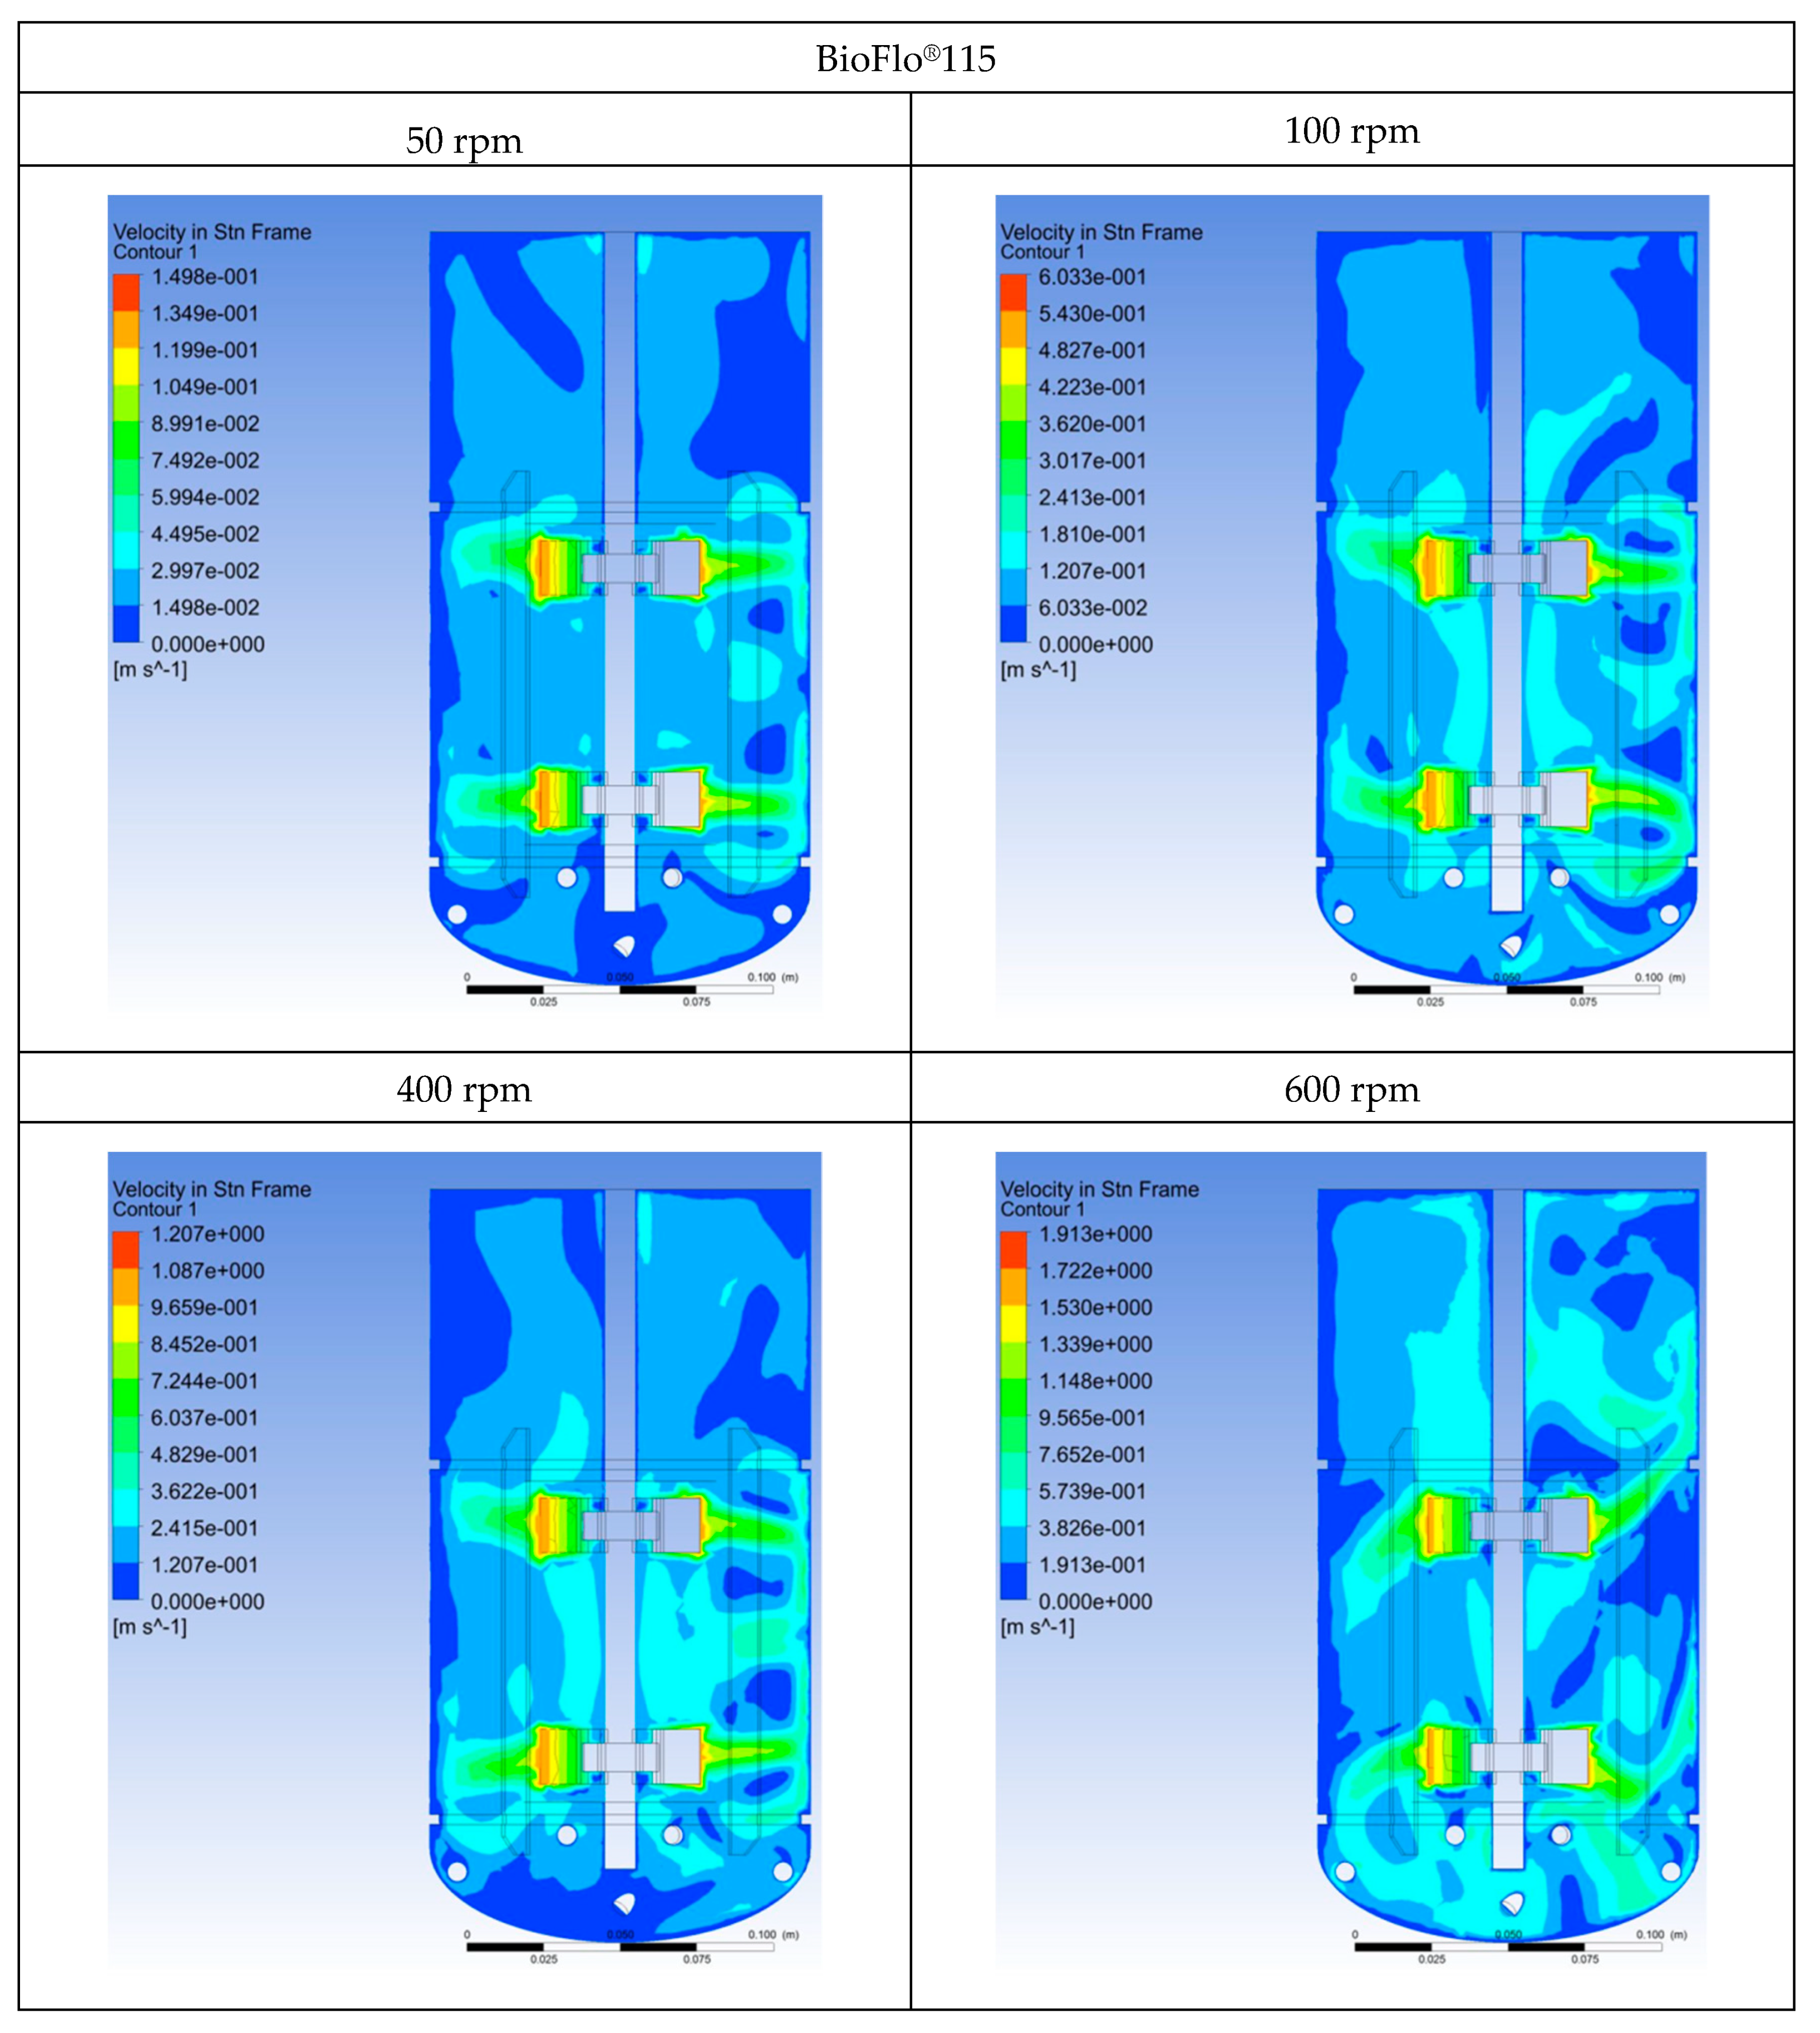
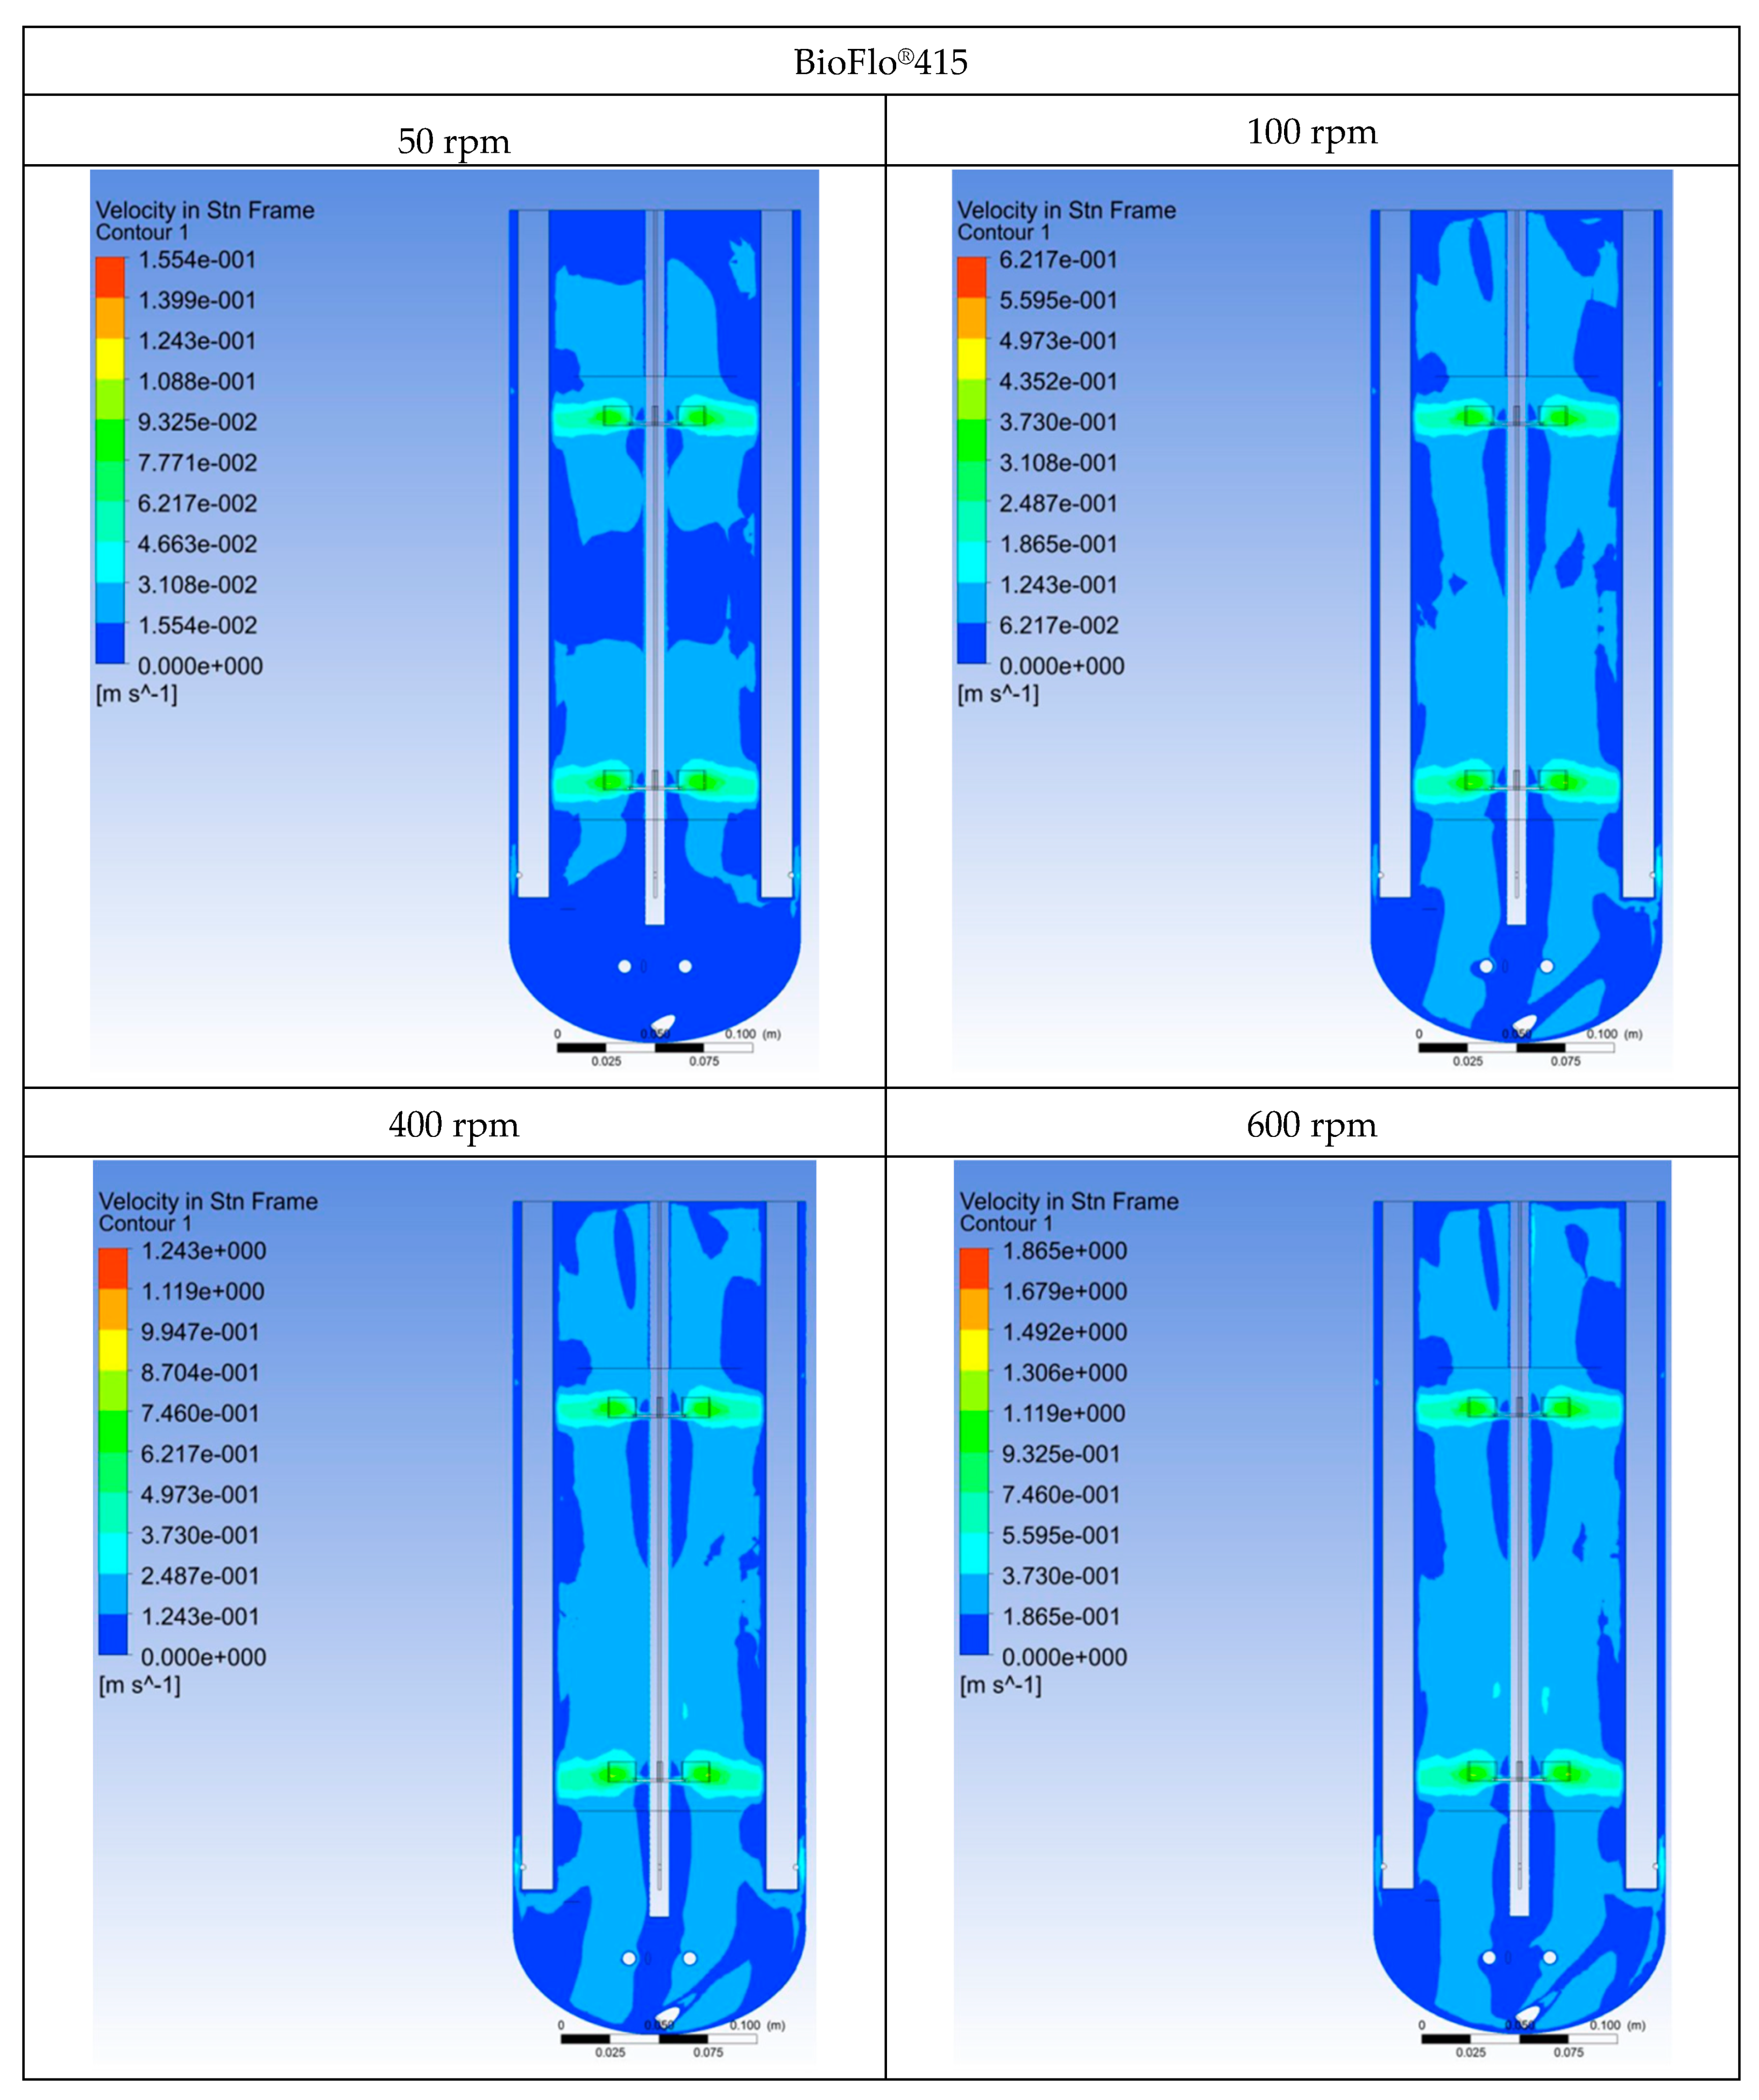
The typical computational velocity profiles for the tested bioreactors are presented in Figure 3. This figure shows the differences between the flow field calculated at N = 50, 200, 400 and 600 rpm, respectively. To ease the analysis of the three-dimensional hydrodynamics, the velocity was shown as the two-dimensional scheme. When the residuals for equations of continuity and momentum reached a value below 10−7, the convergence was assumed in each simulation.
It is well known that impeller spacing may affect the flow pattern in the stirred tanks [24]. For the double-impeller agitator, the flow pattern strongly depends on the geometry combinations (e.g., clearance from the bottom and above the upper impeller, as well as the reactor and impeller geometry) and the mutual influence of the two impellers. Moreover, the observed flow patterns were influenced by impeller characteristics, the presence of the baffles, and the additional tubes.
The use of two Rushton turbines developed independent flow patterns characterized by greater impeller clearance than the impeller diameter [9]. In the case of this study, the impeller spacing and the impeller diameter ratios were equal to 1.46 and 3.15 for BioFlo® 115 and BioFlo® 415, respectively. Therefore, each turbine was characterized by a parallel flow pattern where specific upper and lower ring vortices led to four stable ring vortices formation. It should be noted that impellers produce a radial jet outward divided into the near-wall streams. Additionally, the high shear forces and the rapidly mixing turbulent regions were generated near the impellers. These regions could be responsible for the enhancement in mass transfer in the gas–liquid systems. Moreover, the correct assignment of the strong mixing regions inside the bioreactor may be essential for the development of bioprocesses that use cells sensitive to shear forces.
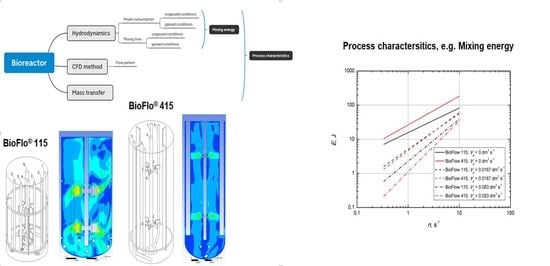
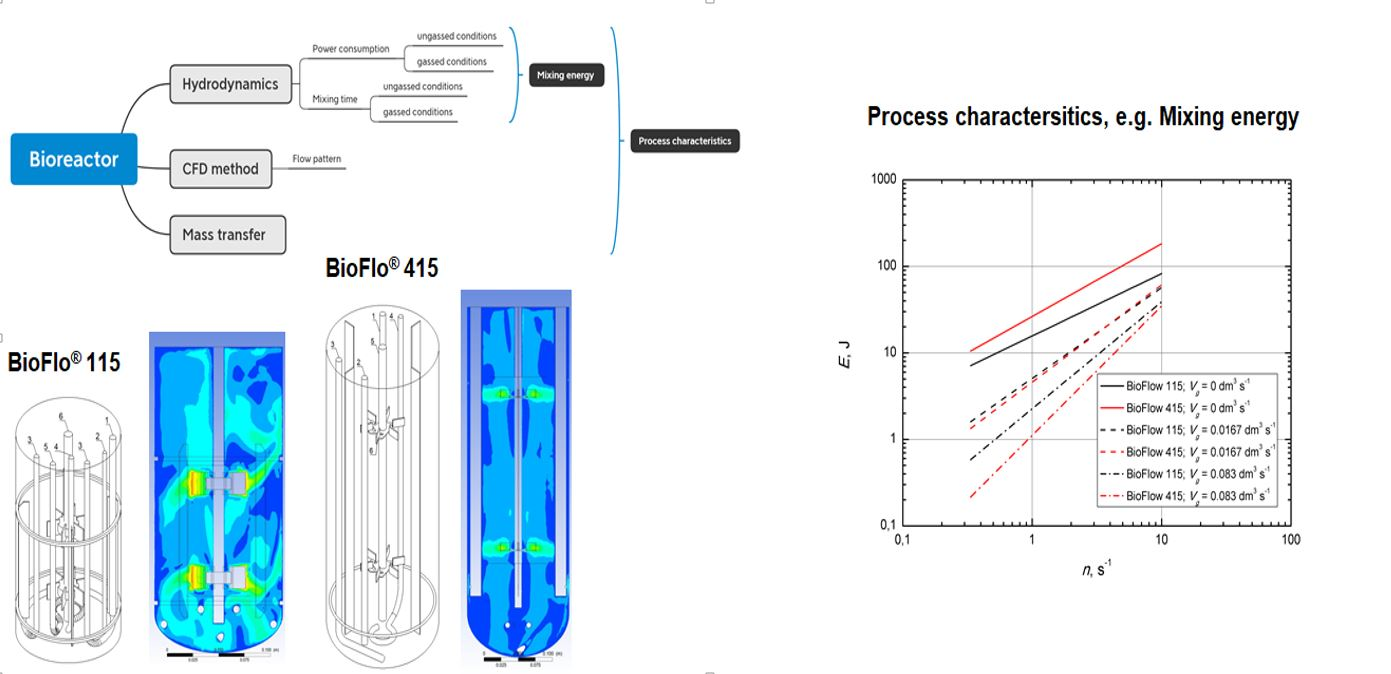
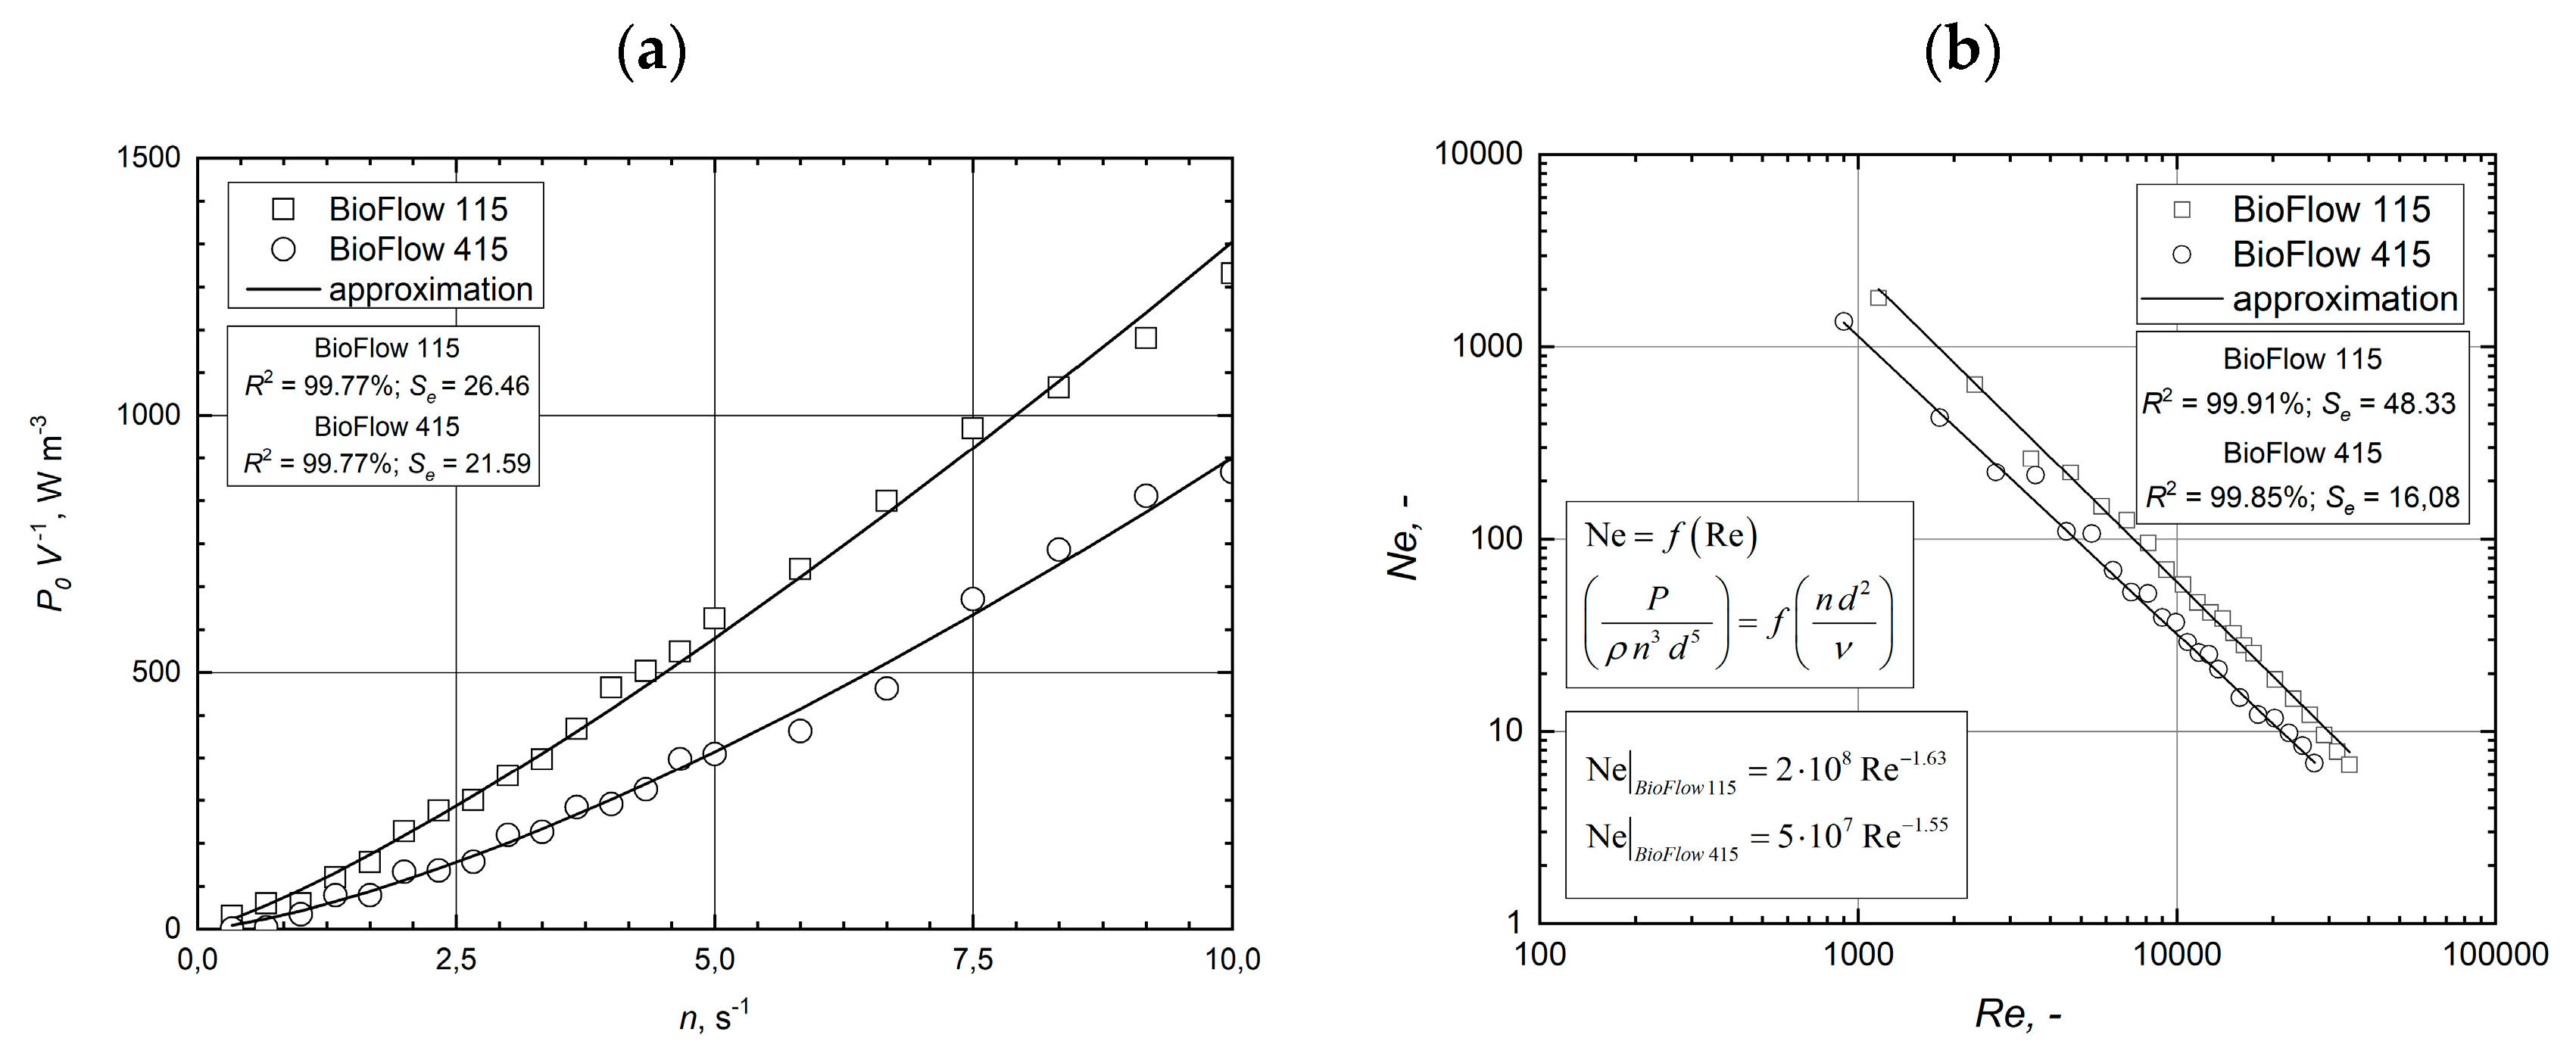
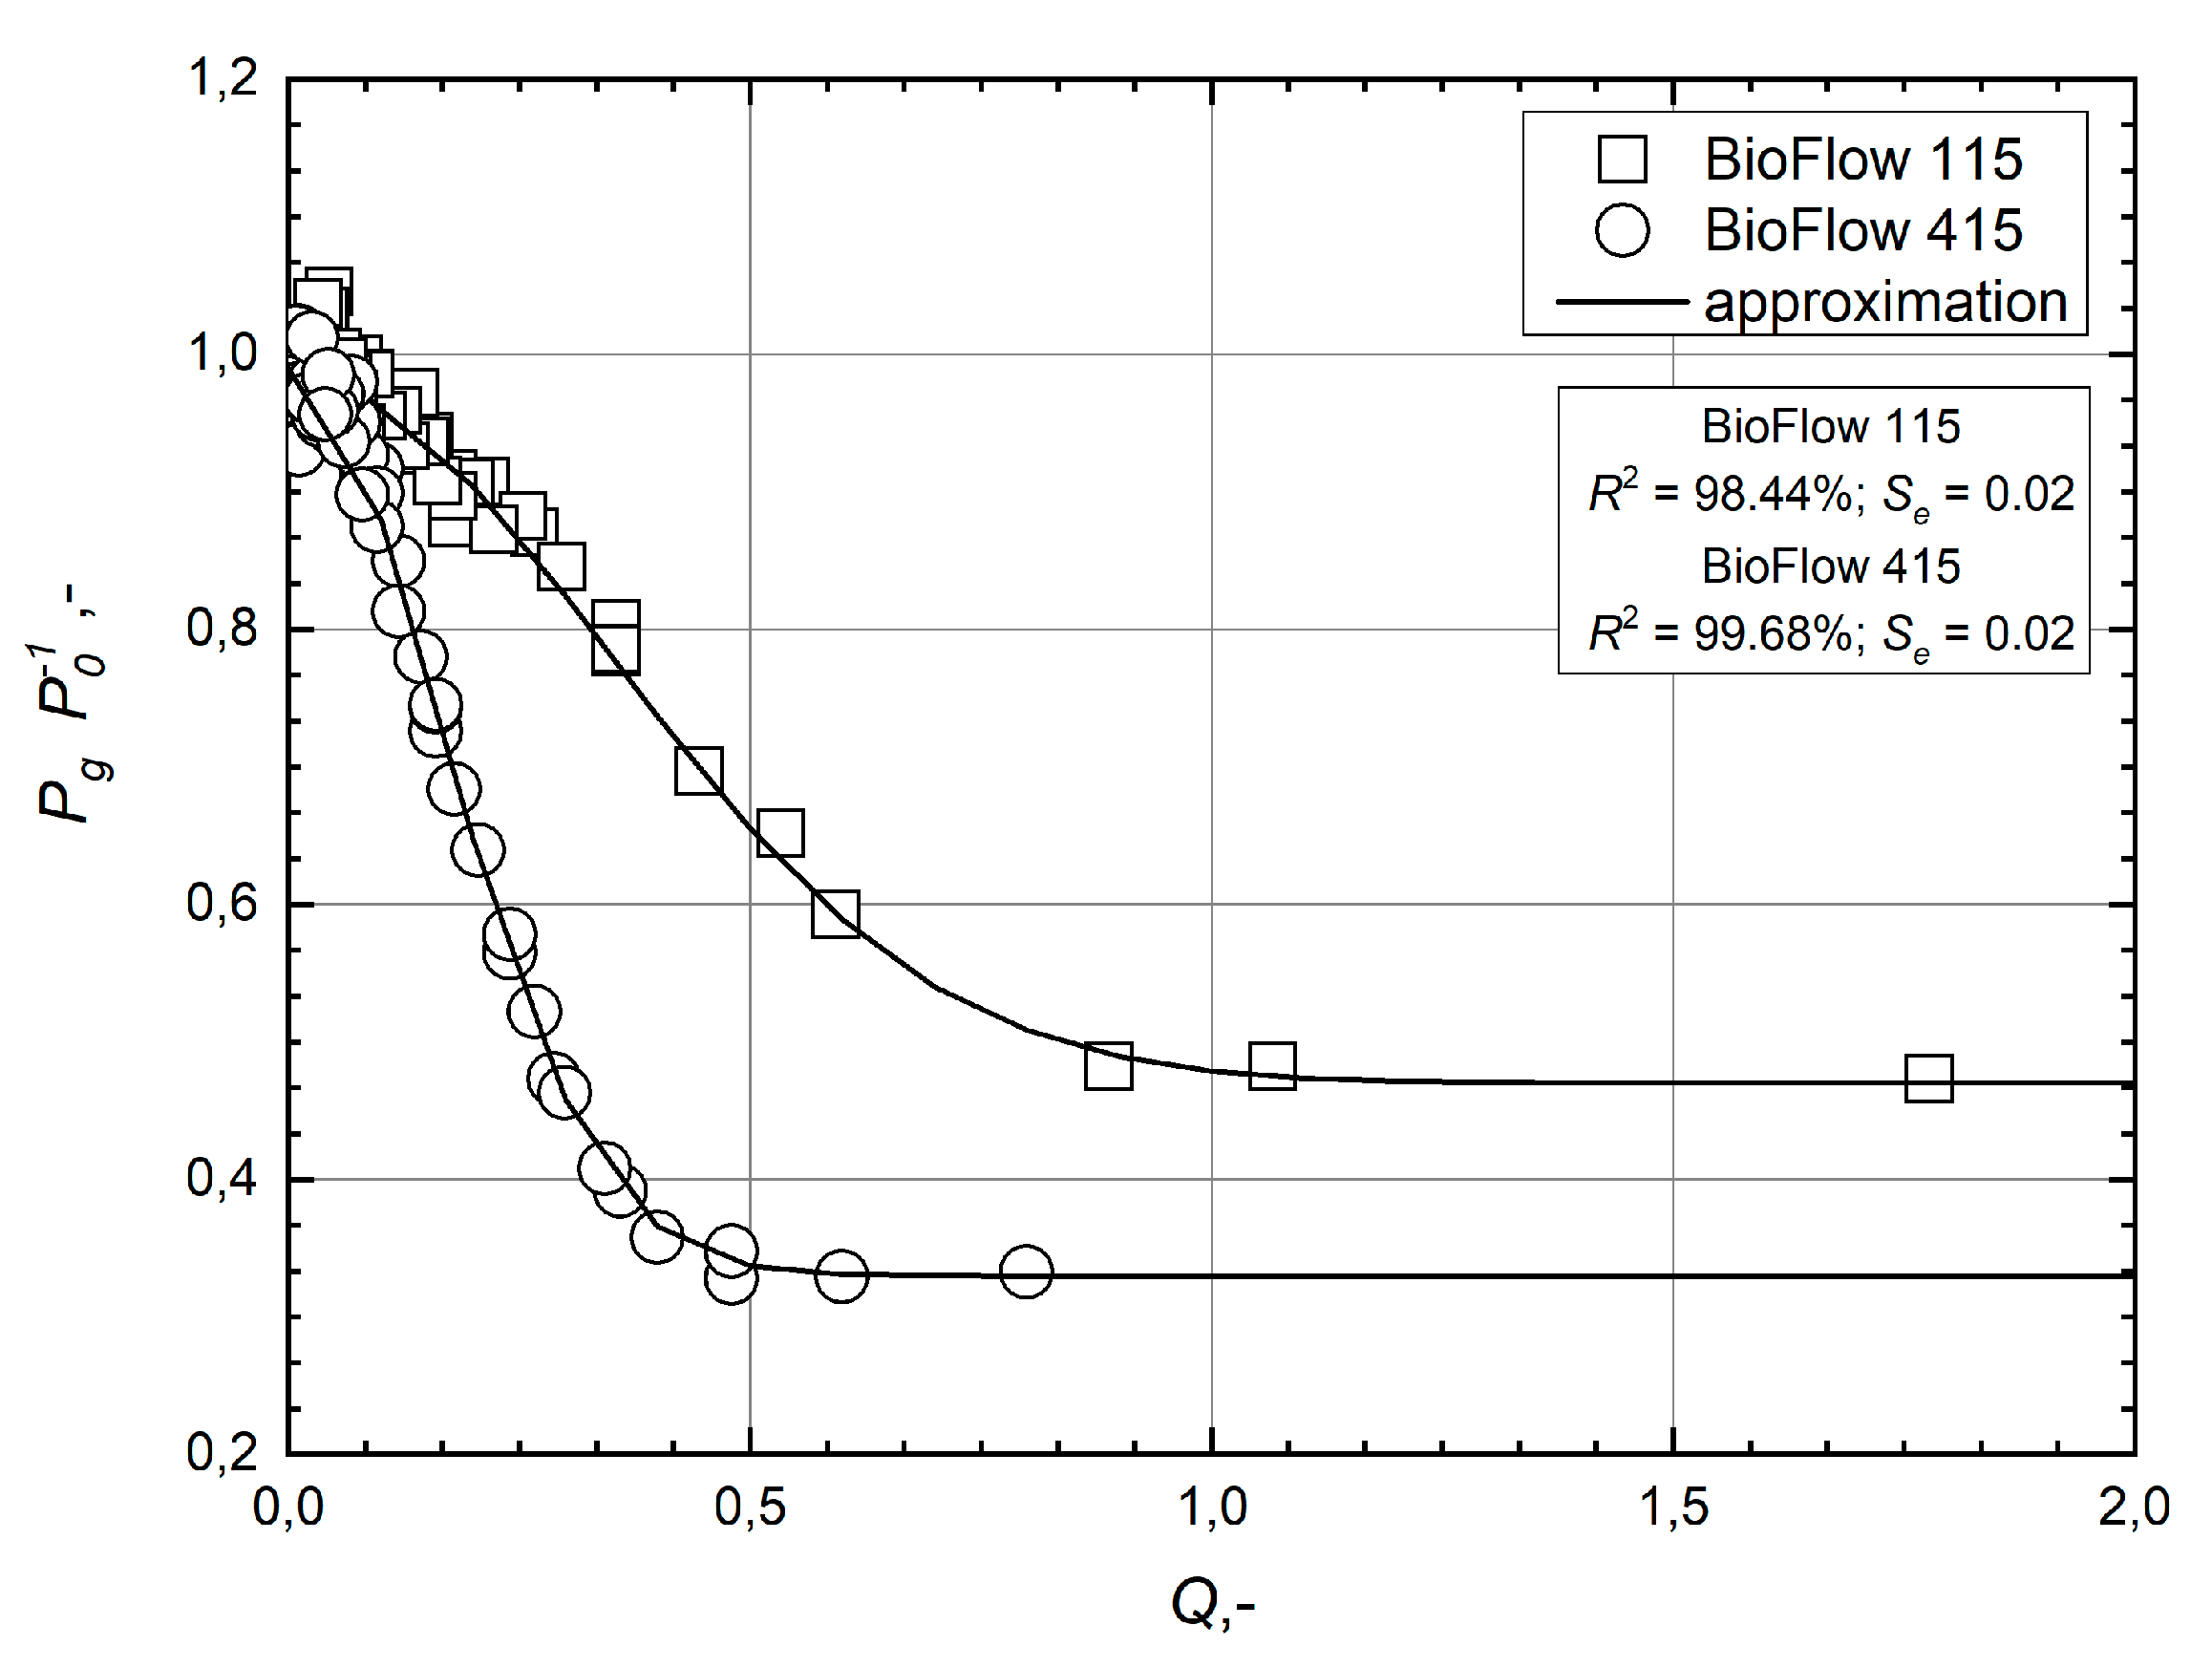
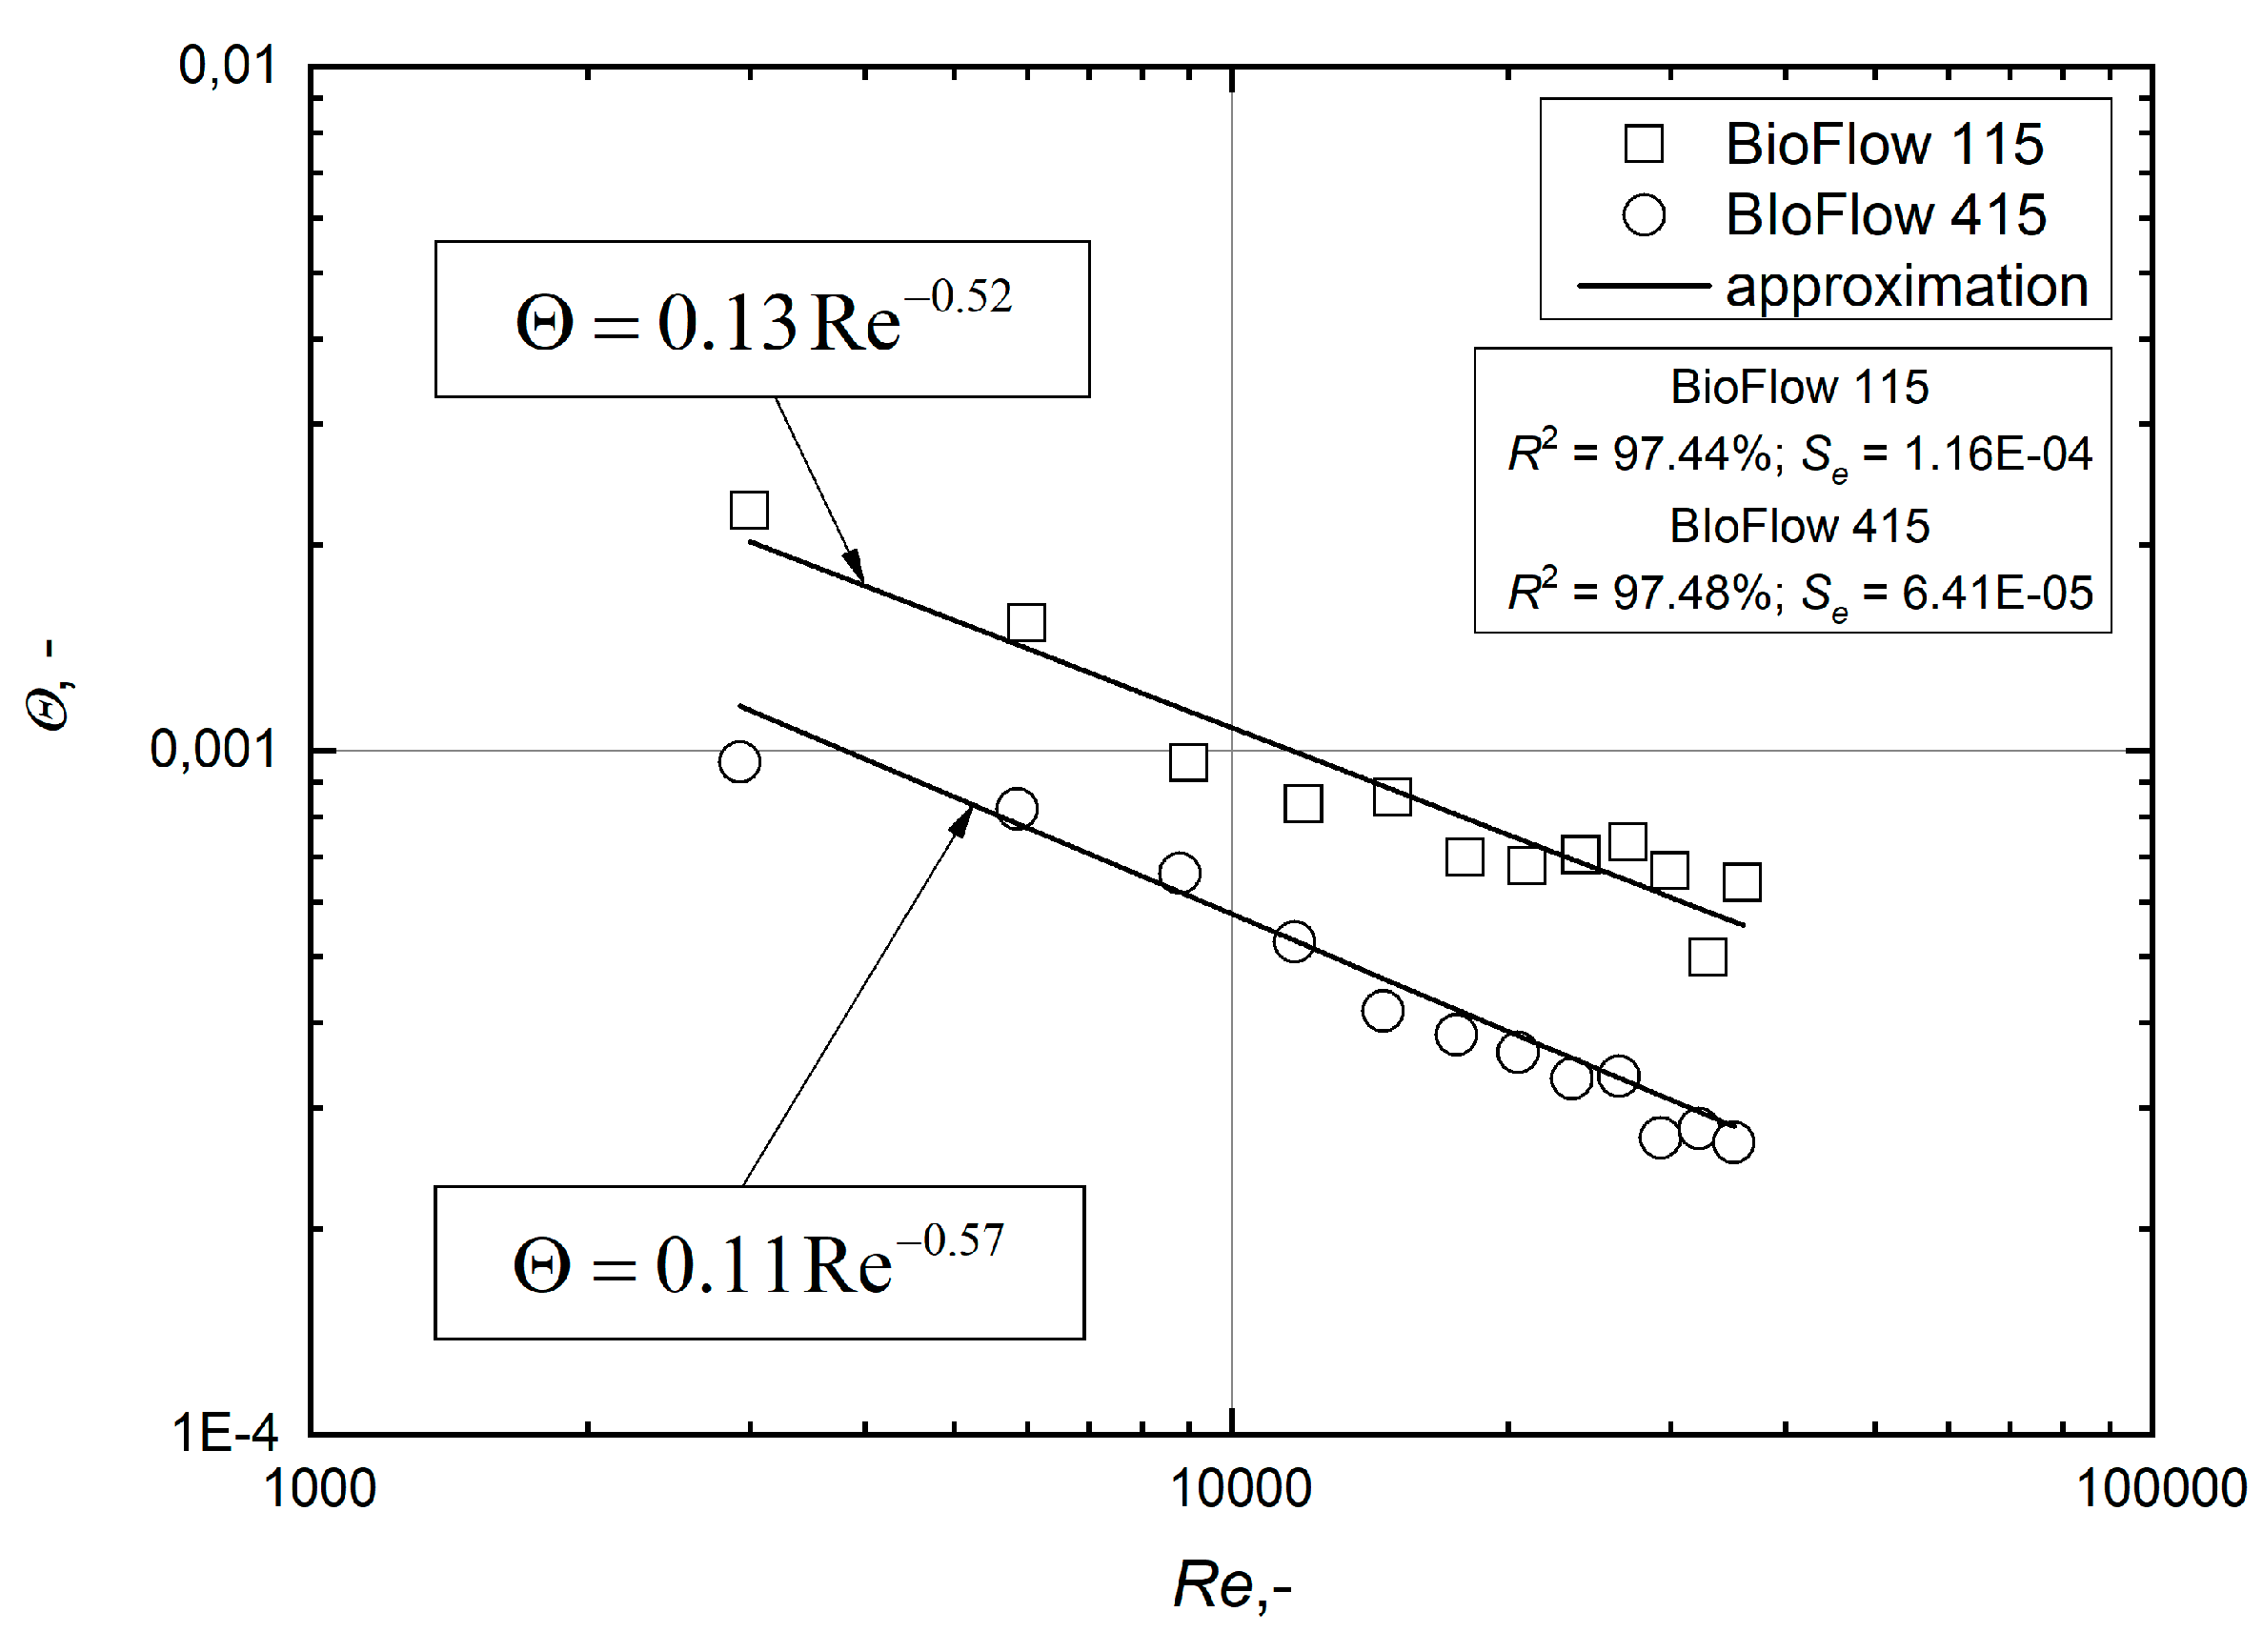
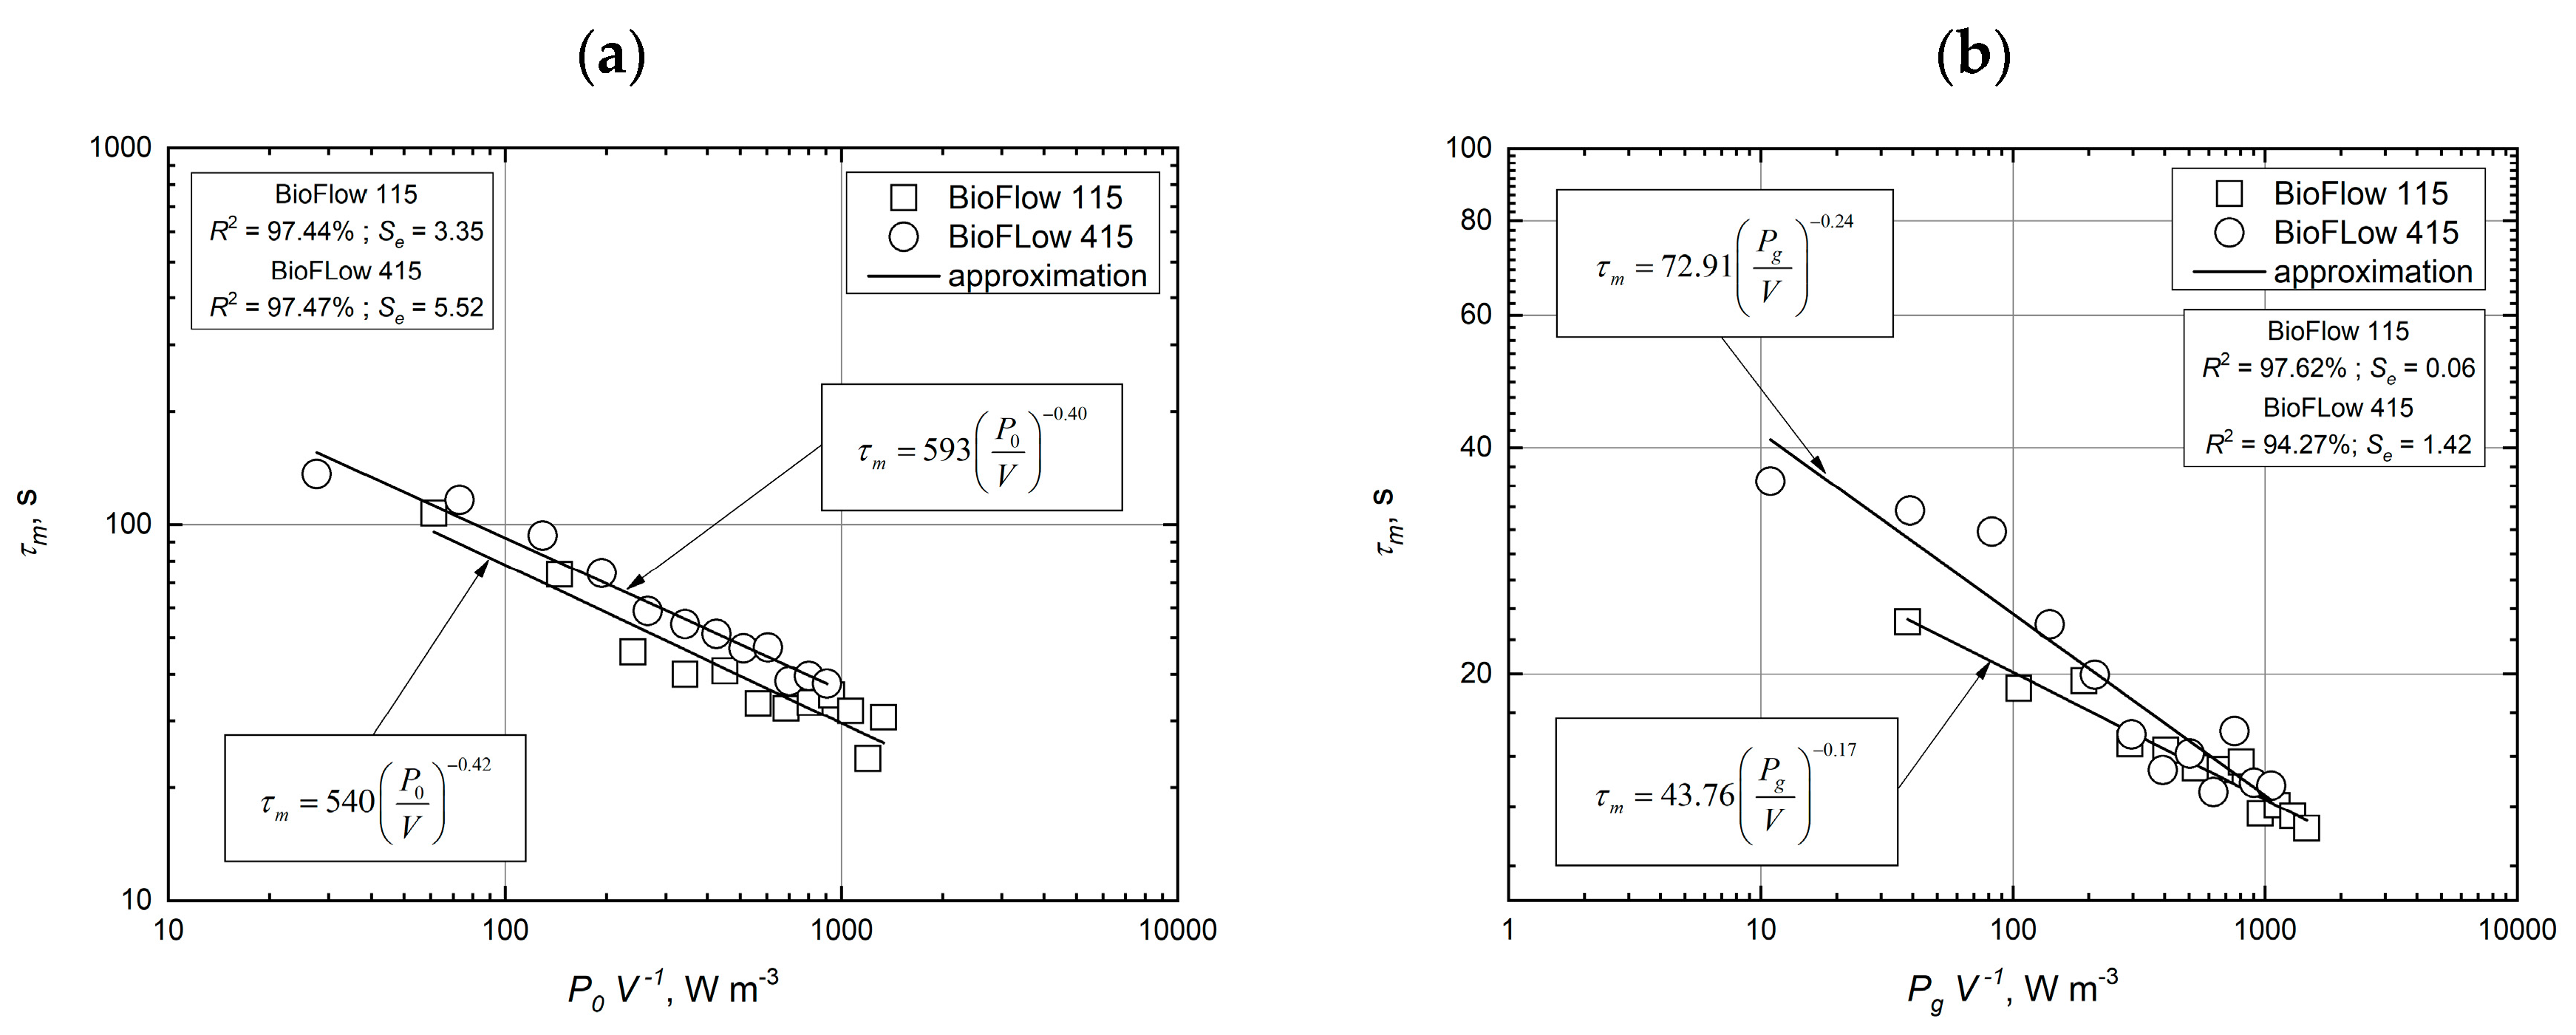
4. Power Consumption

4.1. Measuring Power Consumption

Power consumption is an important parameter in bioprocess engineering that has a strong influence on cost-effectiveness. To ensure optimal productivity, power draw must be optimized. Power draw is the energy necessary to move the fluid within a bioreactor using mechanical agitation in a period. Power draw in the tested systems was directly measured using a wattmeter. In this study, the dual Rushton impellers power intake in the absence of fluid was measured for agitation speeds ranging between 50 and 600 rpm. This value was subtracted from the liquid-filled reactor measurements. Moreover, a correction concerning the efficiency of the applied motor has been taken into account [25,26].

4.2. Power Consumption for Ungassed Conditions

Power consumption was presented as the specific power consumption, P0 V−1. This allowed us to obtain a better view of the system’s mixing performance under the studied configurations. Power intake is one of the most essential factors, especially in the scale-up process of mixing systems. This parameter consists mainly of the impeller’s quantity, rotor types, stirring velocity, fluid properties, the reactor geometry, and the number of phases to be dispersed. Figure 4a shows the calculated specific power consumption for both BioFlo® systems. Additionally, the power characteristics Ne = f (Re) for the tested bioreactors are compared (see Figure 4b). The calculated values of the specific power consumption and the power number were approximated using the relationships applied in the stirring theory [27] The adjustment of the proposed function parameters was performed using the Matlab software. The values of these parameters were approximated using the least-squares method. The coefficient of determination R2 and the standard error of estimate Se were applied to evaluate the approximation quality for the proposed mathematical function.
The general form of the power intake under ungassed conditions can be described as:
( P 0 V ) n
Based on the recorded values of power draw for BioFlo® 115 and BioFlo® 415, the specific power consumption has the following form:
( P 0 V ) | B i o F l o w 115 = 76.94 n 1.24
( P 0 V ) | B i o F l o w 415 = 35.71 n 1.41
The influence of the mixing intensity (proportional to rotation speed) on the specific power consumption is helpful in the economic prediction of the production costs. The variance between these characteristics for BioFlo® systems sharply increases with the enhancement of the impeller rotation speed (specific power characteristics for the BioFlo® 415 are placed below). Therefore, it is possible with this bioreactor to carry out the mixing process for the tested flow region while maintaining a lower power draw. The lowest power consumption and the shortest overall mixing time were present with the merging flow (a flow pattern with two main circulations in a multiple-impeller stirred tank). In the reactors with the high power consumption caused by intensive mixing, a parallel flow regime is preferable [28].

4.3. Power Consumption for Gassed Conditions

To test BioFlo® systems, we need to understand their mixing, power, and energy dissipation characteristics. The impeller power consumption in the case of aerated systems is lower than in unaerated systems. The power consumption of the impeller is greatly influenced by aeration. The lower values of power consumption in unaerated systems result from the cavities that are formed behind the impeller blades. The difference between the fluid’s density under ungassed and gassed conditions may also influence the power consumption.
In aerated systems, the actual power input is described by the ratio Pg/P0 during the bioprocess operation and also can give insight into the impeller’s gas dispersion characteristics. From the practical point of view, the hydrodynamics of the gas–liquid flow in the tested mixing systems may be defined by the following general relationship:
( P g P 0 ) Q 1 ( P g P 0 ) ( V g n d 3 ) 1
where Q is the dimensionless flow number. Figure 5 shows the measured Pg/P0 as a function of Q.
The influence of the dimensionless flow number on the ratio Pg/P0 may be written in the following way (solid lines in Figure 5; the approximation was carried out by using the Matlab Software):
( P g P 0 ) | B i o F l o w 115 = 0.47 + 0.51 exp ( 4.05 Q 2 )
( P g P 0 ) | B i o F l o w 415 = 0.33 + 0.66 exp ( 18.26 Q 2 )
The results in Figure 5 illustrate how the calculated values of the Pg/P0 ratios for the tested BioFlo® systems decrease with the dimensionless flow number. The power consumption under gassed conditions is significantly lower and is distinct from that of the ungassed conditions. Furthermore, the gassed power reductions can vary considerably for the various mixing systems. At the beginning of aeration, the ratio Pg/P0 decreased very steeply at lower airflow rates expressed with the dimensionless Q number. Then, the decrease became much slighter with the increase in the airflow. The reduction of the ratio of aerated to unaerated power consumption was much greater for the BioFlo® 415 mixing system. The difference between the ratios Pg/P0 for BioFlo® 115 and BioFlo® 415 could be caused by the impellers’ mutual location on the common shaft. The higher drop in the relevant power consumption was observed in the case of the BioFlo® 415 mixing system.
The difference between the relative power for the tested mixing systems may also result from these bioreactors’ geometrical parameters, e.g., the slender values defined as the ratio S = HL/D for BioFlo® 115 and BioFlo® 415 are equal to 1.45 and 2.31, respectively. Moreover, the clearances between the impellers for BioFlo® 115 and BioFlo® 415 are equal to 1.47 and 3.15, respectively. Therefore, the various flow patterns and regimes may be developed using the tested bioreactors under the aerated conditions. In the gas–liquid applications, the lower impeller near the sparger is exposed to different stages (e.g., flooding, loading, or recirculation), where the upper impeller is rarely flooded upon increasing stirring speed [11] In the case of the dual impeller systems, the lower Rushton turbine may act as a gas distributor, which stabilizes the upper turbine’s flow behaviour.

4.4. Comparison of Power Draw for Gassed Conditions

In the present paper, the specific power consumption for gassed conditions, Pg/V, may be interpreted in the following general form:
( P g V ) = f ( V g , n )
It should be noted that the specific power consumption for ungassed conditions P0/V may be approximated employing the function ( P 0 V ) = p 1 n p 2 , where p1 and p2 are parameters. Following the analysis of experimental data, the specific power consumption for gassed conditions may be described with the following relationship:
( P 0 V ) = p 1 ( V g ) n p 2 ( V g )
where parameters p1 and p2 are functions of the gas flow rate in the tested bioreactors.
Based on the outcome of experimental part the magnitude Pg/V can be described by means of the unique monotonic functions (the constants and the exponents in the obtained relationships were computed employing the Matlab software):
( P g V ) | B i o F l o 115 = [ 28.89 ( V g ) 0.22 ] n [ 1.81 ( V g ) 0.08 ]
( P g V ) | B i o F l o 415 = [ 4.74 ( V g ) 0.47 ] n [ 2.61 ( V g ) 0.14 ]
The analysis of the specific power draw in the aerated systems for operating conditions was proposed as a dimensionless ratio as follows:
( P g V ) | B i o F l o w 115 [ ( P g V ) | B i o F l o w 415 ] 1 = f ( V g , n )
Figure 6 presents this relation (see Equation (7)) as the function of dual-Rushton turbine rotation speeds for the various gas flow rate.
As can be seen, the dimensionless ratio (see Equation (7)) decreases with the decreasing impeller speed values. Figure 6 demonstrates that the proposed ratio increases with the increasing gas flow rate for the lower impeller speed values. It was observed that the specific power draw under gassed conditions for all the tested bioreactors is not dependent on the gas flow rate for n > 7.5 s−1.

5. Mixing Time

5.1. Mixing Time Measurements

The mixing time was determined in tracer experiments based on the chemical-response technique. One hundred millilitres of NaCl solution (0.1 mol dm−3) was used as the tracer and injected into the system. The tested BioFlo® mixing systems were equipped with the pH probes. In the case of the present investigation, the tracer was added from the top of the liquid or dispersion surface, while the detection device was located in the plane of the lower impeller, near the wall. The injection point and the position of the probe were on the opposite sites of the reactor. Every 1 s, an output signal was recorded by the central unit. The mixing time was defined as the time from the determined tracer’s release until the pH of the tracer when the mixed liquid reached 95% of the final concentration. The mixing time measurements were carried out at 20 °C.

5.2. Mixing Time Measurements under Ungassed Conditions

The mixing time is one of the most useful criteria for mixing intensity of the process of employing microorganisms. It is also useful for the scale-up of bioprocesses. This parameter is dependent on the geometrical parameters of the bioreactor or mixing system, and operational factors (e.g., conditions, physical characteristics of the mixed liquid, power draw, mixing energy). The description of gathered data can be described by the relationship between the dimensionless mixing time and Reynolds number (Equation (8)) [29,30]:
Θ Re ( τ m ν L 2 ) ( n d 2 ν )
where L2 = HL2 + D2.
The influence of hydrodynamic conditions on the mixing time calculated under non-gassed conditions is presented in Figure 7.
The experimental results in Figure 7 suggest that a unique monotonic function may analytically describe the dimensionless mixing number for the tested mixing systems versus Reynolds number:
Θ = a Re b
The constant and exponent were computed with the principle of least-squares in Matlab software (Figure 7). There was a decrease in the dimensionless mixing time within the scatter limits among the plotted data (points). However, the turbulence was increasing. It should be underlined that the mixing time may be a criterion for the comparison of mixing performance of different bioreactors. In the case of the BioFlo® 415, the dimensionless mixing time was reduced by ~73% in comparison to the BioFlo® 115.

5.3. Effect of Gassing on Mixing Time

The mixing time in the aerated system was described by the relationship between the dimensionless mixing time and the operational parameters such as hydrodynamic conditions. The dimensionless mixing time in this case was described by:
Θ g = f ( Re , Q )
The data obtained by the use of the relationship proposed in Equation (14) is presented in Figure 8. Furthermore, the calculated values of the dimensionless mixing time for gassed conditions (marked as points in Figure 8a,b) are approximated by the following relationship:
Θ g = c Re d Q e
The influence of operational parameters on the dimensionless mixing number Θ g may be written in the following form (the constants and the exponents in the obtained relationships were computed in the Matlab software):
Θ g | B i o F l o w 115 = 0.03 Re 0.51 Q 0.28
Θ g | B i o F l o w 415 = 0.10 Re 0.76 Q 0.41
The obtained relationships (12a) and (12b) are presented as a meshed surface in Figure 8a and 8b, respectively.
The following relationship was proposed to calculate the synergistic effect of the hydrodynamic conditions and the dimensionless flow number on the dimensionless mixing number:
Θ g = c Re d Q e
The influence of operational parameters on the dimensionless mixing number Θ g may be presented in the following form (the constants and the exponents in the obtained relationships were computed employing the Matlab software):
Θ g | B i o F l o w 115 = 0.03 Re 0.51 Q 0.28
Θ g | B i o F l o w 415 = 0.10 Re 0.76 Q 0.41
The obtained correlations indicated the significant influence of the flow and Reynolds numbers on the dimensionless mixing number. The turbulence generated by the dual-Rushton impeller were so large that the additional gas low rate caused a decrease in the dimensionless mixing number.
Figure 8c shows a strong increase in dimensionless mixing time for BioFlo® 115, depending on the selected operational conditions. The data analysis indicated that BioFlo® 415 was more effective for liquid mixing than BioFlo® 115. This advantage was observed for the whole region of the mixing intensity. The discrepancy in the proposed dimensionless ratio, ( Θ g ) | B i o F l o w 115 [ ( Θ g ) | B i o F l o w 415 ] 1 , that was rising together with the increasing dimensionless flow number and the intensity of the mixing process.

5.4. Comparison of Mixing Time under Ungassed and Gassed Conditions

Mixing time was defined as the time required to reach the desired degree of homogeneity. Figure 9 shows the typical effect of the specific power consumption under ungassed and gassed conditions on the mixing time.
The influence of the specific power consumption of BioFlo® 115 and BioFlo® 415 on the mixing time under ungassed conditions is presented in Figure 9a. The mixing time steadily decreased with the observed values of P0 V−1. The comparison between the two tested systems shows that the mixing was consequently approximately 40% higher in the case of BioFlo® 415 than obtained for BioFlo® 115. The results shown in Figure 9b suggest a significant influence that the gas flow rate had on the mixing time. At higher values of the specific power consumption under gassed conditions, the difference between the mixing time values for both bioreactors was less than for the lower ratio Pg V−1.

6. Mixing Energy

The power consumption and mixing time can be determined form the adequate analytical correlation (ungassed conditions: power consumption—Equations (2) and (3)—and mixing time—Equation (13) (Figure 7); gassed conditions: power consumption—Equations (9) and (10)—and mixing time—Equations (16) and (17)).
The general formula for this parameter was assumed as follows:
E = P t m E = P 0 τ m | 0 or E = P g τ m | g
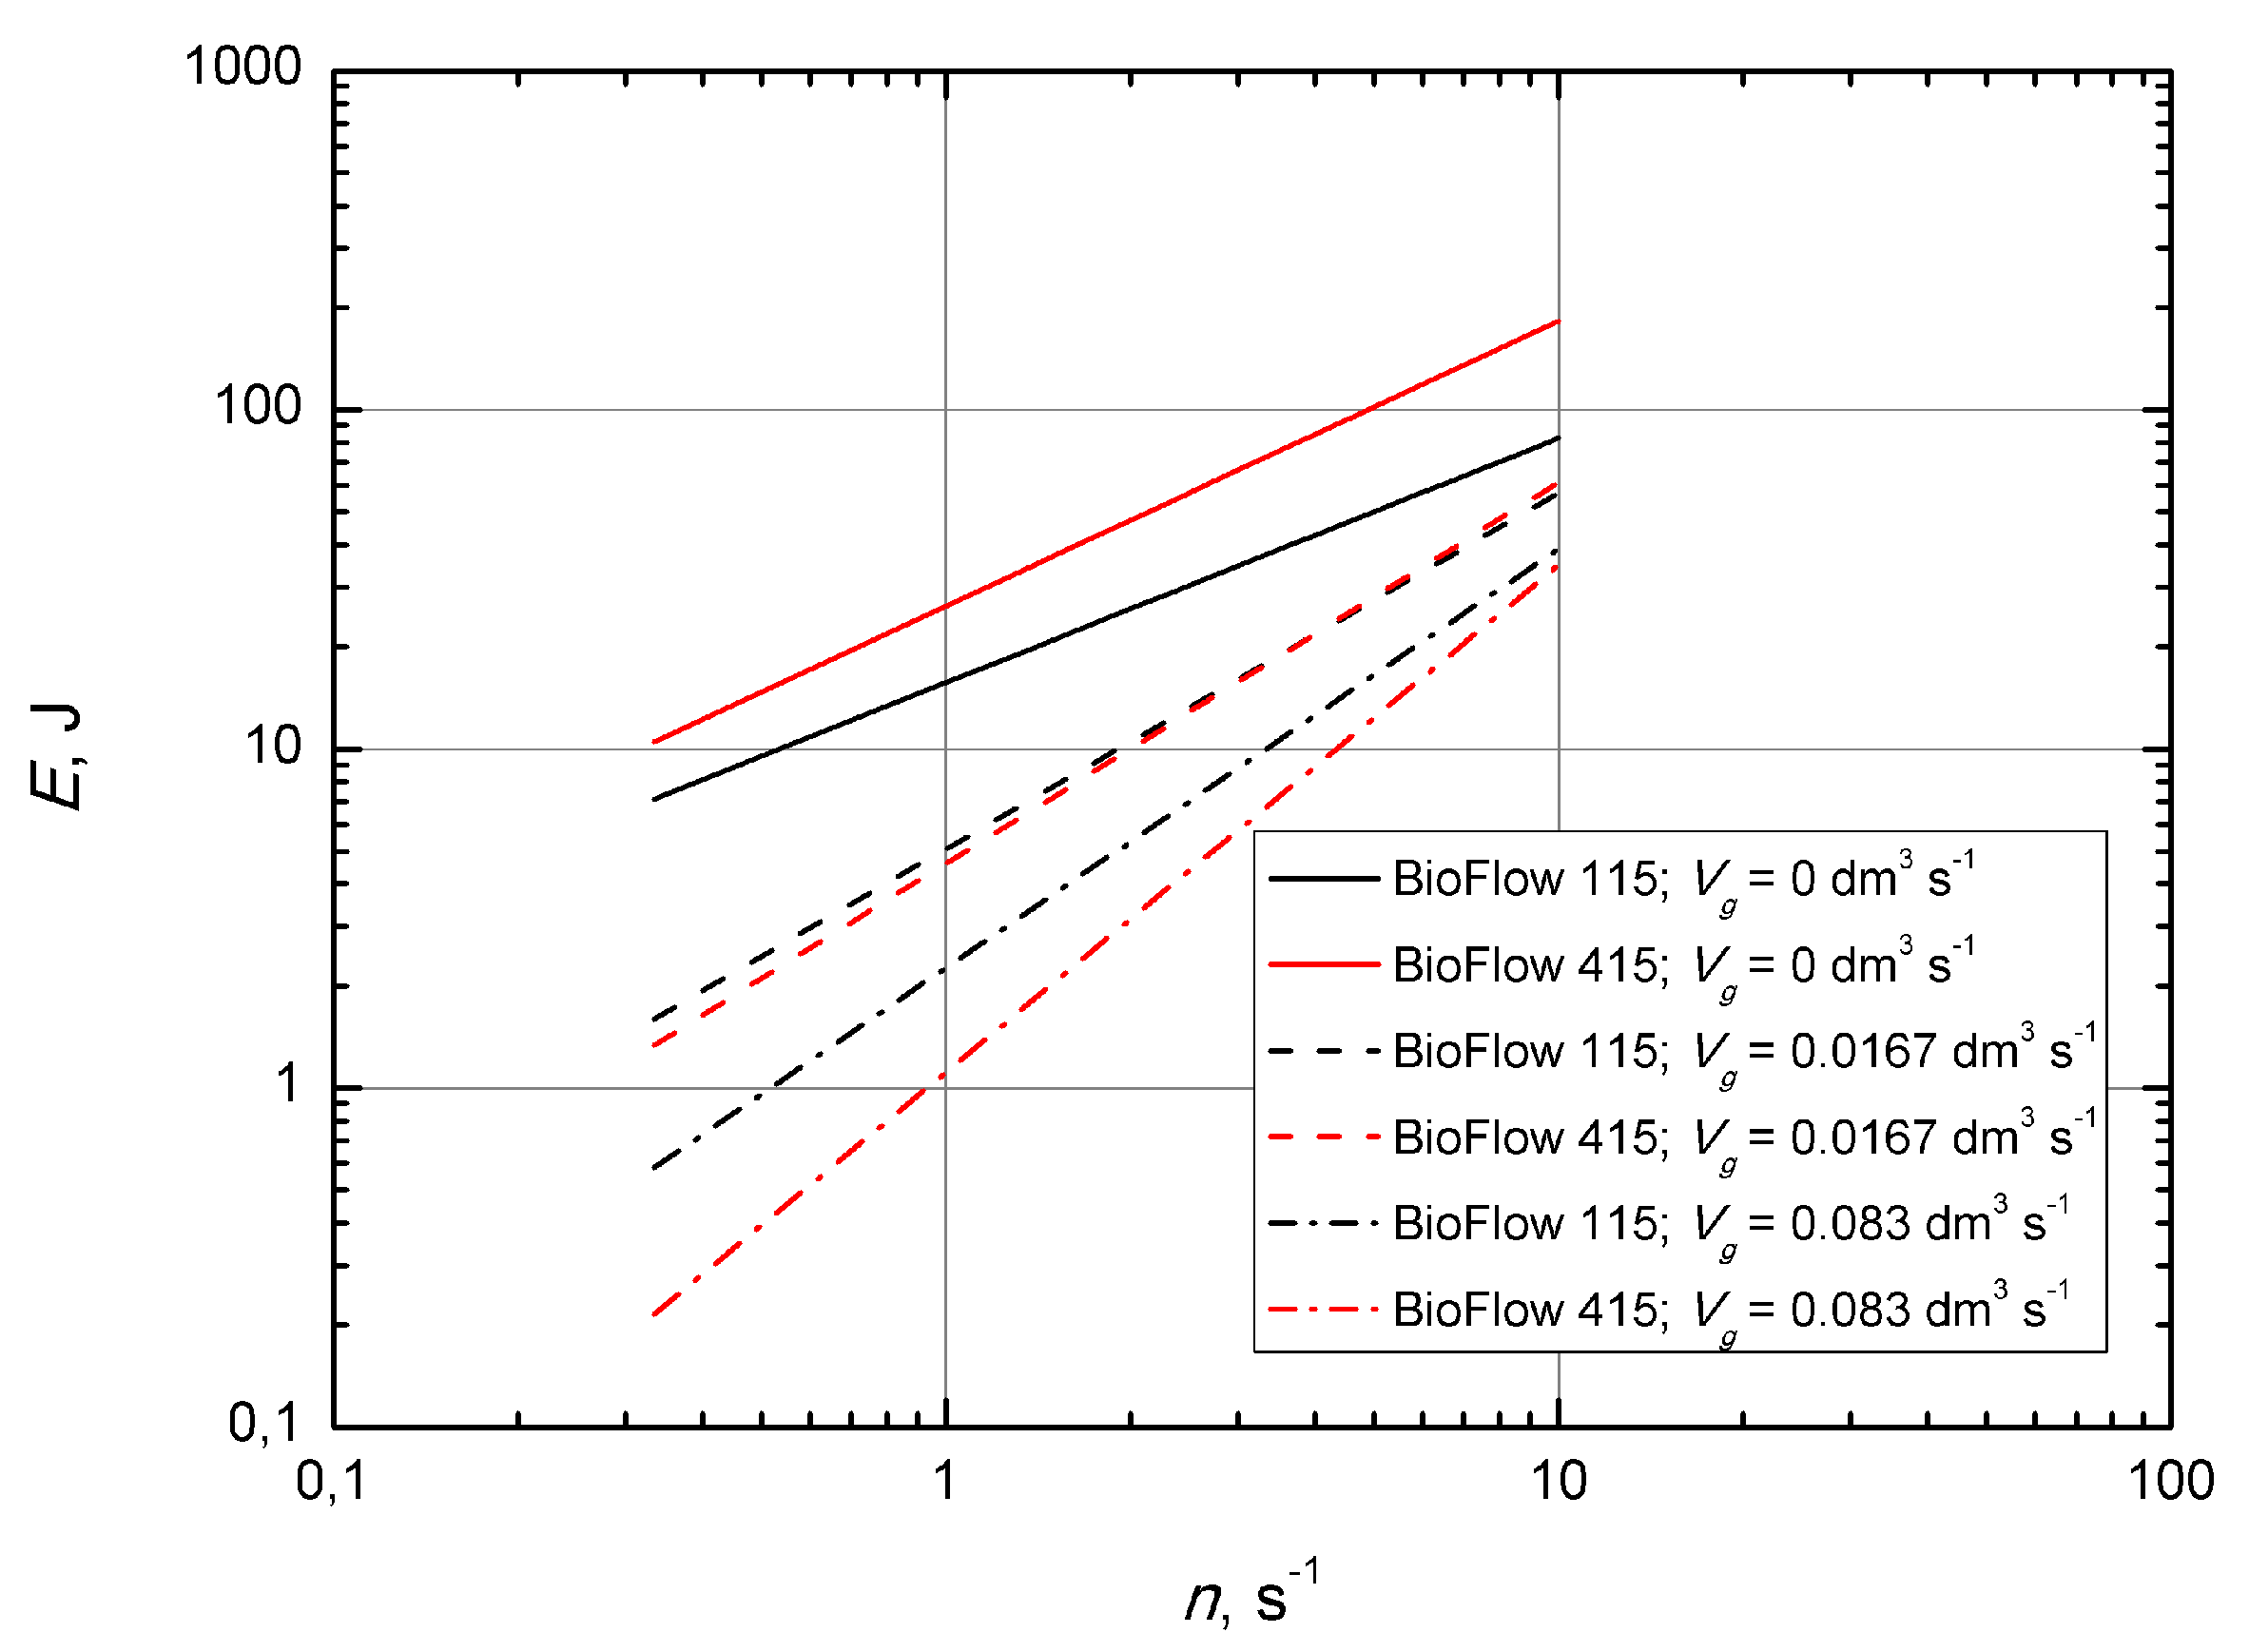
This magnitude can be used to calculate the production costs, which have a significance in the economic analysis. The effect of the impeller speed on the mixing efficiency is shown in Figure 10.
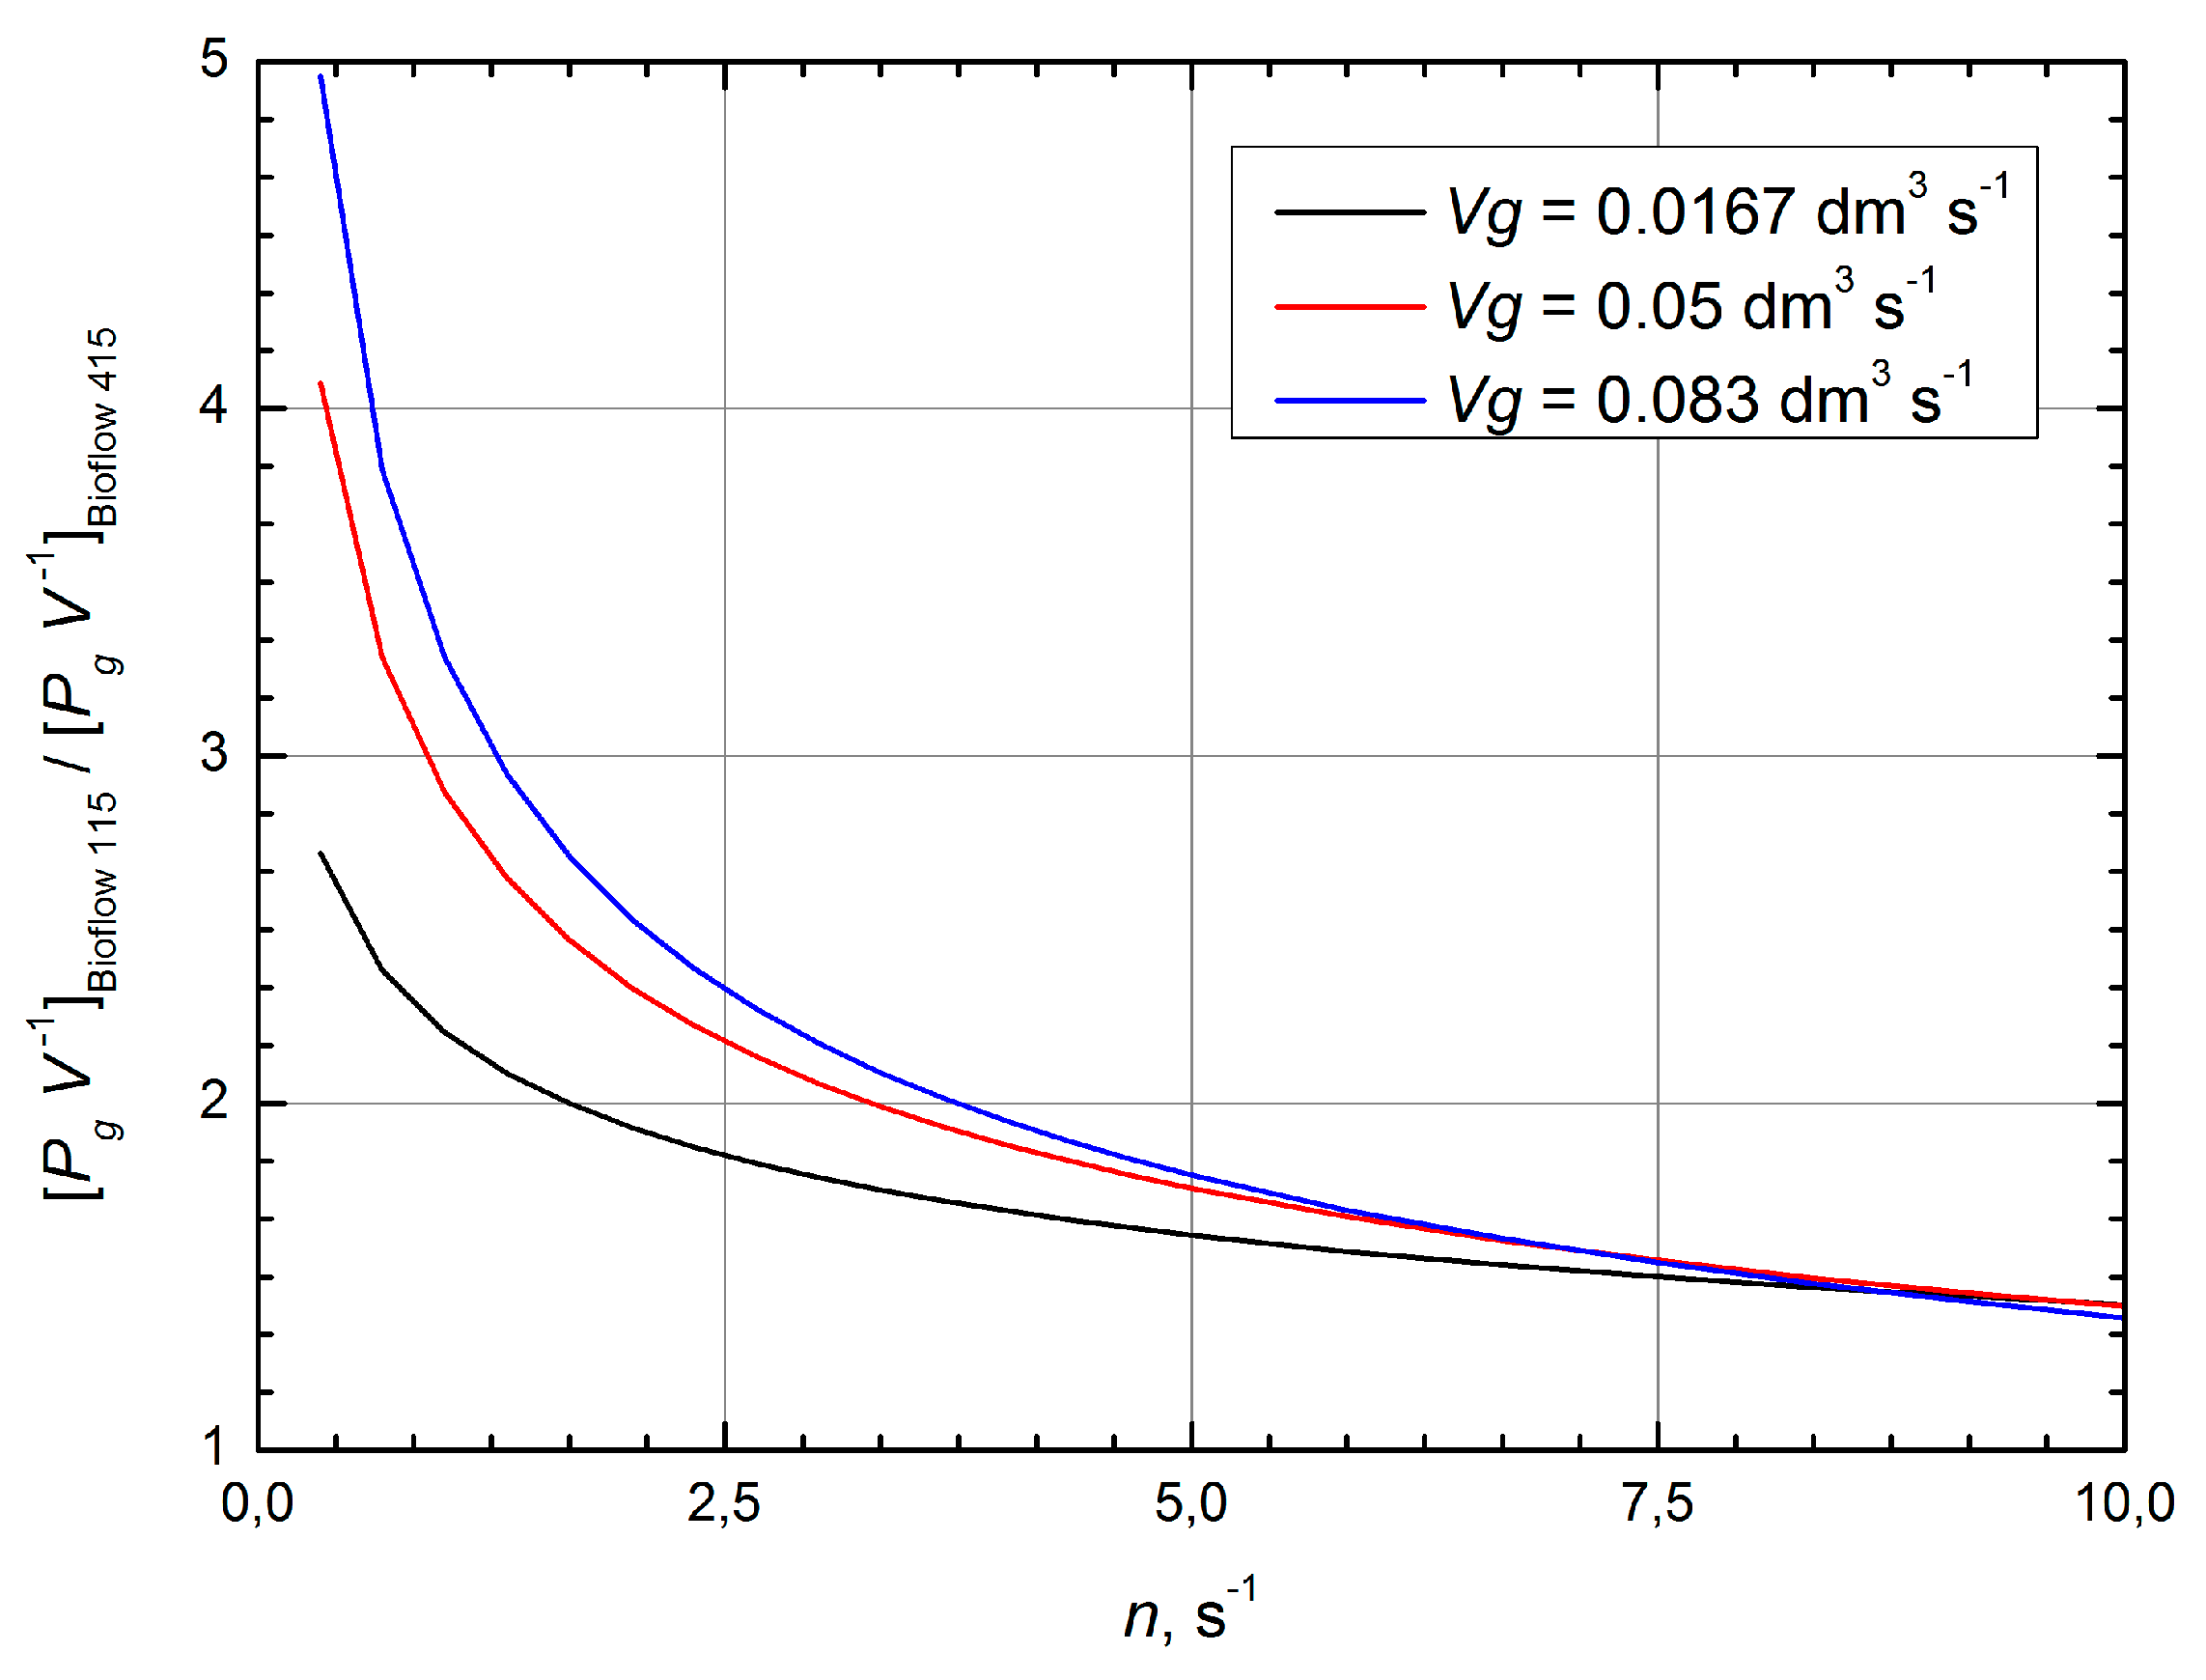
The mixing energy plot shows an increasing trend with the impeller speed for the tested BioFlo® mixing systems under ungassed and gas conditions. The comparison indicates that the dimensional mixing energy under ungassed conditions was on average ~95% higher in the case of BioFlo® 415.
The data depicted in Figure 10 indicate that BioFlo® 415 was more effective for mixing liquid under the gassed conditions. This advantage could be observed in the whole mixing intensity region. The discrepancy of the dimensional mixing energy increased with the increasing gas flow rate. The mixing energy under gassed conditions for BioFlo® 115 was consequently higher than the data obtained for the second reactor. For example, the data for BioFlo® 115 with the gas flow rate V g equal to 0.0167 and 0.083 dm3∙s−1 are on average ~10% and ~60% higher than the mixing energy for BioFlo® 415.
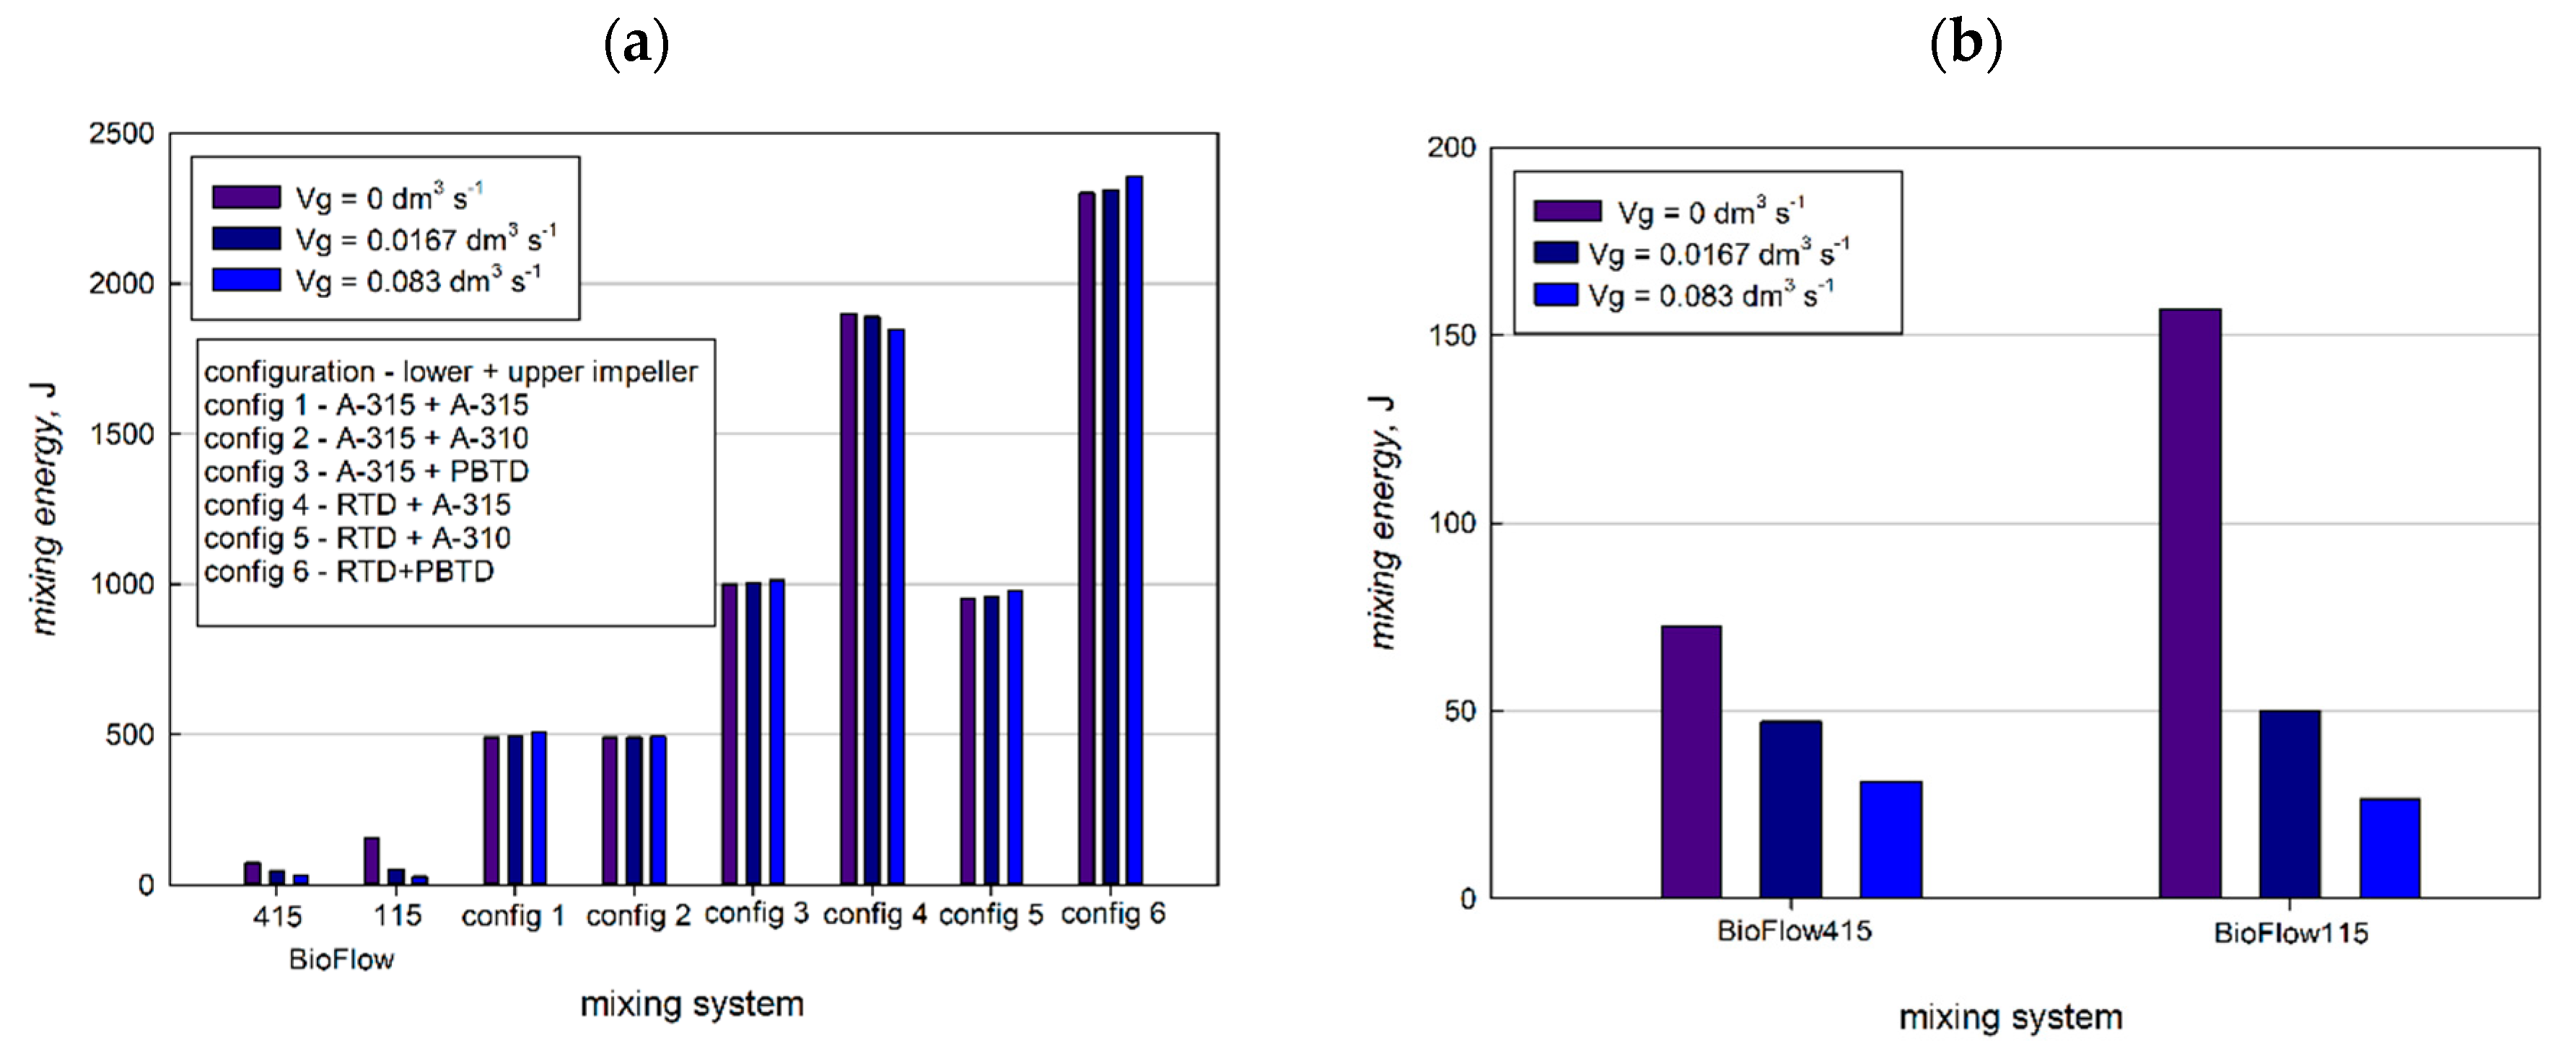
The mixing efficiency of different types of mixing systems may be compared using the values of mixing energy. Bouaifi and Roustan [16] investigated the power consumption, mixing time, and mixing efficiency in a vessel equipped with various axial and mixed dual-impeller configurations. The results obtained from these preliminary studies are comparable with the data obtained for the reactors. Figure 11 compares the experimental data of the mixing energy for the used mixing systems. This comparison is presented for a rotational speed n = 8.33 s−1 (these data were presented in the paper published by Bouaifi and Roustan). As shown in Figure 11, the usage of BioFlow® 115 and BioFlow® 415 correspond to the lowest mixing energy. This figure shows a clear trend of decreasing mixing energy for the tested mixing system with increasing gas flow. It should be noted that the highest mixing efficiency corresponds to the minimum energy consumption.

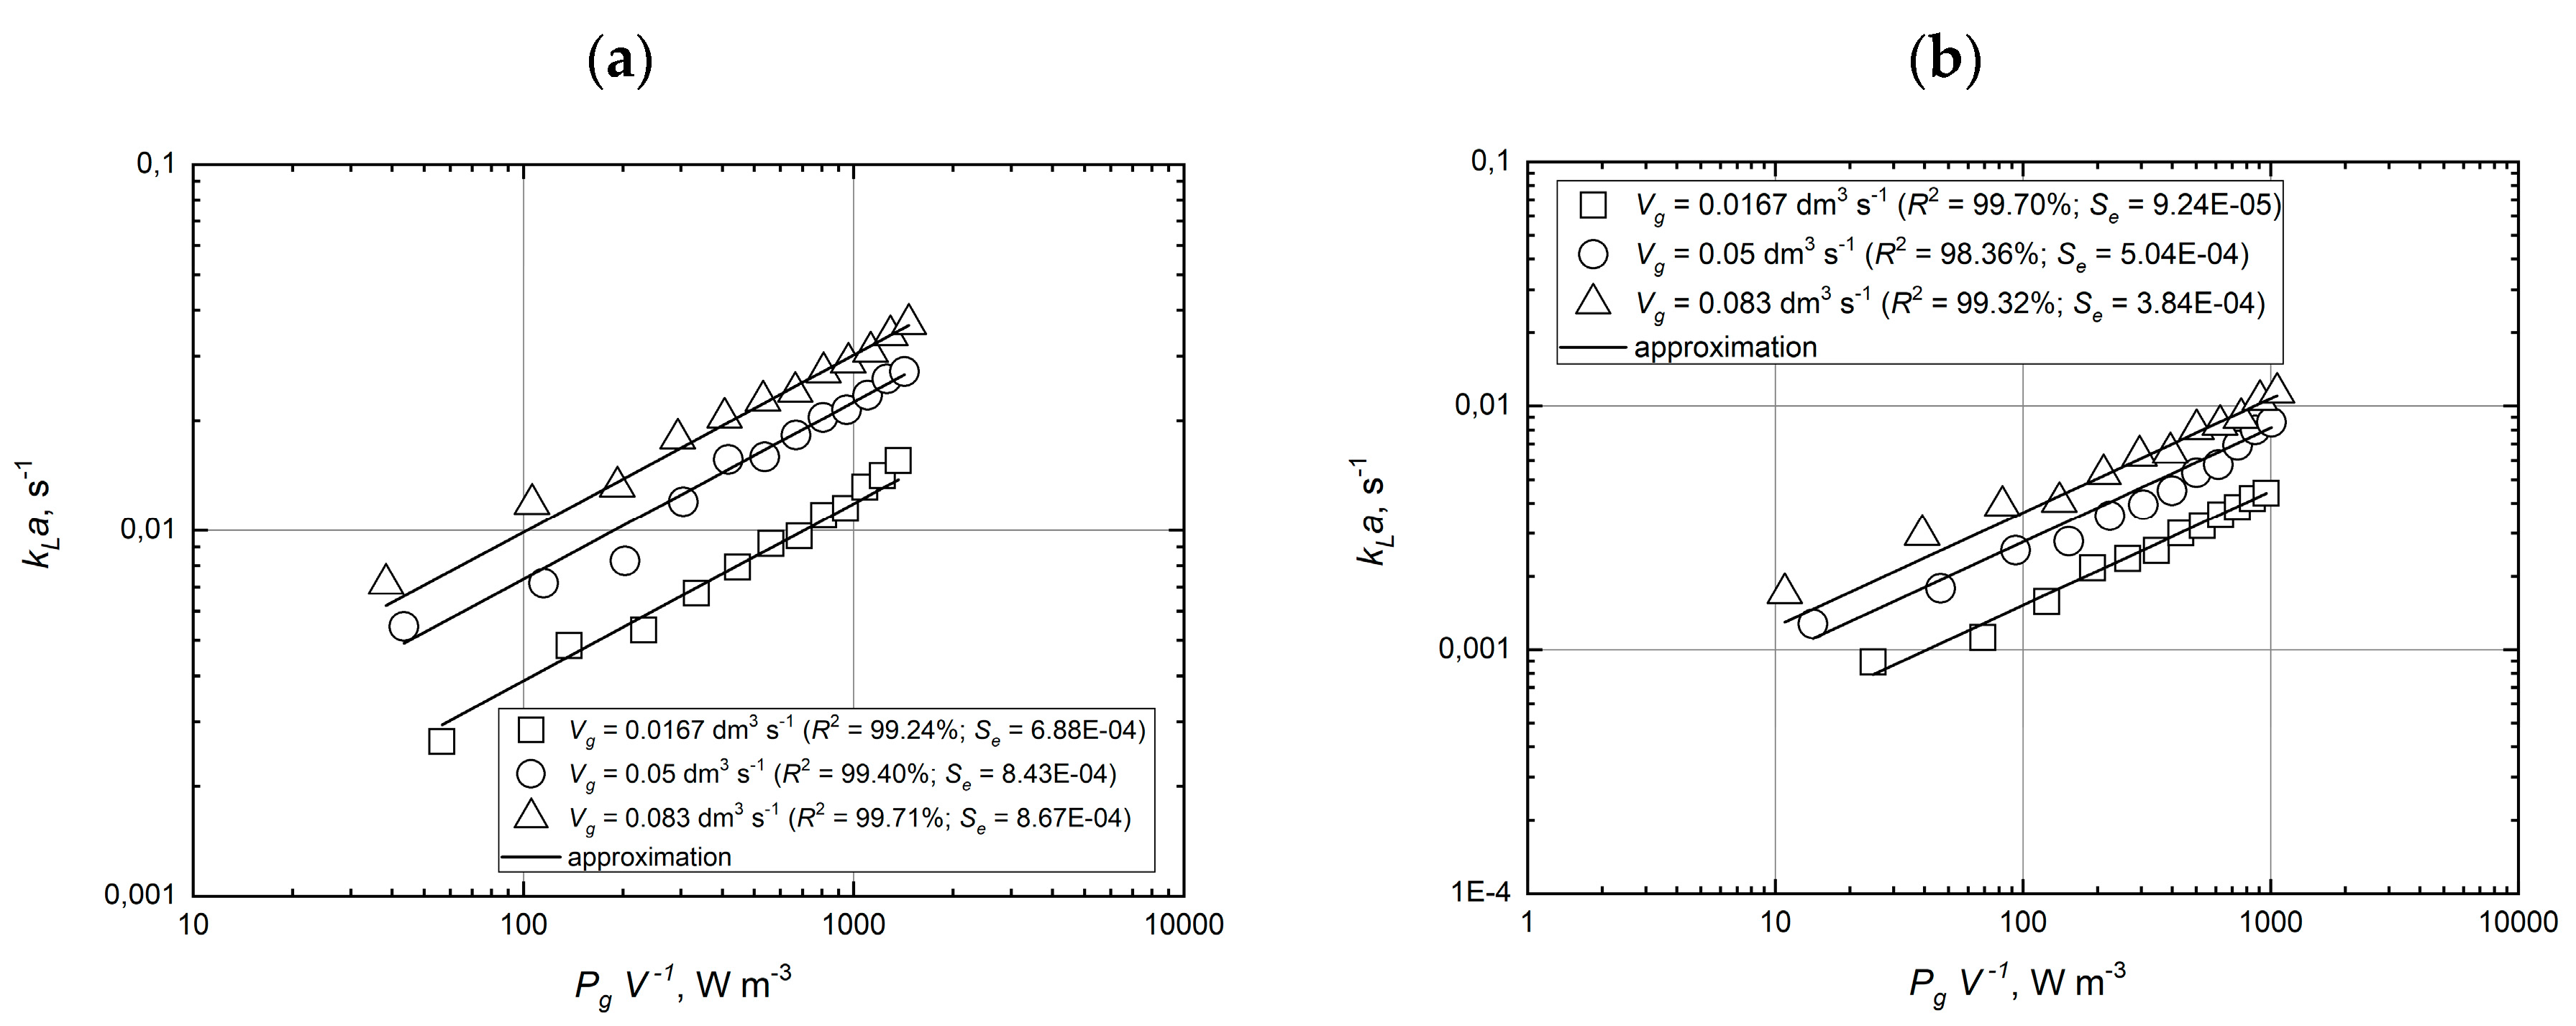
7. Mass Transfer Characteristics

The volumetric gas–liquid mass transfer coefficient (kLa) belongs to the group of global parameters dependent on the impeller design, its configuration, geometrical parameters of the mixer, power draw, and properties of the gas–liquid system. This magnitude defines the efficiency of mass transfer ratio (in this case, gas transfer) within the bioreactor. From the practical point of view, the oxygen transfer rate in nitrogen-purged liquid (distilled water) or dissolved oxygen probe is used to obtain the gas–liquid transfer coefficient.
In the case of these investigations, the oxygen electrode was used to measure the concentrations of dissolved oxygen. The changes in this parameter were recorded with the central unit of BioFlo® systems. The kLa coefficient was determined from the plotted graph ln ( c * c o u t c * c i n ) against time, t. This coefficient is the slope of the graph as follows:
k L a = 1 t ln ( c * c o u t c * c i n )
The calculated data of the volumetric gas–liquid mass transfer coefficient for the tested mixing systems are given by the relationship of the form given by:
k L a = f ( P g V ) g ( V g ) h
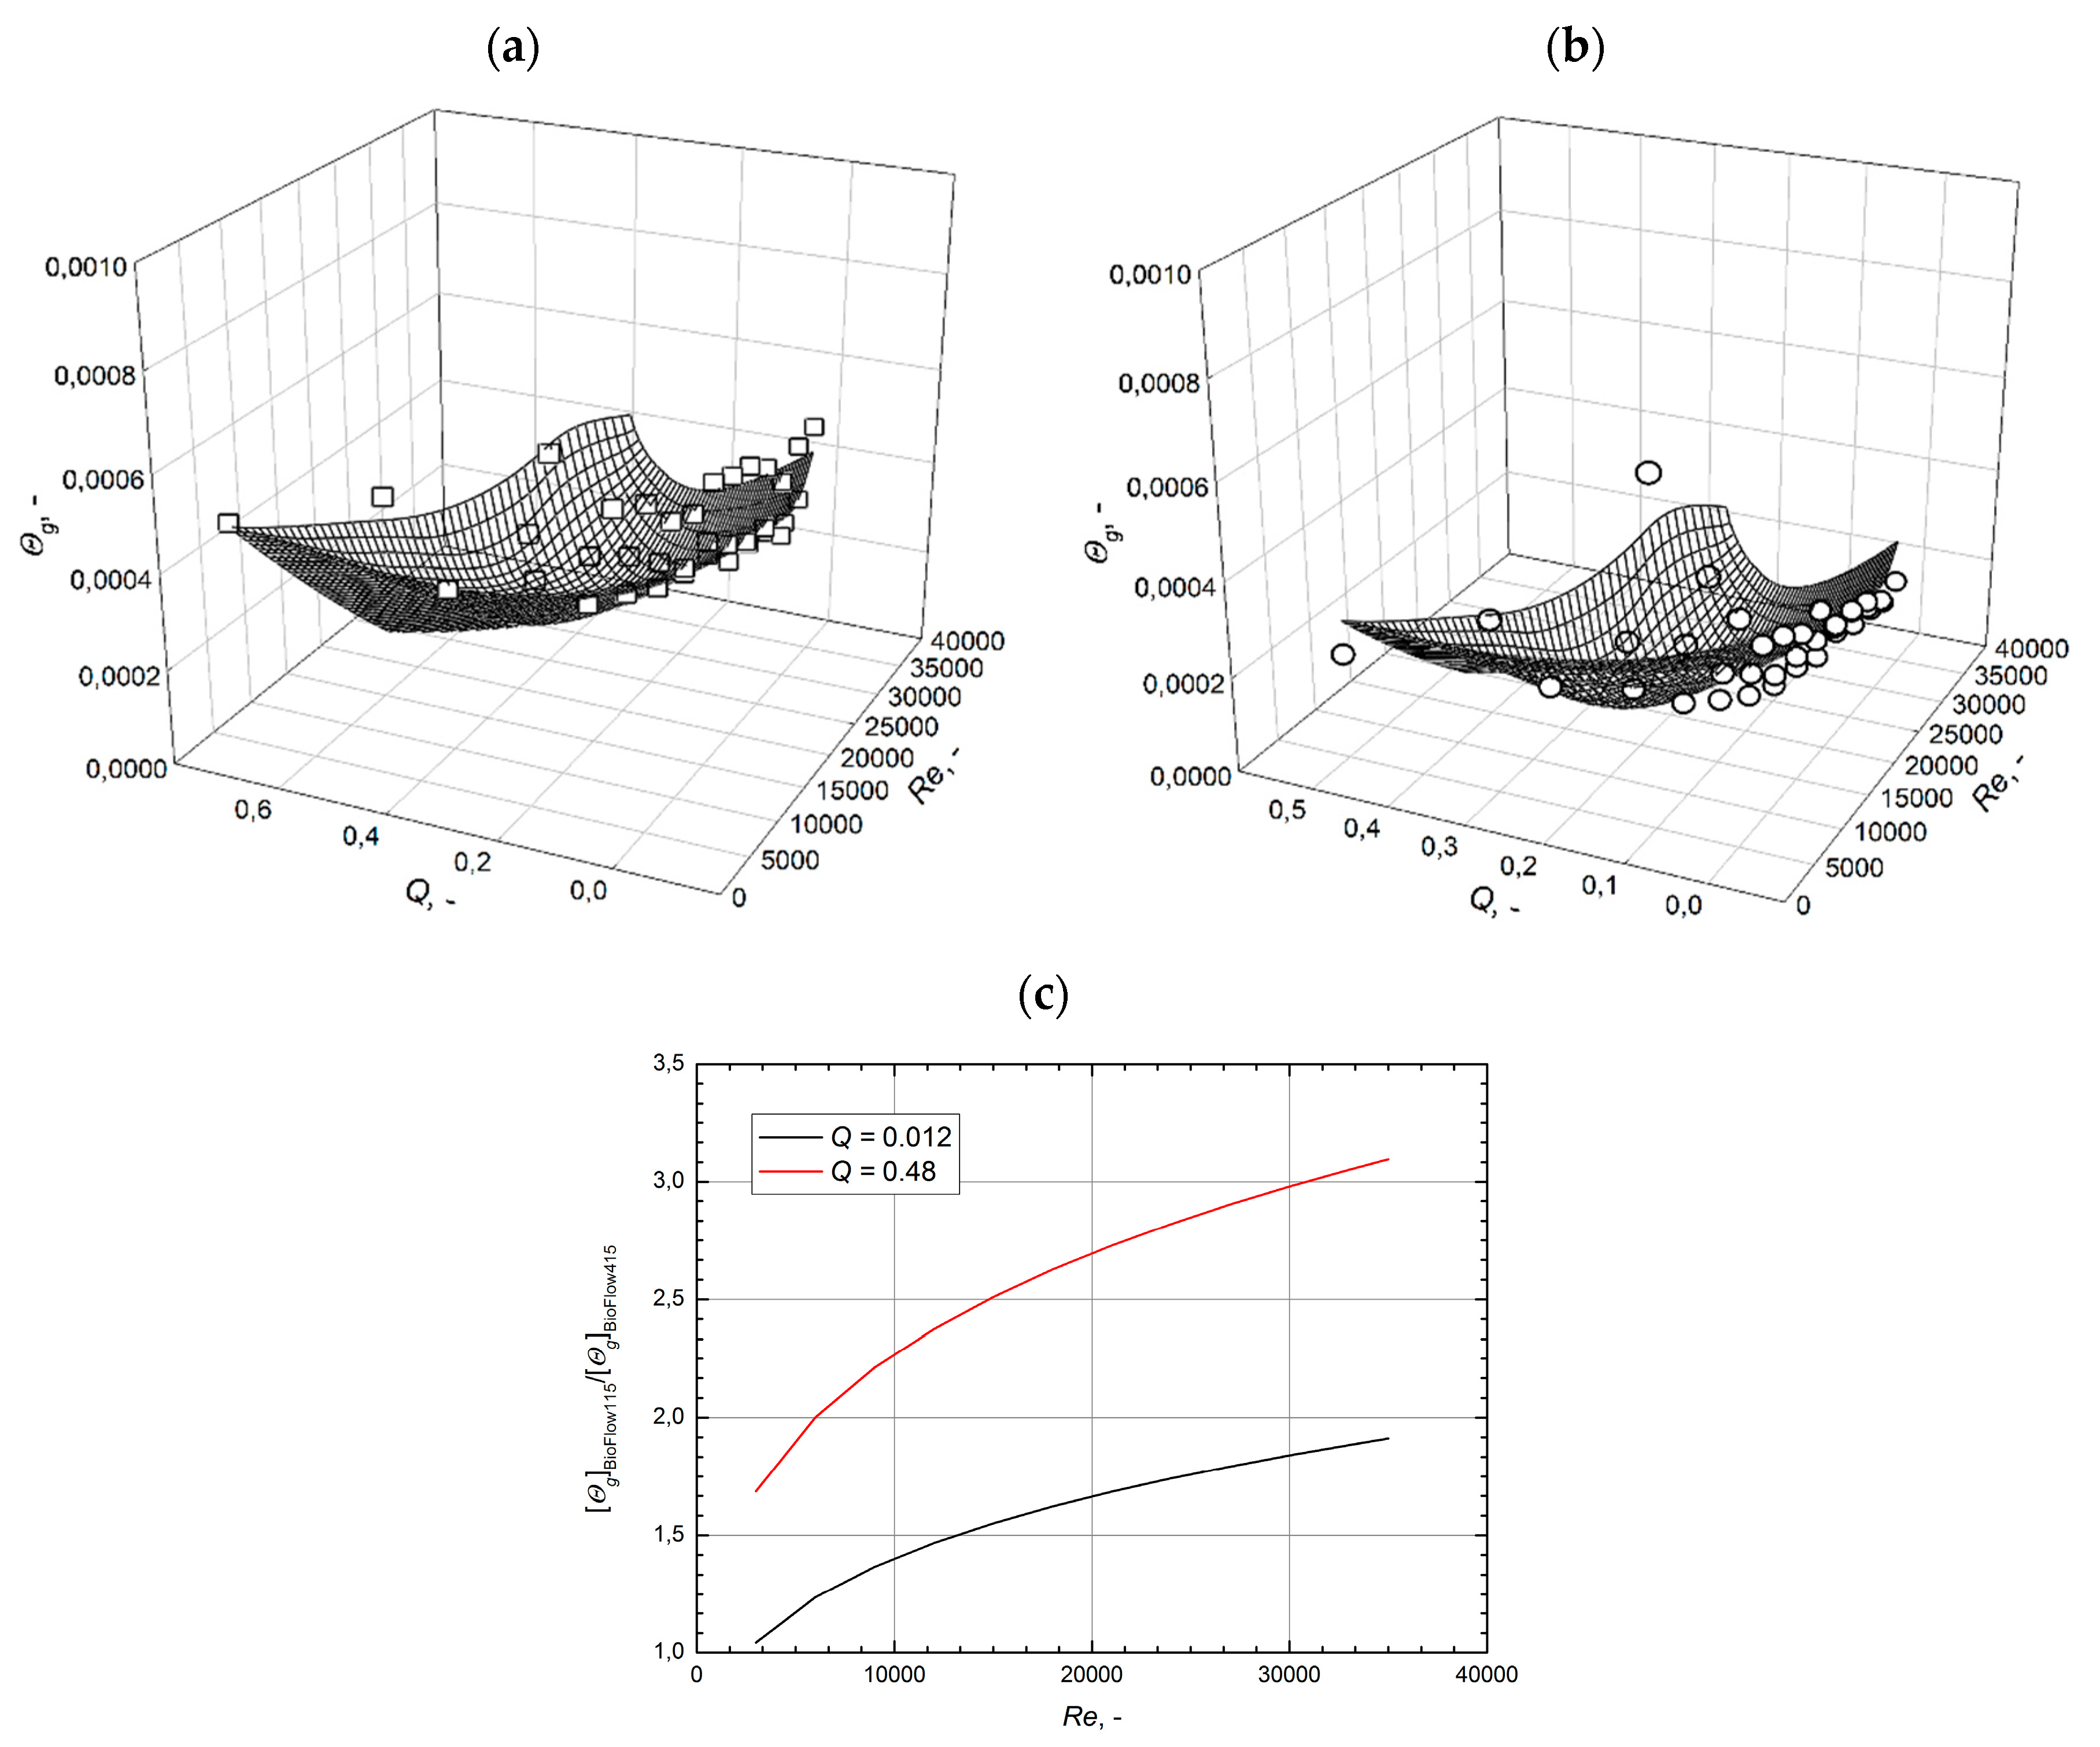
The influence of the operational parameters on the mass transfer coefficient may be written in the following form (the constants and the exponents in the obtained relationships were computed employing the Matlab software):
k L a | B i o F l o 115 = 0.0045 ( P g V ) 0.48 ( V g ) 0.58
k L a | B i o F l o 415 = 0.0016 ( P g V ) 0.47 ( V g ) 0.55
Figure 12 depicts the variation of the mass transfer coefficient with the specific power draw (power consumption under gassed conditions per unit volume) at the various gas flow rate values.
The mass transfer coefficient increases with an increase in the power input per volume unit. The obtained results showed that the mass transfer coefficient was strongly dependent on the gas flow rate. The mass transfer coefficient’s lowest values were ascribed to BioFlo® 415.

8. Summary

This paper’s objective was to study the mixing performance of BioFlo® 115 and BioFlo® 415 using experimental and computational methods. From the chemical engineering perspective, these bioreactors may be treated as vessels equipped with a dual-impeller system. It should be noted that BioFlo® 115 and BioFlo® 415 are stirred-tank gas–liquid reactors used for carrying out the cultivation of cells and enzymatic processes, mainly in batch operations. In stirred-tank bioreactors, mixing by agitation and/or bubbling of a gas stream is influenced by the hydrodynamic conditions in the mixed liquid, which directly affects the bioprocessing. The present study was designed to determine the hydrodynamic parameters (flow field, specific power input, mixing energy as a product of power consumption and mixing time) and mass transfer process (gas–liquid transfer). The current study’s main goal was to determine the mathematical relationships, which may be applied for the analysis of the mixing process in the tested bioreactors. This research indicates that gassed conditions have a strong influence on the analyzed hydrodynamic parameters.
These findings suggest that the applied dual-impeller mixing systems influence power consumption under ungassed conditions. Introducing the gas stream into the bioreactors vessels results in a decrease in power consumption. It was also shown that this effect is stronger in BioFlo® 115.
The second major finding was that mixing energy as the product of power consumption and mixing time could serve as an important criterion in the analysis of the mixing process in bioreactors. For the first time, this study has demonstrated that the mixing energy may be applied to determine the mixing efficiency of commercial bioreactors. This experimental work shows that the application of gassed conditions increases the mixing efficiency. The improvement of the mixing process enables a decrease in the mixing energy. The present study confirms that BioFlow® 115 and BioFlow® 415 may be successfully applied in bioprocesses. It has been found that the tested dual-impeller mixing systems consume much less energy in comparison with the dual-impellers systems (e.g., A-315+A-31; A-315+A-310; A-315+PBTD; RTD+A-315; RTD+A-310; RTD+PBTD). The obtained results suggest that the tested bioreactors offer profitable mass transfer performance. The volumetric gas-liquid mass transfer coefficient for BioFlo® 115 is higher than that observed in the case of BioFlo® 415 bioreactors.

Author Contributions

Conceptualization, A.A., M.K. (Marian Kordas), M.K. (Maciej Konopacki), B.G. and R.R.; methodology, M.K. (Marian Kordas), M.K. (Maciej Konopacki), B.G., M.J.-S. and R.R.; software, M.K. (Maciej Konopacki), R.R.; validation, A.A., M.K. (Marian Kordas), M.K. (Maciej Konopacki), D.M. and K.W.; formal analysis, M.K. (Marian Kordas), M.K. (Maciej Konopacki), B.G., M.J.-S. and R.R.; investigation, A.A., M.K. (Marian Kordas), M.K. (Maciej Konopacki), B.G. and M.J.-S.; resources, R.R.; data curation, A.A., M.K. (Marian Kordas), M.K. (Maciej Konopacki), B.G.; writing—original draft preparation, R.R.; writing—review and editing, A.A., B.G.; visualization, M.K. (Marian Kordas), M.K. (Maciej Konopacki), R.R.; supervision, R.R.; project administration, R.R.; funding acquisition, R.R. All authors have read and agreed to the published version of the manuscript.

Funding

This study was supported by the National Science Centre, Poland (OPUS 16, Project No. UMO-2018/31/B/ST8/03170, granted to Rafał Rakoczy).

Acknowledgments

The authors would like to thanks firm Eppendorf Poland for co-operation and technical support in the area of the bioreactors.

Conflicts of Interest

The authors declare no conflict of interest.

Nomenclature

cconcentration, mol·m−3 or arbitrary units
dimpeller diameter, m
Dvessel diameter, m
Emixing energy, J
HLliquid height in vessel, m
kLavolumetric mass transfer coefficient, s−1
Lcharacteristic linear dimension, m
nimpeller rotation speed, s−1
Nimpeller speed, rpm
Ppower consumption, stirring power input, W
R2coefficient of determination
Vmixing volume, m3
V g gas flow rate. m3·s−1
Sslender ratio
Sestandard error of estimate
Greek letters
νkinematic viscosity, m·s−2
τmmixing time, s
Superscript
*equilibrium conditions
Subscripts
0 - ungassed conditions1
ininlet or initial
outoutlet or final
ggassed conditions
Dimensionless numbers
Re = n d 2 ν Reynolds number
Q = V g n d 3 flow number
Θ = τ m ν L 2 mixing time number

References

  1. Williams, J.A. Keys to bioreactor selection. Chem. Eng. Progress 2002, 98, 34–41. [Google Scholar]
  2. Singh, J.; Kaushik, N.; Biswas, S. Bioreactors—Technology & design analysis. Scitech. J. 2014, 1, 28–36. [Google Scholar]
  3. Najafpour, G.D. Biochemical Engineering and Biotechnlogy; Elsevier: Amsterdam, The Netherlands, 2007. [Google Scholar]
  4. Bonvillani, P.; Ferrari, M.P.; Ducrós, E.M.; Orejas, J.A. Theorical and experimental study of the effects of scale-up on mixing time for a stirred-tank bioreactor. Braz. J. Chem. Eng. 2006, 23, 1–7. [Google Scholar] [CrossRef] [Green Version]
  5. Bujalski, W.; Jaworski, Z.; Nienow, A. CFD Study of homogenization with dual rushton turbines—comparison with experimental results. Chem. Eng. Res. Des. 2002, 80, 97–104. [Google Scholar] [CrossRef]
  6. Deshpande, V.R.; Ranade, V.V. Simulation of flows in stirred vessels agitated by dual rushton impellers using computational snapshot approach. Chem. Eng. Commun. 2003, 190, 236–253. [Google Scholar] [CrossRef]
  7. Jaworski, Z.; Bujalski, W.; Otomo, N.; Nienow, A. CFD Study of homogenization with dual rushton turbines—Comparison with experimental results. Chem. Eng. Res. Des. 2000, 78, 327–333. [Google Scholar] [CrossRef]
  8. Rutherford, K.; Lee, K.C.; Mahmoudi, S.M.S.; Yianneskis, M. Hydrodynamic characteristics of dual Rushton impeller stirred vessels. AIChE J. 1996, 42, 332–346. [Google Scholar] [CrossRef]
  9. Rutherford, K.; Mahmoudi, S.M.; Lee, K.S.; Yianneskis, M. The influence of Rushton impeller blade and disc thickness on the mixing characteristics of stirred vessels. Trans. IChemE 1996, 74, 369. [Google Scholar]
  10. Zadghaffari, R.; Moghaddas, J.; Revstedt, J. A mixing study in a double-Rushton stirred tank. Comput. Chem. Eng. 2009, 33, 1240–1246. [Google Scholar] [CrossRef]
  11. Gogate, P.R.; Beenackers, A.A.; Pandit, A.B. Multiple-impeller systems with a special emphasis on bioreactors: A critical review. Biochem. Eng. J. 2000, 6, 109–144. [Google Scholar] [CrossRef]
  12. Vanags, J.; Viesturs, U.; Fořt, I. Mixing intensity studies in a pilot plant stirred bioreactor with an electromagnetic drive. Biochem. Eng. J. 1999, 3, 25–33. [Google Scholar] [CrossRef]
  13. Prell, A.; Solar, K.; Safar, H.; Fort, I.; Sobotka, M. Pilot plant optimisation using two types of impellers. Chem. Biochem. Eng. Q. 1999, 13, 177. [Google Scholar]
  14. Oniscu, C.; Galaction, A.-I.; Cascaval, D.; Ungureanu, F. Modeling of mixing in stirred bioreactors. Biochem. Eng. J. 2002, 12, 61–69. [Google Scholar] [CrossRef]
  15. Hadjiev, D.; Sabiri, N.E.; Zanati, A. Mixing time in bioreactors under aerated conditions. Biochem. Eng. J. 2006, 27, 323–330. [Google Scholar] [CrossRef]
  16. Bouaifi, M.; Roustan, M. Power consumption, mixing time and homogenisation energy in dual-impeller agitated gas–liquid reactors. Chem. Eng. Process. Process. Intensif. 2001, 40, 87–95. [Google Scholar] [CrossRef]
  17. Jafari, M.; Mohammadzadeh, J.S.S. Mixing time, homogenization energy and residence time distribution in a gas-induced contractor. Chem. Eng. Res. Des. 2005, 83, 452–459. [Google Scholar] [CrossRef]
  18. Karimi, A.; Golbabaei, F.; Mehrnia, M.R.; Neghab, M.; Mohammad, K.; Nikpey, A.; Pourmand, M.R. Oxygen mass transfer in a stirred tank bioreactor using different impeller configurations for environmental purposes. Iran. J. Environ. Heal. Sci. Eng. 2013, 10, 6. [Google Scholar] [CrossRef] [Green Version]
  19. Hiraoka, S.; Kato, Y.; Tada, Y.; Ozaki, N.; Murakami, Y.; Lee, Y.S. Power consumption and mixing time in an agitated vesselwith double impeller. Trans. IChemE 2001, 79, 805–810. [Google Scholar] [CrossRef]
  20. Kuzmanić, N.; Žanetić, R.; Akrap, M. Impact of floating suspended solids on the homogenisation of the liquid phase in dual-impeller agitated vessel. Chem. Eng. Process. Process. Intensif. 2008, 47, 663–669. [Google Scholar] [CrossRef]
  21. Woziwodzki, S.; Broniarz-Press, L.; Ochowiak, M. Effect of eccentricity on transitional mixing in vessel equipped with turbine impellers. Chem. Eng. Res. Des. 2010, 88, 1607–1614. [Google Scholar] [CrossRef]
  22. Lisboa, P.F.; Fernandes, J.; Simões, P.C.; Mota, J.P.; Saatdjian, E. Computational-fluid-dynamics study of a Kenics static mixer as a heat exchanger for supercritical carbon dioxide. J. Supercrit. Fluids 2010, 55, 107–115. [Google Scholar] [CrossRef]
  23. Wilcox, D.C. Reassessment of the scale-determining equation for advanced turbulence models. AIAA J. 1988, 26, 1299–1310. [Google Scholar] [CrossRef]
  24. Shao, X.; Liu, X.; Li, Y. Experimental study of influence of the impeller spacing on flow behaviour of double-impeller stirred tank. Can. J. Chem. Eng. 2008, 81, 1239–1245. [Google Scholar] [CrossRef]
  25. Ascanio, G.; Castro, B.; Galindo, E. Measurement of power consumption in stirred vessels—A review. Chem. Eng. Res. Des. 2004, 82, 1282–1290. [Google Scholar] [CrossRef]
  26. Nienow, A.W.; Hunt, G.; Buckland, B.C. A fluid dynamic study of the retrofitting of large agitated bioreactors: Turbulent flow. Biotechnol. Bioeng. 1994, 44, 1177–1185. [Google Scholar] [CrossRef]
  27. Zlokarnik, M. Stirring. Theory and Practice; Wiley-VCH Verlag GmbH: Weinheim, Germany, 2001. [Google Scholar]
  28. Mohanimad, S.; Mahmoudi, S. Velocity and Mixing Characteristics of Stirred Vessels with Two Impellers. Ph.D. Thesis, King’s College, London, UK, 1993. [Google Scholar]
  29. Masiuk, S.; Kawecka-Typek, J. Mixing energy measurements in liquid vessel with pendulum agitators. Chem. Eng. Process. Process. Intensif. 2004, 43, 91–99. [Google Scholar] [CrossRef]
  30. Rakoczy, R.; Masiuk, S. Studies of a mixing process induced by a transverse rotating magnetic field. Chem. Eng. Sci. 2011, 66, 2298–2308. [Google Scholar] [CrossRef]
Figure 1. Sketch of BioFlo® 115 bioreactor: 1—tube for temperature sensor; 2—sampling tube; 3—thermostatic circuits; 4—blowdown connection; 5—sparger; 6—shaft; 7—impeller.
Processes 08 01311 g001
Figure 2. Sketch of BioFlo® 415 bioreactor: 1—tube for temperature sensor; 2—sampling tube; 3—batching tube; 4—sparger; 5—shaft; 6—impeller.
Processes 08 01311 g002
Figure 3. Typical simulated results of velocity profiles for the tested mixing systems.
Processes 08 01311 g003aProcesses 08 01311 g003b
Figure 4. Power consumption per unit volume versus impeller rotational speed (a) and power characteristics (b) for the tested bioreactors.
Processes 08 01311 g004
Figure 5. Experimental (symbols) and fitted (lines) relative power consumption values obtained for the tested bioreactors.
Processes 08 01311 g005
Figure 6. The graphical presentation of the proposed dimensionless ratio as a function of operational parameters (speed rotation and gas flow rate).
Processes 08 01311 g006
Figure 7. Dependence Θ = f (Re) for the tested bioreactors.
Processes 08 01311 g007
Figure 8. The dimensionless mixing number variation with Reynolds number and flow number for: (a) BioFlo®115 (R2 = 97.28%; Se = 2.99 × 10⁻⁵); (b) BioFlo®415 (R2 = 95.37%; Se = 5.31 × 10⁻⁵); (c) comparison of the calculated variation of ( Θ g ) | B i o F l o w 115 [ ( Θ g ) | B i o F l o w 415 ] 1 with the selected flow number.
Processes 08 01311 g008
Figure 9. Influence of specific power consumption on the mixing time for (a) ungassed conditions; (b) gassed conditions ( V g = 0.083 d m 3 s 1 ).
Processes 08 01311 g009
Figure 10. The comparison of the dimensional mixing energy characteristics for the tested bioreactors under ungassed and gassed conditions.
Processes 08 01311 g010
Figure 11. Comparison of mixing energy for different mixing systems (a) and mixing energy for tested BioFlow systems at n = 8.33 s−1 (b).
Processes 08 01311 g011
Figure 12. The comparison of the volumetric mass transfer coefficient at various gas flow rates for the tested BioFlo® 115 (a) and BioFlo® 415 (b) bioreactors.
Processes 08 01311 g012
Table 1. The basic features of a bioreactor.
FeatureDescription
working volume
~70–80% of the total bioreactor volume;
the fraction of total volume of bioreactor taken up by the medium, microorganisms, and gas bubbles;
the remaining volume is called the headspace (~20–30% of the total bioreactor volume);
the headspace is connected with the process and rate of foam formation;
foam control system (excessive foam formation leads to blocked air filters; foam formation is responsible for the build-up of pressure in a bioreactor;
agitation system
this system consists of an external power drive, impeller (a Rushton turbine is applied in most bioreactors), baffles;
effective agitation conditions are allowed to provide correct shear conditions;
this system is closely connected with the mass and heat transfer ratio;
effective agitation is required for uniform distribution of substrates or microorganisms;
the correct shear conditions are required (these conditions may be realized using a suitable impeller);
supply
nutrient substrates (usually carbohydrates, proteins, fats, micro- and macroelements, and vitamins);
aeration system (for aerobic processes);
temperature system
the temperature control system is connected with the heat transfer system;
heating is provided by electric heaters or steam generated using the boiler;
cooling is provided by cooling water;
heating and cooling is realized by heat transfer systems (e.g., jacket, coil, heat exchangers);
the heat transfer system is needed to operate the bioreactor at a constant temperature
pH
non-corrosive and non-toxic neutralizing agents should be used;
sampling ports
these ports are used to inject nutrients or chemical substances;
these ports may be also used to collect samples;
sterilization
sterile conditions should be maintained for pure culture systems;
thermal sterilization is commonly applied (economical and scale-up aspects);
chemical sterilization is preferred for heat-sensitive equipment;
other methods of sterilization: radiation by UV or X-rays; application of membrane filters;
other
formation of the optimal morphology of the living microorganisms;
elimination of contamination (e.g., unwanted microorganisms, mutation of the living microorganisms);
Table 2. Summary of reactor modes and operating variables for various modes.
Mode of OperationDescriptionAdvantagesDisadvantages
batch
batch conditions are used in most industrial applications
the bioreactor is charged with medium and inoculated with cell suspension;
cells reproduce for appropriate time;
there is no additional material added or removed during the process;
pH or foam control is allowed;
supply of air is permitted (for aerobic fermentation or bioprocesses);
concentrations of biomass, cells, and bioproducts are changed with respect to time;
bioreaction conditions are dependent on time;
discontinuous process production;
downtime is required (cleaning and filling);
bioprocess should be characterized by a minimal risk of contamination or mutation;
one type bioreactor may be applied for the various process;
simple equipment;
suitable for small-scale production;
suitable for testing bioprocesses;
lower contamination risk and mutants selection;
cost-effective
flexibility with varying bioproducts;
down-time for loading, cleaning, sterilizing, cooling, and heating;
the influence of time on reaction conditions;
reaction conditions are changed with time;
higher costs for labour and process control;
semi-continuous or fed-batch
additional substrates are fed into the bioreactor (e.g., additional nutrients for living microorganisms; vitamins);
the quantity of material within the bioreactor is increased with time (no material is removed from the vessel; samples from the working volume are allowed);
concentration levels are changed with time;
possible production extension (due to the additional substrates feeding);
development of high biomass and bioproduct concentration;
control of environmental conditions;
flexible for selecting optimal conditions;
frequently used in bioprocesses;
well-defined cultivation;
optimizing environmental conditions;
requires a feeding strategy to obtain desired concentrations;
lower productivity
greater expenses in labour;
continuous
fresh medium is added continuously, with bioproduct rich medium removal;
steady-state working (after an initial start-up);
concentration is constant with time (after initial period);
constant reaction rate;
opportunities for system investigations and analysis;
a higher degree of control;
mixed cultures can be maintained;
higher productivity per unit volume;
provides high production;
constant conditions;
better product quality;
good kinetics;
no down-time for cleaning and filling;
automating the bioprocess;
less non-productive time;
requires flow control;
long periods brings the risk of mutant strain selection;
limited use as a biological production reactor;
minimal flexibility;
mandatory uniformity of raw material quality;
higher investment costs;
higher risk of contamination and mutation;
wall growth and cell aggregation;
Table 3. Comparison of BioFlo® 115 and BioFlo® 415 bioreactors.
FeatureBioFlo® 115BioFlo® 415
volumetotal: 1.3–14.0 dm3
working: 0.4–10.5 dm3
total: 7.0–19.5 dm3
working: 2.0–15.5 dm3
sterilization methodautoclavablesterilizable-in-place
living microorganisms
bacterial, yeast, fungi;
plant, algae;
mammalian, animal;
insect;
bacterial, yeast, fungi;
plant, algae;
mammalian, animal;
insect;
vessel type
interchangeable;
glass vessel in 1.3, 3.0, 7.5 and 14.0 dm3 (total volume)
interchangeable;
stainless-steel;
7.0 and 14.0 dm3 capacities with 2:1 aspect ratio;
controller
reactor process controller
airflow control
rotameter;
thermal mass flow controller;
gas mixing options
2/3/4 gas
2/3/4 gas
mode
batch, fed-batch, continuous culture
impellers
Rushton-type, pitched-blade, marine-blade;
fermentation kits (2 Rushton-type impellers);
cell culture kits (pitched-blade impeller);
2 Rushton-type impellers;
agitation motor50–1200 rpm50–600 rpm
other
touchscreen controller;
heat-blanketed vessel with direct-drive motor;
pH and DO probes;
three fixed-speed peristaltic pumps;
connections for sparging, motor, heater, temperature probe, and foam/level;
immersion cooling coil;
thermowell;
RTD probe;
baffle assembly;
exhaust condenser;
tube/assembly sampler;
touchscreen controller;
heat induction;
integrated control of up to 32 process parameters;
trends up to 8 parameters simultaneously;
3 integrated pumps;
control of agitation, temperature, pH, DO, foam/level;
control up to 4-gas mixing;
exhaust condenser;
sparger assembly with SIP filters;
redox kits;
sampling assembly;
Publisher’s Note: MDPI stays neutral with regard to jurisdictional claims in published maps and institutional affiliations.

