Influence of Solid Content, Cement/Tailings Ratio, and Curing Time on Rheology and Strength of Cemented Tailings Backfill


1
State Key Laboratory of High-Efficient Mining and Safety of Metal Mines of Ministry of Education, University of Science and Technology Beijing, Beijing 100083, China
2
School of Civil and Resources Engineering, University of Science and Technology Beijing, Beijing 100083, China
3
Department of Civil Engineering, Geotechnical Division, Recep Tayyip Erdogan University, Fener, Rize TR53100, Turkey
*
Author to whom correspondence should be addressed.
Minerals 2020, 10(10), 922; https://doi.org/10.3390/min10100922
Submission received: 27 August 2020
/
Revised: 9 October 2020
/
Accepted: 16 October 2020
/
Published: 19 October 2020
(This article belongs to the Section Mineral Processing and Extractive Metallurgy)
Abstract
:Understanding the flow process of cemented tailings backfill (CTB) is important for successful pumping into underground stopes. This study examines the effects of solid content (SC), cement/tailings (c/t) ratio, and curing time (CT) on rheological and mechanical properties of CTB mixes. The slurry concentration of the mixes was 65, 67, and 69 wt. %, with c/t ratios ranging from 1:4 to 1:20. Unconfined compressive strength (UCS) tests were performed on hardened CTB mixes after curing 3, 7, and 28 days. The rheological properties of CTB slurries are mainly related to SC. The yield stress and viscosity of fresh mixes increase with increasing SC, but the pipeline resistance loss (PRL) also increases with increasing SC. According to the analysis of variance, the SC and flow rate are the most significant parameters which greatly affect the PRL performance. The c/t and CT parameters are the most significant parameters for affecting the shrinkage rate. The findings offer a reference for theoretical optimization for mine filling systems of similar type.
1. Introduction
Mine backfill is a mix composed of filtrated process tailings, water, and cement, delivered via boreholes and/or pipelines using centrifugal pumps, or gravity, at solid content up to 85% by weight [1]. The backfilling technique is an effective method and has been widely used throughout the world. Tailings generated during mineral processing are prepared as a backfill slurry to fill underground stopes while the remaining tailings are discharged onto the surface tailings dams/impoundments. There is always a risk of the failure of these tailing dams, which can result in casualties, destroy farmland, and pollute the environment. Many mines contain pillars that have been left in place for mine stability. The use of engineered backfills can permit these economically valuable pillars to be recovered [2,3,4]. However, backfilling requires optimized processing, delivery, and placement controls. Depending on the final functions and strength requirements, the backfill can be placed in mined-out voids with or without cement [5]. Improved pumping technology, environmental concerns, and the need for a low-cost/high strength backfill in mines are driving mine operators to consider cement tailings backfill (CTB) as an efficient tailings management and backfill method [6].
The key characteristics of tailings being assessed for suitability as backfilling are free water, permeability, strength, and bulk density. Among others, the pumpability of CTB is important since it depends on the viscosity and yield stress of fresh CPB as well as the type of the pump employed and the geometry of pipeline distribution system [7,8]. In turn, the viscosity of CTB is greatly affected by pulp density, grain size distribution (GSD, mainly the fines minus 20 μm), and binder content [9]. As a general rule, CTB should contain a minimum of 15% by weight in the minus 20 μm size fractions [10,11,12,13].
Determining the flow properties of CTB as a function of mix composition and system variables is of great importance in designing a pipeline delivery system [14]. Indeed, this is a challenging task since the material characteristics greatly depend on feed ores [15]. The rheological properties and pipeline resistance loss (PRL) are key parameters for the pipeline transportation of CTB paste [16,17,18]. These two parameters are directly related to the cost of backfilling [19]. Prepared CTB paste with good fluidity and low PRL can seriously save the on the cost of slurry transport [20,21,22].
Hence, researchers have conducted various investigations on the rheological properties of backfill slurries [23,24,25,26,27,28,29]. Studies have shown that CTB’s rheology is closely related to many factors such as solid content (SC), tailings grain size, curing temperature, cement type, and the chemistry of additives [30,31,32]. The yield stress and viscosity increased as the solid concentration increased when the slurry flow is in a homogeneous state. [33,34]. Additionally, a major increase in the CTB’s viscosity by increasing SC leads to the formation of tailings grains for a skeleton formation [35]. Besides, researchers also explored the effect of additives such as water-reducing agent, sulfate, and red mud on the rheological properties of CTB. They have experimentally shown that appropriate additives can effectively improve the rheological properties of fresh backfill slurries [36,37,38,39,40]. The yield stress decreases negative exponentially and the plastic viscosity decreases linearly with an increase in shear time [41].
The uniaxial compressive strength (UCS) of CTB mixtures is another important parameter. Numerous researchers have found that the UCS performance of cemented backfills is mainly related to the cement-to-tailings ratio (c/t), SC, curing temperature, and curing time (CT) [42,43,44]. In this regard, Wang et al. [45] found that the loading path and loading rate has a distinct effect on the mechanical characteristics of the backfill. Zhao et al. [46] showed that the addition of both new type slag cement and fly ash can improve the mechanical properties of CTB mixes by improved the bonding/connection interface generated between the tailings aggregates. Jiang et al. [47] proved that for a given fill recipe and CT, the alkali-activated slag–CPB matrix provides far better workability and strength (2.2–3.3-fold) performance than ordinary Portland cement–CPB matrix. Xue et al. [48] experimentally showed that polypropylene fiber exhibited the strongest reinforcing effect, followed by polyacrylonitrile and glass fiber in the cement-tailings matrix composites.
Although the mechanical properties of cemented backfill are well understood, the shrinkage ratio and rheological characteristics need further study. The objective of this study is to explore and analyze the rheological and mechanical properties of CTB mixtures.
2. Materials and Methods
2.1. Characterization of Materials
2.1.1. Tailings
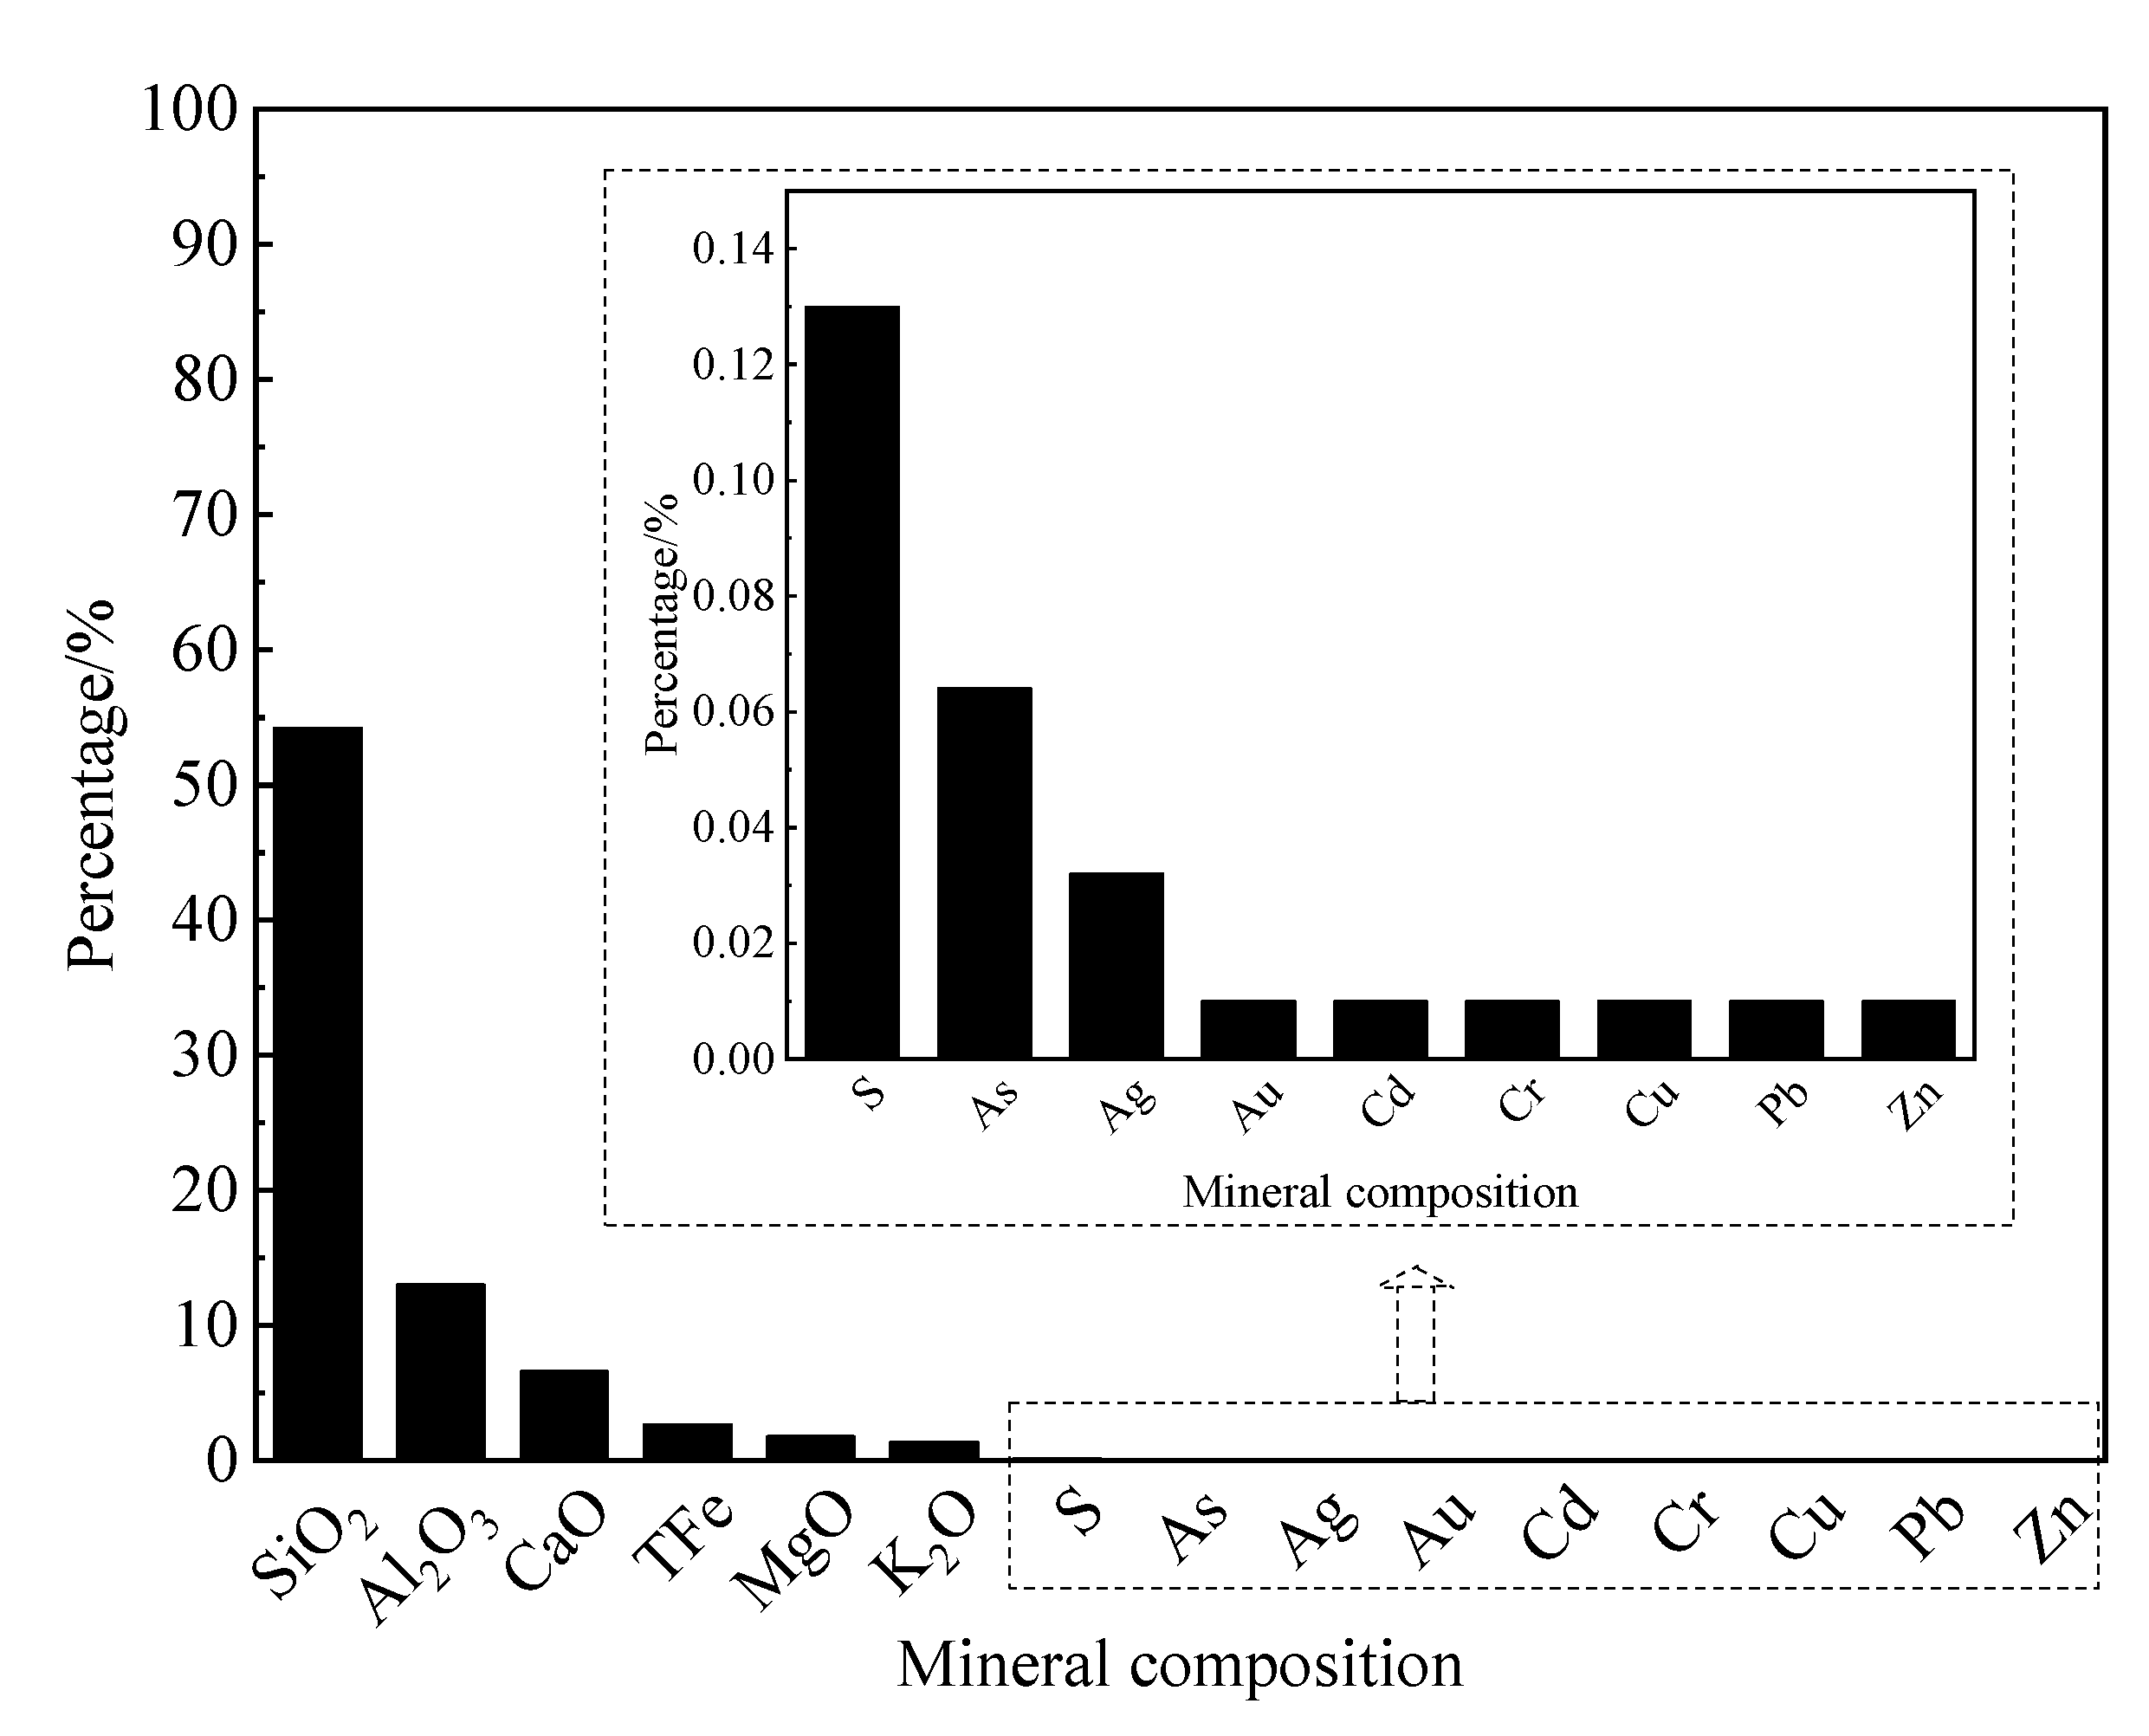
The tailings used in this study were sampled from the discharged point of the mineral processing plant at a Chinese gold mine. The sampled tailings slurry was naturally precipitated in plastic drums until the upper liquid is clear, and then, the clean water was removed. The remaining precipitate was dried in an oven for 24 h. The drying temperature of 100 °C. The dried tailings were stored in sealed plastic containers to avoid any oxidation until their utilization for experimental tests. The tailings were mixed to make a representative sample for evaluating their physical and chemical properties. The chemical composition of the tested mine tailings are shown in Figure 1.
The recoverable metal content is relatively low. CaO, Al2O3, SiO2, and MgO are the main oxides commonly found in tailings, and their mass fraction accounts for 76% of the total. CaO, Al2O3, and MgO are active oxides, which are favorable for cementation, coagulation, and bearing capacity after backfilling [49]. The corresponding content percentages are 7%, 13%, and 2%, respectively. SiO2 is inert, which will reduce the cementing performance of the backfill, but it has a fast settling speed and good permeability. The content of SiO2 in the tailings was the highest, reaching 54.2%. The S percentage content is only 0.13%. According to Peng et al. [39], the sulfide content is relatively low, which hurts the strength of CTB. The activity coefficient (Al2O3 / SiO2) of tailings was 0.24. Although SiO2, as the main mineral component of the whole tailings, determines that the whole tailings are inert materials, the tailings have corresponding cementing activity and can be stimulated for comprehensive utilization.
The grain size distribution of the tested gold mine tailings was determined with Malvern Mastersizer—3000 (version 3.71, Malvern Panalytical, Worcester, UK), which works on the wet dispersion method using laser diffraction. The obtained grain size distribution curve is clearly shown in Figure 2, and the characteristic value of particle size grading is listed in Table 1.
It can be seen from Figure 2 and Table 1 that the weighted average particle size of tailings is about 60 μm. In general, the particle size composition should conform to the equation: K0 = d60/d10 and the optimal particle size grading K0 = 4–5 [50]. According to the particle size distribution of tailings, the content of fine particles less than 38 μm accounted for about 50% of the tailings, and the content of fine particles less than 20 μm accounted for about 38%.
2.1.2. Binder and Mixing Water
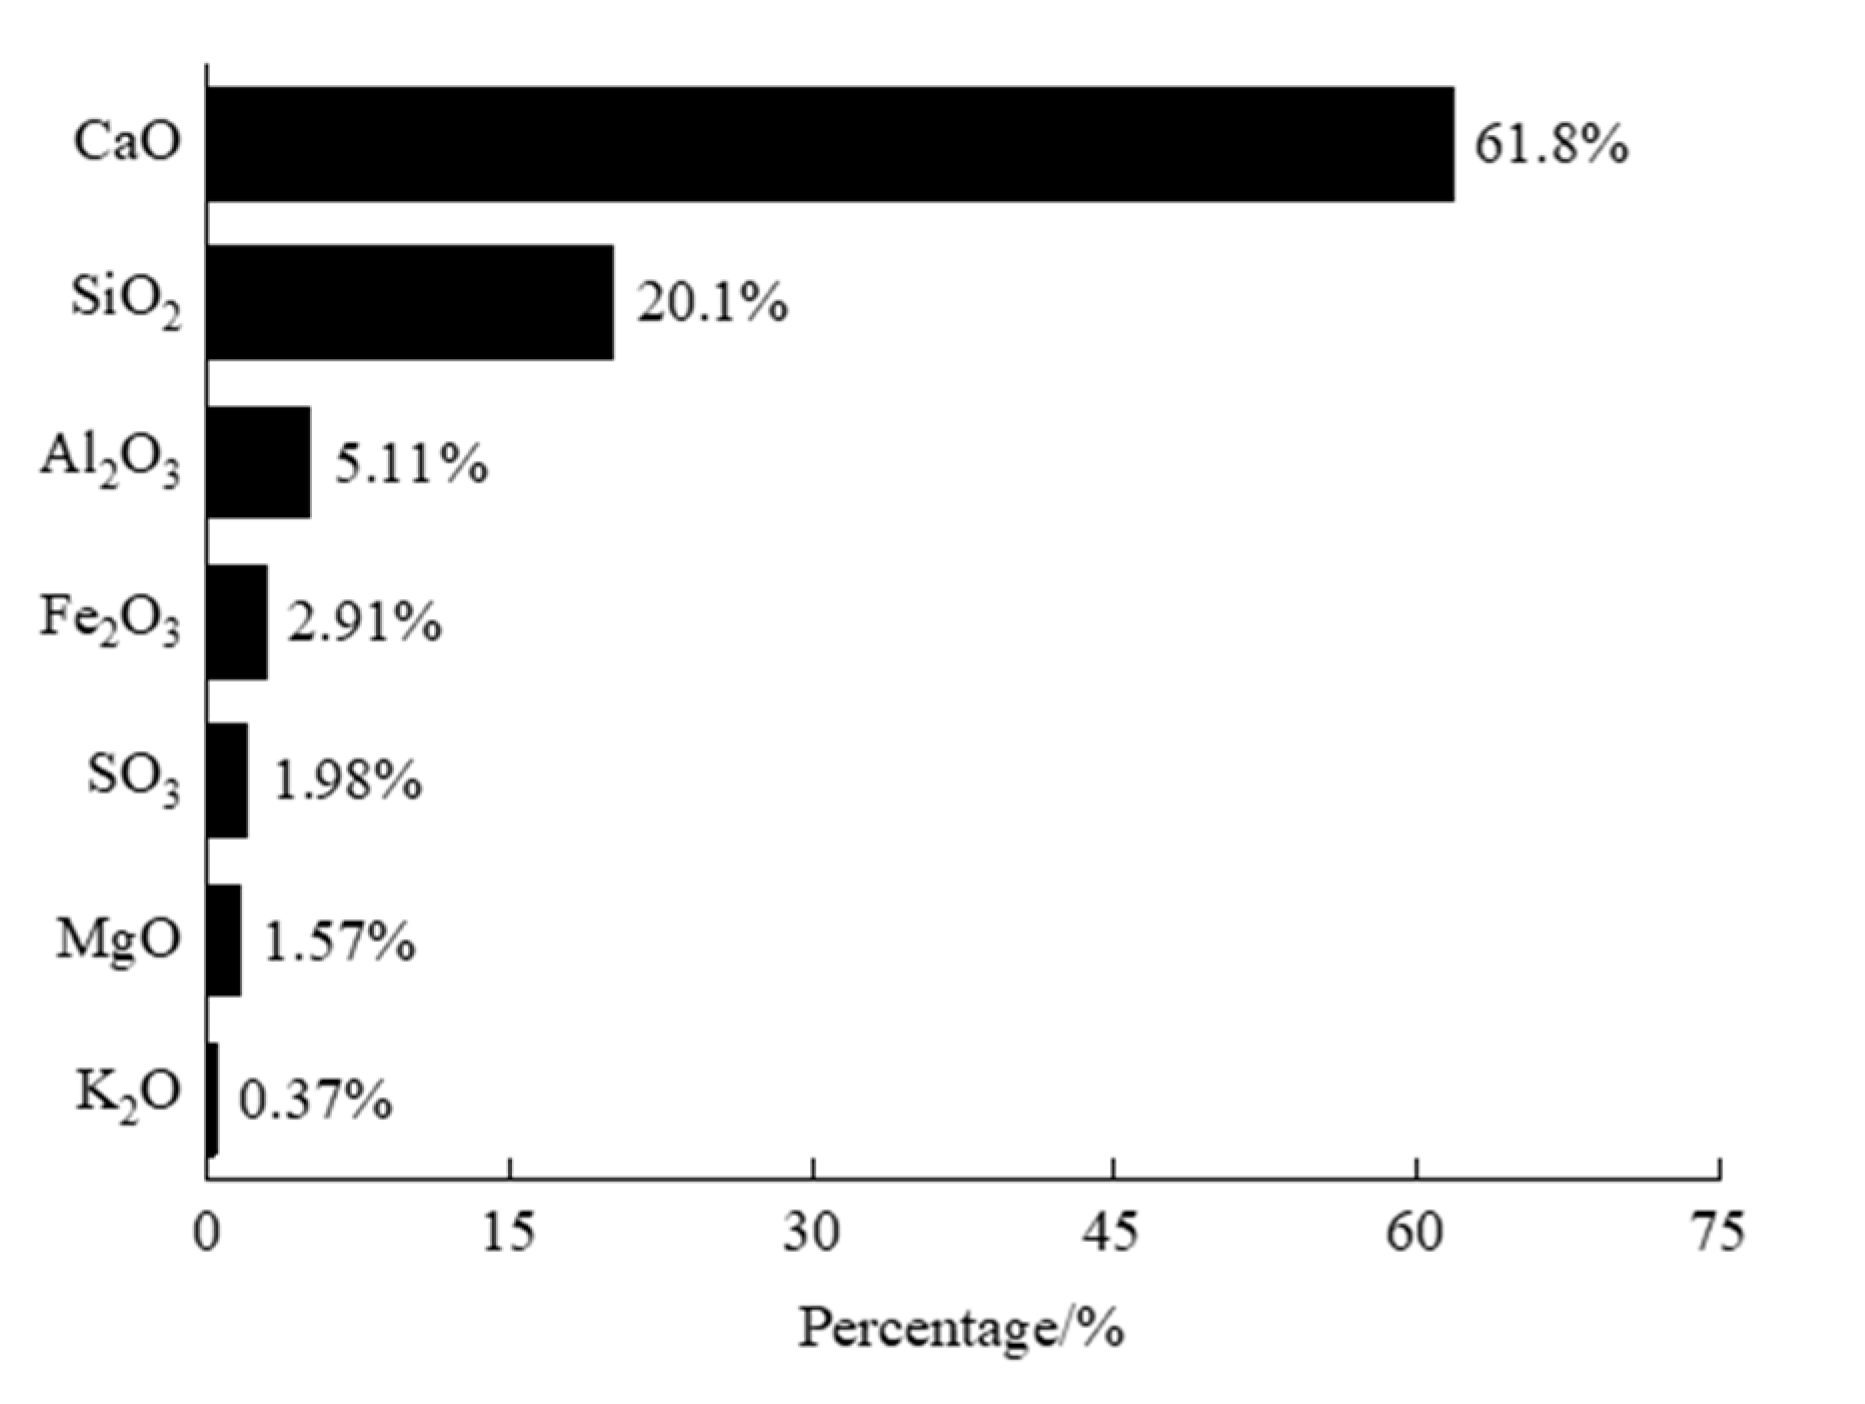
The binding agents play a major role in lubrication for backfill during pipeline transportation and also contribute to the strength of cured backfill mixtures [51,52]. In this study, Ordinary Portland Cement (OPC) 42.5R type was selected as the main cementitious material. In general, a typical cement content in the backfill mix ranges from 2–15% of total dry tailings by weight [45]. The chemical composition of the used cement type is shown in Figure 3. The main chemical composition of cement is CaO, SiO2, Al2O3, and Fe2O3, and the total content amounts to up to 90%. The mixing water used during tests was local water.
2.2. CTB Sample Preparation
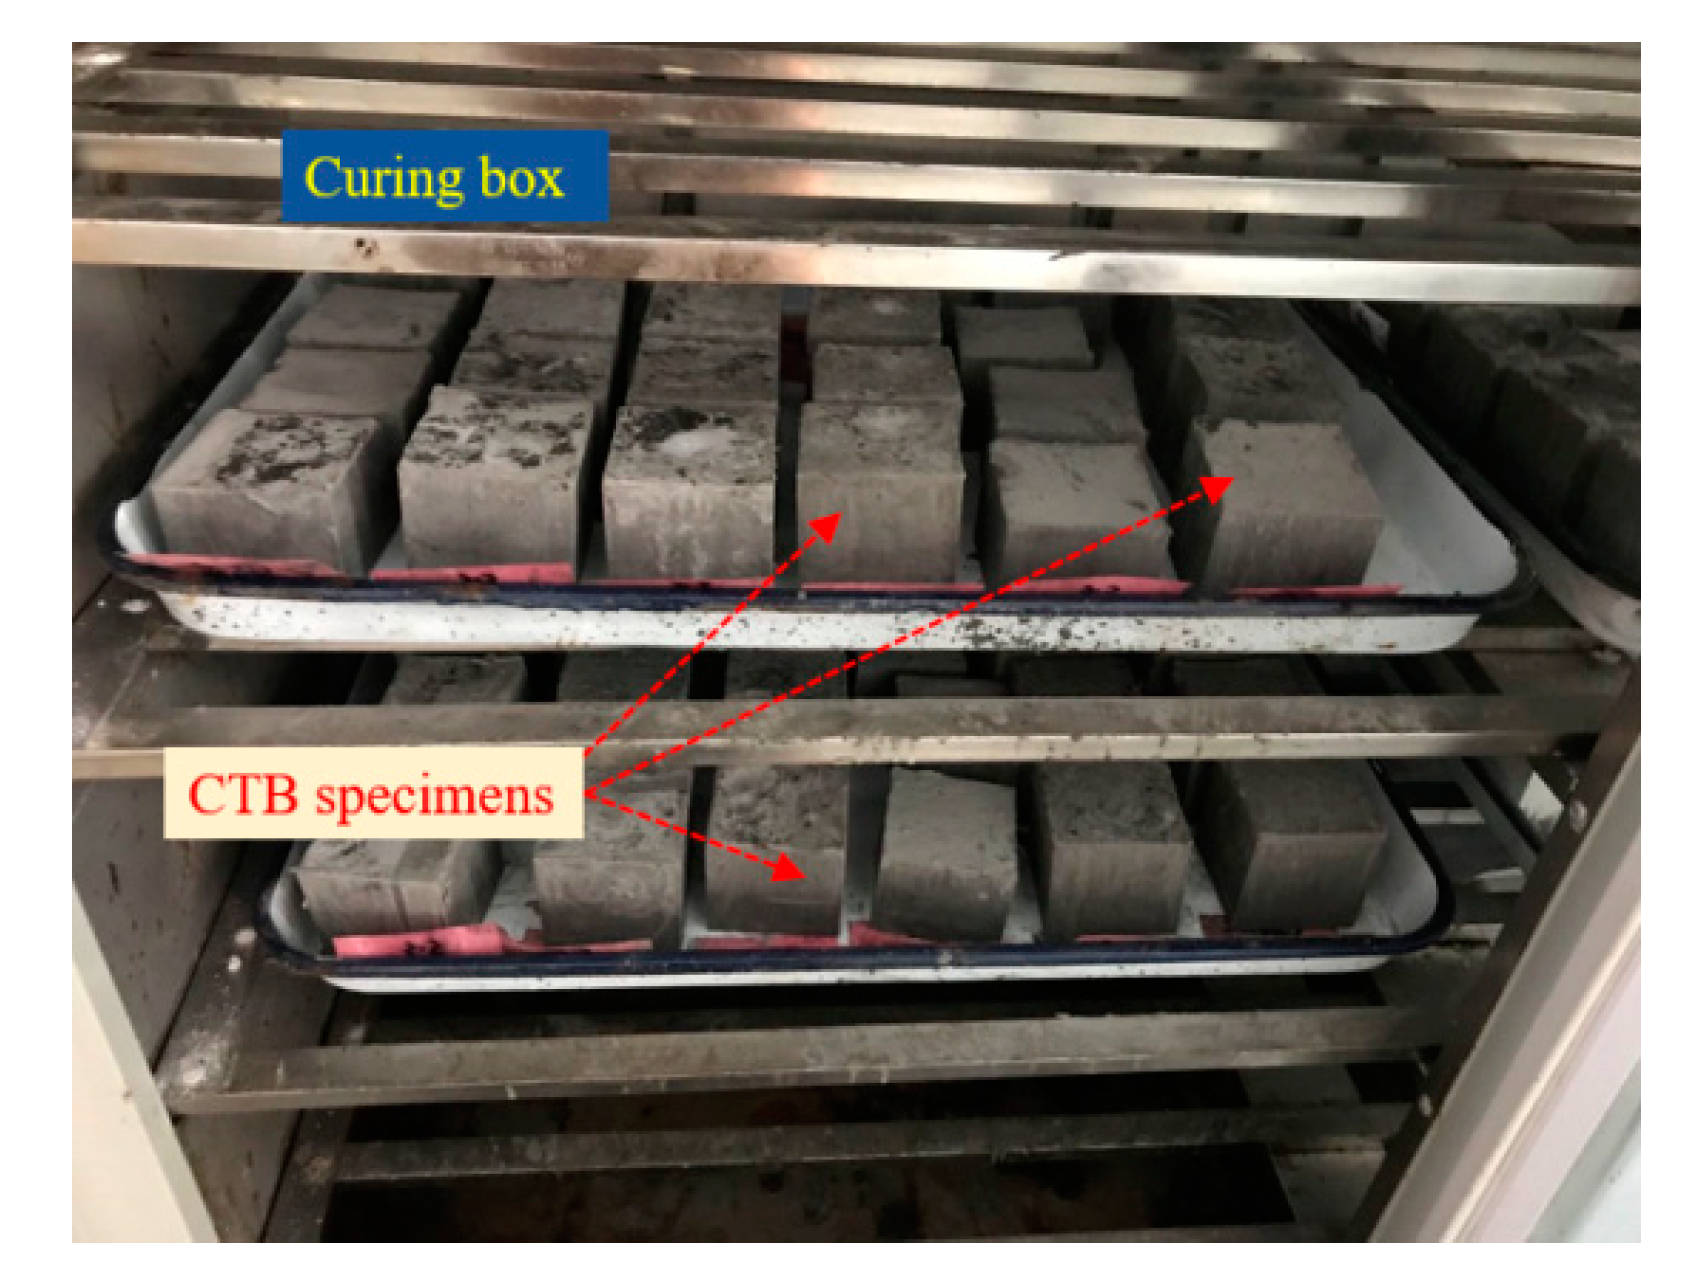
The SC of CTB is usually between 65 and 72 wt. % [9]. In this study, 27 groups of CTB samples were prepared with an SC value of 65, 67, and 69 wt. %, and c/t values of 1:04, 1:10, and 1:20, respectively. The cement and water are weighted and then blended in a mixer until obtaining a homogenous mixture. The mixing time was taken as three minutes for all backfill mixes. CTB mostly exists in the form of the cube in the mined-out void, so the prepared backfill mixes were poured into 7.07 cm × 7.07 cm × 7.07 cm standard mold, followed by a setting time (48 h) to obtain cubic samples. Following this, CTB samples were removed from the cubic molds and kept in the humidity chamber which has a temperature of 20 ± 1 °C and relative humidity of 92 ± 5%. All CTB mixes were cured for 3, 7, and 28 days. The final CTB samples are shown in Figure 4.
2.3. L-Shaped Tube Experiment
Viscosity includes dynamic viscosity and kinematic viscosity, and what we measured in this study is dynamic viscosity. Dynamic viscosity is the internal friction force generated per unit area when a liquid flows under a unit velocity gradient. Measuring the yield stress and viscosity coefficient of the slurry can improve the understanding of pipeline transportation characteristics.
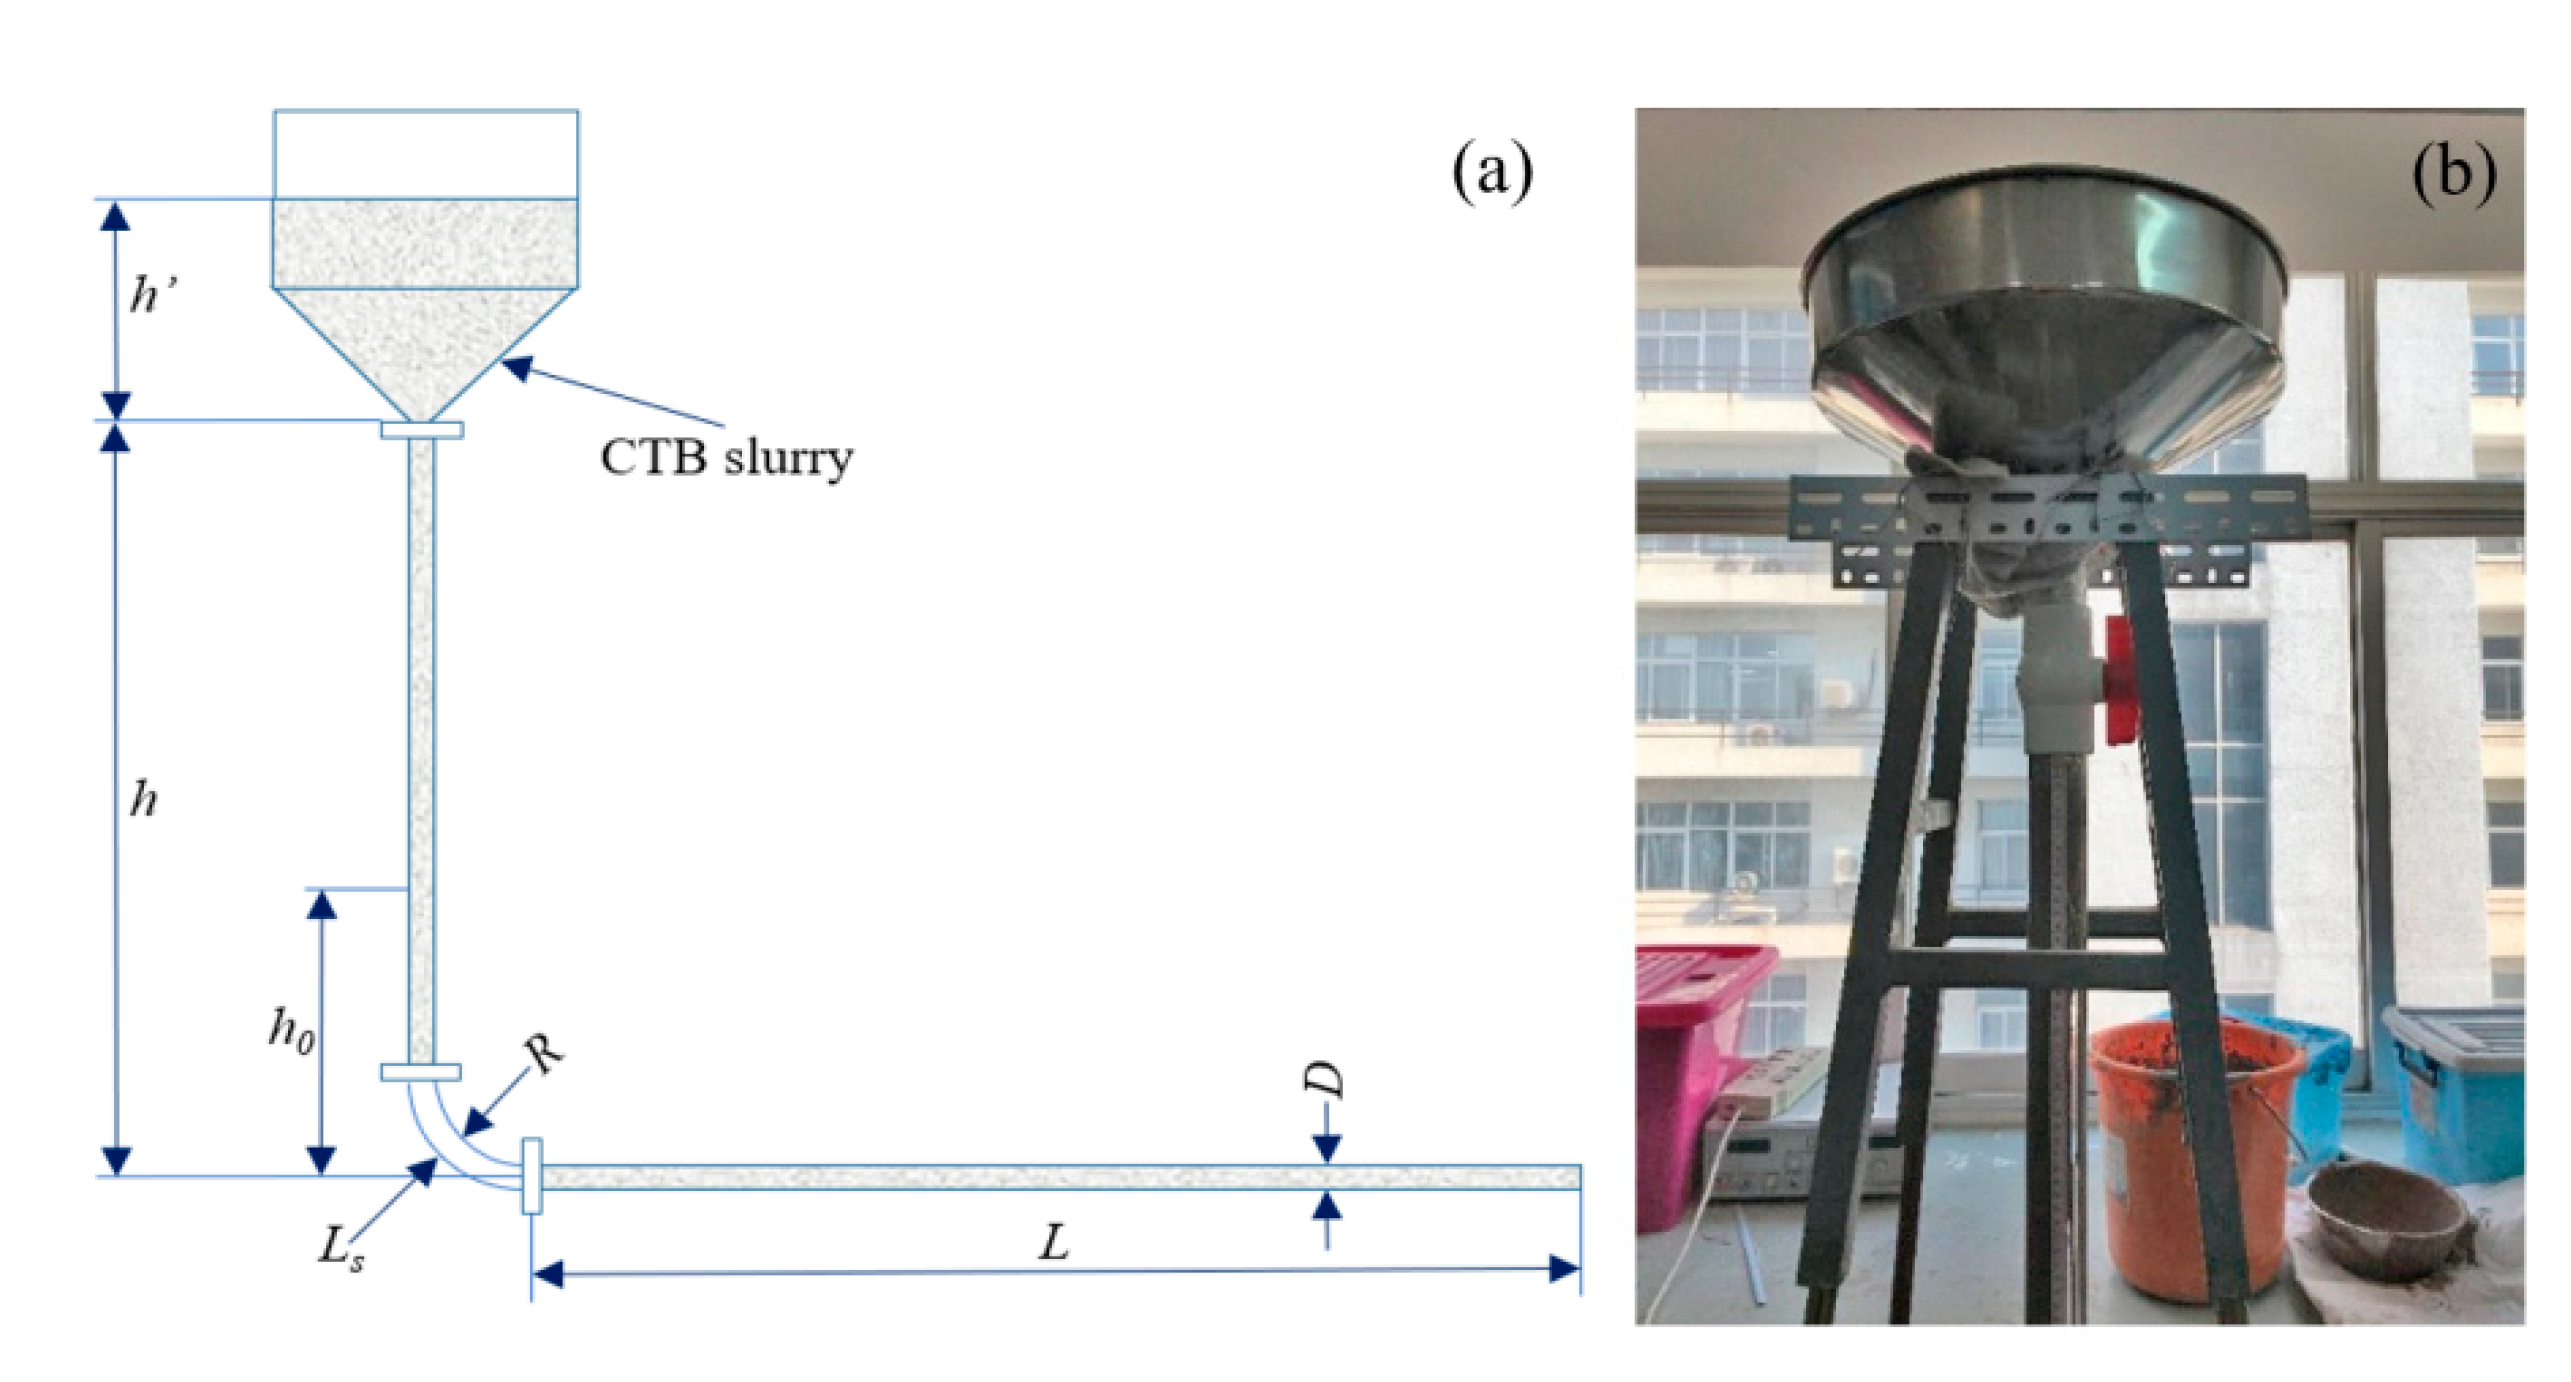
According to the rheological theory and the energy equation of fluid pipeline transportation, it is more economical and reasonable to obtain the rheological parameters of backfill slurry by using the L-pipe transportation experiment [53,54]. The small-scale experiment device for L-shaped pipeline transportation consists of a section of the vertical pipeline, a section of the horizontal pipeline, and a feeding funnel, as shown in Figure 5. The vertical pipe height (h) is 1.5 m, horizontal pipe (L) is 2.5 m long, and pipe diameter (D) is 0.05 m.
After fully stirring the backfill to the corresponding mixture ratio, the density of CTB paste is first measured and then poured into the upper experimental funnel. The backfill slurry flows down the vertical pipe which is connected to the lower outlet. For each experiment, the following were recorded: backfill slurry density, the resting level height (h0), and the backfill slurry weight (G) flowing out in time (t), and calculated the backfill slurry velocity (v). The temperature during the experiment was 20 ± 2 °C.
2.4. Unconfined Compressive Strength Testing
The electronic hydraulic pressure test machine is used to test the single-suction compressive strength of 27 groups of CTB samples. The rate of loading was 0.2 mm/min, as shown in Figure 6. The maximum load value displayed is recorded when the CTB sample is damaged. Each group of experiments has three CTB samples.
3. Results and Discussion
3.1. L-Shaped Tube Experiment Results
3.1.1. Rheological Properties of CTB Mixes
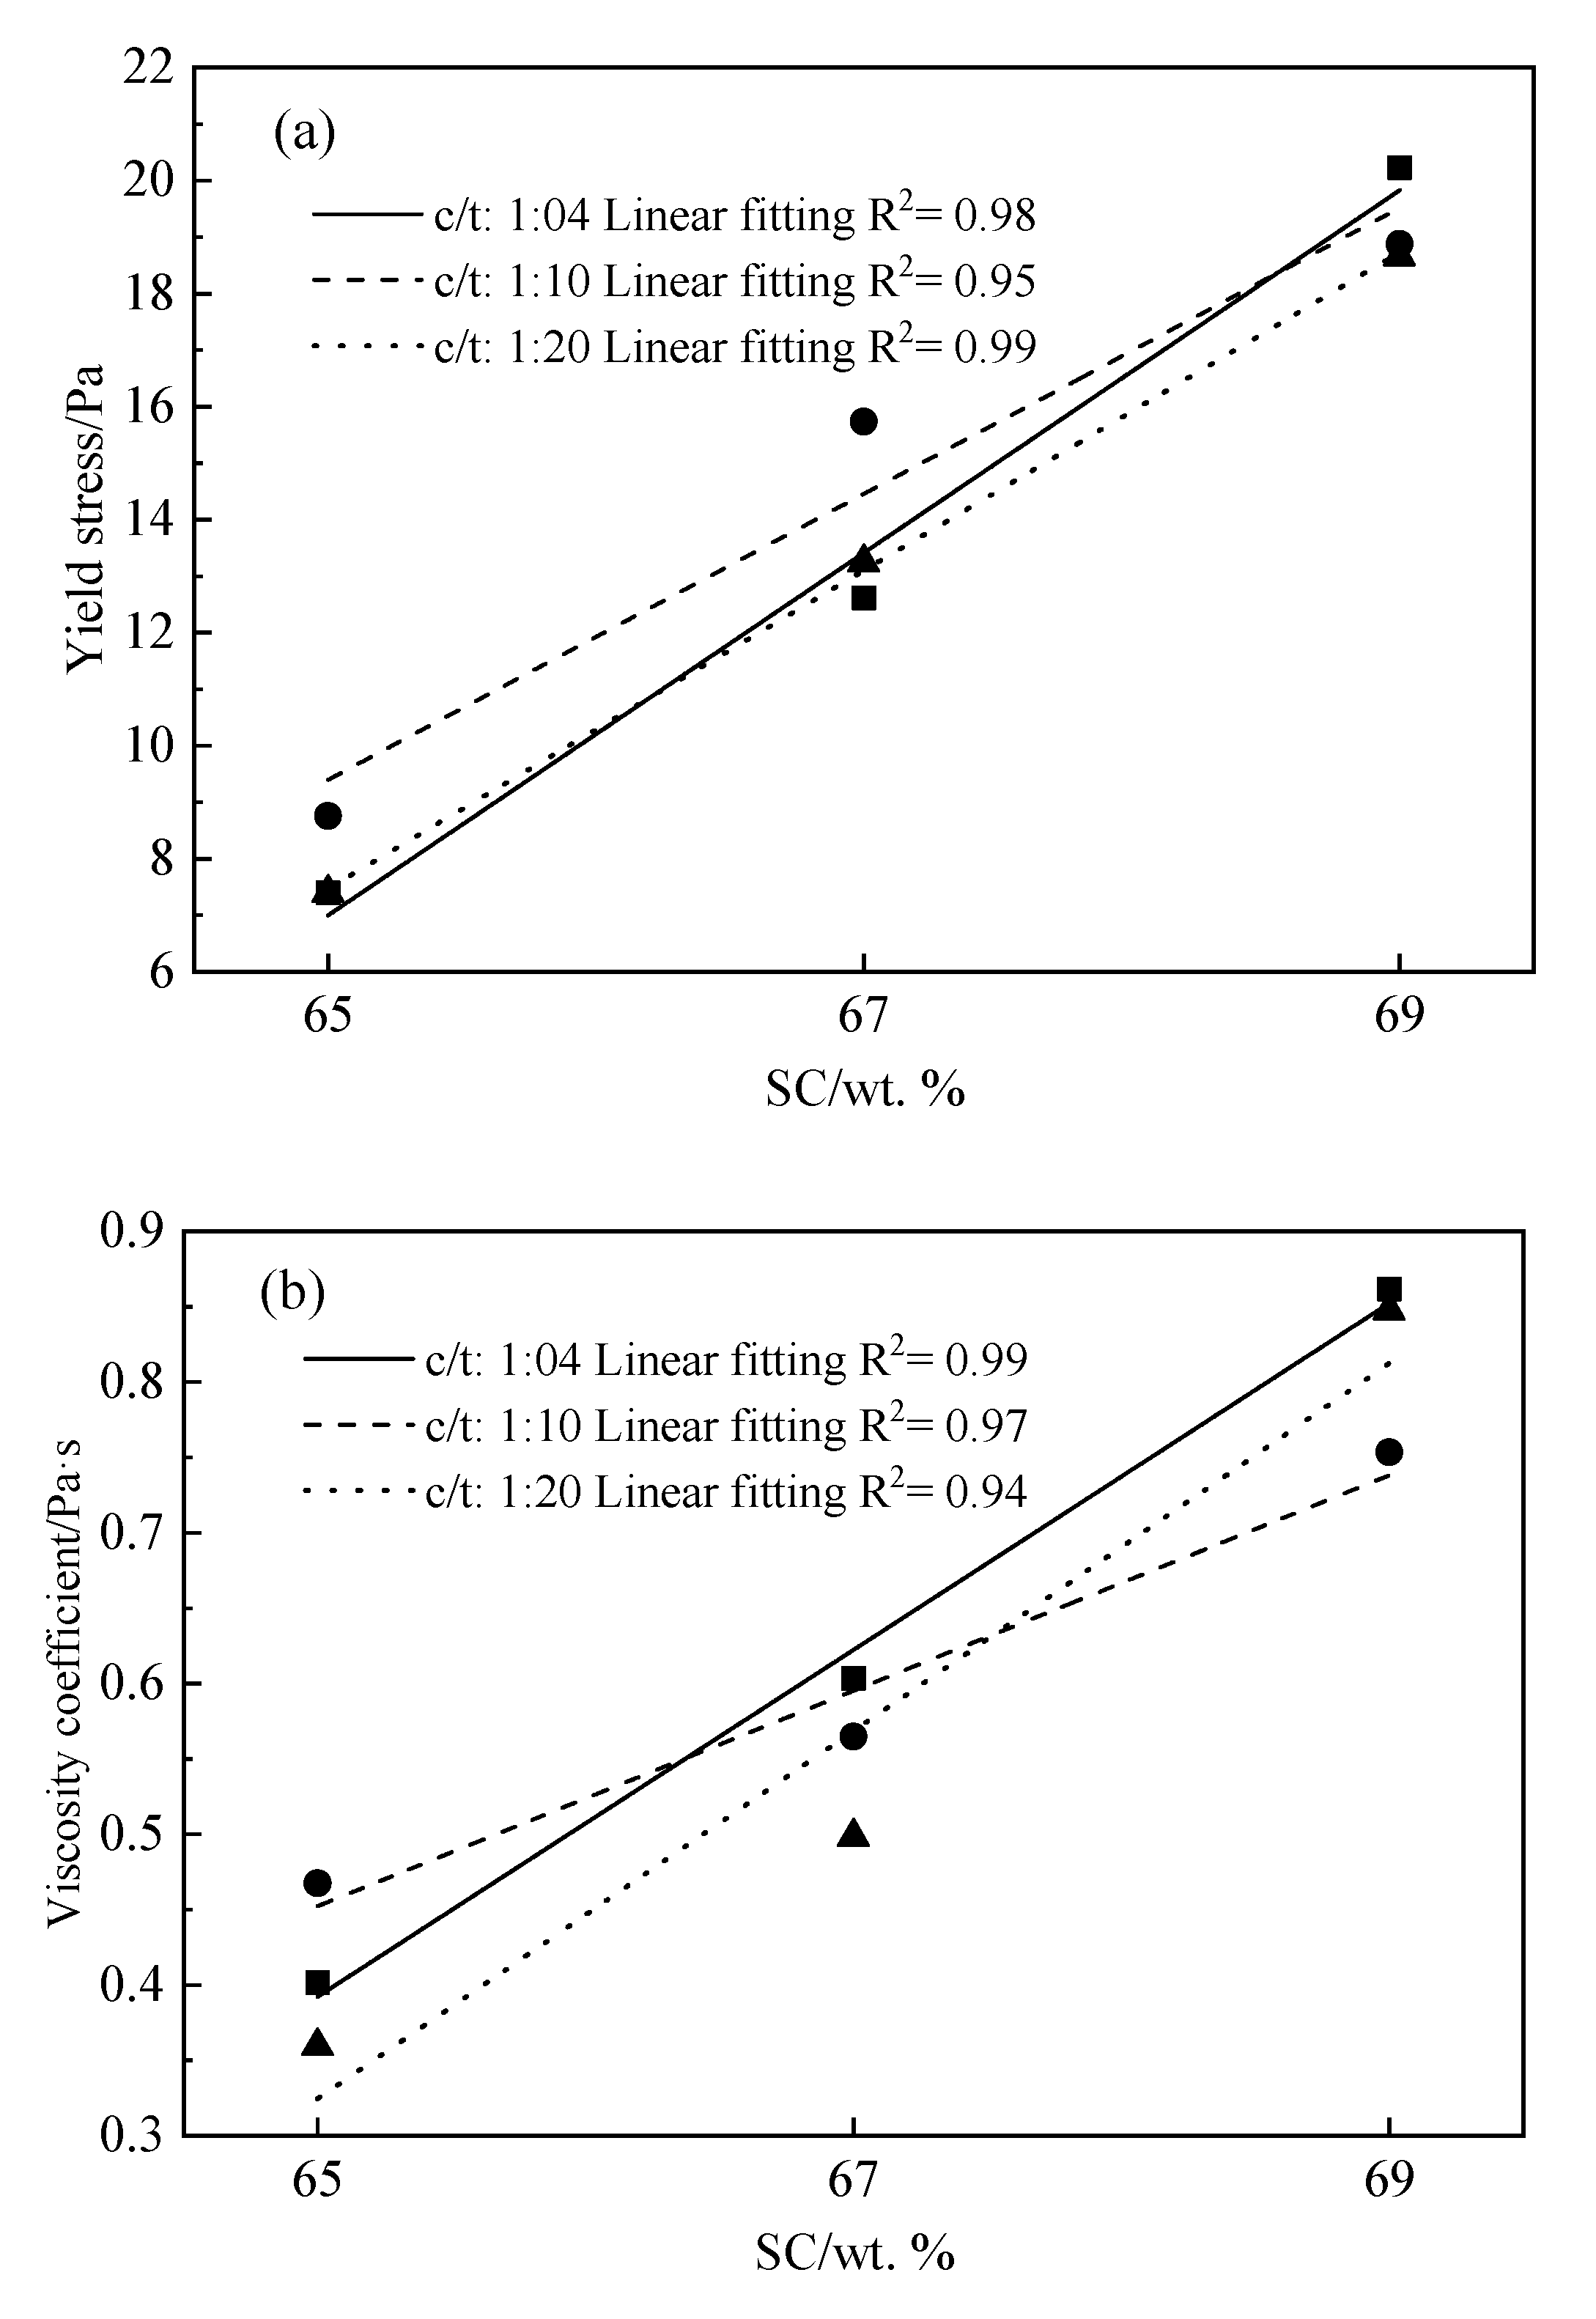
The variation of the yield stress of the backfill slurry with different c/t values with SC is shown in Figure 7a. When the value of the c/t ratio was fixed, the yield stress and viscosity coefficient of the backfill slurry increased with increasing SC. For example, at c/t of 1:04, the yield stress increased from 7.39–20.23 Pa across all SC, which was a 1.74 times increase in yield stress. At c/t of 1:10, the yield stress increased from 8.75–18.88 Pa across all SC, which was a 1.16 times increase in yield stress. At c/t of 1:20, the yield stress increased from 7.40–18.66 Pa across all SC, which was 1.52 times in yield stress. In the experiment, for all c/t values, a 2% increase in SC resulted in a 55–85% increase in yield stress. Figure 7b shows the relationship between SC and the viscosity coefficient. At fixed c/t ratios the viscosity coefficient of CTB paste increased proportionally with SC. For example, at c/t of 1:04, the viscosity coefficient increased from 0.40 to 0.86 Pa·s, which was a 1.15 times increase in the viscosity coefficient. In the experiment, for all c/t values, a 2% increase in SC resulted in a 30–65% increase in the viscosity coefficient. At the lab scale, the increase in SC results in a decrease in free-water content. It’s believed that the increase in particle density, increasing the viscosity coefficient. However, when SC was the same, and the value of the c/t ratio was changed, the yield stress and viscosity coefficient of the backfill slurry did not present obvious rules. This finding suggests that the rheological properties of the backfill slurry are more sensitive to SC and less sensitive to the c/t ratio.
Fitting and analyzing the experimental results, a linear fit was selected given the multiple correlation coefficient (R2) of 0.98 and can be generalized as follows:
For the yield stress for SC = 65 − 69 wt.%.
Similarly, the relationship between the SC of the backfill slurry and the viscosity coefficient can be expressed as follows:
For the viscosity coefficient for 20 ± 2 °C.
3.1.2. Pipeline Resistance
The backfill slurry with a larger PRL requires more energy to be transported and causes more pipeline wear, which will increase the cost of backfilling. Due to the existence of pipeline resistance loss (PRL), pipeline wear and blockage accidents are prone to occur during slurry transportation, PRL is of great importance to a backfill operation [13]. The resistance loss of pipes at different flow rates (Q) and the flow resistance per unit length of pipes were calculated using the Buckingham Equation and the static equilibrium theory of pipe flow [34,55].
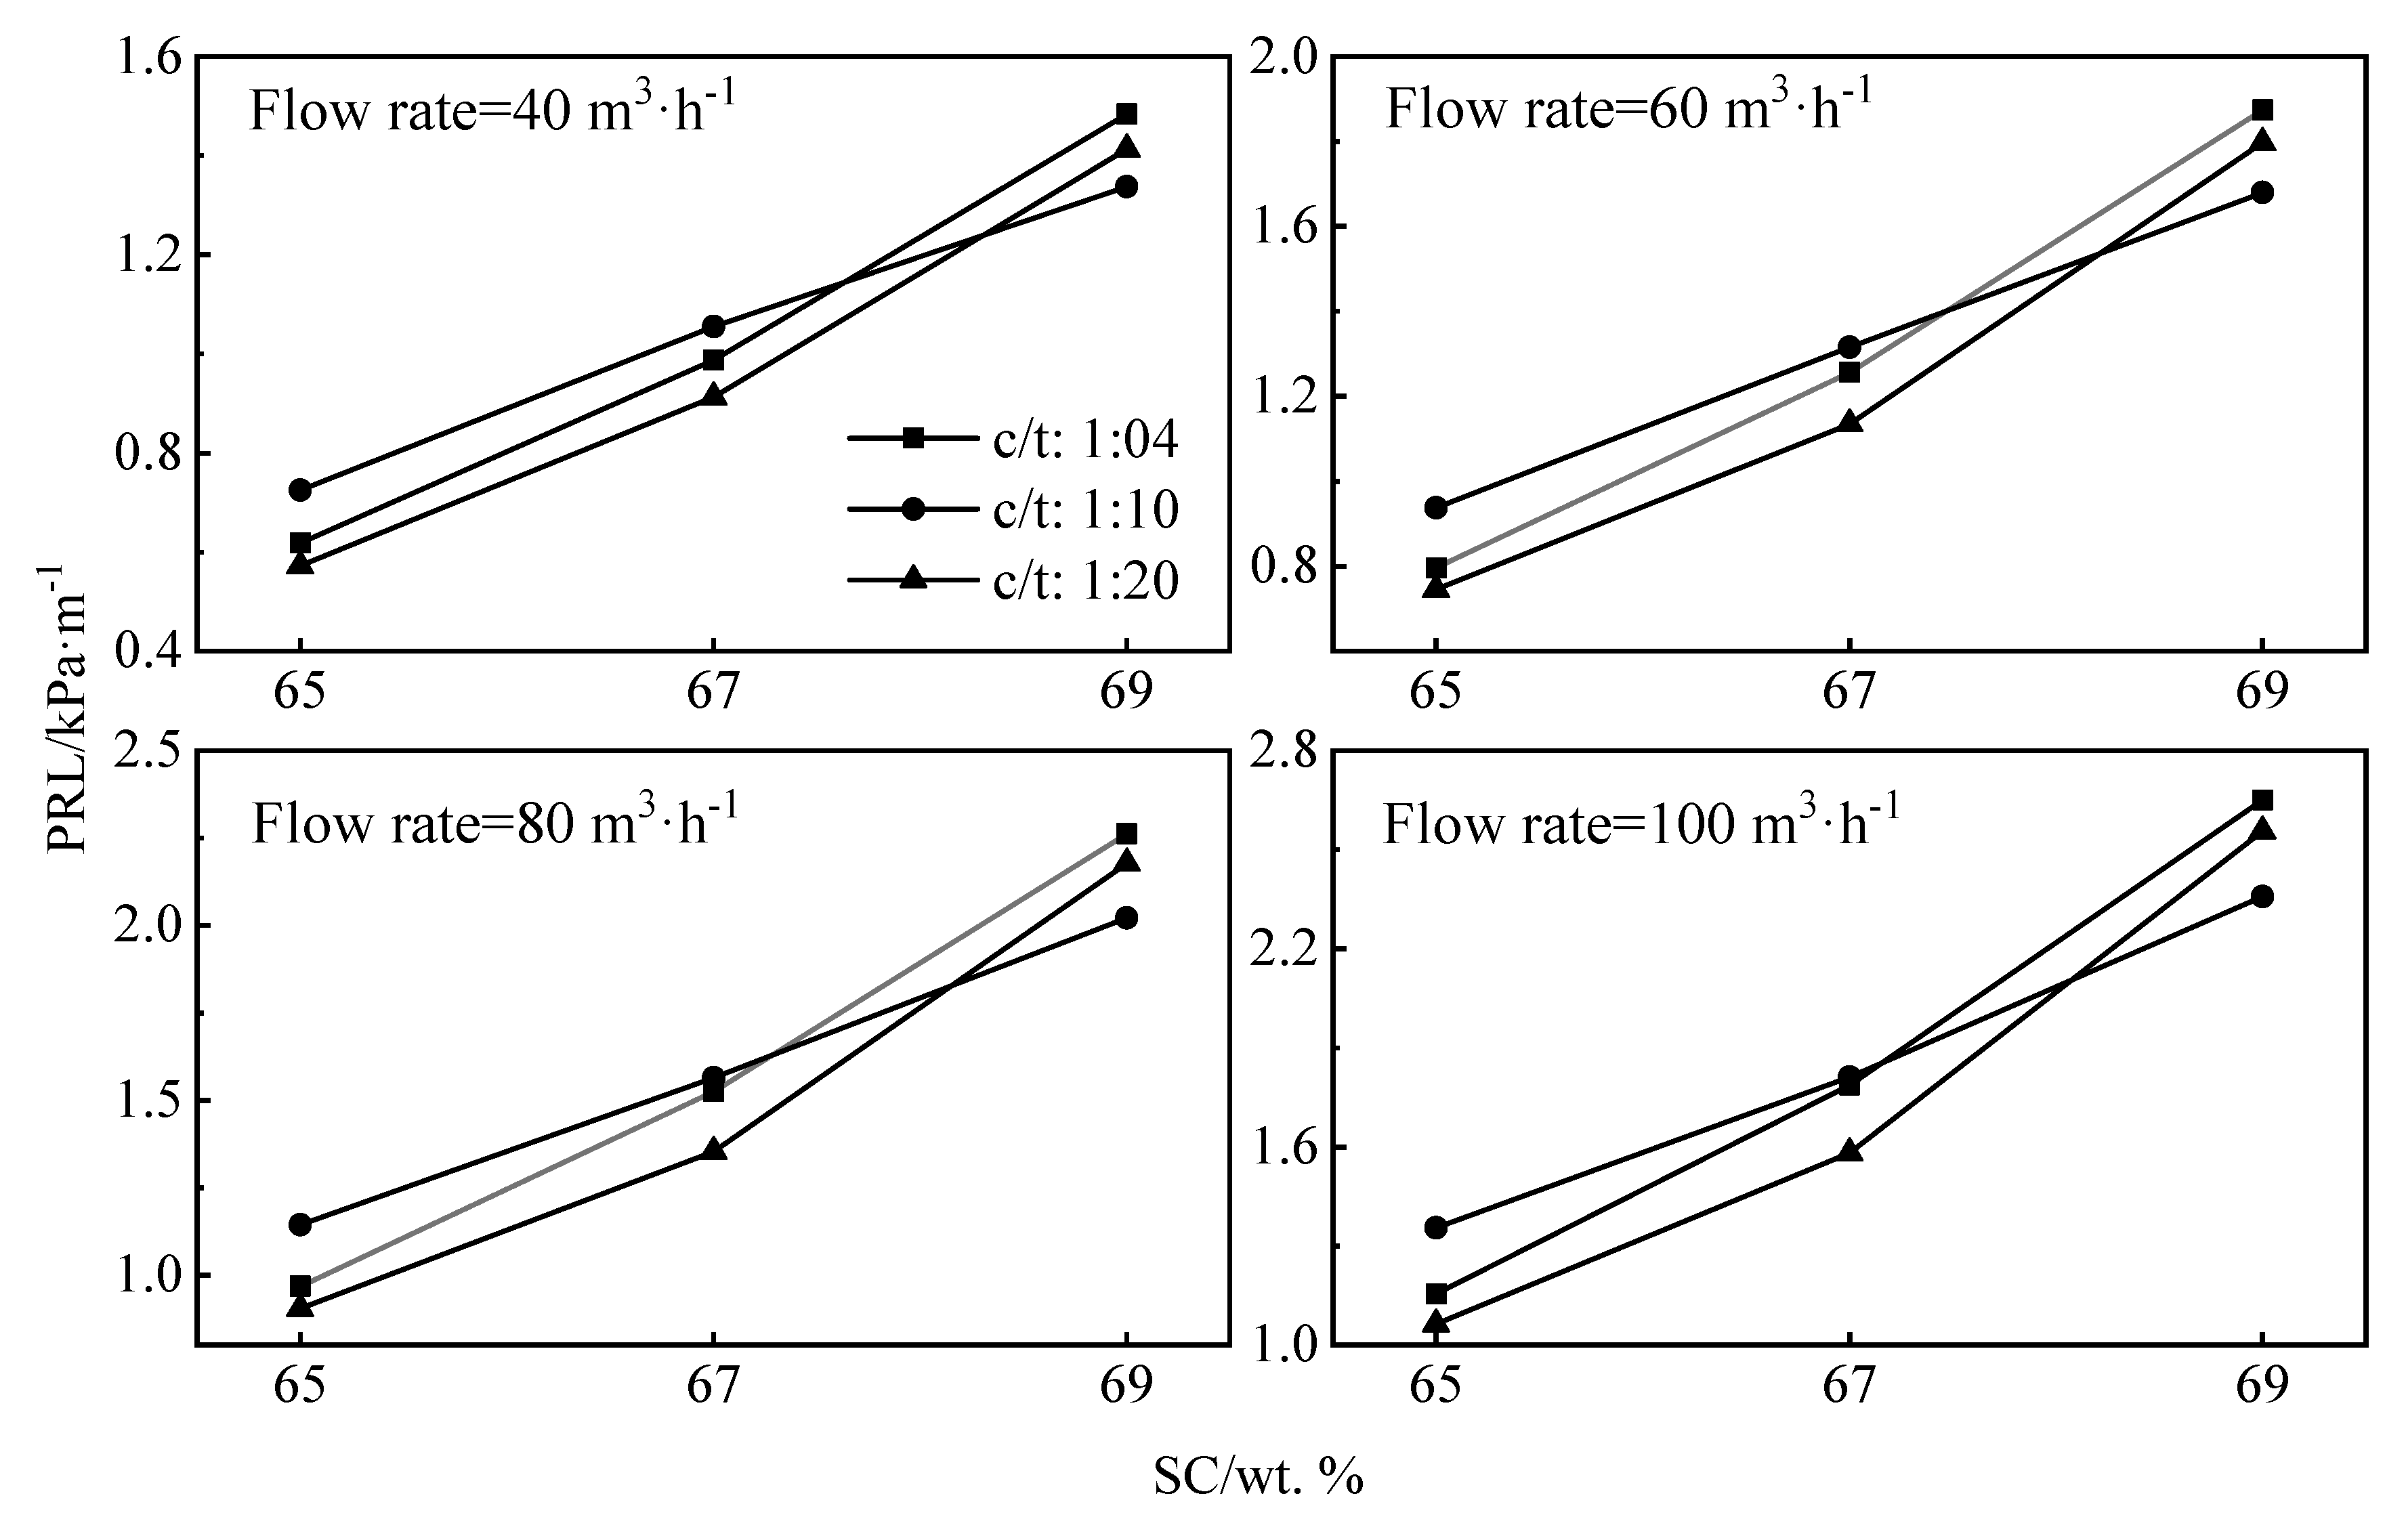
Figure 8 shows the PRL at varying flow rates. The resistance loss of the pipeline increased linearly with the flow rate of the pipeline, and the larger the SC is, the faster the PRL increases. For example, at a c/t value of 1:20 and SC of 65 wt. %, a 20 m3/h increase in flow rate results in a 0.16 kPa/m increase in PRL. At c/t value of 1:04 and SC of 65 wt. %, a 20 m3/h increase in flow rate results in a 0.18 kPa/m increase in PRL. At c/t value of 1:04 and SC of 69 wt. %, a 20 m3/h increase in flow rate results in a 0.39 kPa/m increase in PRL.
Figure 8 shows the relationship between backfill slurry SC and PRL. The PRL increased with an increase in SC. For example, the PRL increased 1.3 times, at a c/t value of 1:04, and a flow rate of 100 m3/h. The PRL increased 77%, at c/t value of 1:10, and a flow rate of 80 m3/h. In the experiment, at the c/t value of 1:04 and 1:20, a 2% increase in SC resulted in a 70% increase in PRL. At c/t value of 1:10, a 2% increase in SC resulted in a 40% increase in PRL. It is assumed that the moisture reduction in the backfill influences the friction during transport. At c/t value of 1:04 and 1:20, the PRL growth rate is more obvious when the SC is higher than 67 wt. %, and the growth rate increased by about 35%. Using analysis of variance to process the test data to get the significance of each factor, as shown in Table 2, it can be found that the SC and flow rate is the most significant parameters for affecting the PRL.
3.2. Uniaxial Compressive Strength Results of CTB Samples
3.2.1. Effect of Solid Content
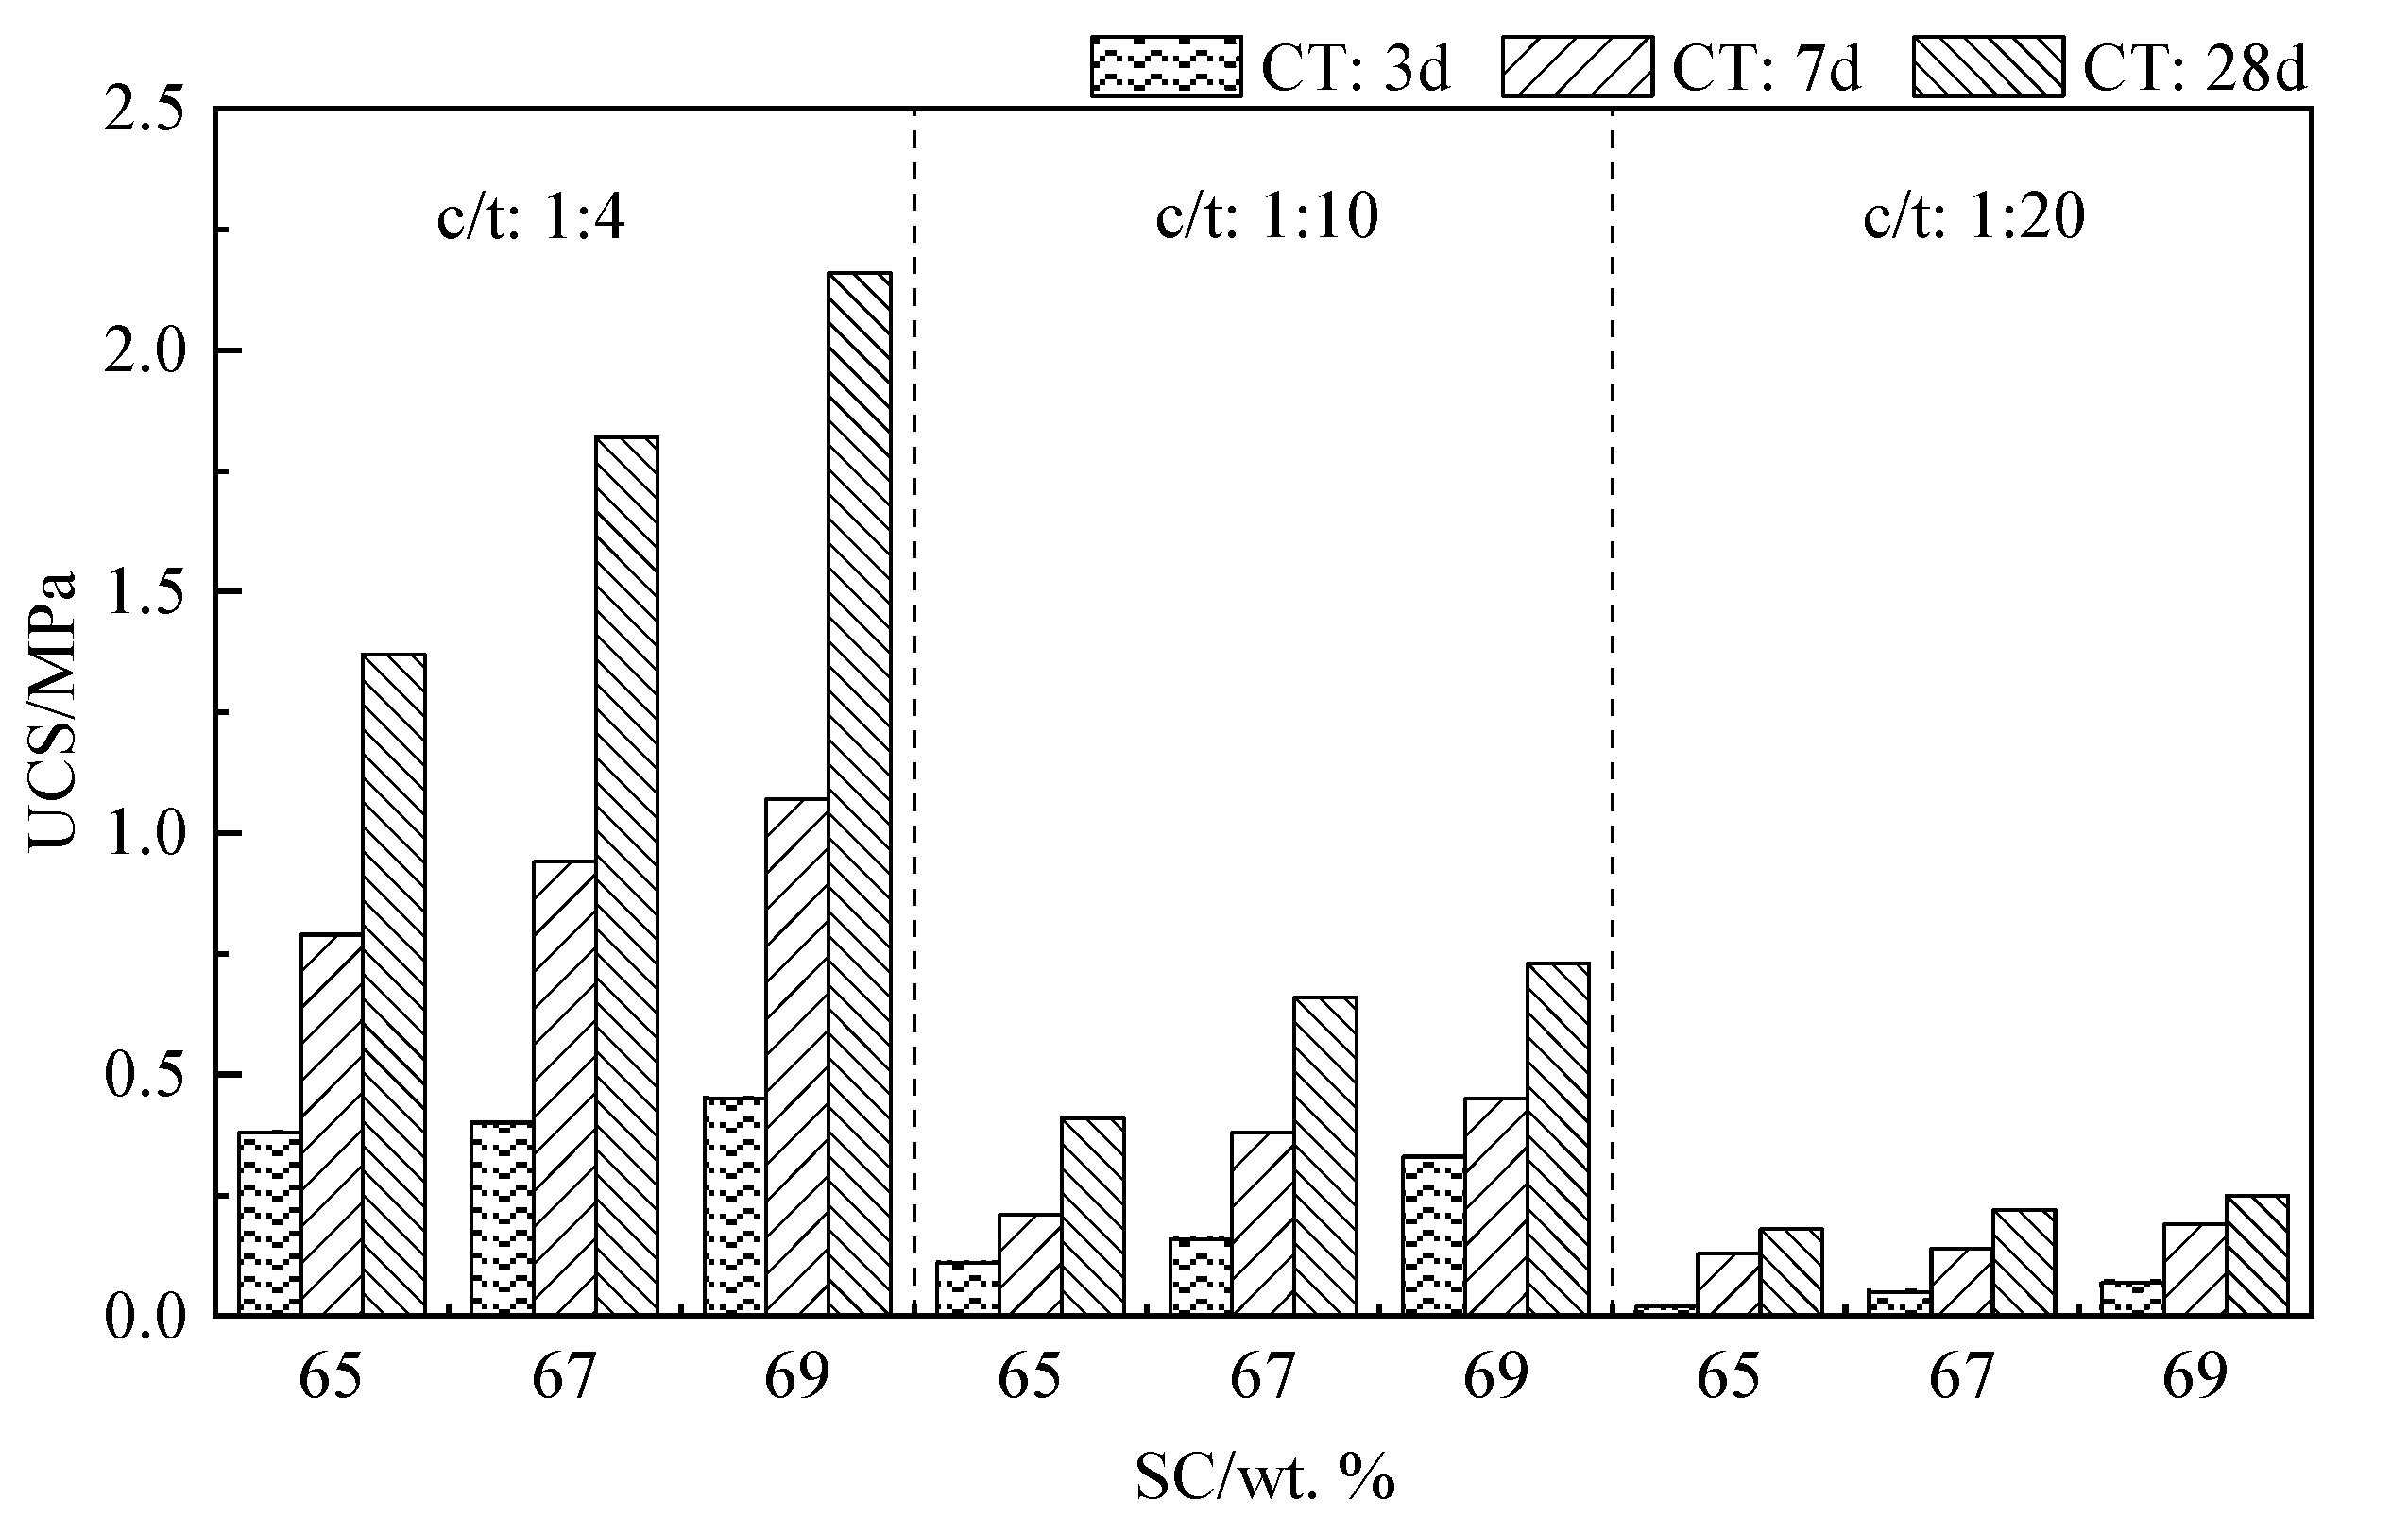
Figure 9 shows the relationship between the SC and UCS. If the (CT) and c/t values are fixed, the UCS of CTB mixes increases with SC. For example, at c/t of 1:04, CT at 28 days, the UCS increased from 1.37 MPa to 2.16 MPa across all SC, which was a 58% increase in strength. At c/t of 1:10, CT at 7 days, the UCS increased from 0.21 MPa to 0.45 MPa across all SC, which was the PRL increased 1.14 times increase in strength. At c/t of 1:20, CT at 3 days, the UCS increased from 0.02 MPa to 0.07 MPa across all SC, which was a 2.5 times increase in strength. In the experiment, for all c/t values, a 1% increase in SC resulted in a 12–70% increase in UCS. The CTB mixes with a high SC comprised a high cement content and plenty of gel substances (C–S–H) generated by the hydration reaction. The gel substances could be connected with tailings’ particles, and the resulting structure increased the UCS performance of CTB mixes [9].
If the SC and CT are fixed, the UCS of CTB mixes increases with cement. For example, at SC of 65 wt. %, CT at 28 days, the UCS increased from 0.18 MPa to 1.37 MPa across all c/t values. CT at 7 days, UCS increased from 0.14 MPa to 0.94 MPa across all c/t values. In the experiment, for all SC a 1% increase in cement resulted in a 36–44% increase in UCS. For CT at 28 days, UCS ranges between 0.18 MPa (c/t of 1:20, SC of 65 wt. %) and 2.16 MPa (c/t of 1:04, SC of 69 wt. %). According to common strength criteria for CTB samples used in mining applications, at c/t of 1:04, UCS meets the minimum 700 kPa threshold for stope stability. At c/t of 1:10, UCS meets surface tailings disposal applications and general construction practices. At c/t of 1:20, all CTB samples satisfy the need for eliminating liquefaction in underground disposal applications [46,56].
3.2.2. Effect of Curing Time
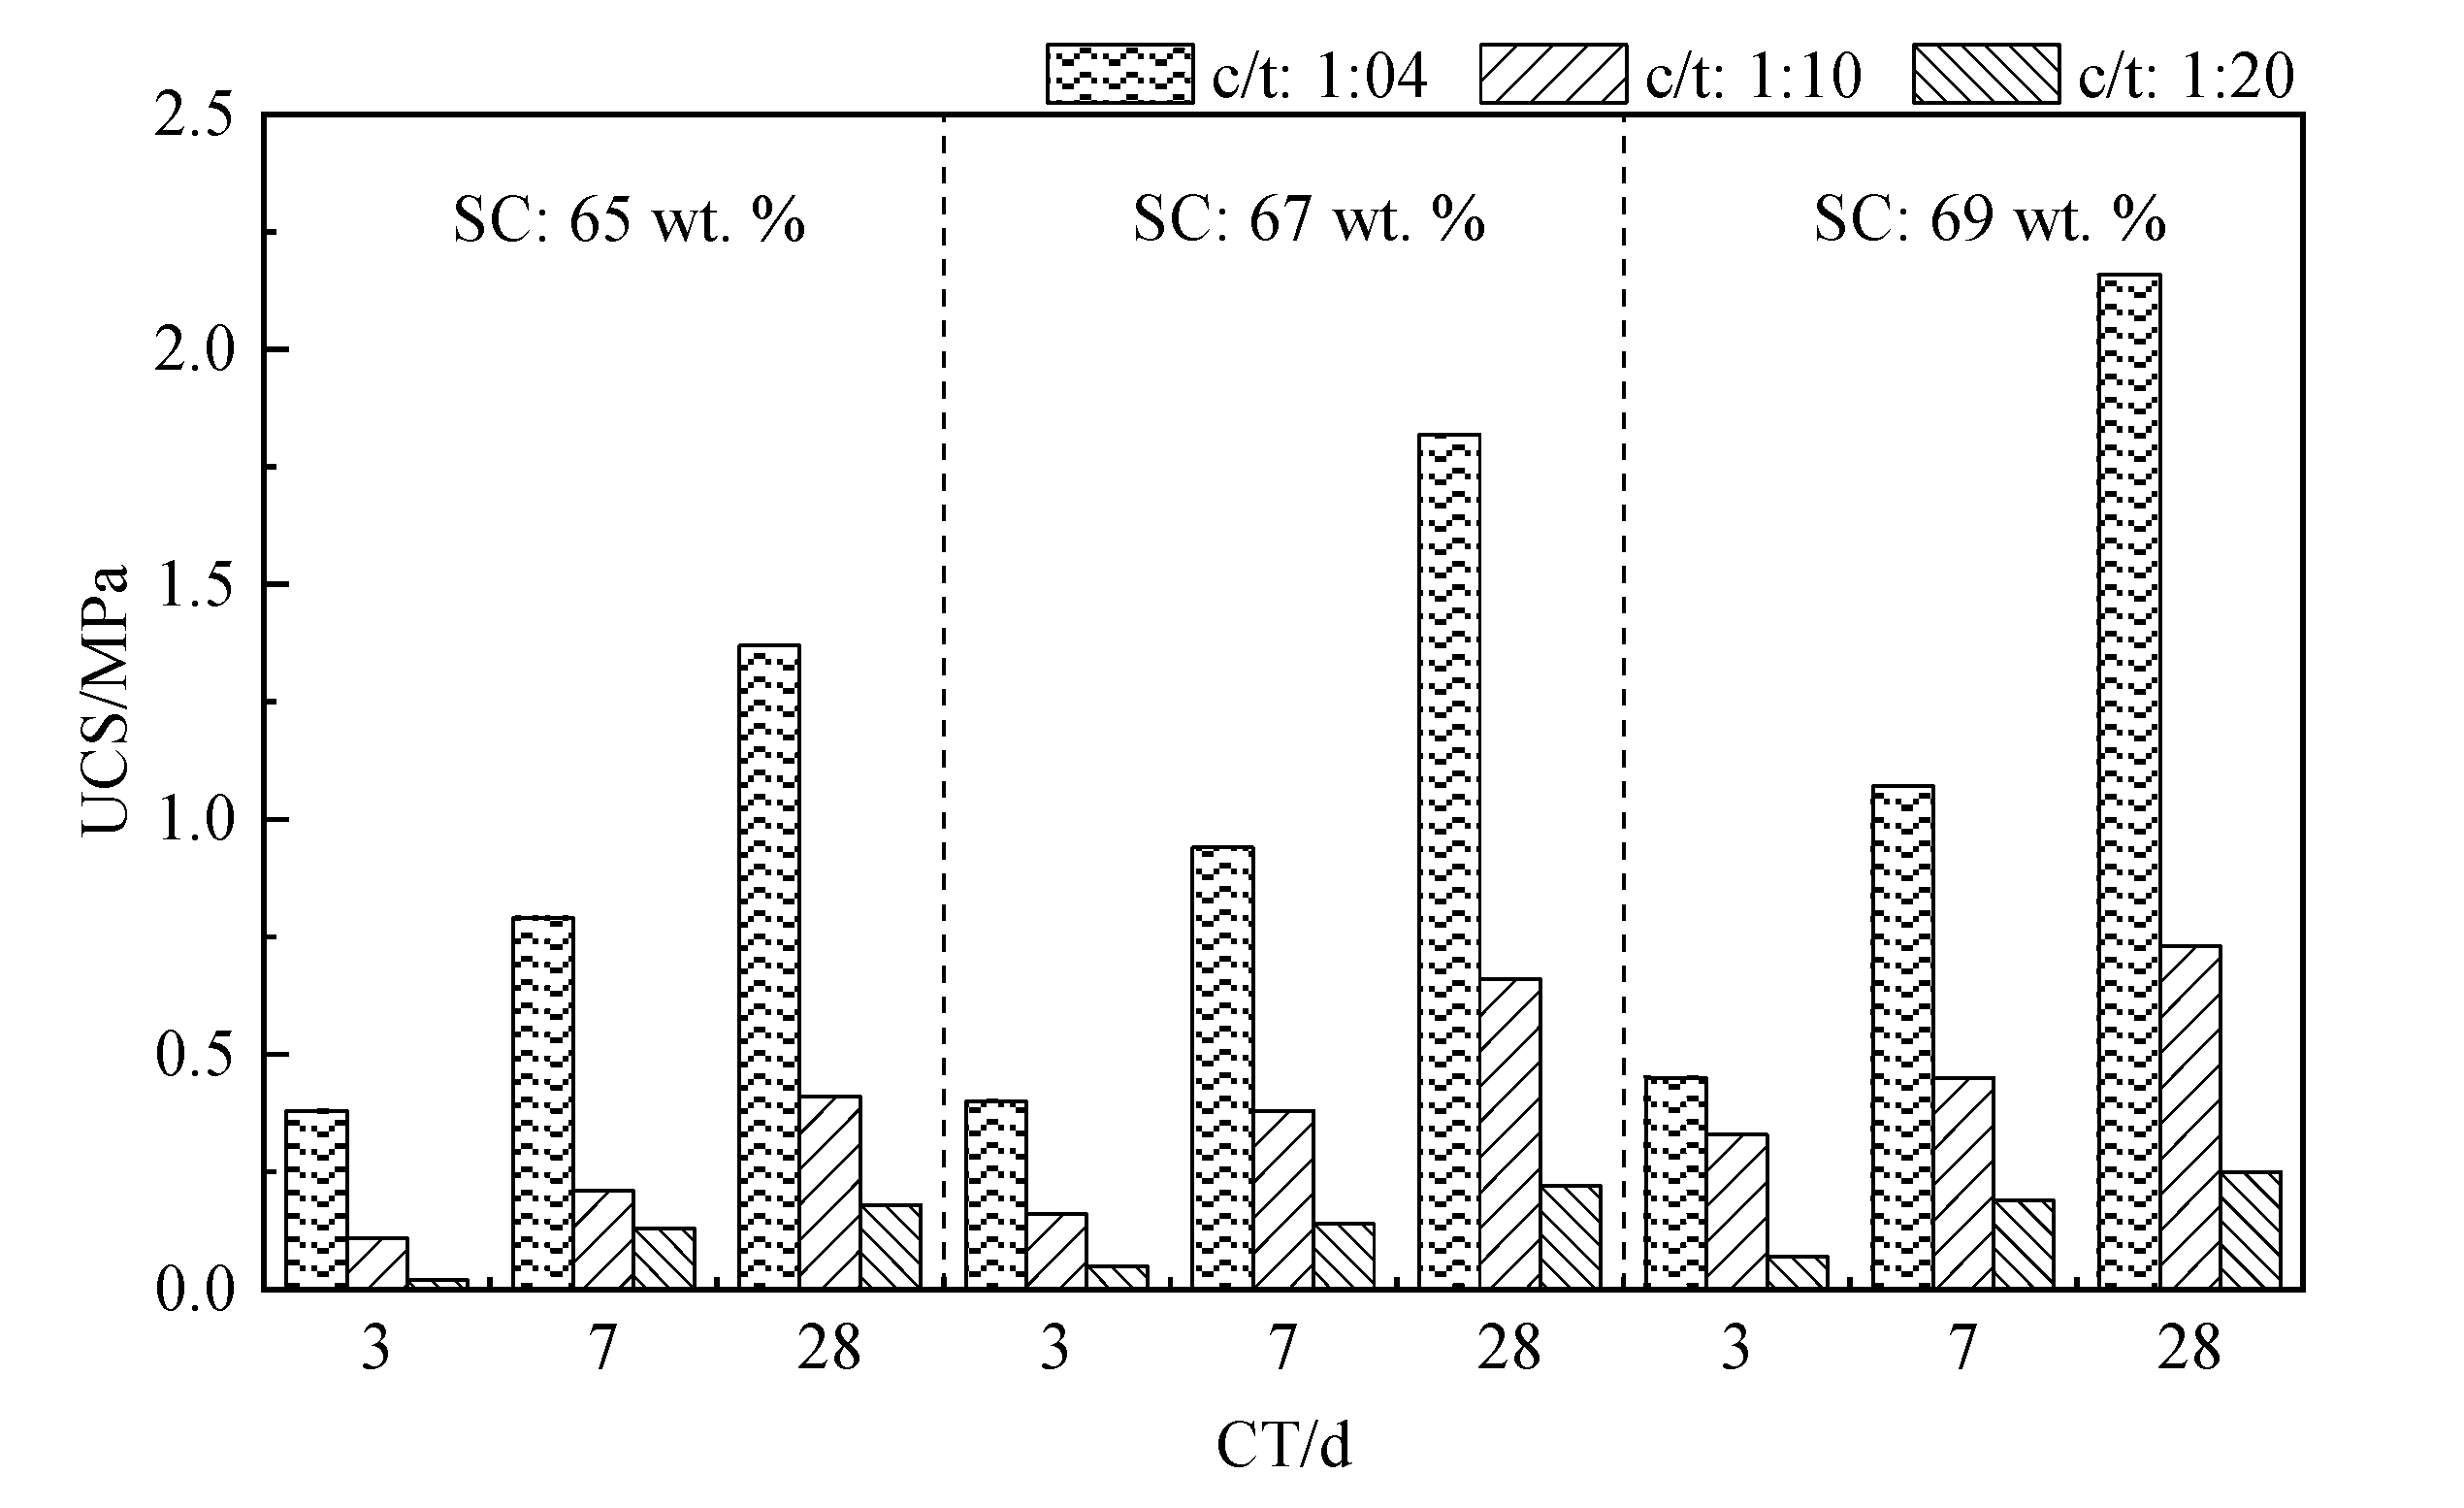
Figure 10 represents the relationship between curing time (CT) and UCS. As the CT increases so do the UCS. For example, at c/t of 1:04, SC of 65 wt. %, the UCS increased from 0.38 MPa to 1.37 MPa across all CT, which was 2.61 times increase in strength. At c/t of 1:10, SC of 67 wt.%, the UCS increased from 0.16 MPa to 0.66 MPa across all CT, which was 3.13 times increase in strength. At c/t of 1:20, SC of 69 wt. %, the UCS increased from 0.07 MPa to 0.25 MPa across all CT, which was 2.57 times increase in strength. In the experiment, for all c/t values, a 1 day increase in CT resulted in a 9.2–11.2% increase in UCS. Based on the results, the curing time is directly proportional to the accumulated hydration products in the CTB which results in a higher UCS. Alternatively, the curing time affects the free water in the specimens, resulting in a greater UCS.
From the results, an increase in SC leads to an increase in UCS at equal curing time. Most importantly, increasing SC can achieve an earmarked UCS sooner. For example, if a UCS of 1.0 MPa is needed within 7 days for a c/t = 1:04 mixture, then, an SC of at least 67% is needed.
3.3. Shrinkage Ratio Results and Analysis
The shrinkage rate is the ratio of the height of the CTB after the shrinkage to the original backfill height after a certain period of time. In practice, it is used in backfill effect analysis [57]. In terms of transport performance of the backfill slurry, the smaller the shrinkage ratio, the better the backfill effect. The shrinkage ratio was measured using the percent change in volume of CTB, before and after de-molding. CT from 3 to 28 days varied the shrinkage ratio from 2.29% to 5.71%. These results are further summarized in Table 3.
As the CT increases, so does the shrinkage ratio which is caused by the loss of free water in CTB over time [50]. The CTB sinking is related to water loss and particle rearrangement. When the CT reaches 28 days. At that point, there is an obvious difference except for two cases (c/t = 1:10, 28 days 67 wt. % SC and c/t = 1:04, 28 days, and 67 wt. % SC). The increase in SC leads to decreases in the shrinkage ratio. For example, at c/t of 1:04, the shrinkage ratio decreases from 5.04% to 4.35% across all SC. At c/t of 1:10, the shrinkage ratio decreases from 5.71% to 5.04% across all SC. At c/t of 1:20, the shrinkage ratio decreases from 5.70% to 5.01% across all SC. Using analysis of variance to process the test data to get the significance of each factor, as shown in Table 4, it can be found that the c/t and CT are the most significant parameters for affecting the shrinkage rate. At a constant SC, the shrinkage ratio of CTB mixes with a c/t value of 1:04 was smaller than that of CTB with a c/t value of 1:20 and 1:10. This may be attributed to the increase in cement which can increase the water-holding capacity of CTB [58,59].
4. Conclusions
In this study, 27 CTB samples with c/t, SC, and CT values were prepared. The L-shaped tube test investigated the effects of c/t and SC on rheological properties of CTB, and PRL were analyzed. Then, the UCS test investigated the effect of c/t, SC, and CT on UCS performance of CTB, and the settlement ratio of CTB and the failure forms of CTB mixes during UCS testing were analyzed. From the results of the performed experimental tests, the following conclusions can be drawn:
(1) The yield stress and viscosity coefficient of the backfill slurry increased with the increase in SC. SC increased by 1%, yield stress increased by 30–43%, and the viscosity coefficient increased by 15–34%. The fitting results show that the relationship between yield stress and SC can be expressed by a linear equation, and the relationship between the viscosity coefficient and SC is the same.
(2) PRL was related to the pipeline flow and slurry SC. PRL increased with increasing flow rate and SC. A 20 m3/h increase in flow rate results in a 17–30% increase in PRL. A 4% increase in SC results in a 74–147% increase in PRL. The PRL values are strongly affected by SC and flow rates.
(3) The UCS of CTB mixes was related to SC, CT, and c/t. As the SC increases so do the UCS. As the cement increases so do UCS. As the CT increases so do the UCS. Overall, the CT indicates a 0.01–0.07 MPa per day increase, SC indicates a 10–20% per SC% increase, and the cement content indicates a 0.12–0.19 MPa per 1% cement per unit volume across all samples.
(4) The longer is the CT of CTB mixes, the greater is the shrinkage ratio of CTB. The increase in SC leads to decreases in the shrinkage ratio. The shrinkage ratio was also affected by the cement content in the backfill matrix. The higher is the cement content, the smaller is the shrinkage ratio of CTB mixes. The c/t and CT are the most significant parameters for affecting the shrinkage rate.
Author Contributions
J.L. analyzed the experimental data and initiated the writing of the paper; E.Y. and S.C. improved the manuscript and corrected the English writing. All authors have read and agreed to the published version of the manuscript.
Funding
This research was jointly funded by National Natural Science Foundation of China (Grant Number 51804017), the Opening Fund of State Key Laboratory of Nonlinear Mechanics (Grant Number LNM202009), and the Fundamental Research Funds for Central Universities (Grant Number FRF-TP-20-001A2).
Acknowledgments
The authors would like to express their sincere appreciation to University of Science and Technology Beijing laboratory technicians for their technical help. The authors are also grateful to anonymous referees for their useful comments and contributions on the earlier version of this manuscript.
Conflicts of Interest
The authors declare no conflict of interest.
References
- Xue, G.L.; Yilmaz, E.; Song, W.D.; Cao, S. Analysis of internal structure behavior of fiber reinforced cement-tailings matrix composites through X-ray computed tomography. Compos. Part B Eng. 2019, 175, 107091. [Google Scholar] [CrossRef]
- Sadrossadat, E.; Basarir, H.; Luo, G.H.; Karrech, A.; Durham, R.; Fourie, A.; Elchalakani, M. Multi-objective mixture design of cemented paste backfill using particle swarm optimization algorithm. Miner. Eng. 2020, 153, 106385. [Google Scholar] [CrossRef]
- Suazo, G.; Villavicencio, G. Numerical simulation of the blast response of cemented paste backfilled stopes. Comput. Geotech. 2018, 100, 1–14. [Google Scholar] [CrossRef]
- Wu, F.F.; Yao, Z.L.; Kang, R.H.; Jiang, K.; Peng, L.; Wang, X. Study on low-cost cementing agent for solid waste comprehensive utilization in filling. Min. Res. Dev. 2019, 39, 70–72. [Google Scholar]
- Yang, L.; Xu, W.; Yilmaz, E.; Wang, Q.; Qiu, J. A combined experimental and numerical study on the triaxial and dynamic compression behavior of cemented tailings backfill. Eng. Struct. 2020, 219, 110957. [Google Scholar] [CrossRef]
- Cao, S.; Yilmaz, E.; Xue, G.L.; Song, W. Assessment of acoustic emission and triaxial mechanical properties of rock-cemented tailings matrix composites. Adv. Mater. Sci. Eng. 2019, 6742392. [Google Scholar] [CrossRef] [Green Version]
- Jiang, H.; Fall, M. Yield stress and strength of saline cemented tailings in sub-zero environments: Portland cement paste backfill. Int. J. Miner. Process. 2017, 160, 68–75. [Google Scholar] [CrossRef]
- Haruna, S.; Fall, M. Time-and temperature-dependent rheological properties of cemented paste backfill that contains superplasticizer. Powder Technol. 2020, 360, 731–740. [Google Scholar] [CrossRef]
- Cao, S.; Yilmaz, E.; Song, W.D. Evaluation of viscosity, strength and microstructural properties of cemented tailings backfill. Minerals 2018, 8, 352. [Google Scholar] [CrossRef] [Green Version]
- Yilmaz, E.; Belem, T.; Benzaazoua, M. One-dimensional consolidation parameters of cemented paste backfills. Miner. Resour. Manag. 2012, 28, 29–45. [Google Scholar]
- Cooke, R. Backfill pipeline distribution systems: Design methodology review. CIM Bull. 2007, 100, 1–8. [Google Scholar]
- Niroshan, N.; Sivakugan, N.; Veenstra, R.L. Flow chracteristics of cemented paste backfill. Geotech. Geol. Eng. 2018, 36, 2261–2272. [Google Scholar] [CrossRef]
- Wang, S.Y.; Wu, A.X.; Yin, S.H.; Han, B.; Wang, H.J. Influence factors of pressure loss in pipeline transportation of paste slurry. Chin. J. Eng. 2015, 1, 7–12. [Google Scholar]
- Zhang, L.; Wang, H.; Wang, J.; Zhang, J.; Sun, H. Flow characteristics of paste slurry under low atmospheric pressure in high altitude areas. In Proceedings of the 20th International Seminar on Paste and Thickened Tailings, Beijing, China, 16–18 June 2017; Wu, A., Jewell, R., Eds.; University of Science and Technology Beijing: Beijing, China, 2017; pp. 74–86. [Google Scholar]
- Wu, A.X.; Jiao, H.Z.; Wang, H.J.; Li, H.; Yi, H.B.; Liu, X.H.; Liu, S.Z. Yield stress measurements and optimization of paste tailings. J. Cent. South Univ. Sci. Technol. 2013, 44, 3370–3376. [Google Scholar]
- Boger, D.; Scales, P.; Sofra, F. Rheological concepts. In Paste and Thickened Tailings—A Guide, 2nd ed.; Jewell, R., Fourie, A., Eds.; Australian Centre for Geomechanics: Perth, Australia, 2006; pp. 25–52. [Google Scholar]
- Huynh, L.; Beattie, D.A.; Fornasiero, D.; Ralston, J. Effect of polyphosphate and naphthalene sulfonate formaldehyde condensate on the rheological properties of dewatered tailings and cemented paste backfill. Miner. Eng. 2006, 19, 28–36. [Google Scholar] [CrossRef]
- Liu, L.; Fang, Z.Y.; Qi, C.C.; Zhang, B.; Guo, L.J.; Song, K.I.-I.L. Numerical study on the pipe flow characteristics of the cemented paste backfill slurry considering hydration effects. Powder Technol. 2019, 343, 454–464. [Google Scholar] [CrossRef]
- Shi, H.W.; Huang, J.R.; Qiao, D.P.; Teng, G.L.; Wang, B. Simulation study of long-distance paste filling pipeline transportation in ultra-deep well based on FLUENT ANSYS. Nonferrous Met. 2020, 72, 5–12. [Google Scholar]
- He, J.; Li, D.Y.; Li, X.B.; Shi, Y. Analysis of the influence of temperature on rheological parameters of phosphogypsum slurry. Nonferrous Met. Eng. 2019, 9, 70–75. [Google Scholar]
- Wang, W.H.; Xie, S.Q.; Fu, J.X.; Liang, X.M.; Wu, S.J.; Wang, H.Y. Experimental study on the filling of ultra-fine tailing paste. Min. Res. Dev. 2020, 40, 67–71. [Google Scholar]
- Yin, S.H.; Wu, A.X.; Hu, K.J.; Wang, Y.; Zhang, Y.K. The effect of solid components on the rheological and mechanical properties of cemented paste backfill. Miner. Eng. 2012, 35, 61–66. [Google Scholar] [CrossRef]
- Deng, X.J.; Zhang, J.X.; Klein, B.; Zhou, N.; de Wit, B. Experimental characterization of the influence of solid components on the rheological and mechanical properties of cemented paste backfill. Int. J. Miner. Process. 2017, 168, 116–125. [Google Scholar] [CrossRef]
- Qiu, J.P.; Zhao, Y.L.; Long, H.; Guo, Z.B.; Xing, J.; Sun, X.G. Low-carbon binder for cemented paste backfill: Flowability, strength and leaching characteristics. Minerals 2019, 9, 707. [Google Scholar] [CrossRef] [Green Version]
- Yang, L.H.; Wang, H.J.; Li, H.; Zhou, X. Effect of high mixing intensity on rheological properties of cemented paste backfill. Minerals 2019, 9, 240. [Google Scholar] [CrossRef] [Green Version]
- Liu, L.; Fang, Z.; Wang, M.; Qi, C.; Huan, C. Experimental and numerical study on rheological properties of ice-containing cement paste backfill slurry. Powder Technol. 2020, 370, 206–214. [Google Scholar] [CrossRef]
- Zhang, S.; Yang, L.; Ren, F.; Qiu, J.; Ding, H. Rheological and mechanical properties of cemented foam backfill: Effect of mineral admixture type and dosage. Cem. Concr. Compos. 2020, 112, 103689. [Google Scholar] [CrossRef]
- Wu, D.; Fall, M.; Cai, S.J. Coupling temperature, cement hydration and rheological behaviour of fresh cemented paste backfill. Miner. Eng. 2013, 42, 76–87. [Google Scholar] [CrossRef]
- Zhao, Y.; Taheri, A.; Karakus, M.; Chen, Z.W.; Deng, A. Effects of water content, water type and temperature on the rheological behaviour of slag-cement and fly ash-cement paste backfill. Int. J. Min. Sci. Technol. 2020, 30, 271–278. [Google Scholar] [CrossRef]
- Cavusoglu, I.; Yilmaz, E.; Yilmaz, A.O. Additivity effect on properties of cemented coal fly ash backfill containing water-reducing admixtures. Constr. Build. Mater. 2020, 121021. [Google Scholar] [CrossRef]
- Qin, X.L.; Zheng, J.G.; Huang, G.; Xu, G. Experimental study on rheological properties of tailing slurry in Tongshan copper mine. Min. Res. Dev. 2020, 40, 102–106. [Google Scholar]
- Wang, F.L.; Yang, S.J.; Su, S.; Zhang, Z. Experimental study on rheological properties of high concentration tailing slurry. J. Yangtze River Acad. Sci. 2019, 36, 87–90. [Google Scholar]
- Deng, X.J.; Klein, B.; Tong, L.B.; de Wit, B. Experimental study on the rheological behavior of ultra-fine cemented backfill. Constr. Build. Mater. 2018, 158, 985–994. [Google Scholar] [CrossRef]
- Xiao, B.L.; Wen, Z.J.; Wu, F.; Li, L.T.; Yang, Z.Q.; Gao, Q. A simple L-shape pipe flow test for practical rheological properties of backfill slurry: A case study. Powder Technol. 2019, 356, 1008–1015. [Google Scholar] [CrossRef]
- Kou, Y.P.; Jiang, H.Q.; Ren, L.; Yilmaz, E.; Li, Y.H. Rheological properties of cemented paste backfill with alkali-activated slag. Minerals 2019, 10, 288. [Google Scholar] [CrossRef] [Green Version]
- Ouattara, D.; Mbonimpa, M.; Yahia, A.; Belem, T. Assessment of rheological parameters of high density cemented paste backfill incorporating superplasticizers. Constr. Build. Mater. 2018, 190, 294–307. [Google Scholar] [CrossRef]
- Benzaazoua, M.; Belem, T.; Yilmaz, E. Novel lab tool for paste backfill. Can. Min. J. 2006, 127, 31–32. [Google Scholar]
- Chen, S.J.; Du, Z.W.; Zhang, Z.; Yin, D.W.; Feng, F.; Ma, J.B. Effects of red mud additions on gangue-cemented paste backfill properties. Powder Technol. 2020, 367, 833–840. [Google Scholar] [CrossRef]
- Peng, X.P.; Fall, M.; Haruna, S. Sulphate induced changes of rheological properties of cemented paste backfill. Miner. Eng. 2019, 141, 105849. [Google Scholar]
- Yan, B.; Ren, F.; Cai, M.; Qiao, C. Influence of new hydrophobic agent on the mechanical properties of modified cemented paste backfill. J. Mater. Res. Technol. 2019, 8, 5716–5727. [Google Scholar] [CrossRef]
- Cheng, H.Y.; Wu, S.C.; Hong Li, H.; Zhang, X.Q. Influence of time and temperature on rheology and flow performance of cemented paste backfill. Constr. Build. Mater. 2020, 231, 117117. [Google Scholar] [CrossRef]
- Cao, S.; Xue, G.L.; Yilmaz, E.; Yin, Z.Y.; Yang, F.D. Utilizing concrete pillars as an environmental mining practice in underground mines. J. Clean. Prod. 2021, 278, 123433. [Google Scholar] [CrossRef]
- Zhang, J.; Deng, H.W.; Taheri, A.; Deng, J.R.; Ke, B. Effects of superplasticizer on the hydration, consistency, and strength development of cemented paste backfill. Minerals 2018, 8, 381. [Google Scholar] [CrossRef] [Green Version]
- Fall, M.; Célestin, J.C.; Pokharel, M.; Touré, M. A contribution to understanding the effects of temperature on the mechanical properties of cemented mine backfill. Eng. Geol. 2010, 14, 397–413. [Google Scholar] [CrossRef]
- Wang, J.; Fu, J.X.; Song, W.D. Mechanical properties and microstructure of layered cemented paste backfill under triaxial cyclic loading and unloading. Constr. Build. Mater. 2020, 257, 119540. [Google Scholar] [CrossRef]
- Zhao, Y.; Soltani, A.; Taheri, A.; Karakus, M.; Deng, A. Application of slag-cement and fly ash for strength development in cemented paste backfills. Minerals 2019, 9, 22. [Google Scholar] [CrossRef] [Green Version]
- Xue, G.L.; Yilmaz, E.; Song, W.D.; Yilmaz, E. Influence of fiber reinforcement on mechanical behavior and microstructural properties of cemented tailings backfill. Constr. Build. Mater. 2019, 213, 275–285. [Google Scholar] [CrossRef]
- Xue, G.L.; Yilmaz, E.; Song, W.D.; Cao, S. Mechanical, flexural and microstructural properties of cement-tailings matrix composites: Effects of fiber type and dosage. Compos. Part B Eng. 2019, 172, 131–142. [Google Scholar] [CrossRef]
- Li, S.J.; Jiang, H.B.; Fu, J.X.; Xie, S.Q.; Huang, M.R.; Yao, R. Experiment of physical properties of density and porosity for full tailings. Nonferrous Min. Metall. 2019, 35, 9–11. [Google Scholar]
- Yang, X.; Yang, Z.Q.; Gao, Q.; Xiao, B.L. Experimental study on the optimization of cementitious materials for full tailings filling in Gaoguanying Iron Mine. Nonferrous Met. (Min. Sect.) 2015, 67, 78–82. [Google Scholar]
- Alp, I.; Deveci, H.; Sungun, Y.H.; Yilmaz, A.O.; Kesimal, A.; Yilmaz, E. Pozzolanic characteristics of a natural raw material for use in blended cements. Iran. J. Sci. Technol. Trans. B Eng. 2009, 33, 291–300. [Google Scholar]
- Petrolito, J.; Anderson, R.M.; Pigdon, S.P. A review of binder materials used in stabilized backfills. C. Bull. 2005, 98, 1–7. [Google Scholar]
- Yang, X.B.; Wu, F.; Yang, Z.Q.; Gao, Q. Pipeline hydraulic gradient model and its application for coarse aggregate filling with high mass. J. Cent. South Univ. (Nat. Sci. Ed.) 2019, 50, 2851–2858. [Google Scholar]
- Qi, Z.J.; Song, Z.Q.; Kou, Y.P.; Du, J.F.; Liu, C.; Yang, J.G. Experimental study on crude tailings paste-like slurry by L-pipe in a mine. China Min. Ind. 2018, 27, 161–164. [Google Scholar]
- Li, Z.N.; Luo, W.D.; Guo, L.J.; Xu, W.Y. Optimization and application of large linear filling slurry transport based on Buckingham equation. Gold Sci. Technol. 2020, 28, 90–96. [Google Scholar]
- Zhao, Y.; Taheri, A.; Soltani, A.; Karakus, M.; Deng, A. Strength development and strain localization behavior of cemented paste backfills using Portland cement and fly ash. Materials 2019, 12, 3282. [Google Scholar] [CrossRef] [PubMed] [Green Version]
- Guo, B.; Wu, F.; Liang, F.; Tu, G.F. Experimental study and industrial application of superfine tailings filling cementitious material ratio. Min. Res. Dev. 2020, 40, 37–40. [Google Scholar]
- Liang, F.; Yang, X.B.; Bian, Z.H.; Yang, H.Y.; Gao, Q. Experimental research on low-cost green filling cementitious materials. Min. Res. Dev. 2019, 39, 16–21. [Google Scholar]
- Yang, L.H.; Zhou, X. Analysis of the shrinkage and bleeding of filler slurry. Min. Technol. 2013, 13, 32–33. [Google Scholar]
Figure 1.
Chemical components (oxide analysis) of the studied gold mine tailings.

Figure 2.
The whole tailing particle size distribution.

Figure 3.
Chemical composition of 42.5R cement.

Figure 4.
The preparation process of cement tailings backfill (CTB) mixes.

Figure 5.
L-shaped tube experimental device: (a) schematic diagram; (b) physical model.

Figure 6.
A cubic CTB sample subjected to the unconfined compressive strength (UCS) test.

Figure 7.
Yield stress (a) and viscosity coefficient (b) of CTB with different solid content (SC) values. c/t stands for cement-to-tailings ratio. ●: c/t:1:10; ▲: c/t:1:20; ■: c/t:1:04.
Figure 7.
Yield stress (a) and viscosity coefficient (b) of CTB with different solid content (SC) values. c/t stands for cement-to-tailings ratio. ●: c/t:1:10; ▲: c/t:1:20; ■: c/t:1:04.

Figure 8.
Relationship between pipeline resistance loss (PRL) and SC values.

Figure 9.
Relations between SC and UCS of CTB mixes.

Figure 10.
Relationship between CT and UCS of CTB mixes.


Table 1.
The characteristic value of full tailing particle size.
| d10 (μm) | d30 (μm) | d50 (μm) | d60 (μm) | dav (μm) | K0 |
|---|---|---|---|---|---|
| 2.800 | 10.76 | 38.33 | 55.02 | 62.51 | 19.65 |
Table 2.
Analysis of variance (ANOVA) values of pipeline resistance loss.
| Source | Degree of Freedom | Sum of Squares | Mean Sum of Squares | F-Value | P-Value |
|---|---|---|---|---|---|
| c/t | 2.00 | 0.07 | 0.04 | 1.98 | 0.1569 |
| SC | 2.00 | 6.70 | 3.35 | 189.57 | 0.0000 |
| Flow rate | 3.00 | 3.21 | 1.07 | 60.46 | 0.0000 |
| Error | 28.00 | 0.49 | 0.02 | 0.00 | 0.0000 |
Table 3.
Shrinkage rate of different CTB samples.
| c/t | SC (wt. %) | Shrinkage Ratio (%) | ||
|---|---|---|---|---|
| 3 Days | 7 Days | 28 Days | ||
| 1:04 | 65 | 3.65 | 3.43 | 5.04 |
| 67 | 2.85 | 2.95 | 2.47 | |
| 69 | 2.48 | 2.71 | 4.35 | |
| 1:10 | 65 | 2.29 | 2.94 | 5.71 |
| 67 | 4.32 | 4.67 | 4.32 | |
| 69 | 2.94 | 3.17 | 5.04 | |
| 1:20 | 65 | 3.86 | 4.09 | 5.7 |
| 67 | 3.63 | 5.23 | 5.69 | |
| 69 | 3.88 | 2.25 | 5.01 | |
Table 4.
Analysis of variance (ANOVA) values of shrinkage rate.
| Source | Degree of Freedom | Sum of Squares | Mean Sum of Squares | F-Value | p-Value |
|---|---|---|---|---|---|
| c/t | 2 | 4.96 | 2.48 | 3.68 | 0.0435 |
| SC | 2 | 1.58 | 0.79 | 1.17 | 0.3301 |
| CT | 2 | 12.00 | 6.00 | 8.91 | 0.0017 |
| Error | 20 | 13.48 | 0.67 | 0.00 | 0.0000 |
Publisher’s Note: MDPI stays neutral with regard to jurisdictional claims in published maps and institutional affiliations. |
© 2020 by the authors. Licensee MDPI, Basel, Switzerland. This article is an open access article distributed under the terms and conditions of the Creative Commons Attribution (CC BY) license (http://creativecommons.org/licenses/by/4.0/).
Share and Cite
MDPI and ACS Style
Li, J.; Yilmaz, E.; Cao, S. Influence of Solid Content, Cement/Tailings Ratio, and Curing Time on Rheology and Strength of Cemented Tailings Backfill. Minerals 2020, 10, 922. https://doi.org/10.3390/min10100922
AMA Style
Li J, Yilmaz E, Cao S. Influence of Solid Content, Cement/Tailings Ratio, and Curing Time on Rheology and Strength of Cemented Tailings Backfill. Minerals. 2020; 10(10):922. https://doi.org/10.3390/min10100922
Chicago/Turabian StyleLi, Jiajian, Erol Yilmaz, and Shuai Cao. 2020. "Influence of Solid Content, Cement/Tailings Ratio, and Curing Time on Rheology and Strength of Cemented Tailings Backfill" Minerals 10, no. 10: 922. https://doi.org/10.3390/min10100922
Note that from the first issue of 2016, this journal uses article numbers instead of page numbers. See further details here.