Investment Analysis of Waste Heat Recovery System Installations on Ships’ Engines


1
Centre for Maritime Studies, Turku University, Joukahaisenkatu 3-5, 20520 Turku, Finland
2
School of Business and Governance, Tallinn University of Technology, Akadeemia tee 3, 12618 Tallinn, Estonia
3
Wismar Business School, Wismar University, Philipp-Müller-Str. 14, 23966 Wismar, Germany
*
Author to whom correspondence should be addressed.
J. Mar. Sci. Eng. 2020, 8(10), 811; https://doi.org/10.3390/jmse8100811
Submission received: 7 September 2020
/
Revised: 14 October 2020
/
Accepted: 15 October 2020
/
Published: 19 October 2020
(This article belongs to the Special Issue Marine Alternative Fuels and Environmental Protection)
Abstract
:This study considers incentive provisions for investment decisions related to waste heat recovery system (WHRS) installations on ships to reduce CO2 emissions and improve ships’ engine efficiency. The economic assessment of WHRS installations in the shipping sector is not widely covered in the literature. A reason for this might be that the conventional financial evaluation of sensitive choices is commonly done through capital budgeting methods, which are not flexible enough to integrate future changes in fuel prices and long-term aspects of other costs. Thus, this work evaluates the WHRS investment using the classical budgeting instruments as well as the real-options approach (a more sophisticated approach) to accommodate the presumed expected future changes in the volatile maritime markets. Following the methodology of triangulation, three case studies of ships with varying operational conditions empirically validate the result to depict the practical use of the real-options evaluation method in investment assessment. The capital budgeting analysis reveals that the investment in maritime WHRS technology is only economically favorable under certain frame conditions projected in the work that shows a more realistic assessment of the project.
1. Introduction
Global green and environmentally friendly shipping is enjoying growing attention on issues concerning the reduction of ship emissions, energy savings and cost reductions of shipping operations [1,2]. One of the International Maritime Organization (IMO) regulations for international shipping focuses on limiting CO2 emissions by establishing standards for the Energy Efficiency Design Index (EEDI) for ships. Compliance with this regulation has further led to higher propelling costs and additional abatement investments for ship-owners [2] at a time when the shipping industry is already highly competitive and plagued with low margins and other tightened environmental regulations [3].
The fulfillment of the Sulphur Emission Control Areas (SECA) regulations in 2015 and the establishment of the Global Sulphur Cap at the beginning of 2020, made shipping companies opt for suitable compliance strategies requiring investments in expensive abatement technologies and some had to identify suitable compliant fuel management practices to cope with the regulations [4]. Thus, the implementation of greener and more sustainable maritime transport systems is complicated in the face of the diverse laws ship-owners have to face as well as the decision they have to make to remain competitive in the industry [2]. In particular, the installation of abatement technologies to control air pollution from ships is linked to high investment costs and studies within this context have revealed additional energy consumption resulting from the operation of these emission reduction devices [3].
A closer look at the experiences in the Baltic Sea region reveals that most of the ships switched after the implementation of the SECA regulations in 2015 to low sulphur fuel to avoid the hassles of capital compliance investments [4]. Ship operators who decided to use new abatement technology like scrubbers experienced additional fuel consumption resulting to further CO2—emissions that partly canceled out the original intention of emissions reductions [5]. Consequently, energy-saving concepts gained importance in the shipping sector to reduce fuel consumption for running new clean shipping technology.
One interesting approach to increasing ship’s efficiency, reducing fuel consumption and CO2 emissions is the use of a waste-heat recovery approach that has its origin in heavy industry, especially in power plants, steel mills, and other high-energy fabrics. A waste-heat recovery system (WHRS) is a power generating system using waste heat from ship engines to generate power. In general terms, a WHRS transfers heat from sources like hot output gases or steam to other engine processes to save energy and increase the ship’s engine energy efficiency.
There are many waste heat technical solutions available for industrial use and Singh and Pedersen [6] have given a comprehensive overview of these solutions with an in-depth review of the most adaptive solutions for ship engines. These are the Rankine cycle (RC)—a thermodynamic cycle, which converts heat energy to mechanical work; the Kalina cycle (KC)—a thermodynamic power cycle based on ammonia and water mixture; the exhaust gas turbine system, and the thermoelectric generation system [6]. The current work uses a combination system comprising a steam turbine—power turbine (ST–PT) developed by MAN Diesel Turbo [7] that combines energy recovery using an exhaust gas driven PT and an ST to generate energy, as discussed in Section 2.1. This combined system has better recovery potential than the other standalone WHRS solutions [6,8].
In shipping, the primary source of high temperature is the exhaust gases from the ship’s primary engines arising from the high heat flow and temperature [7]. According to studies of maritime WHRS, it is feasible to produce up to about 11% electrical energy from the primary engine power with energy from the exhaust gas in a WHRS, which reduces the fuel usage of the main engine to between 3% and 8% [7,8]. According to Hon and Wang [9], the energy efficiency of the main engines on ships is about 50%, and this efficiency leads to low fuel consumption values (specific fuel-oil consumption—SFOC) depending on the load factor of the engine. However, although the efficiency of 50% represents a good value compared to other engine types, ship operators still search for options to lower the fuel consumption since according to empirical studies, up to at least 45% of the ship’s running costs are related to fuel costs [10]. Regardless of this, fuel consumption in shipping is not only an important issue from the cost perspective, but at the same time, the quest to reduce CO2 from shipping emissions have gotten more critical, especially with the implementation of new IMO rules for the Energy Efficiency Design Index (EEDI) [9].
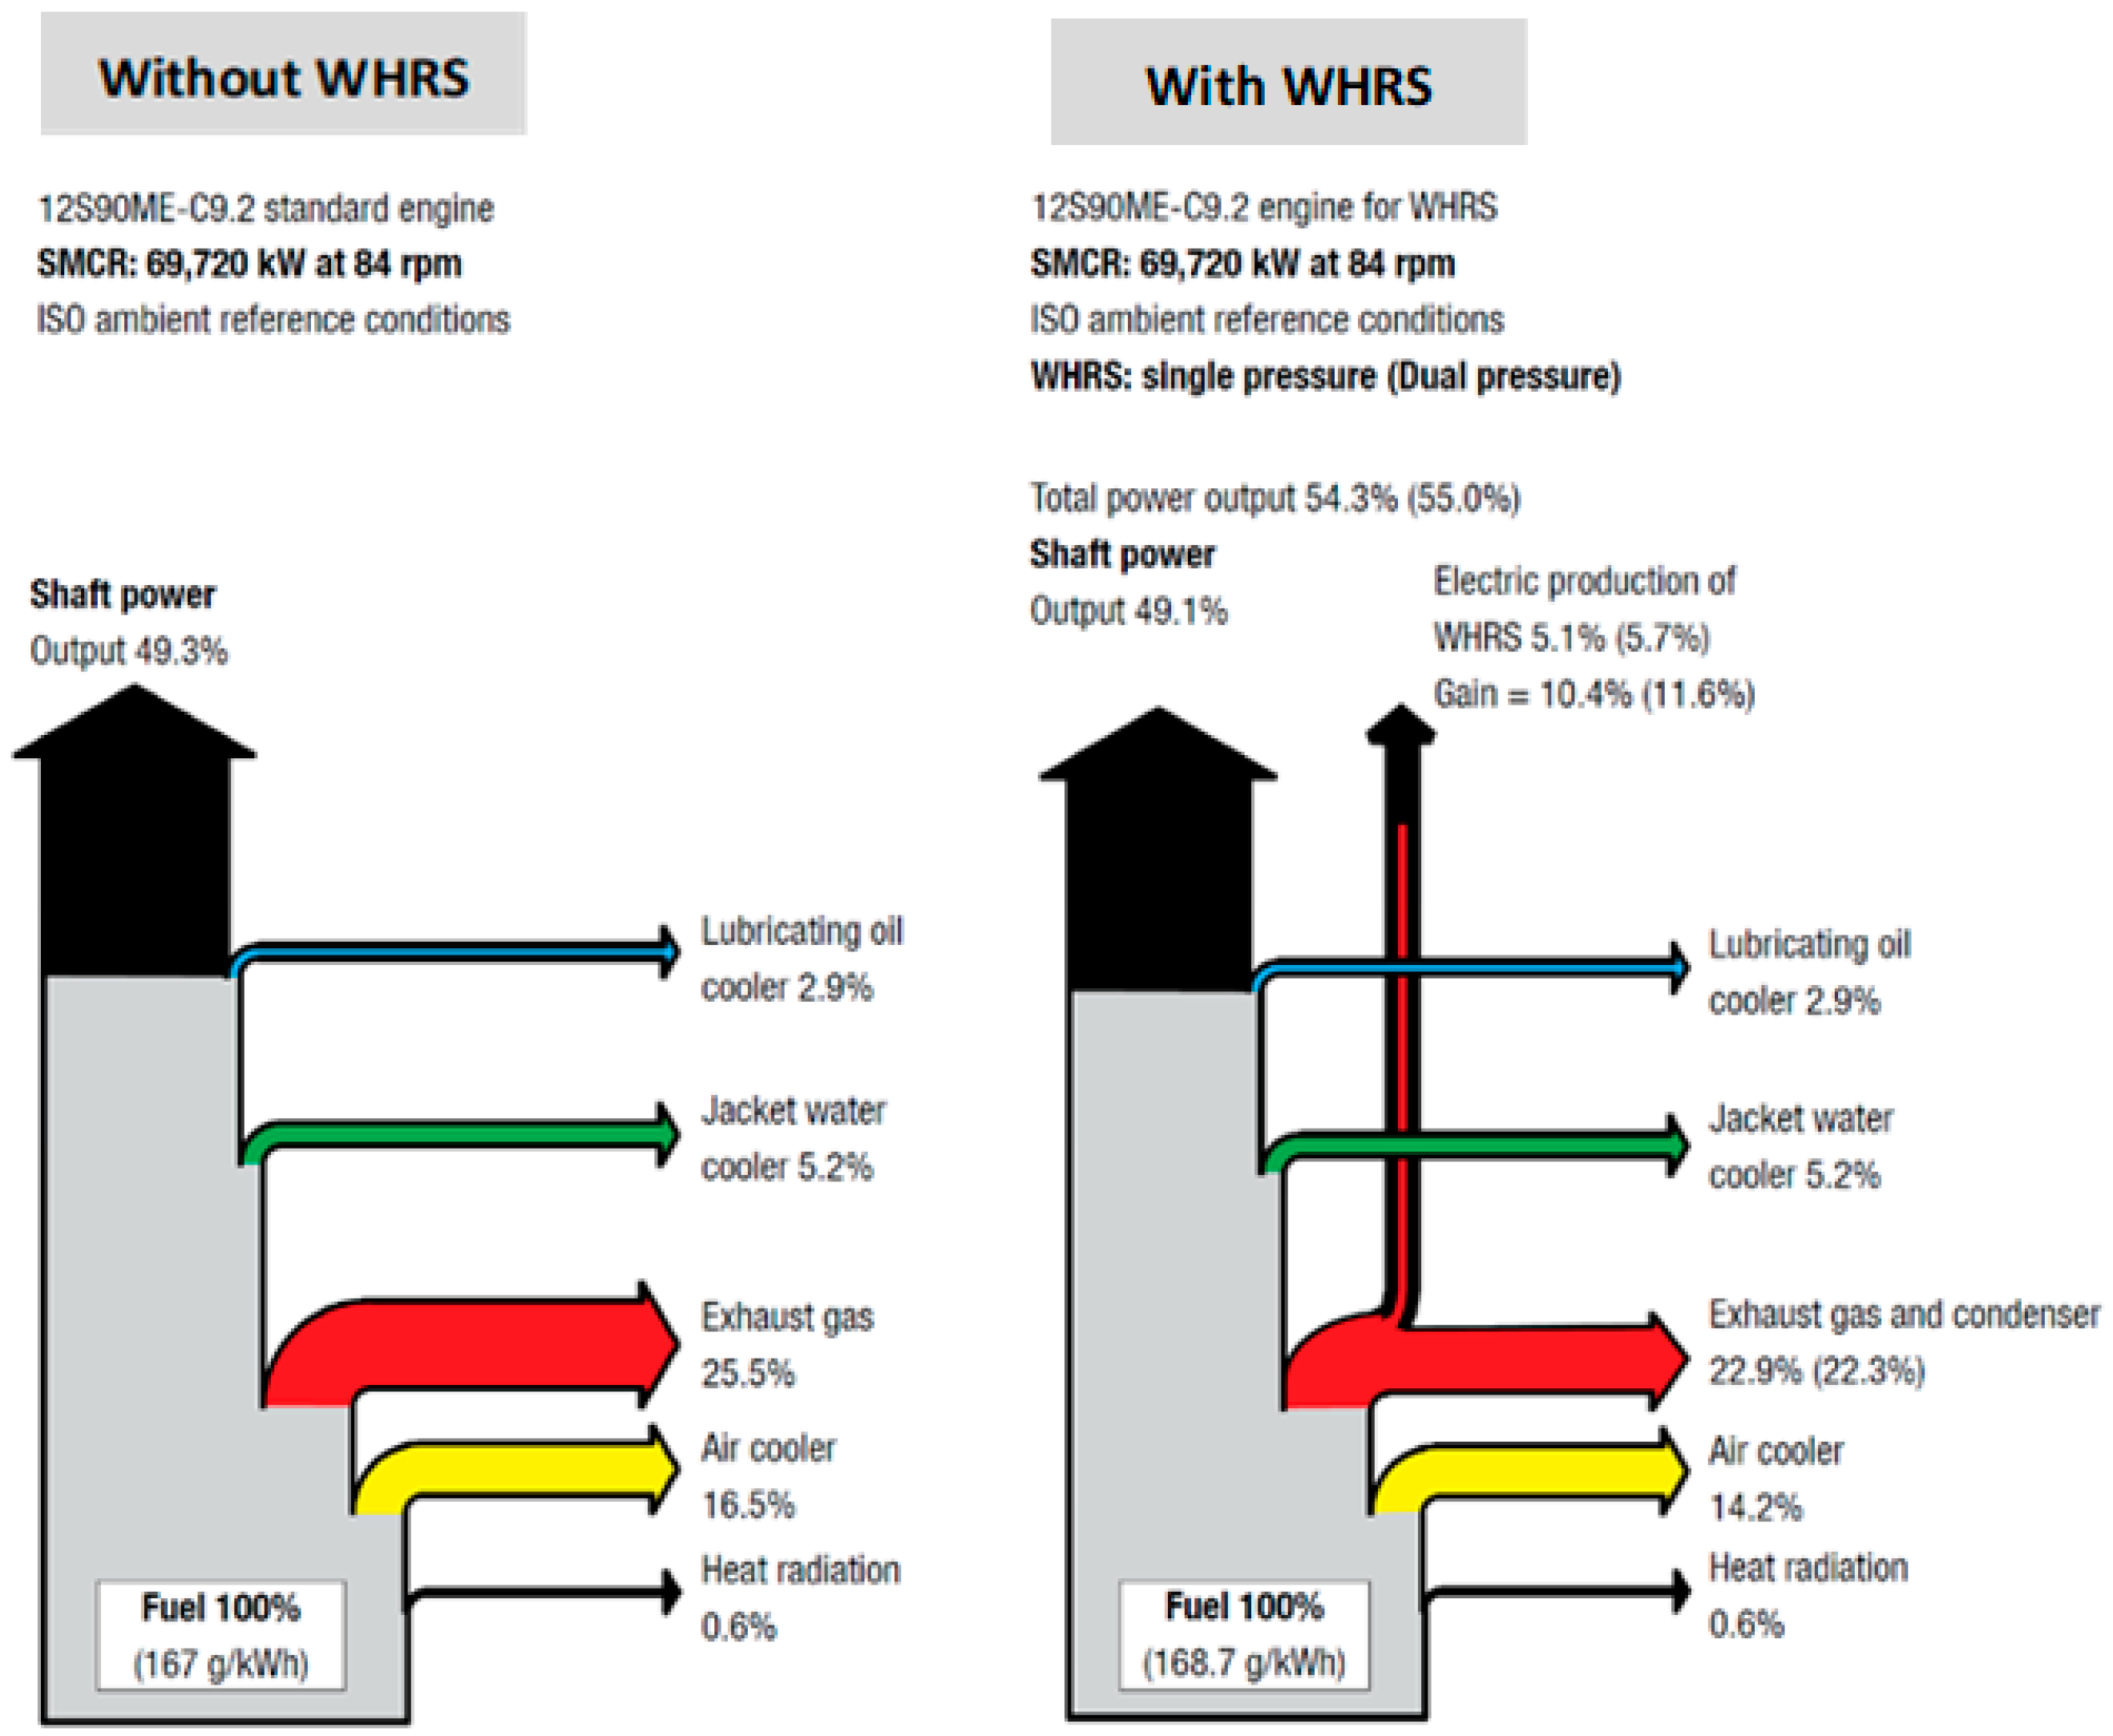
Accordingly, fuel has become one of the most critical focuses in the shipping industry so that the optimization of fuel consumption has become essential for environmental and economic reasons. Since the energy efficiency of ship engines is about 50% [7,8] the remaining half becomes waste energy that the main engines emit as waste heat. Half of the wasted energy (i.e., roughly 25%) of consumed fuel energy accounts for emitted exhaust gas heat through the funnels of the ship [7,11]. Even though high-efficient engines emit relatively low exhaust gas mass flow rate, the wasted heat temperature is still about 250–500 °C and high enough to produce steam for heating and to generate electricity by a steam-driven generator [12]. This is where the use of the WHRS comes in handy.
WHRS improves the total energy efficiency of ship engines from 50% to approximately 55% [7,13]. Figure 1 by MAN [7] depicts the energy balances without and with WHRS showing how the combination of WHRS with an engine increases the engine’s efficiency to approximately 55% that further ensures a decrease in the CO2 emission level.
The use of the WHRS to reduce CO2 emissions by decreasing fuel consumption is a relatively new and interesting technology that is beginning to gain more attention in the shipping sector [14]. So far, most studies have focused on the technical aspects of WHRS installations and not so much on the investment and revenue elements. This might be that, traditionally, the financial assessment of investment decisions use the classical capital budgeting methods, which are relatively inflexible to the various changing frame conditions in the maritime industry. These conditions include but are not limited to changes in fuel prices, interest rates, and other costs that may appear during the lifetime of an investment.
Chiesa and Frattini [15] explained that in the evaluation of economic return of investment, traditional capital budgeting uses the net present value (NPV) approach to assess projects by calculating the expected present value of future cash flows and then subtract the present value of the cost of investment (CAPEX) (i.e., considering the order of discounted cash flows). Hence, most projects are decided on the NPV value with fixed and estimated future cash flows ignoring the strategic management options of a project [16]. These options comprise of management flexibility during project lifetimes like the option to expand or continue the investments; the option to abandon the project if the immediate project is not successful; the option to defer the investment and the option to suspend the operation of the investment under unfavorable frame conditions.
Thus, the purpose of this study is to conduct an investment evaluation of waste-heat recovery systems installation on ships and to substantiate the most suitable investment analysis method for maritime projects. Using literature review and theoretical input, the authors first modeled the economic properties of the WHRS installation on ships, and further analyze the profitability of the WHRS project investment using the classical capital budgeting methods and the real-options approach (ROA) incorporating the ROA results alongside NPV to improve the accuracy of the investment assessment. Figure 2 expresses the underlying decision-making process in a flowchart:
Methods for profitable assessment of projects are quite extended in innovative ventures for instance in mining and power plants [17], but not so extensive in the maritime area. The ROA method is even less popular in maritime investment evaluation owing to the notion that the evaluation might not give favorable results due to the specific underlying distribution of the industry historical market data known to be unstable. Despite this, the authors argue that the ROA manifests a financial evaluation method that allows the needed flexibility to ensure effective investment choices.
This is why besides the standalone practices for analysis of investments and assessment of innovative projects, this work extends the capital budgeting techniques into the ROA to highlight the most suitable investment evaluation tool using three ships with different operational profiles. The authors highlighted the practical application of the real-option approach and proposed that the ROA is more reliable for the assessment of maritime investment projects because it addresses the unstable and unpredictable nature of the industry. In this work, the Black-Scholes [18] model for ROA quantifies the risks and uncertainties related to the feasibility of WHRS investments as a maritime innovation project for clean shipping.
The remainder of the paper is organized as follows: In the next section, the authors present the methodology of the research describing the theoretical framework of the mechanical properties of WHRS as well as the economic assessment of investments based on capital budgeting methods and the ROA. The third section presents three-vessel cases with different operational profiles and routes for the WHRS installation evaluation. The fourth section illustrates, empirically validates the research results, and discusses the findings with a focus on the current economic situation and its influences on the WHRS investment decisions. The last section concludes the article.
2. Methods
The study uses a literature review and theoretical results to model the economic properties of the use of WHRS technology on ships using Atari et al.’s [3,19] investigations on investments in scrubber technology. It uses a theoretical model that combines instruments from capital budgeting, real options theory, and random walk approaches to explore and assess different abatement investments on ships. In addition to the theoretical modeling, the research integrates and benchmarks the results through Baltic Sea Region (BSR) expert interviews and focus group meetings from an exclusive source of empiric validation that stems from European projects dedicated to clean shipping research with a focus on the BSR. The BSR maritime experts’ interviews and focus group meetings delivered the measurements and parameters such as the annual operating time, annual port time, main engine load hours for the study cases from ship owners/operators confronted with compliance investment decisions from the IMO environmental regulations. The target groups were ship owners, top management level (MD/CEOs, Directors, top-level managers) manufacturers, and services providers of power sources and maritime equipment and energy markets. Some of these companies includes but not limited to WÄRTSILÄ manufacturing company, Finland, Tallink Silja Line, Scandlines shipping company, Germany, TS Energia OÜ Estonia, EP Consulting OÜ and Finnlines, plc, Finland. All data collection took place between May 2016 and December 2019.
2.1. WHRS Installation Economic Parameters
When it comes to economic questions related to WHRS investments, there are several studies available but of particular interest for this work is the analysis of waste heat recovery on two-stroke ship engines by Shu et al. [12]. Even though the Shu et al. study is not so recent (about seven years old), they gave astute insight into the maritime WHRS technology. They further added costs information that makes it possible to create investment calculations that include payback time which makes it easy to compare other investigations from Baldi and Gabrielii; Daccord and GloMEEP [8,9,20], and equipment producers like MAN engines [7,11].
In the current study, the authors’ first focus their investigations on the standard steam/boiler-based technology and later discuss the thermoelectric generator (TEG) technology to “drive home” their point. Different WHRS technologies are available according to the requirements of the ship owner, the shipyard, or the actual electrical power consumption on board. MAN [7] differentiates between the following systems and the involving technical devices and recommend the area of application that depends on the performance of the main engine of the vessel. An important parameter for the assessment of the performance of a WHRS is the electrical recovery rate, which is defined as the ratio of the gained electrical power depending on the available mechanical power of the main engine. Based on measurements and empirical investigations, it is possible to attribute ranges for maximal electrical recovery rates for the different technologies listed in the following overview by Kristiansen et al. and MAN [7,21]:
- ST-PT—Combined Steam Turbine-Power generator unit
- -
- Power turbine, steam turbine, gear, and generator unit with single or dual pressure steam turbine
- -
- For main engine power > 25,000 kW
- -
- Max. electrical recovery rate: 8–11%
- STG—Steam Turbine Generator unit
- -
- Steam turbine, gear and generator unit, single or dual steam pressure
- -
- For main engine power between 15,000 kW and 25,000 kW
- -
- Max. electrical recovery rate: 4–8%
- PTG—Power Turbine Generator unit
- -
- Power turbine, gear, and generator unit
- -
- For main engine power < 25,000 kW
- -
- Max. electrical recovery rate: 3–5%
Besides the steam-based and power turbine technology, Kristiansen et al. [21] discussed the WHRS technology-based TEGs using the Seebeck effect for power generation which are rarely used in the shipping industry.
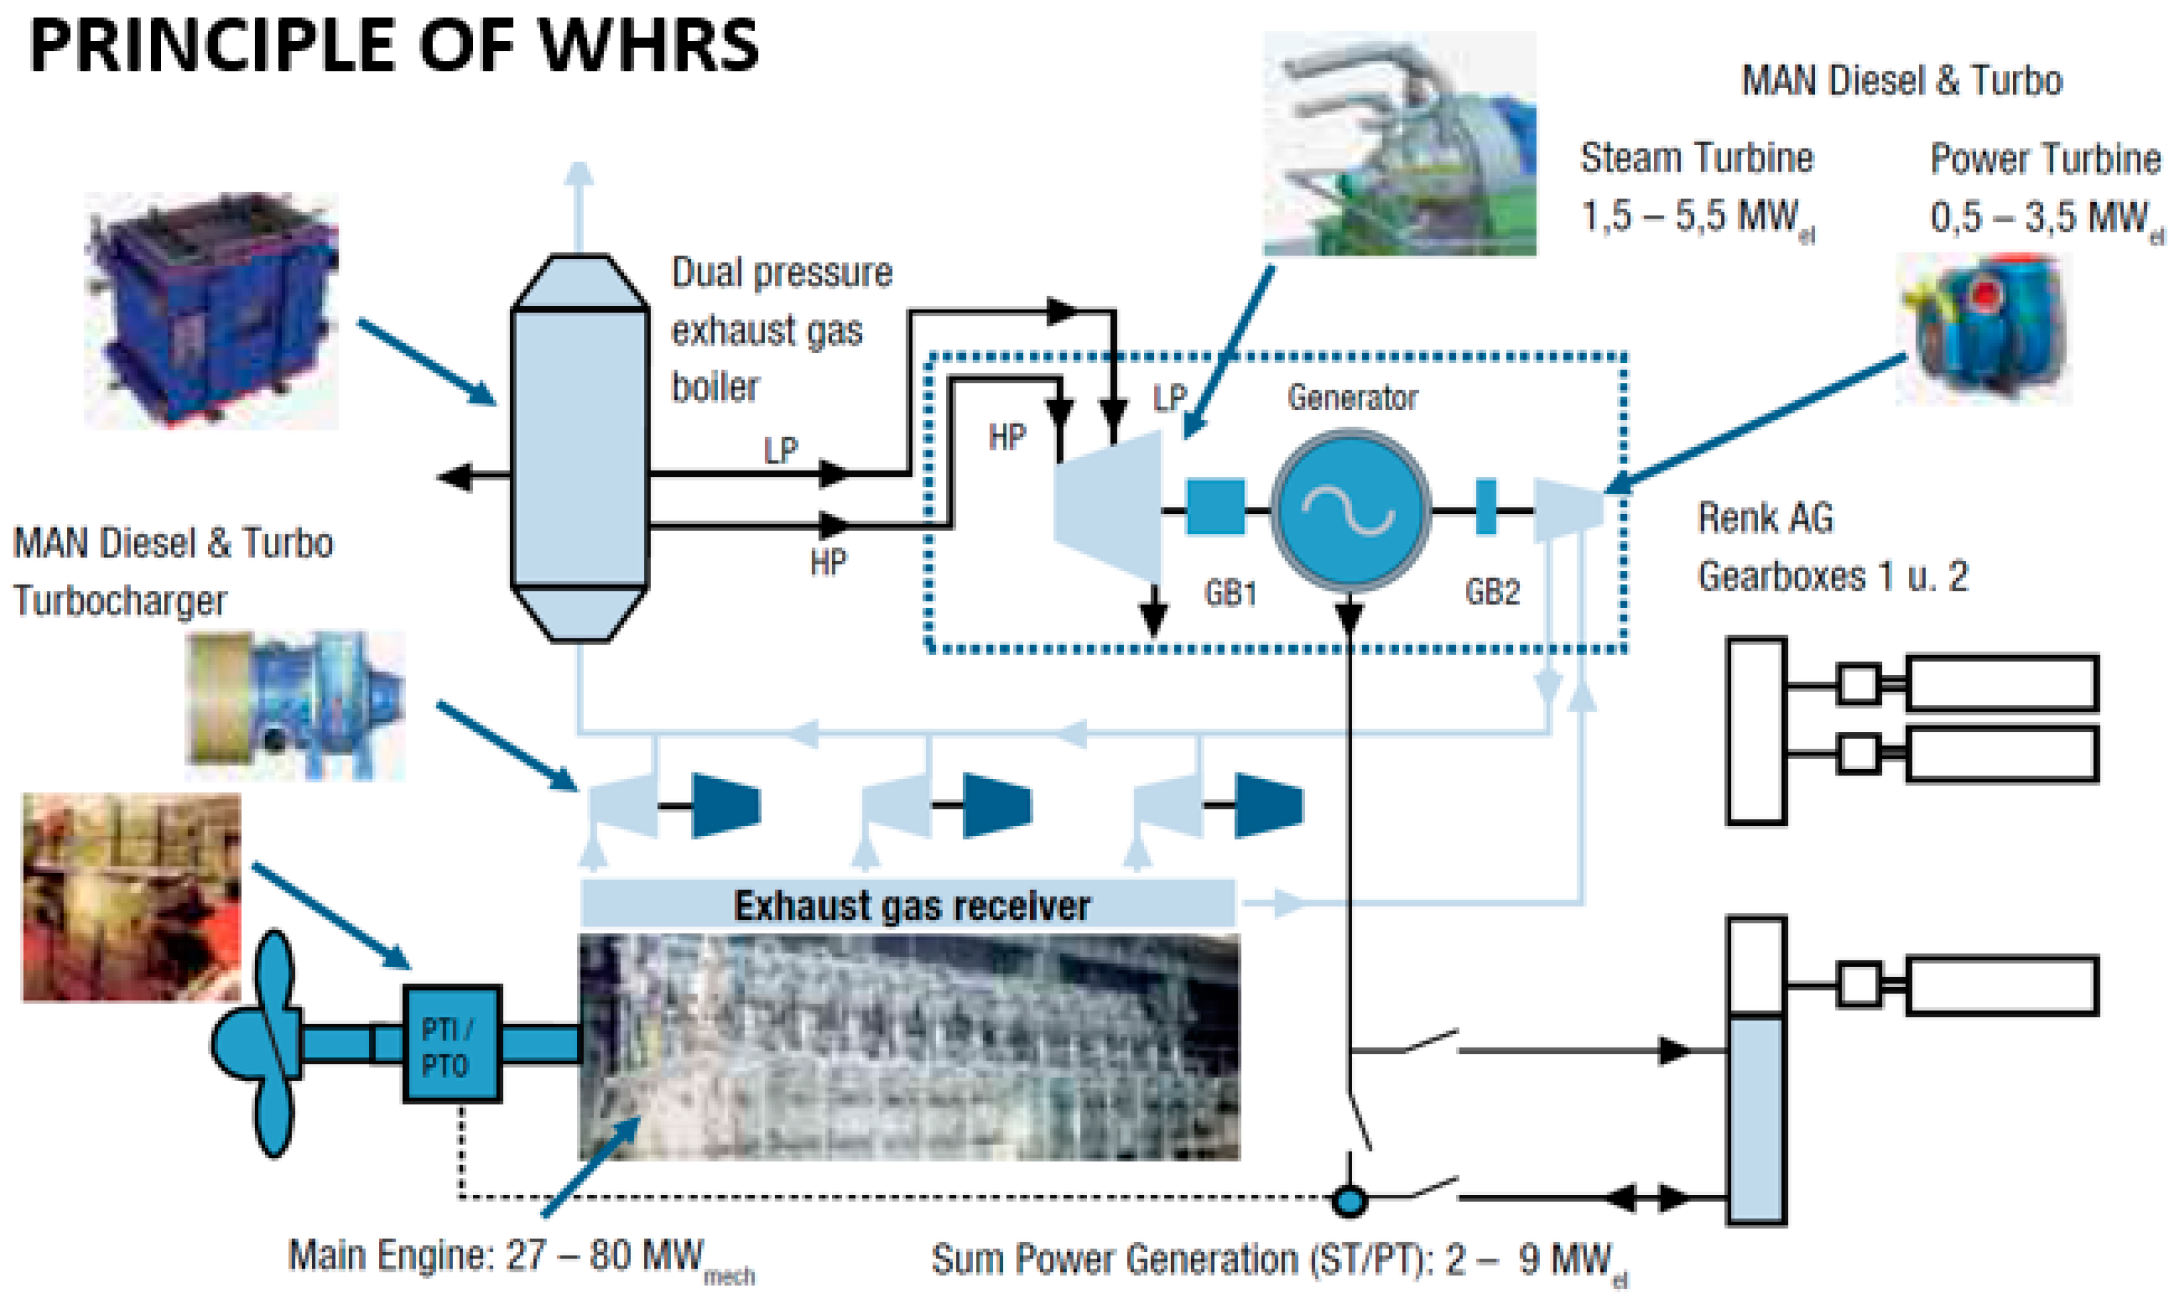
So far, the waste-heat recovery systems have proven their potential on board ships, but the performance still depends on the size, numbers, usage, and efficiency of the engines. It is possible to integrate existing study results to model the necessary technical equipment for a general maritime WHRS along with economic and physical characteristics. The first notable factor is that the WHRS transfers thermal energy from the exhaust gas into electrical energy. This system usually consists of an exhaust gas boiler together with an ST and a PT [7,12]. Another factor is that the ST starts working as a generator at 30–35% specified maximum continuous rating (SMCR) as the main engine power and uses steam from the combustion boiler. Then, the PT generates electricity directly from the exhaust gases of the main engine and starts electricity production at 40–50% SMCR. The combined ST-PT technology requires an additional fuel consumption of approximately 1.2% of the burned fuel to tune the WHRS to a range above 50% SMCR for improved efficiency. For the ST-PT technology, the electric recovery rate (ERR) is expressed in an equation that estimates the recovered electrical power that depends on the available mechanical power of the main engine:
or expressed as recovered electrical power depending of available main engine power:
Since the available mechanical power depends on the maximal engine power, the current load factor the equation (ERR) is transformed so that the currently available mechanical power is replaced by the load factor and the maximal engine power. The construction principle of an on board WHRS using ST-PT technology together with its technical components can be studied in Figure 3 that stems from the MAN solution [7].
The costs of installation for a WHRS depends on the size of the ship and the ship engine and is estimated to be between US$2,000,000–US$10,000,000. The highest band cost was from a case study on Emma Maersk container vessel of engine size of 80 thousand kW reported by Shu et al.; MAN and GloMEEP [7,8,12]. Estimating the costs for WHRS installations is somewhat complicated because WHRS producers only disclose their final quotes, i.e., the CAPEX, which depends exclusively on the clients, i.e., ship-owners and shipyards. Nevertheless, published information from WHRS producers like MAN [7] estimated data for investment calculations that include compulsory maintenance costs in addition to the investment costs:
- Combined Steam Turbine-Power Turbine (ST-PT) generator unit: ca. 10 million US$
- -
- Annual maintenance costs: ca. US$30,000
- STG—Steam Turbine Generator unit: ca. 7 million US$
- -
- Annual maintenance costs: ca. US$20,000
- PTG—Power Turbine Generator unit: ca. 2 million US$
- -
- Annual maintenance costs: ca. US$10,000
Further, the cost of installation for a WHRS in US$/kW is approximated to about 100 US$/kW for a PT generator, about 300 US$/kW for an ST generator, and about 400 US$/kW for a combined generator (ST-PT). In the range of main engine sizes of 50,000 kW and above, the installation costs for a combined ST-PT generator fall to about 150–200 US$/kW due to the economy of scale effects. In addition to the initial WHRS installation cost, the annual maintenance costs for the boiler, the PT, or the ST (in some cases) sum up to around US$20,000 per year for each ship independent of the vessel size [8]. These figures act on the assumption of an economic lifetime of 20 years for the WHRS, which equals the typical lifetime of a vessel [13].
2.2. Capital Budgeting for WHRS Investment
The assessment of corporate investments is classically based on the consideration and analysis of the expected (future) annual cash flow (CF) that might appear as positive or negative income streams over the lifespan of the investment. To compare cash flows that appear at different times, financial streams are discounted and shifted to the same period. The discount takes account of the opportunity costs of the capital and adjusts the time value of the money element. The sum of every discounted expected revenue at the starting time of the venture leads to the net present value (NPV) of the investment, which estimates the value of the investment at the beginning. This process is also called the Discounted Cash Flow (DCF) method, a well-known approach used to quantify investments through specific parameters like the NPV and the internal rate of return (IRR) as well as the payback time of the investment [22,23].
Although there are a large variety of implementations of the DCF method, most of them are sub-summed under the capital budgeting method to calculate the cost-efficiency of an investment [24]. The most famous approach for assessing the sum value of an investment is the NPV that discounts all future cash flows (both outflow) that result from the investment at a discounted proportion as shown in the following formula (3):
where: N—investment period, i.e., economic lifespan in periods, i—risk-free interest rate in %, CFt—expected cash flow generated in year t and CapEx—capital expenditure, i.e., the initial capital investment.
The most straightforward rule for business decisions based on NPV value is to discard all investments with negative NPVs and undertake only ventures with positive NPVs. This type of decision rule ensures that investors maximize value for their investments. The worth of the investment is thus determined with a clear view of the financial merit of initial investment cost, i.e., when the NPV is greater than zero. An essential parameter in the calculation of the NPV is the term q = 1/(1+ i) called (in finance literature) the discount rate. The discount rate is determined by the evaluation of the “real” cost of funds invested in the project, using the cost of equity and debt initially invested in the venture discussed from a theoretical and empirical standpoint in Myers et al. [25].
Before the NPV method is applied to the assessment of WHRS investments, some critical parameters have to be specified. A closer look at the NPV (Equation (2)) and the corresponding characteristics of a WHRS installation delivers the following values:
- N = 20, since the economic lifespan of a WHRS, is assumed to be 20 years
- CapEx corresponds to the investment costs of the WHRS
- i represents the long-term interest rate for an employed capital
The long-term interest rate represents the current interest rate for a 20-year employed capital and usually ranges between the risk-free interest rate as a lower band that is about 2.4% and the average long-term interest rate in banking, which is usually about 7%. In this particular case, the authors chose the widespread value of i = 6% that is assumed to be fixed over the whole lifespan of the WHRS investment.
A more challenging task is to determine the annual cash flows CFt that are linked to the investment, the inflows over the years depending on the savings of energy costs caused by energy reduction using the WHRS and the savings on the total annual energy production on the ship without WHRS. The energy reductions of the WHRS and the value of the fuel reductions of the WHRS are unstable and volatile in real life that will change significantly over the lifespan of 20 years. Additionally on outflows, one has to take into account the annual maintenance costs together with other costs related to the WHRS use such as additional energy costs for running the WHR systems. After identifying the annual in- outflows, its difference defines the annual cash flow CFt of the WHRS, thus the annual cash flows caused by the WHRS installation is described by the following equation:
The fuel cost saving is the recovered energy equivalent of the annual fuel consumption of the vessel, where the fuel is evaluated by the market price of the fuel. Note that all appearing variables like the capital costs depend on additional parameters like the interest rates.
Besides the uncertainties from the volatility of fuel prices and possible long-term interest rates in the calculation of the cash flow, the challenge of the generated energy must be resolved which is one of the most compelling complications from the evaluation. Since the WHRS only operates above 50% of the engine load with the recovered energy working at a certain percentage of the total energy used per time, having the necessary engine load profile is important. Such information depends on the type of vessel as well as the characteristics of the ship operations and voyages. There are three different activities in ship operations, port operations, maneuvering, and seafaring. Several works had investigated engine load inventories and but this work uses the Swedish results collected in the context of a marine emission inventory work shown in Table 1 by Alexandersson et al. and Flodström [26,27]:
Table 1 reveals that the operational time of a WHRS is limited to sea days of a vessel. Thus, the efficiency of a WHRS depends on the type and the operation profile of the ship. A rough survey-based estimation discloses that the usable engine energy of a WHRS corresponds to about 80% of the burned fuel of the engine power at design speed per sea day. However, this 80% seems to be somewhat too high for the estimation of the average fuel consumption per sea day due to prevalent low steaming activities. Besides, the characteristics of the main engines have their highest efficiency in a range between 60–80% load factors (taking into account that the results of Flodström are over 20 years), it seems to be more realistic to assume an average engine load of around 70% by WinGD and MAN [11,28]. Notwithstanding, engine load assumptions for the port and maneuvering still have considerable uncertainty, especially now that the engines are shut down in ports due to the on-shore power supply. In the current study, these uncertainties are considered negligible due to the engine load factor that is below 50% seen in Table 1.
Another parameter to be estimated is related to the average annual engine load of the vessel, which is necessary to calculate the annual energy volume generated by the WHRS. Again, this parameter also depends on the ship and its operating characteristics. It requires a more detailed analysis than in the overall engine load statistics. One simplified approach is the display of the detailed annual distribution of average ranges for various engine loads gotten from experts’ interviews in Table 2.
The weighted average of the main engine load (WAEL) is calculated by summing up the products of the different main engine loads with the percentage of usage time and taking under account the load value of 50% or higher. Hence, the WAEL can be considered as the expectation value of the engine load quantities greater or equal to 50%. Thus in this example, the authors come to the following calculation:
WAEL = 100% × 2% + 90% × 6% + … + 60% × 10% + 50% × 10% = 59%
The WAEL factor would be used later to assess the recovered energy of the WHRS. Furthermore, all other information in Table 2 will be used to estimate the annual cash flows to apply the instruments of capital budgeting however, the profiles of the ships might differ significantly. This same principle applies to the financial results of the same WHRS on different ships with different operating characteristics. Again, the operation profiles are somewhat complex to describe for an entire year, which is why in reality financial experts change their key figures from year to year so that capital budgeting approaches only describe the economic picture in part. However, in a literature review by Borkowski [29], results based on calculations using capital budgeting approaches show a payback time between 6–7 years or according to MAN [7] a more optimistic payback time of 4–6 years. Already, these results cover a possible payback period of a WHRS investment between 4–7 years and a closer look at the used economic frame conditions disclose that these findings are only partly transferable to the current market environment that is later discussed in the paper.
2.3. Real-Option Evaluation for WHRS Investments
The previous discussion already highlighted that flexibility is not the core feature of the standard DCF based method and in addition to that, literature was able to prove that the NPV indicator underestimates the current value of the investment. For instance, Milne and Whalley [30] discussed that in the event of delayed investment, the future income and option values should be added to the current year NPV, so that to take into consideration compensation of the time-measure of money, the resource value must be greater when compared to the commencing investment in the options. This description mainly makes the NPV and standard DCF method inappropriate and insufficient for evaluating shipping industry investments. The recognized inappropriateness of the DCF method had necessitated the undertaking of different approaches such as the real-option pricing approach and scenario techniques, which introduced sensitivity analysis, uncertainty associated with the option value, and dynamic analysis of the project valuation [31]. Thus, Di Lorenzo et al. [31] proposed that the DCF could be integrated with a real option to assess investments plan in a typical investment or in a high-tech industry where the company want to commercialize new products.
The real options method of investment projects is the extension of financial options theory on real property. Black and Scholes introduced the options trading approach into investment appraisal by using the option pricing to evaluate an investment from the zero points of the project. By incorporating a constant price variation of the asset, the money value of the time, the option’s exercise price, and the option’s closure (expiration) value, the ROA calculates the price of a call option and put option in general [18]. Applications of real options approach in maritime business are only getting attention now because maritime investors are beginning to appreciate investment decisions that allow reactions to volatile commodities like fuel and other goods allowing integration if management options and evaluations into a real options approach. The flexibility of the management to add value to the project by reacting to changing frame conditions is summarized in Table 3.
Some works recognize the potential of real options approaches for the maritime industry. For example, Acciaro [32] used a real options approach to assessing liquefied natural gas (LNG) use on ships, and Atari et al. [3] investigated the financial performance of scrubber investment in the context of SECA regulations using the real options concepts. In both works, maritime investment models were empirically tested and validated with real cases from the shipping industry. In addition to that, both studies pointed out that their models can determine the optimal time for deferrals of investments and can assess investments at present or in the future. Thus, a real project decision like the investment of a WHRS represents an investment decision about a tangible asset for a call option since the financier has the right but not a commitment to invest in the project at a particular fixed cost and time [33,34].
A common feature in financial and real options approaches is that the price of an option shows a projected impending return of the investment during the period of exercise where the projected return is discounted back to the present safely while revealing the present option value. In other words, real-options acquisitions are not constant; however, in diverse financial market options, the strike prices (i.e., the price at the premium is bought) are fixed. Thus, financial models try to measure the sensitivity of options according to changes in prices, time, and volatility in the frame of risk management. The corresponding parameters delta, theta, and vega are usually called the Greeks and they are famous instruments in risk management [33]. A well-known result from a risk analysis of option is that the value of options declines with decreasing lifetime of the option.
An investment appraisal with a real options approach offers the possibility to include flexibility of the management in case of project decisions. Since real option represents a right that needs not to be executed, this management flexibility comprises the:
- Option to expand, i.e., in case of favorable business conditions the project can be expanded;
- Option to delay or defer, i.e., the project start can be postponed;
- Option to contract, i.e., the project can be contracted under unfavorable conditions;
- Option to interrupt i.e., may shut down project temporally operation in unfavorable conditions
These options also exist in the case of a WHRS installation because it may not be optimal to operate a system for a given period if the generated revenues do not cover the variable costs. In this view, if the price of fuel falls below the cost of initial calculations, it may be optimal to shut down the WHRS temporarily to save costs of maintenance and other related costs until the fuel price recovers. Hence, an investment decision represents the execution of a real option, and this the execution of the option the corresponding NPV of the option will be realized. However, it has to be kept in mind that the execution of the option is related to the generation of opportunity costs because the investor abandons the possibility to realize the investment decision later, which is linked to better future data [33].
By taking into account these assumptions, the classical rule for investment decisions has to be modified. In capital budgeting theory, an investment decision is favorable if the NPV is enough greater than zero, i.e., if the discounted annual cash flows exceed the investment costs at the time of the investment start. In the case of a real options approach, this rule is modified in such a way that the NPV also has to cover the opportunity costs of the investment decisions, and these opportunity costs are expressed by the real option value, i.e., the real options investment decision rule is NPV—Real Option Value ≥ 0, or NPV ≥ Real Option Value. In words, this rule means that the investment decision is economically reasonable if the Net Present Value (NPV) is greater or equal to the opportunity costs expressed by the real option value.
For this reason, an evaluation of a given real option is necessary for investment decisions. This work considers a pricing model of options that depend on the approach of Black—Scholes model that assumes a lognormal distribution of future returns together with a diffusion process of information that usually causes distributed price change with either a constant or changing variance [18]. Following the general option-pricing model of Black and Scholes, investment opportunity in a WHRS technology is designed to represent a call option on the NPV of the expected future revenues from the operating WHRS investment. This offers the option to invest or postpone because of the circumstances that affect the formation of the NPV of the investment. The following nonlinear equation estimates the price of the call option (C):
where C is the value of a call option, and S0 is the expected revenue from WHRS investment (i.e., the expected revenue from the risky operational investment in WHRS. T is the time it takes the option to mature, i.e., in this case, the economic life of the WHRS. N(x) is the aggregates of the standard normal distribution, σ is the riskiness of the WHRS used (i.e., the standard deviation from future cash flow on S). K is the option’s exercise (strike) price at the end of investment (i.e., the conversion cost of the asset prospect to an option venture). N (d1) and N (d2) denominate the standard normal cumulative distribution function (i.e., deviations from the expected value of the normal distribution) and e is the Euler’s constant. The formulas for d1 and d2 are as follows:
Thus, the proposed pricing in the maritime industry for obtaining new technologies, specifically WHRS technology is calculated:
In reality, the daily fuel consumption of any ships is a critical factor in calculating the daily and annual cost of fuel consumption so that with these numbers, it would be easy to calculate the value of the cost of fuel consumption. The same applies to the savings representing the future cash flows in the option value.
Another approach given by Atari et al. [3] is the combination of the DFC and Real-Options with a Monte Carlo Simulation (MCS) to approximate the actual NPV of the investment by incorporating the market changes that directly influence future revenue-generation assessment. Here, the MCS serves as a probability measurement of the investment that uses random inputs to predict the volatile market [31]. Based on multiple statistical simulations (modeling various scenarios), the MCS technique is likely to be realistic and reflects the dynamic nature of the investment lifespan. However, this work focuses on a qualitative analysis of the shipping industry using the traditional NPV and the ROA investment evaluation methods.
2.4. Case Study
The authors first examine the case of a ferry that plies between the ports of Helsinki and Tallinn, and then further contrast the results with another ferry that plies Travemünde and Helsinki and later with a container ship on China—European North Range voyages. All real-life scenarios evaluate the WHRS project investments and highlight the significant influences on operating profiles of the vessels as well as the used fuel types. The empirical data were used to determine the cost build-ups of the WHRS technology using the conventional investment evaluation tools, i.e., NPV, IRR, and the payback period comparable to using the proposed real options model. Afterward, the results of the comparative analysis were used to determine which of the investment evaluation tool is most promising for a maritime investment decision to maximize profit and avoid loss.
As mentioned up front, the price of a WHRS ranges between 2–10 million US$ depending on the type of systems. These figures are in line with the found prices of WHRS producers and confirmed in the experts’ interviews. Since all calculations are in Euro, the authors assume an exchange rate of about 1: 1.1 for the Euro—US$. The estimated costs of maintenance for a WHRS will be approximately 9.1 t€ and 27.3 t€ per year. In addition to that, the operation of a WHRS requires energy, equivalent to about 2 g/kWh of fuel, or by expressing it in a fixed percentage, equals 1.2% additional fuel. A point to remember is that the WHRS works only above 50% engine load, but the maintenance costs together with the additional fuel costs sum up to the annual operating costs of the WHRS.
The assessment of the benefit of the WHRS in the form of fuel cost savings over its lifetime of 20 years can be tricky due to the changing fuel prices and different operation profile of the ship. However, for investment appraisal, it is crucial to predict the cost of capital. Mkouar and Prigent [35] explained that the primary driven factor in erratic investment is the interest rate, which influences both the cost of capital and discount rate. Some part of the investment funding is from the company’s equity while the remaining funding through bank loans. The subject case uses a bank credit of 20 years paid back in installments that includes the annual interest rate and opportunity costs on the initial capital.
Lastly, on methodology, the estimation of fuel cost saving due to WHRS requires an assessment of the average operation time of the vessel, which can be only achieved by the consideration of the individual operating profile of each vessel. Going forward with this, still, note that the WHRS only produces energy in the range above 50% of the engine load and the WAEL equation outlined the exact calculation of the average operating time above 50% engine load calculated based on the individual operating profile of the vessels. In cases where individual operational engine load profiles are not available, it is possible to find realistic estimations for the fuel savings of the WHRS. For example, since the WHRS only generates energy within the interval of 50% to 100% of the primary engine load, it is assumed that the average WHRS operation point is near mid-interval of 75%. This is because the lowest fuel consumption of the current main engines appears around an operation point between 60% and 80% engine load (depending on vessel and engine type) [11,28]. By recalling the results of Flodström [27], the only time where an engine load is greater than 50% is at sea (not adding the maneuvering time). Hence, during the sea operations, the WHRS is partly able to generate energy, so that the productive sea time of the WHRS is only a subset of the total operating time of the vessel, which makes the weighted average of the main engine load (WAEL) lower than 75%. Observations of the operational profile of ships revealed that the exact calculated WAEL seem to be slightly lower around 60% or close to it. Based on this data, it is possible to estimate the fuel savings of the WHRS, although the uncertainties that surround the fuel price remain unpredictable for an extended period.
3. Results
3.1. Capital Budgeting Results for RoPax Ferries and Cargo Vessel
The empiric validation of the research is realized by case studies of RoPax ferries plying daily between the ports of Helsinki —Tallinn, and Travemünde—Helsinki and of a container vessel on the China—European North Range route. Experts’ interviews revealed that the considered RoPax ferry (i.e., Helsinki–Tallinn) consumes 60 t of marine diesel oil (MDO) for a triple roundtrip yielding an annual MDO bunkering volume of 21,000 t. Since the vessel is equipped with a dual-fuel engine, the shipping company has the option to run the ferry with LNG as well. Since the RoPax ferry is equipped with main engines above 25,000 kW, the authors consider WHRS that are combined Steam Turbine-Power Turbine generator units (ST-PT) with a maximal electric recovery rate of 8–11%. Such ST-PT systems cost about 9 million €, i.e., CapEx, and generates annual maintenance costs of about 27,000 t€ (Euro per metric ton). Table 4 gives the detailed general input parameters for the evaluation for the 2 ferries.
In contrast to the ferry cases plying on short and medium distances with relatively high cruising speeds, the authors further depict a long-haul cargo vessel that commutes between China and European North Range Ports. The considered case is a 14,000 TEU container vessel used by MAN [7] earlier introduced in the paper. The container ship has a two-stroke HFO engine that uses the power of 57,800 kW that performs at a maximum speed of about 26 kn. Since the beginning of 2020, the Global Cap regulation is in force so that the container vessel is currently presumed to use reduced sulphur fuel within a range between 0.1–0.5% of sulphur content depending on the sea of operation. Since the prices for very low sulphur fuel oil, i.e., for bunker fuel with a lowered sulphur content of about 0.5% only exist from the beginning of 2020, the authors also assume a comparable fuel price to the ferry cases of about 450 € per ton.
3.1.1. Case A—Tallinn—Helsinki
The ports of Helsinki and Tallinn are 44.3 nm apart and the RoPax ferry time between both ports is 2 h one-way. The ship is equipped with a primary engine of 40,600 kW and a maximal speed of 27 knots. The annual operation profile of the ferry is about 360 days of service while the non-operation days are related to docking time or festive such as Christmas breaks. The number of total annual round trips between Tallinn and Helsinki is 1050 h i.e., the total number of operating hours is 4200 h consisting of two or three daily round trips of 4 h.
The outcome of capital budgeting calculations (Table 5) with the average fuel price of ca. 450 € for MGO in Rotterdam delivers a meager NPV value of only about 300 t€ over the full lifespan of 20 years, which is negative by assuming the very low MGO prices in the first quarter of 2020 that ranges around 270 € per ton. With the low NPV, we also have a very low internal interest rate together with a payback period of over 19 years by assuming an interest rate of about 2.5% for a long-term loan. Consequently, the decision for the installation of an ST-PT WHRS is not recommended for poor financial performance. The use of LNG would even degrade the capital budgeting indicators of the ferry due to the lower LNG price and lower fuel consumption in LNG mode, i.e., the NPV would turn into a negative value.
The most relevant impact factor is the number of annual operation hours that is by far too low to reach the benefit zone of a WHRS. By keeping the other parameter constant and varying the annual operation hours of the ferry, the NPV yields a positive figure with values beyond 5600 h. Hence, the operation of the RoPax ferry on longer routes would lead to a favorable decision for the installation of an ST-PT WHRS. One possible route would be a ferry connection between Lübeck and Tallinn, which currently does not exist, even though there is a ferry link between Lübeck and Helsinki. The distance between Lübeck (Travemünde) and Tallinn is about 600 nm, comparable to the route length between Lübeck and Helsinki.
3.1.2. Case B—Travemünde—Helsinki
The study’s second case is a ferry link between Germany and Finland, which is a RoPax vessel plying the ports of Travemünde and Helsinki and distanced about 611 nm. Both RoPax ferries (i.e., Tallinn—Helsinki and Travemünde—Helsinki) enjoy similar properties because they are equipped with similar primary engines. The Lübeck—Helsinki ferry has a 41580 kW four-stroke MDO engine that allows a maximum speed of 25 kn, which requires an ST-PT WHRS. The average journey time Lübeck—Helsinki is around 29 h with an average journey speed of a little bit less than 21 knots. An analysis of the ferry schedule reveals an annual operation time of 5220 h and 360 days of operations with slightly higher fuel consumption and WAEL when compared to the first case (i.e., Tallinn—Helsinki). The calculations yield an NPV of about 5 million € for the 20-year usage of the WHRS together with an internal rate of return around 8% and a payback time of about 8 years but be it as it may, the currently low fuel price would reduce the financial indicators significantly.
These results signify optimistic assumptions because it is doubtful that bunker fuel prices, as well as the operation profile of the vessel, would recover to the average level of the previous four years or would remain constant over 20 years. Hence, in reality, fuel prices might be characterized by a significant variance over time; thus, the realized future cash flows would not remain constant over the operational period. The outcome of the capital budgeting approaches are also determined by the choice of discount rate that was assumed to be 2.5%, and in line with current long-term rates for loans, but it has to be stressed that this assumption strongly influences the project results.
Table 5 shows the summative capital budgeting results for Tallinn—Helsinki and Travemünde—Helsinki ferries.
3.1.3. Case C—China—European North Range Ports (Container Vessel)
The operational parameter of the container vessel, which is different from that of the ferries discloses an annual operation time of 6480 h, which represents 270 days of operation per year.
The results of the capital budgeting analysis yield an NPV of about 8.4 million € over the WHRS lifespan of 20 years; an IRR of 10.7% and a payback period of about nine years. Compared to the two ferry cases, the long-haul cargo vessel enjoys a significantly higher operating time, which affects the economic performance of the WHRS investment positively. Unfortunately, a negative impact on the financial parameters of the WHRS is related to the lower weights average engine load (WAEL) for the container vessel, which is about 59% due to lower steaming activities compared to the higher WAEL for the ferries that sail with higher speed.
By summing up the first findings, the results of the capital budgeting analysis for WHRS investments give exciting findings of the project investment feasibility. In all considered cases, we compared the same ST-PT WHRS due to the high performance of the installed engine power in all vessels. The fuel consumption per kWh slightly differs because the four-stroke engines in the ferries have a higher SFOC than the two-stroke engine in the container ship. Even though in all three considered cases, the annual cash flows are positive, the efficiency of the WHRS installations suffers in all three ships’ cases under low fuel price levels with the results the NPV of the Helsinki—Tallinn ferry turning out to be negative whereas the NPV of the two other ships’ cases is positive. In all three cases, the low-interest rates of the long-term loan deploy a positive impact on financial performance. Low-steaming in the container ship case lowers the efficiency of energy recovery and fuel cost savings. Finally, all payback periods are long with around 10 years and even longer making the decision for a WHRS investment under the current economic frame conditions doubtable. These long payback periods reveal a sharp deviation from the estimated payback periods in other studies, which have been stated to be between 4–7 years only.
Noteworthy is that production uncertainties were not considered in this evaluation of performance, though it has to be considered carefully, the NPV calculation made only contains the endogenous value of the WHRS investment. As previously stated, the capital budgeting evaluation method is the first step leading toward the real options approach, as the application of the real options approach is used to overcome those uncertainties, which would be used to further evaluate this project in the following section.
3.2. Investment Evaluation Using the Real Options Analysis (ROA)
In the application of the ROA to evaluate a WHRS investment using the Black and Scholes model, the authors made two assumptions. First, all figures from capital budgeting and other classical approaches are put under consideration; second, all estimations are conducted based on the cash flow of the first operating year. Other necessary data are unavailable such as future oil prices; however, since the primary aim of the research is to make a comparison between classical investment evaluation methods and the real options approach methods, these drawbacks may be overlooked.
In contrast to the ships’ operational costs, the cost of the WHR systems itself is not usually influenced by high market volatility. To simplify the process calculations, changes in technology or regulations were not put into consideration. However, in this case, a major cause of concern is the unpredictability nature of fuel cost. This is why this work used fuel prices data of long-term contracts and the average price of the EU main ports for the years 2016 to the end of the first quarter of 2020 representing 1107 data of daily fuel prices from the Marine Bunker Exchange (MABUX) for the port of Rotterdam. Also, the authors did not include spot prices because they may have been compromised by transient features such as demand and supply or new regulations.
The mean and standard deviation of the MDO prices over the considered period were calculated using yearly-basis rolling windows, reaching 460 €/mt and 91 €/mt, and these values are close to the low sulphur fuel price. The extreme oil prices at the beginning of 2020 are considered as a short-term trend, which will last for only a limited time. Thus, this study takes the average values for calculations and not the latest (very) low fuel prices. An analysis of the fuel volatility showed an annualized standard deviation of about 20%, which corresponds to the anticipated investment instability.
The investment horizon in a WHRS is 20 years, and the initial outlay is 9.1 million €. We discuss two important investment questions with the ROA instruments in this paper. First, if the investment decision of a WHRS installation in all three cases is economically reasonable under ROA view and second if deferral of one year of the WHRS investment is favorable for the management. The answer to the first question can be given by calculations using the Black–Scholes equation [18] and applying them to the economic parameters (from experts’ interviews) of the three vessels shown in Table 6.
Based on these project data, the application of the ROA (Black-Scholes option valuation model) [18] with a 20 years horizon delivers the following results using equations (5) and (6) for the three cases shown in Table 7:
The results of the overall ROA model to our three ships cases show an option value that is smaller than the NPV20y of the full 20-years lifetime of the WHRS so that NPVs in all cases cover the opportunity costs related to the investment decision. Thus, the technical indicators point out that the investment decision for the WHRS installation in all cases is favorable but a closer view to the case of the Helsinki-Tallinn ferry reveals another picture. The expected overall return of less than half a million EURO over a period of 20 years compared to a WHRS investment of about 9 million € with a highly volatile economic environment is unfavorable business conditions and management is thus cautioned to hesitate before deciding for the project.
A tentative deferral of the investment decision of the WHRS installation is hereby discussed: The estimated cash flows in the first year depending on the considered case of 0.6 million € for the Helsinki—Tallinn ferry, 0.9 million € for the Helsinki—Lübeck ferry, and 1.1 million € for the container vessel. The corresponding volatility of the MGO price is computed to about 20%, as shown in Table 8. The exposure threat of rate of returns (similar to treasury bonds) is about 2.5% (which is low) with a maturity of 10 years in the EU added to the opportunity cost of capital.
Note that the implementation of a WHRS investment is not in stages and the likelihood of termination after execution commences is low. Nevertheless, the installation of a WHRS might become unfavorable under an economic viewpoint such as increasing fuel prices or interest rates of reduced annual operation times caused by reduced demand for maritime cargo transport. In a situation such as this, investors can consider project deferment probably for one year or more i.e., when the NPV of the WHRS investment is greater than the option value, a deferral option of the WHRS investment (call option), becomes suitable. The corresponding parameters are displayed in Table 8.
An option value of delay is offered by differentiating the value of the expanded NPV (predicted future cash flows, i.e., the ROA and the computed NPV of the first operating year. In this case, the deferred option value exceeds that of an immediate investment, so that the investment is suspended until a more favorable period. In other words, the project execution takes place only when the NPV becomes higher than the option value (since deferring any project depends largely on available opportunity costs). Even though the WHRS investment option value cannot make up for the total cost of investment, it would be sufficient to cover the deferral option.
Atari et al. [3] pointed out that a deferral option is sorted via a decision tree approach based on the binomial model. They also highlighted that the results provided by the Black and Scholes formula converge to those provided by the binomial option-pricing approach, under certain assumptions. Following the idea mentioned above, this paper further uses the Black–Scholes option valuation model to specify the required parameters to calculate the real call-option value, i.e., the initial cash flows, the volatility of the project, etc. (see Table 6). Herewith, once the inputs parameters required for setting up the model are identified, the call-option value is calculated using Equations (7) and (8). Results are as follows in Table 9:
The results display the value of the real option (C) and the deviations from the expected value of the normal distribution (d1 and d2) by applying the Black–Scholes model. Realistically, the investor suspends the investment but does not abandon the project. This situation indicates the advantage of having a flexible option. High cash flow volatility (i.e., 20%) justifies the large size of this value and the significant long lifetime of the option (20 years) so that in this situation it is not surprising for such a significant investment. A closer look at the development of the real option value over the lifetime of 20 years reveals that in all three considered cases, the NPV exceeds the real option value within the first 10 years. Hence, the most significant value growth of the real option takes place in the second 10 years of the usage of the WHRS so that the maintenance and servicing of the technical system play a crucial role in the economic success of the concept.
4. Discussion
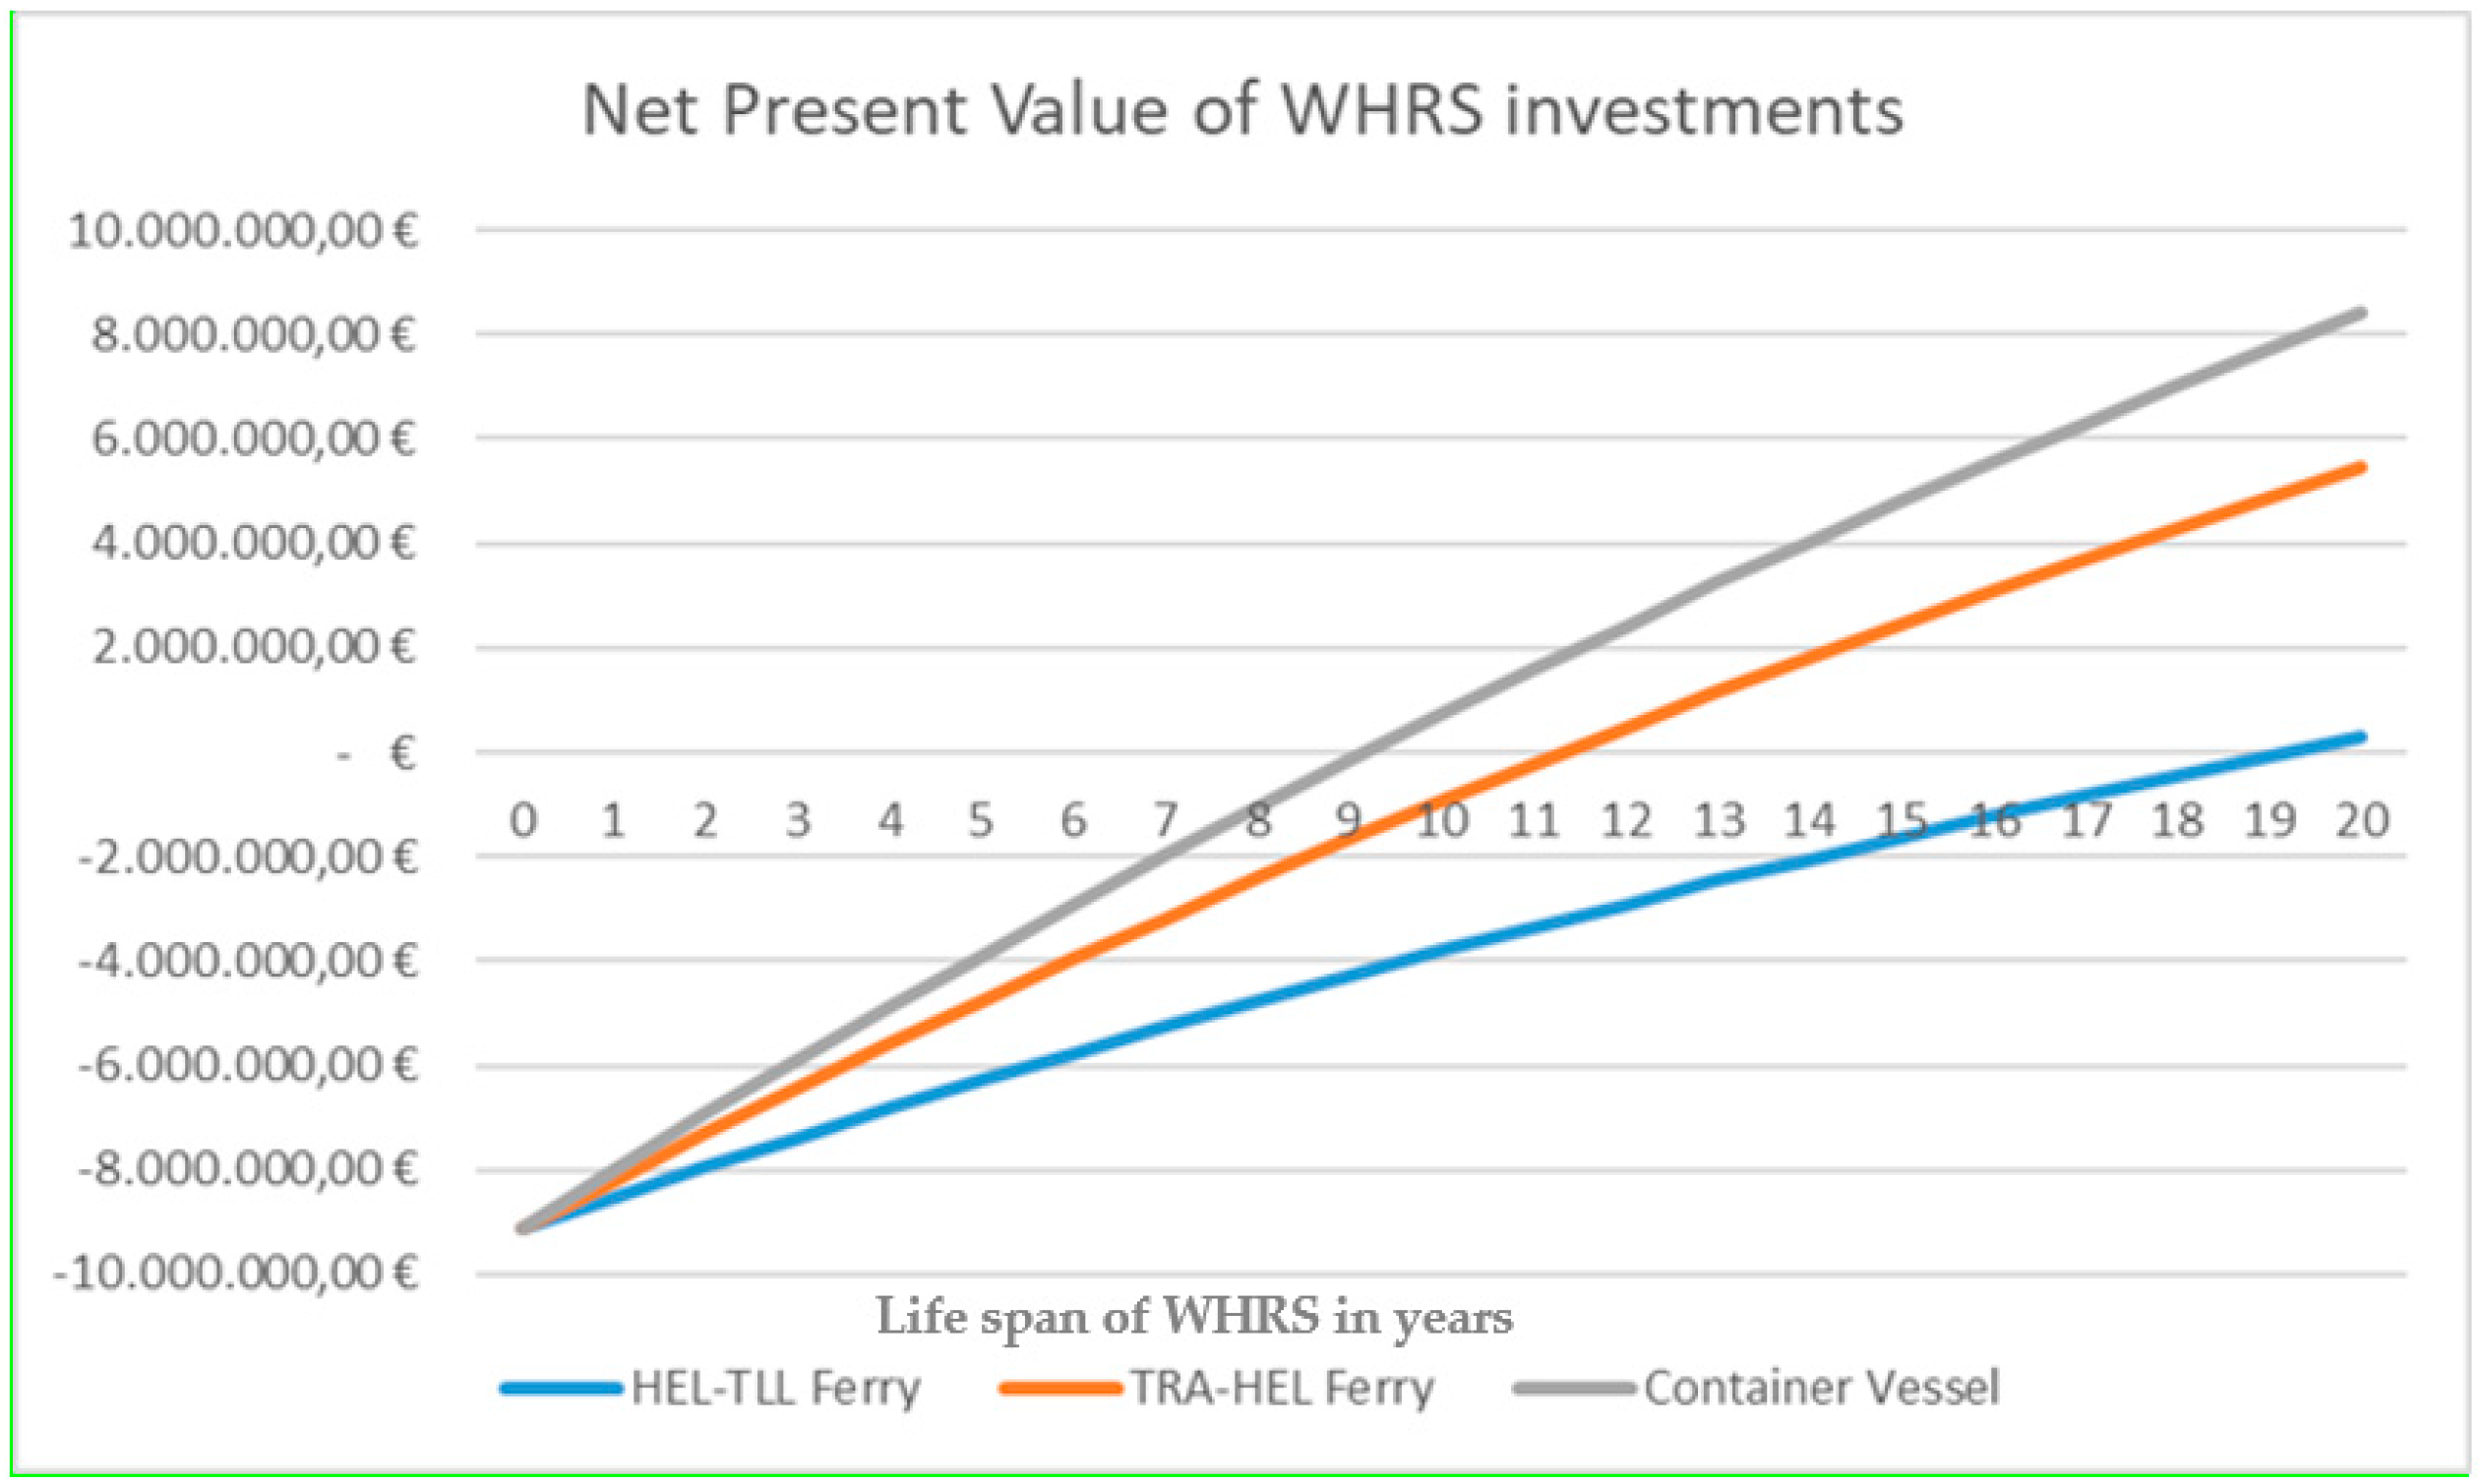
The assessment of the WHRS investments on the three considered ships with the capital budgeting approach reveals that the operating profile of the vessels significantly influence the economic results. The two analyzed ferries are equipped with main engines of comparable power but with different operating profiles that lead to different economic situations. By considering the development of the NPV of all three vessels, it is obvious that a WHRS investment seems to be more appropriate for long-haul profiles than for short sea shipping. Figure 4 highlights this result by depicting the development of the three NPVs:
Another critical factor in the discussion of current shipping status is related to very low fuel prices. All our reflections until now considered an average fuel price of the last years which was around 450 € per ton of MGO/MDO. By considering the prices for maritime fuel around April or May 2020, the values fluctuate instead of around 200 €, and a calculation of the NPVs of the three cases yielded negative amounts. In the case of the Helsinki—Tallinn ferry we got an NPV of about −6 million €, the Helsinki—Lübeck ferry yielded an NPV of about -4 million €, and even the long-haul cargo vessel only reaches an NPV of around −2.5 million €. These results suggest that a WHRS installation does not make economic sense in times of very low fuel prices. In these cases, deferral decisions seem to be an adequate solution for ship-owners.
Addressing the argument that the option-pricing approach results might not provide a historical normal distribution i.e., [32,36] or that the binomial option-pricing method could have an advantage over the ROA method because it gives the flexibility of decision-making over a longer period before investment [3]. Note that even though investment value increases when a project is put on hold because of uncertainty reduction, nevertheless, the option to defer in the binomial case might involve losses in cash flows and competition. This is why the choices on the implementation of the project are made if these losses are considered in the final decision. It further signifies that although the conventional investment approaches do not put flexibility into consideration (which underestimates the project value); including the ROA alongside NPV evaluation improves the accuracy of the investment assessment because it gives room for a project deferral.
The real options approach allows the investor to define the best investment opportunity and decisions with the highest return for regulation compliance. The results indicate that the best short or long-term investment and capital budgeting strategies for the future of maritime companies can be taken into account for WHRS installation on new ships or as a retrofit device for older ships.
The focus of this research was centered on the financial aspects of WHRS installation, however, the interest of WHRS centers on CO2 emissions reduction and how it affects the Energy Efficiency Design Index (EEDI) of ships as enforced by the IMO. The IMO regulation demands at least a 10% efficiency from new ships starting from 2015, with 20% of them becoming more efficient by 2020 and 30% more efficient from [9,37]. They estimated that the compliant implementation of the EEDI regulations would probably fast-tracked the CO2 reduction up to 263 million tons by 2030.
This why the EEDI for new ships is a crucial technical measure to improving the energy efficiency level per expanse mile for various types and sizes of ships. The EEDI gives an explicit quotation for each vessel design, indicated in grams of carbon dioxide (gCO2) for each vessel’s capacity-mile or kilometer (ton/km) (i.e., a low EEDI value implies energy efficiency in terms of ship design). Simply, the ratio EEDI = CO2/transport work; an exact formula can be found in the literature. Once energy requirements are met, all possible methods are explored to ensure cost efficiency to help ships acquiesce with the regulations. Under this point of view, a WHRS installation may represent a powerful tool to reducing CO2 emissions even in the case of unfavorable economic preconditions i.e., a WHRS installation can be a less expensive option for the reduction of CO2 emissions when compared to other technologies.
5. Conclusions
The objective of this work was to offer and evaluate methods that can solve investors’ challenges of WHRS investment decisions to avoid loss and maximize profit using energy recovery technology. Besides traditional approaches from capital budgeting theory, the research presented and discussed methods from ROA. Three real cases from the shipping sector were empirically evaluated. The NPV results of the Helsinki—Tallinn ferry (−6 million €), the Helsinki—Lübeck ferry (−4 million €), and the long-haul cargo vessel (−2.5 million €) suggest that a WHRS installation does not make economic sense in times of very low fuel prices. In all of the three cases, deferral decisions seem to be an adequate solution for ship-owners. Despite this, the application of ROA looks promising, and the given results seem to be valuable enough for potential investors to plan and assess tentative WHRS investments with the needed flexibility over more extended periods.
This paper contribution is new to the maritime industry that is highly characterized by burdensome uncertainties because it integrated the valuation of the payback period and DCF of the maritime fuels compliant to SECA and global sulphur cap regulations. The findings prove that the ROA as an investment evaluation method could be reliable and worthy. Investors in the maritime industry can thus rely on and take advantage of this method.
In addition to compliance issues from emission control regulations, the use of WHRS investments also affects the energy efficiency of ships. Hence, the paper discusses the use of WHRS in light of the EEDI regulations of the IMO, which goes beyond pure financial investigations. Further work would be directed towards benchmarking these results with alternative fuel-driven ships to create a more precise picture regarding compliance investments and reduce investment decision risks.
Author Contributions
Conceptualization, E.O.O. and G.P.; methodology, E.O.O., G.P.; validation, E.O.O., G.P.; formal analysis, E.O.O., G.P.; investigation, E.O.O. and G.P.; writing—original draft preparation, E.O.O., G.P.; writing—review and editing, E.O.O. and G.P.; funding acquisition, G.P. All authors have read and agreed to the published version of the manuscript.
Funding
This research was funded by the EUROPEAN REGIONAL DEVELOPMENT FUND in the frame of the BSR INTERREG PROGRAMME through the EnviSuM—Environmental Impact of Low Emission Shipping: Measurements and Modelling and the CSHIPP—Clean Shipping Platform projects.
Conflicts of Interest
The authors declare no conflict of interest.
References
- ABS. Ship Energy Efficiency—Status and Guidance; American Bureau of Shipping: Spring, TX, USA, 2013; Available online: https://ww2.eagle.org/content/dam/eagle/advisories-and-debriefs/ABS_Energy_Efficiency_Advisory.pdf (accessed on 2 February 2020).
- Lappi, M.; Borkowski, T.; Myskow, J. Emission Reduction Measures in Maritime Shipping; Maritime University of Szczecin: Szczecin, Poland, 2015; ISBN 978-83-644434-07-5. [Google Scholar]
- Atari, S.; Bakkar, Y.; Olaniyi, E.O.; Prause, G. Real options analysis of abatement investments for sulphur emission control areas compliance. J. Entrep. Sustain. 2019, 6, 1062–1086. [Google Scholar] [CrossRef]
- Olaniyi, E.O.; Atari, S.; Prause, G. Maritime Energy Contracting for Clean Shipping. Transp. Telecommun. J. 2018, 19, 31–44. [Google Scholar] [CrossRef] [Green Version]
- Olaniyi, E.O.; Gerber, P.; Prause, G. Strategic Energy Partnership in Shipping. In International Conference on Reliability and Statistics in Transportation and Communication; Springer: Cham, Switzerland, 2017; pp. 102–111. [Google Scholar]
- Singh, D.V.; Pedersen, E. A review of waste heat recovery technologies for maritime applications. Energy Convers. Manag. 2016, 111, 315–328. [Google Scholar] [CrossRef]
- MAN. Waste Heat Recovery System (WHRS) for Reduction of Fuel Consumption, Emissions, and EEDI; MAN Diesel & Turbo: Augsburg, Germany, 2014; Available online: https://mandieselturbo.com/docs/librariesprovider6/technical-papers/waste-heat-recovery-system.pdf (accessed on 14 April 2020).
- GloMEEP. Waste Heat Recovery Systems, Global Maritime Energy Efficiency Partnerships; International Maritime Organisation (IMO): London, UK, 2020; Available online: https://glomeep.imo.org/technology/waste-heat-recovery-systems/ (accessed on 27 March 2020).
- Hon, G.; Wang, H. The Energy Efficiency Design Index (EEDI) for New Ships; The International Council on Clean Transportation (ICCT): Washington, DC, USA, 2011; Policy Update 15; Available online: https://theicct.org/publications/energy-efficiency-design-index-eedi-new-ships (accessed on 15 April 2020).
- Prause, G.; Olaniyi, E.O. A compliance cost analysis of the SECA regulation in the Baltic Sea. Entrep. Sustain. Issues 2019, 6, 1907–1921. [Google Scholar] [CrossRef] [Green Version]
- MAN (2018). Basic Principles of Ship Propulsion; MAN Diesel & Turbo: Augsburg, Germany, 2018; Available online: https://marine.man-es.com/propeller-aft-ship/basic-principles-of-propulsion (accessed on 15 April 2020).
- Shu, G.; Liang, Y.; Wei, H.; Tian, H.; Zhao, J.; Liu, L. A review of waste heat recovery on a two-stroke IC engine aboard ships. Renew. Sustain. Energy Rev. 2013, 19, 385–401. [Google Scholar] [CrossRef]
- Jalkanen, J.P.; Johansson, L.; Kukkonen, J.; Brink, A.; Kalli, J.; Stipa, T. Extension of an assessment model of ship traffic exhaust emissions for particulate matter and carbon monoxide. Atmos. Chem. Phys. 2012, 12, 2641–2659. [Google Scholar] [CrossRef] [Green Version]
- Baldi, F.; Gabrielii, C. A feasibility analysis of waste heat recovery systems for marine applications. Energy 2015, 80, 654–665. [Google Scholar] [CrossRef] [Green Version]
- Chiesa, V.; Fratini, F. Evaluation and Performance Measurement of Research and Development: Techniques and Perspectives for Multi-Level Analysis; Edward Elgar: Cheltenham, UK, 2009. [Google Scholar]
- Brealey, R.A.; Myers, S.C.; Allen, F.; Pitabas, M. Principles of Corporate Finance; Tata McGraw-Hill Education: New York, NY, USA, 2012. [Google Scholar]
- Ryan, P.A.; Ryan, G.P. Capital budgeting practices of the Fortune 1000: How have things changed. J. Bus. Manag. 2002, 8, 355–364. [Google Scholar]
- Black, F.; Scholes, M. The pricing of options and corporate liabilities. J. Political Econ. 1973, 81, 637–654. [Google Scholar] [CrossRef] [Green Version]
- Atari, S.; Prause, G. Risk assessment of emission abatement technologies for clean shipping. In International Conference on Reliability and Statistics in Transportation and Communication; Springer: Cham, Switzerland, 2017; pp. 93–101. [Google Scholar]
- Daccord, R. Cost to benefit ratio of an exhaust heat recovery system on a long haul truck. Energy Procedia 2017, 129, 740–745. [Google Scholar] [CrossRef]
- Kristiansen, N.R.; Snyder, G.J.; Nielsen, H.K.; Rosendahl, L. Waste Heat Recovery from a Marine Waste Incinerator Using a Thermoelectric Generator. J. Electron. Mater. 2012, 41, 1024–1029. [Google Scholar] [CrossRef] [Green Version]
- Downes, J.; Goodman, J.E. Dictionary of Finance and Investment Terms, 5th ed.; Barron’s Educational Series: Hauppauge, NY, USA, 1998; p. 153. [Google Scholar]
- Ye, S.D.; Tiong, R.L.K. NPV-at-risk method in infrastructure project investment evaluation. J. Clin. Endocrinol. Metab. 2000, 126, 227–233. [Google Scholar] [CrossRef]
- Peterson, P.; Fabozzi, F. Capital Budgeting: Theory and Practice; Wiley: Hoboken, NJ, USA, 2008; ISBN 978-0471218333. [Google Scholar]
- Myers, S.C.; Majluf, N.S. Corporate financing and investment decisions when firms have information that investors do not have. J. Financ. Econ. 1984, 13, 187–221. [Google Scholar] [CrossRef] [Green Version]
- Alexandersson, A.; Flodström, E.; Staalberg, P. Exhaust Gas Emissions from Sea Transportation; TFB Rapport; Transportforksningsberedningen: Stockholm, Sweden, 1993; ISSN 0282-8014. [Google Scholar]
- Flodström, E. Energy and Emission Factors for Ships in Operation; KFB Report 1997:24; The Swedish Transport and Communications Research Board: Stockholm, Sweden, 1997; ISBN 91-88868-46-X. [Google Scholar]
- WinGD. Engine Selection for very Large Container Vessels; Winterthur Gas & Diesel Ltd.: Winterthur, Switzerland, 2016. [Google Scholar]
- Borkowski, T.; Tallinn University of Technology, Tallinn, Estonia. Data in Ship Energy Efficiency—Policy and Development of Technology Measures, International CSHIPP Workshop “Clean Shipping Financing—Challenges and Best Practices”. Personal communication, 2019. [Google Scholar]
- Milne, A.; Whalley, A.E. Time to build, option value and investment decisions: A comment. J. Financ. Econ. 2000, 56, 325–332. [Google Scholar] [CrossRef]
- Di Lorenzo, G.; Pilidis, P.; Witton, J.; Probert, D. Monte-Carlo simulation of investment integrity and value for power-plants with carbon-capture. Appl. Energy 2012, 98, 467–478. [Google Scholar] [CrossRef]
- Acciaro, M. A real options application to investment in low-sulphur maritime transport. Int. J. Shipp. Transp. Logist. 2014, 6, 189–212. [Google Scholar] [CrossRef]
- Hull, C.J. Options, Futures and Other Derivatives, 6th ed.; Pearson Prentice Hall: Upper Saddle River, NJ, USA, 2006; pp. 37–99. [Google Scholar]
- Cherry, H. Financial Economics, 1st ed.; Actuarial Study Materials: Merrick, NY, USA, 2007. [Google Scholar]
- Mkouar, F.; Prigent, J.L. Long-Term Investment with Stochastic Interest and Inflation Rates Incompleteness and Compensating Variation; IPAG Business School working paper series; Elsevier: Paris, France, 2014; No. 2014-301. [Google Scholar]
- Glasserman, P. Monte Carlo Methods in Financial Engineering; Springer Science & Business Media: Berlin, Germany, 2013; Volume 53. [Google Scholar]
- Ren, H.; Ding, Y.; Sui, C. Influence of EEDI (Energy Efficiency Design Index) on Ship–Engine–Propeller Matching. J. Mar. Sci. Eng. 2019, 7, 425. [Google Scholar] [CrossRef] [Green Version]
Figure 1.
Energy equilibriums using the WHRS. Source: MAN [7].
Figure 1.
Energy equilibriums using the WHRS. Source: MAN [7].

Figure 2.
Investment evaluation of WHRS of the study.

Figure 3.
The construction principle of a WHRS. Source: MAN 2014.

Figure 4.
Net present value of WHRS investments on three vessels.


Table 1.
Engine Load Inventory.
| % of Main Engine Load | % of Operation Time | |
|---|---|---|
| At Sea | 80 | 100 |
| In Port | 20 | 5 |
| Maneuvering | 20 | 100 |
Table 2.
Annual distribution of engine load.
| Operating Profile | Days | |||
|---|---|---|---|---|
| Annual operating time: | 6480.00 | h | 74.0% | 270.0 |
| Annual port time: | 2280.00 | h | 26.0% | 95.0 |
| 8760.00 | h | 365.0 | ||
| Main engine load: | % time | hours | Weighted average main engine load above 50%: | |
| 100% | 2% | 129.60 | ||
| 90% | 6% | 388.80 | ||
| 85% | 6% | 388.80 | 59.0% | |
| 80% | 20% | 1296.00 | ||
| 75% | 12% | 777.60 | ||
| 70% | 15% | 972.00 | ||
| 60% | 10% | 648.00 | ||
| 50% | 10% | 648.00 | ||
| below 50% | 19% | 1231.20 | ||
| 100% | 6480.00 |
Table 3.
Capital budgeting vs. real option. Some works recognize the potential of real options approaches for the maritime industry.
Table 3.
Capital budgeting vs. real option. Some works recognize the potential of real options approaches for the maritime industry.
| Traditional Capital Budgeting | Real Option Analysis | |
|---|---|---|
| PROS |
|
|
| CONS |
|
|
Table 4.
Input Parameter for the Ferries Capital Budgeting.
| Data | Value | Definition/Sources |
|---|---|---|
| CapEx | 9.1 million € | Price of an ST-PT WHRS in Euro |
| Lifetime | 20 years | The lifetime of WHRS in years |
| Fuel price | 450 € | Current MGO/MDO price per ton |
| Discount rate | 2.50% | Proxy for 10 year log-term loans |
| Energy-saving rate | 10% | The average energy recovery rate for an ST-PT WHRS |
Table 5.
Capital Budgeting for Tallinn—Helsinki and Travemünde– Helsinki Ferries.
| Parameters | Tallinn—Helsinki Value | Travemünde—Helsinki Value |
|---|---|---|
| Operating time | 4200 h | 5220 h |
| OpEx | 258 t€ | 310 t€ |
| Fuel savings | 861 t€ | 1.24 mill t€ |
| NPV20y. | 0.3 million € | 5.4 mill € |
| Payback Period | 19.2 years | 11.3 years |
| IRR | 2.8% | 8.1% |
Table 6.
Economics Parameters for ROA.
| Input Data | Value | Description | |
|---|---|---|---|
| NPV20y S | 0.3|5.4|8.4 | Million € | Net present value (NPV) over the WHRS lifespan (20 years) |
| Volatility | 20% | Annual | The standard deviation of fuel prices |
| The risk-free rate of return | 2.5% | Annual | Interest rate for a long-term loan |
| Time to maturity | 20 | Years | Duration |
| Time period | 1 | Year | Analysis period |
| Investment cost | 9.1 | Million € | Strike price |
Table 7.
ROA for a 20-year horizon value.
| Helsinki—Tallinn ferry | Value |
| d1 | −2.81 |
| d2 | −3,70 |
| Value of the call option: C | 0.16 million € |
| Travemünde—Helsinki ferry | Value |
| d1 | 0.42 |
| d2 | −0.47 |
| Value of the call option: C | 1.83 million € |
| Container Vessel | Value |
| d1 | 0.92 |
| d2 | 0.02 |
| Value of the call option: C | 4.08 million € |
Table 8.
First Year Real-Option Data for the three Cases.
| Input Data | Value | Description | |
|---|---|---|---|
| The present value of future cash flows | 0.6|0.9|1.1 | Million € | Annual OpEx cost saving |
| Volatility | 20% | Annual | Standard deviation of fuel prices |
| The risk-free rate of return | 2.5% | Annual | Interest rate for a long-term loan |
| Time to maturity | 20 | Years | Duration |
| Time period | 1 | Year | Analysis period |
| Investment cost | 9.1 | Million € | Strike price |
Table 9.
ROA Values for a Deferral Call Option.
| Helsinki—Tallinn ferry | Value |
| d1 | −2.03 |
| d2 | −2.93 |
| Value of the call option: C | 3.18 million € |
| Lübeck—Helsinki ferry | Value |
| d1 | −1.58 |
| d2 | −2.47 |
| Value of the call option: C | 14.52 million € |
| Container Vessel | Value |
| d1 | −1.36 |
| d2 | −2.25 |
| Value of the call option: C | 28.91 million € |
Publisher’s Note: MDPI stays neutral with regard to jurisdictional claims in published maps and institutional affiliations. |
© 2020 by the authors. Licensee MDPI, Basel, Switzerland. This article is an open access article distributed under the terms and conditions of the Creative Commons Attribution (CC BY) license (http://creativecommons.org/licenses/by/4.0/).
Share and Cite
MDPI and ACS Style
Olaniyi, E.O.; Prause, G. Investment Analysis of Waste Heat Recovery System Installations on Ships’ Engines. J. Mar. Sci. Eng. 2020, 8, 811. https://doi.org/10.3390/jmse8100811
AMA Style
Olaniyi EO, Prause G. Investment Analysis of Waste Heat Recovery System Installations on Ships’ Engines. Journal of Marine Science and Engineering. 2020; 8(10):811. https://doi.org/10.3390/jmse8100811
Chicago/Turabian StyleOlaniyi, Eunice O., and Gunnar Prause. 2020. "Investment Analysis of Waste Heat Recovery System Installations on Ships’ Engines" Journal of Marine Science and Engineering 8, no. 10: 811. https://doi.org/10.3390/jmse8100811
Note that from the first issue of 2016, this journal uses article numbers instead of page numbers. See further details here.