Coastal Boulders on the SE Coasts of Cyprus as Evidence of Palaeo-Tsunami Events

 ,
, 
 , and
, and 
Abstract
:1. Introduction
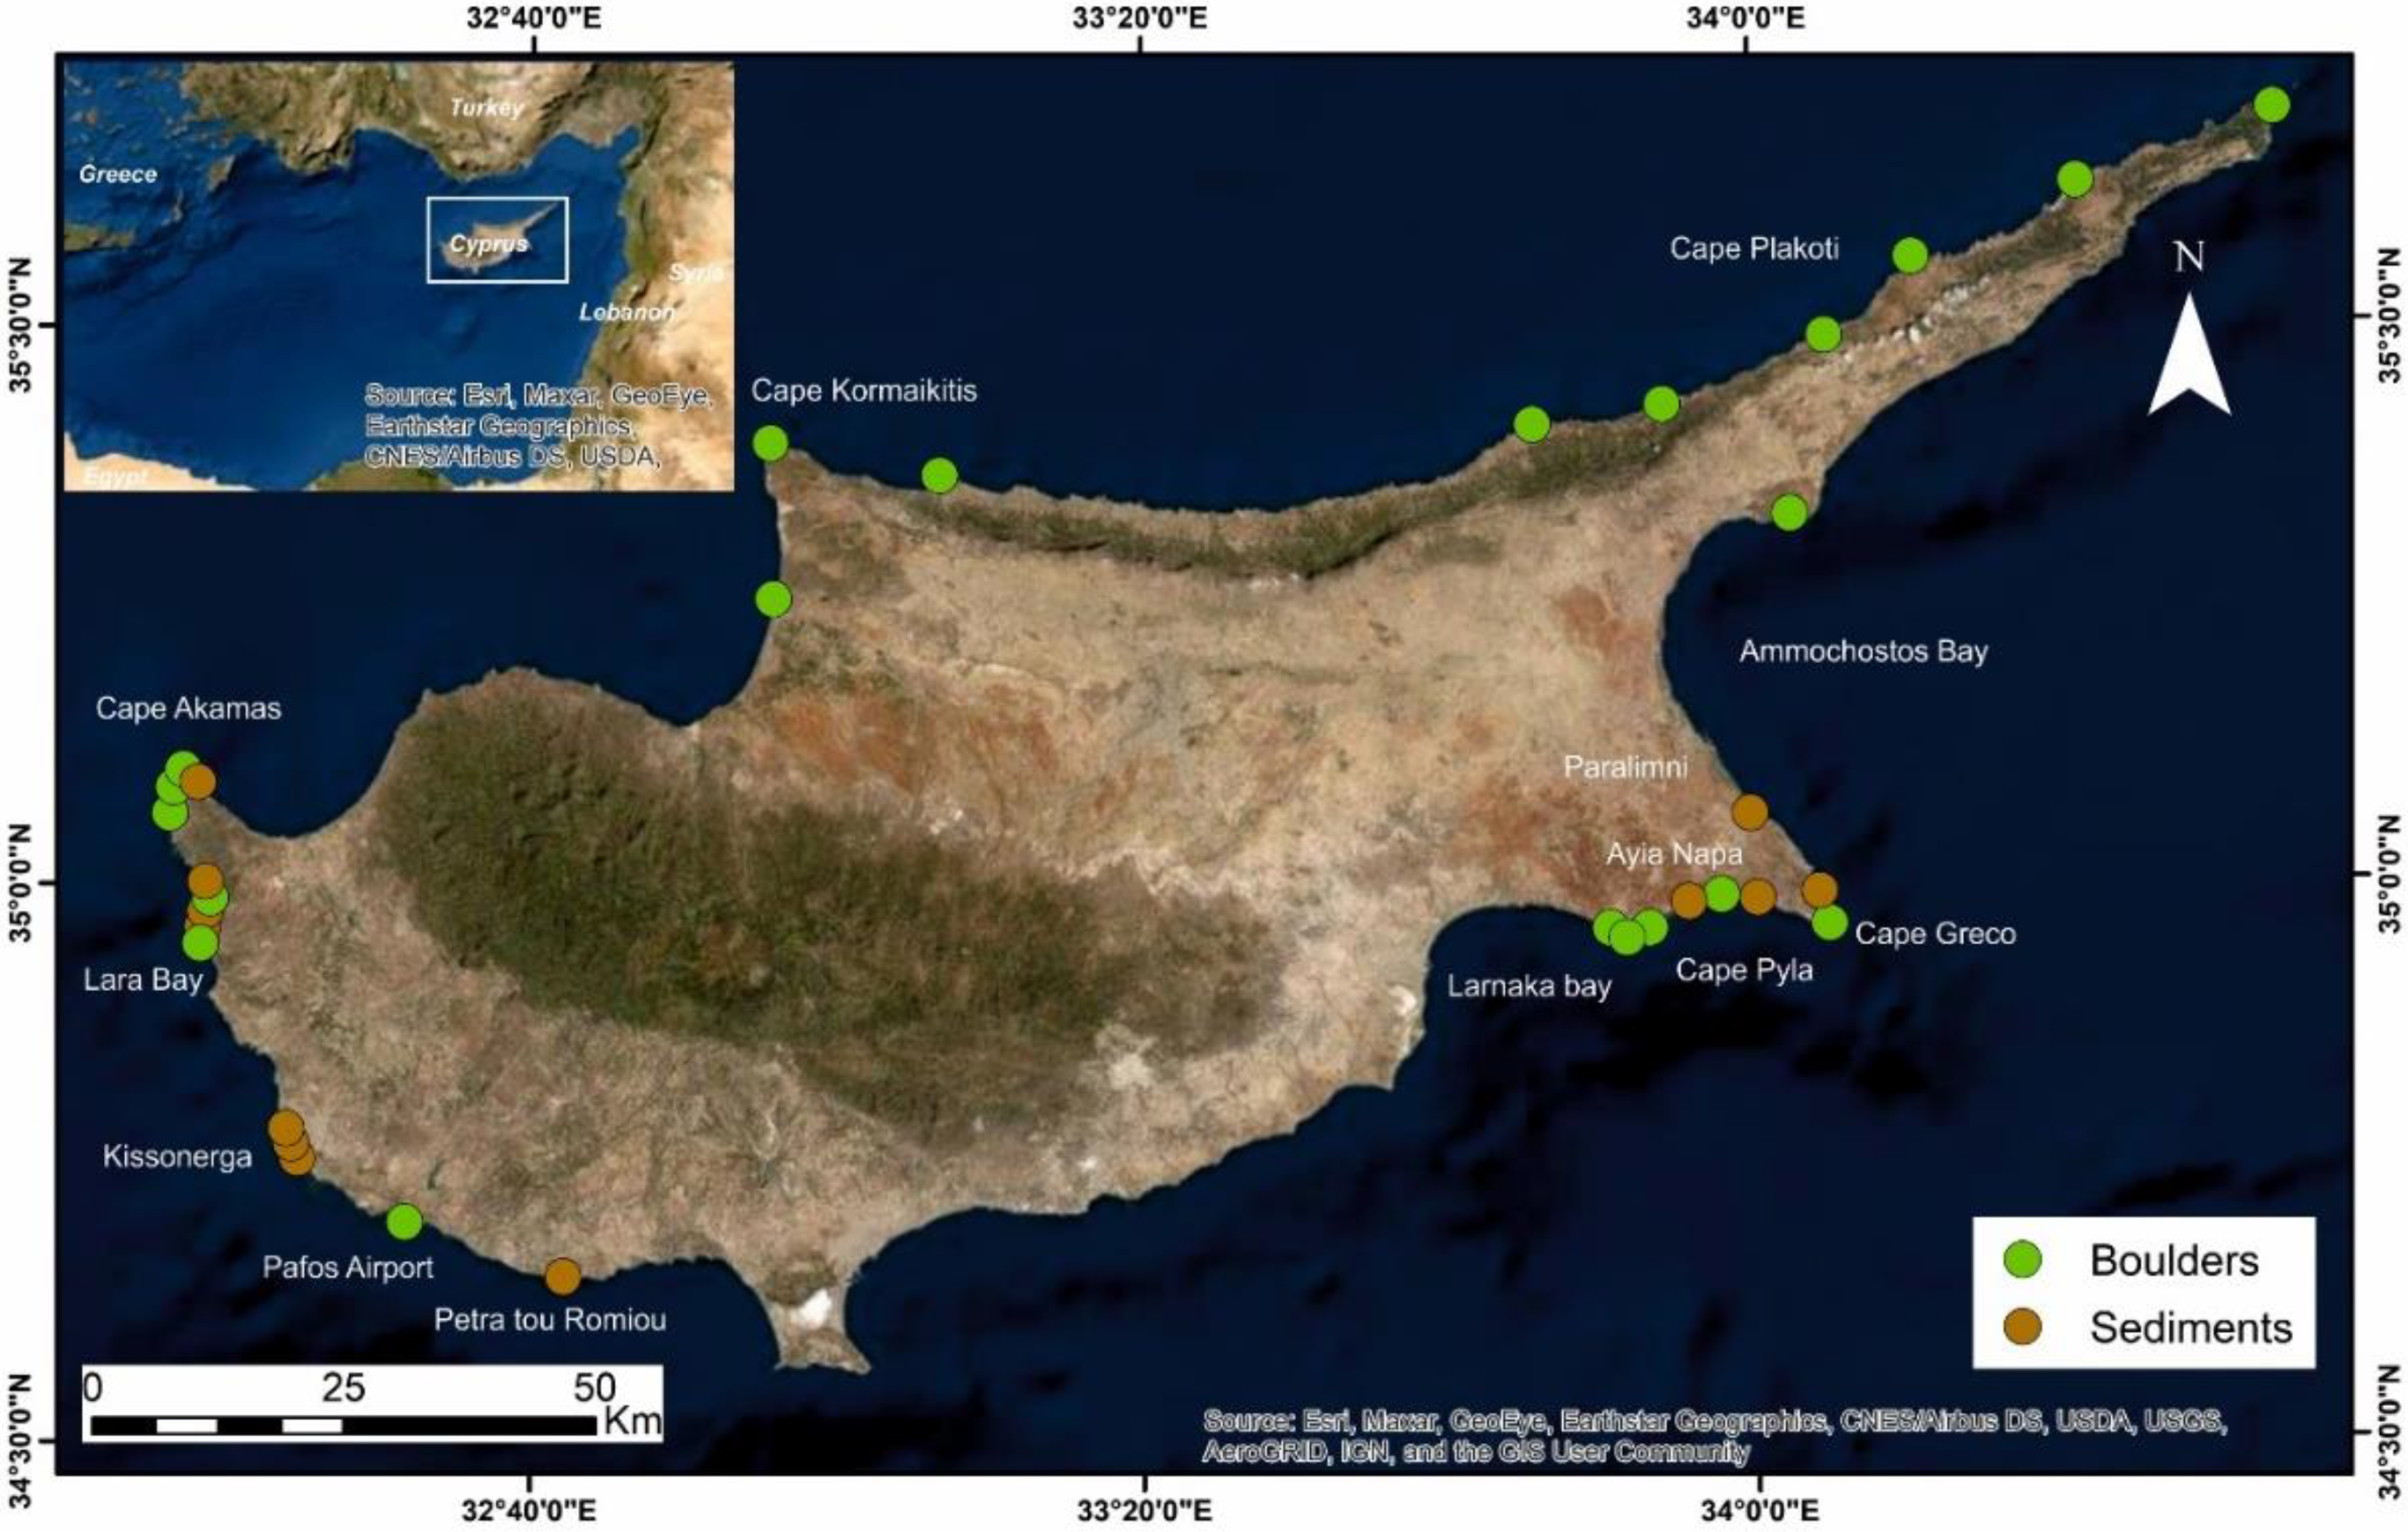
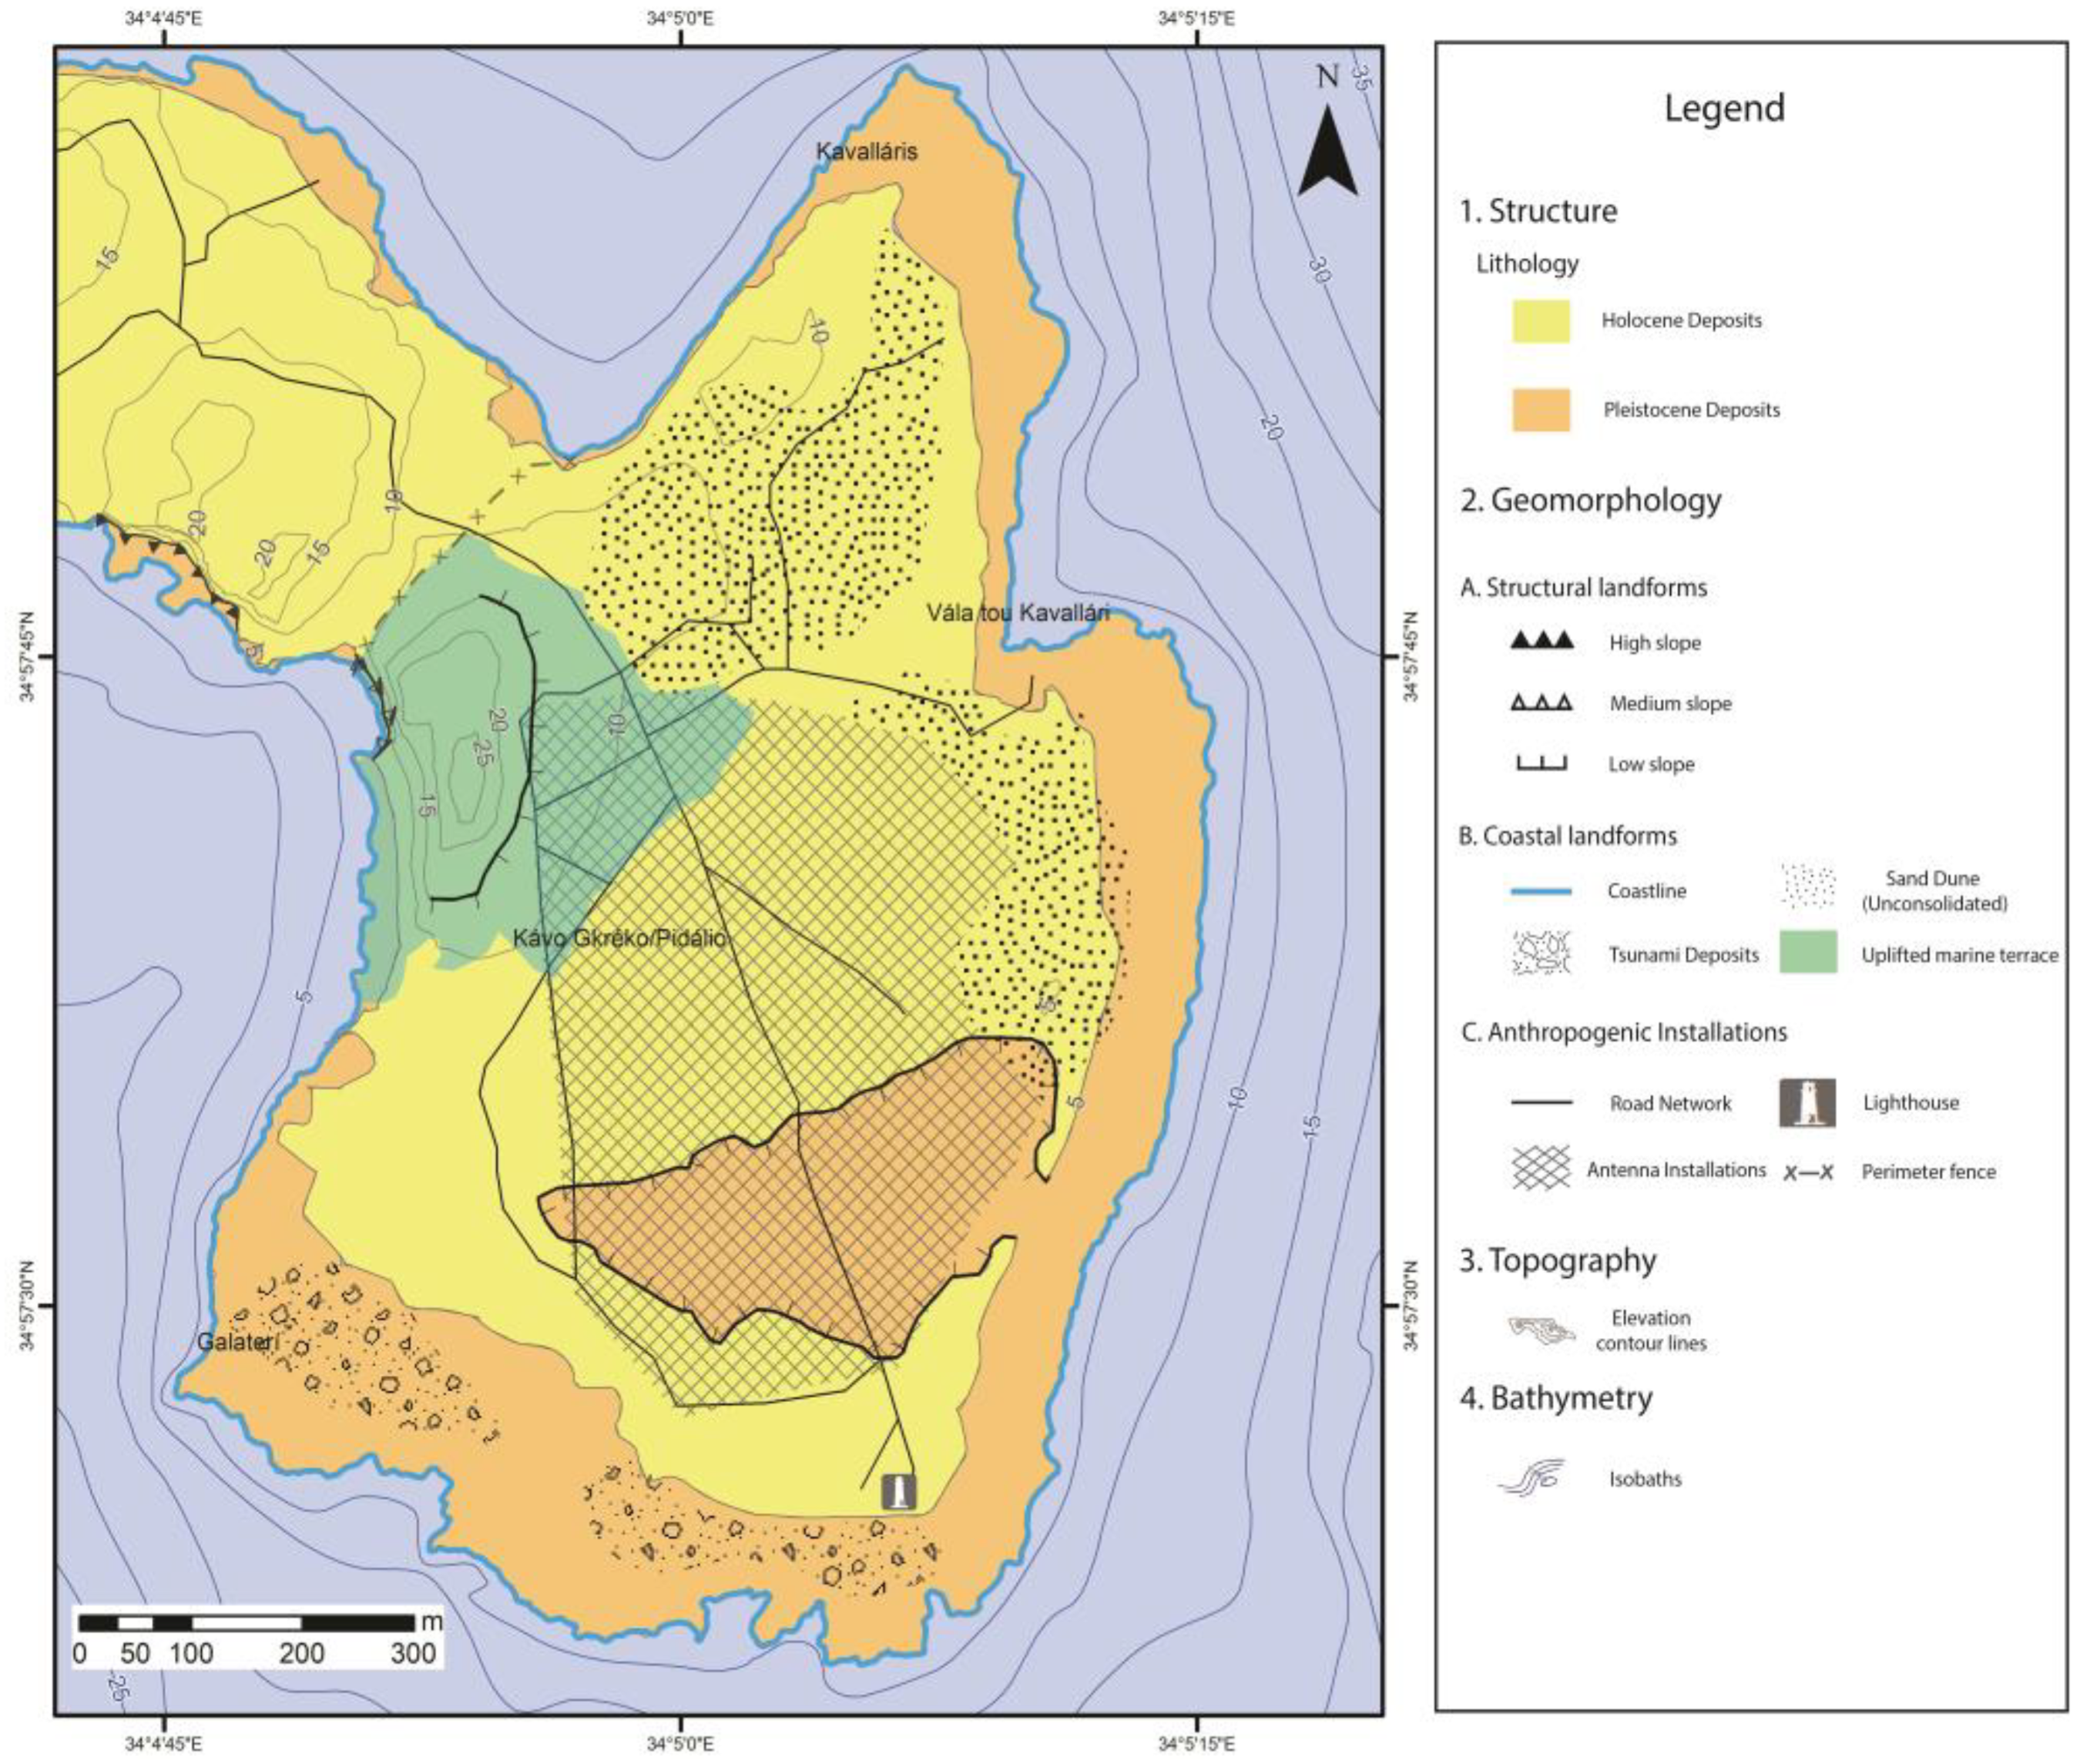
2. Study Area
2.1. Geological Setting
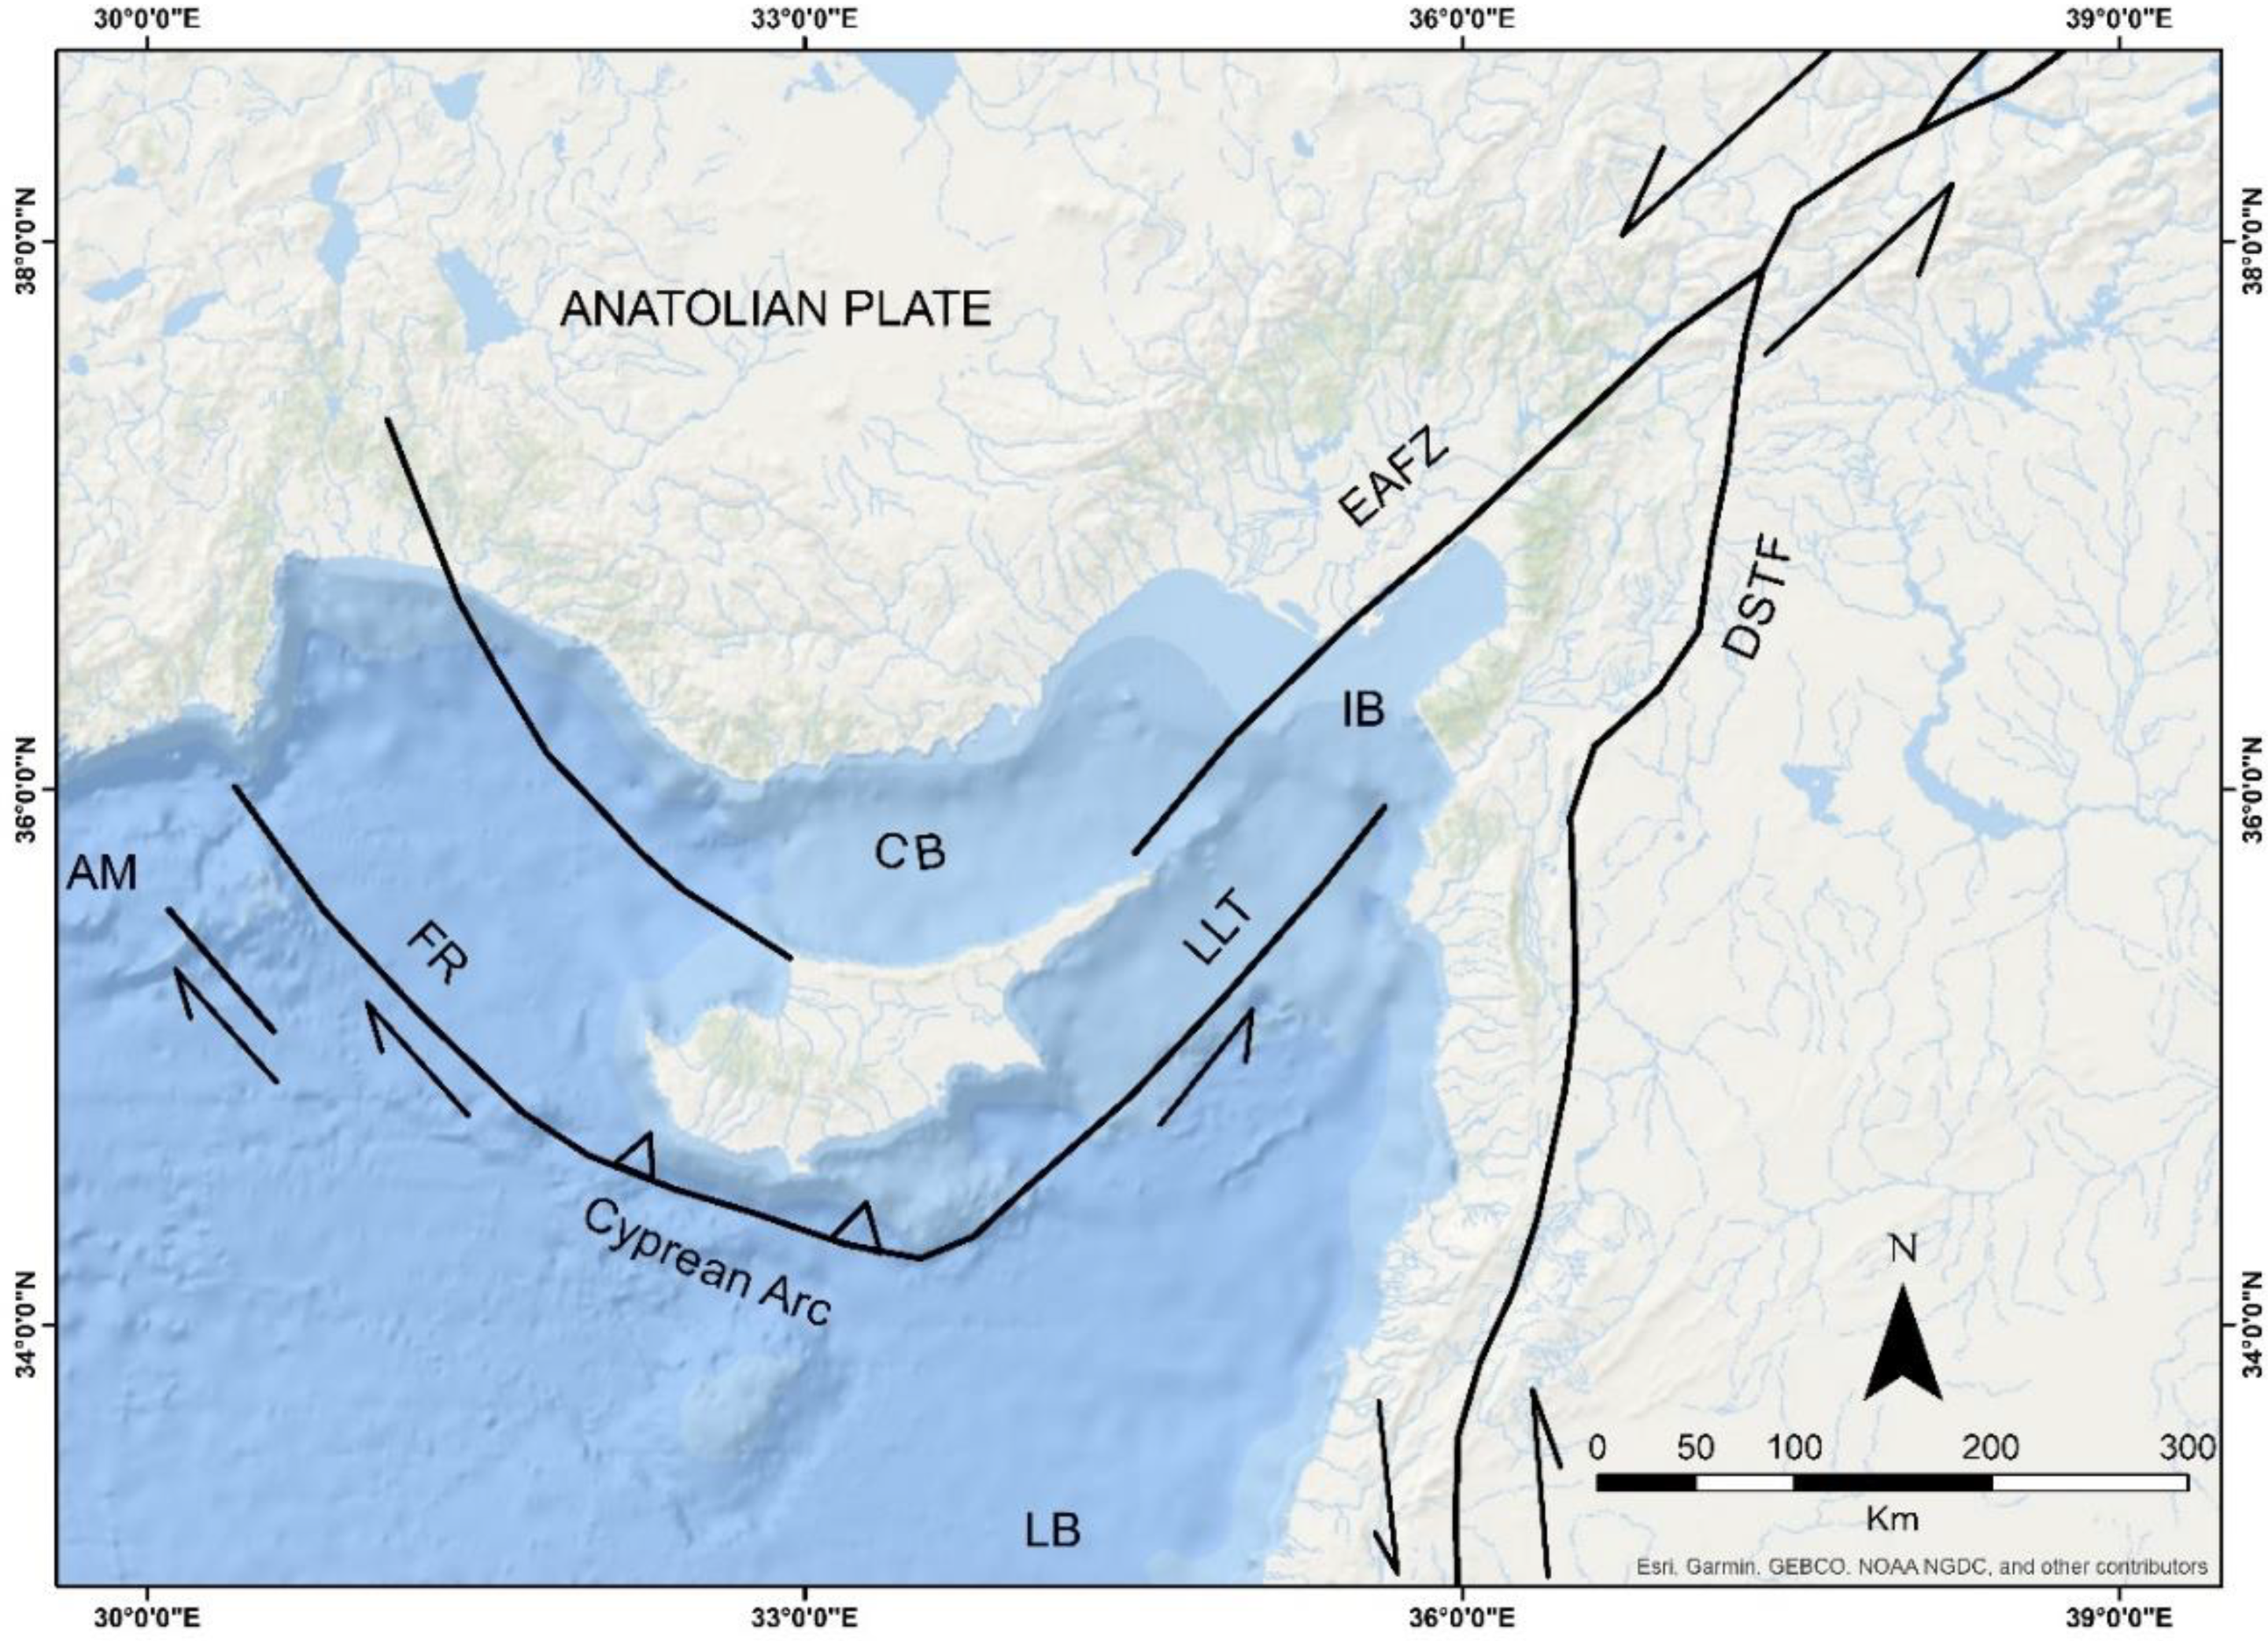
2.2. Seismicity
2.3. Significant Wave Height
3. Materials and Methods
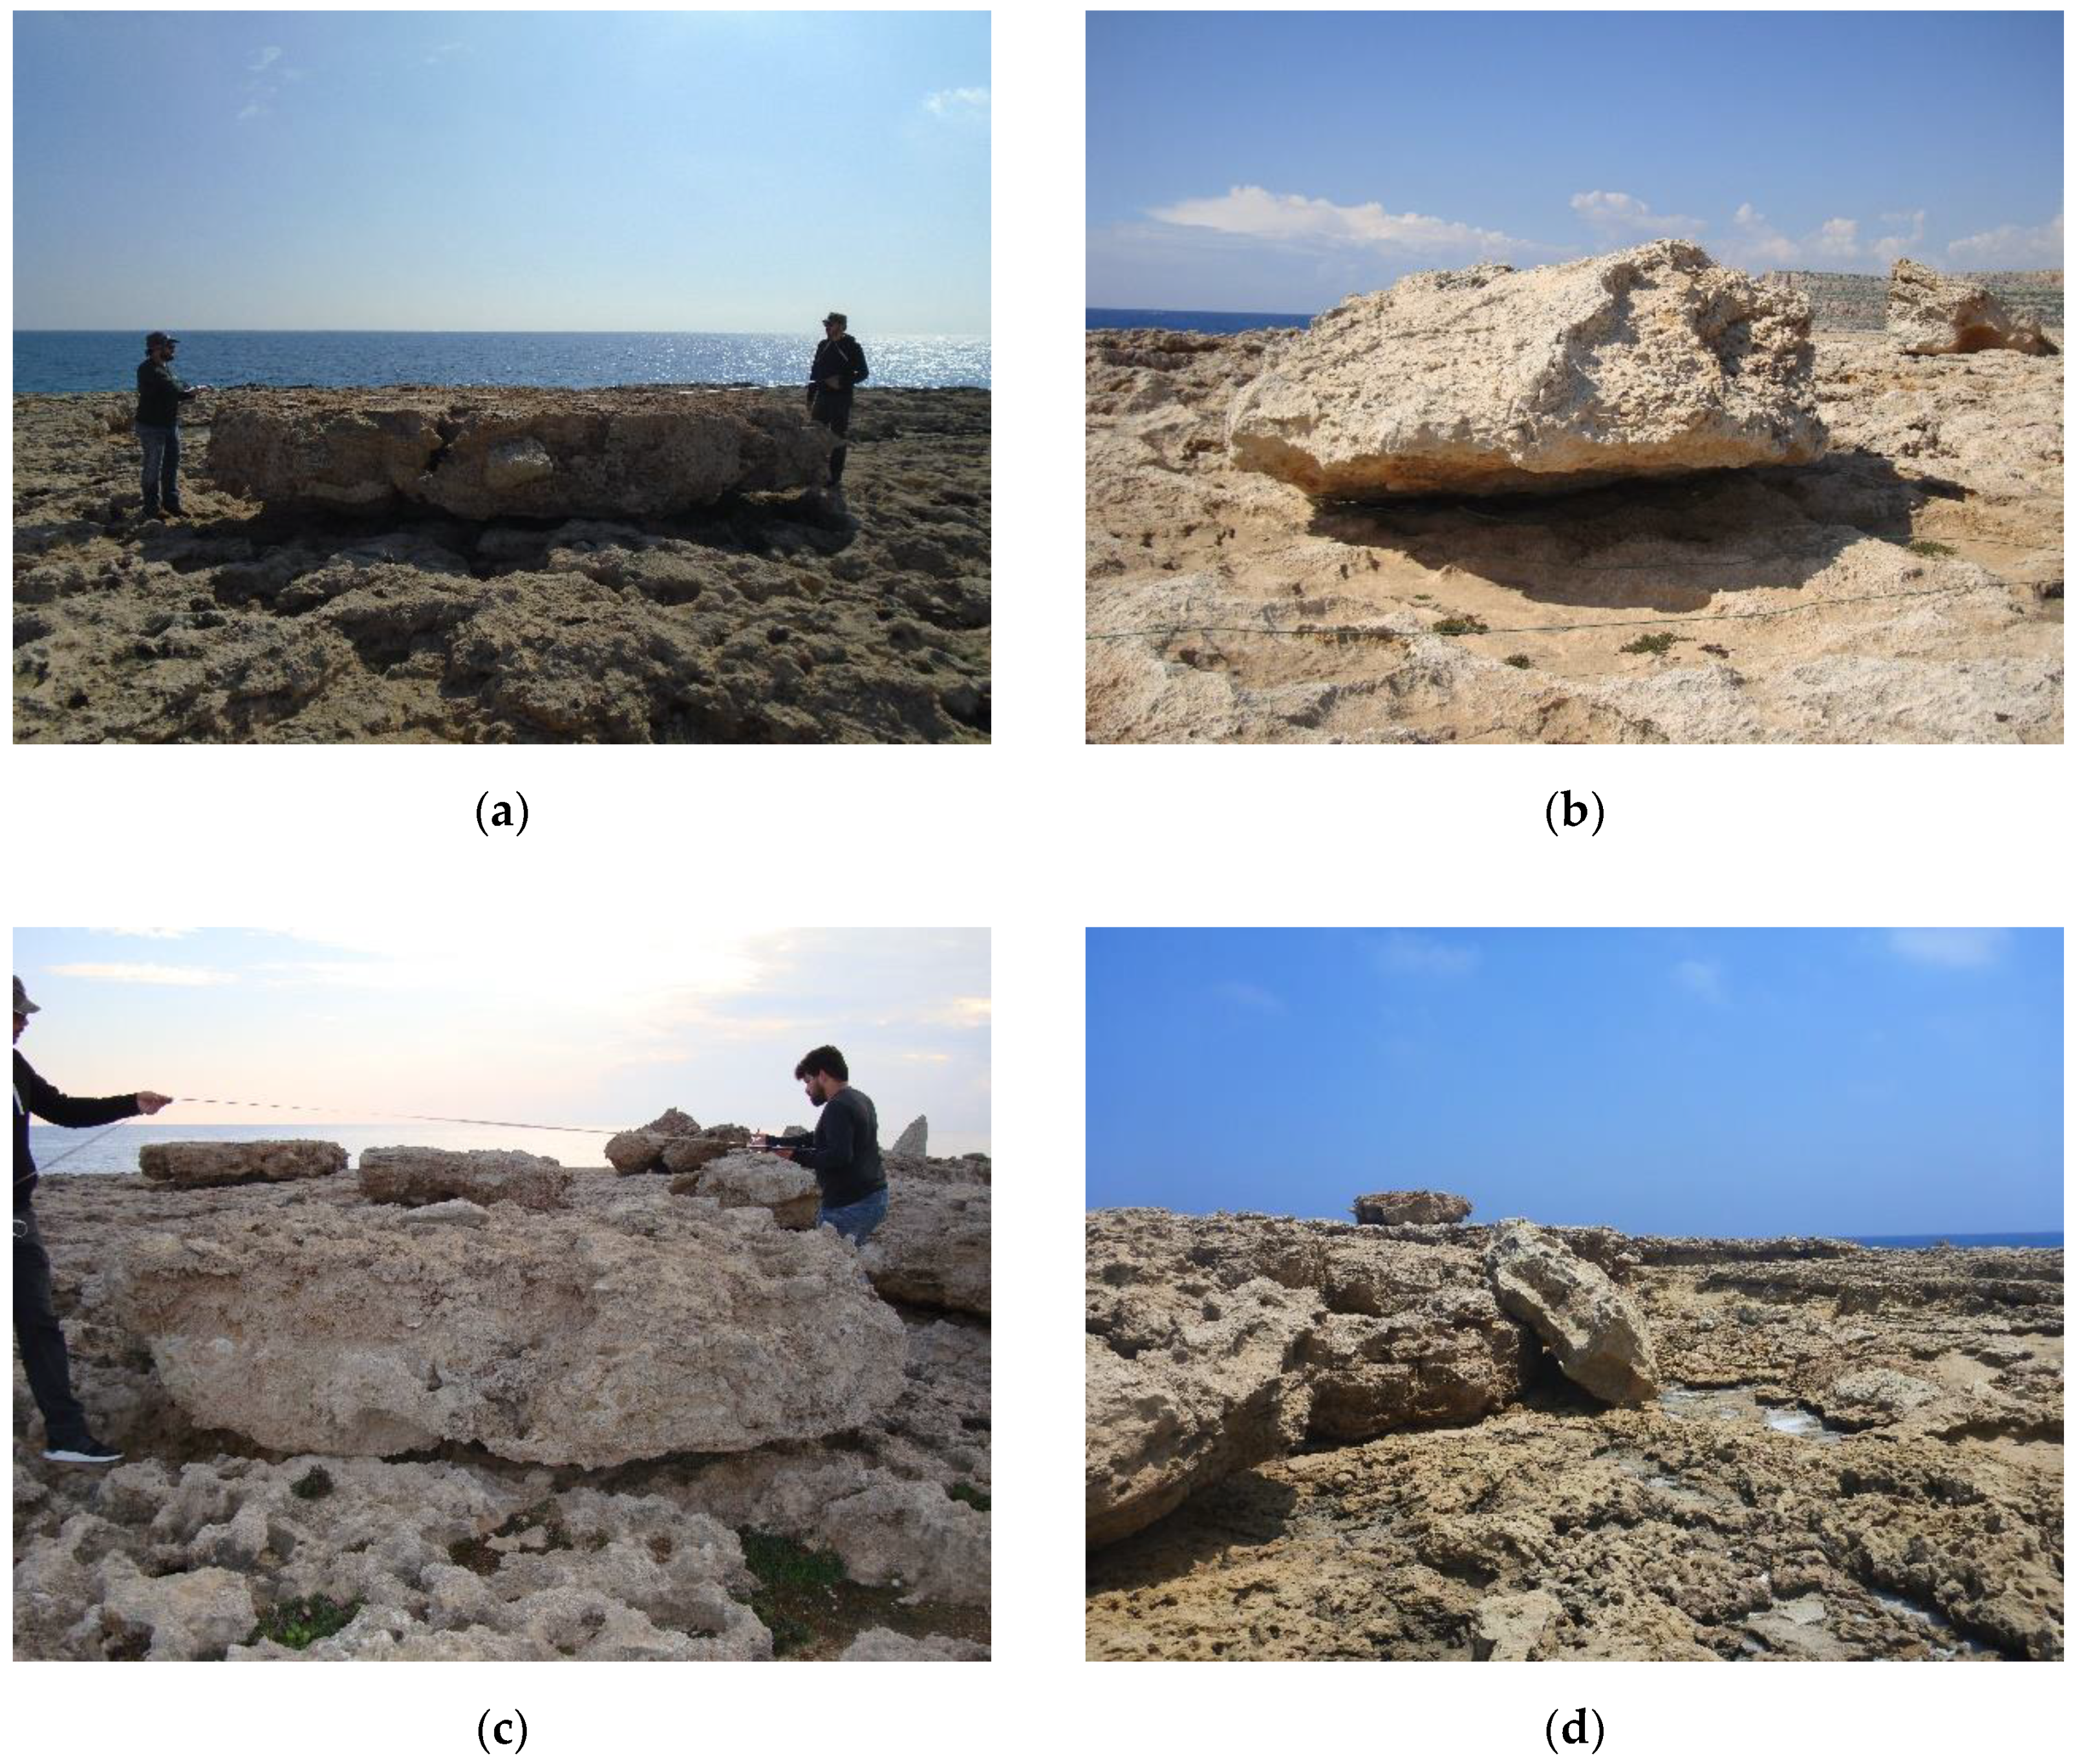
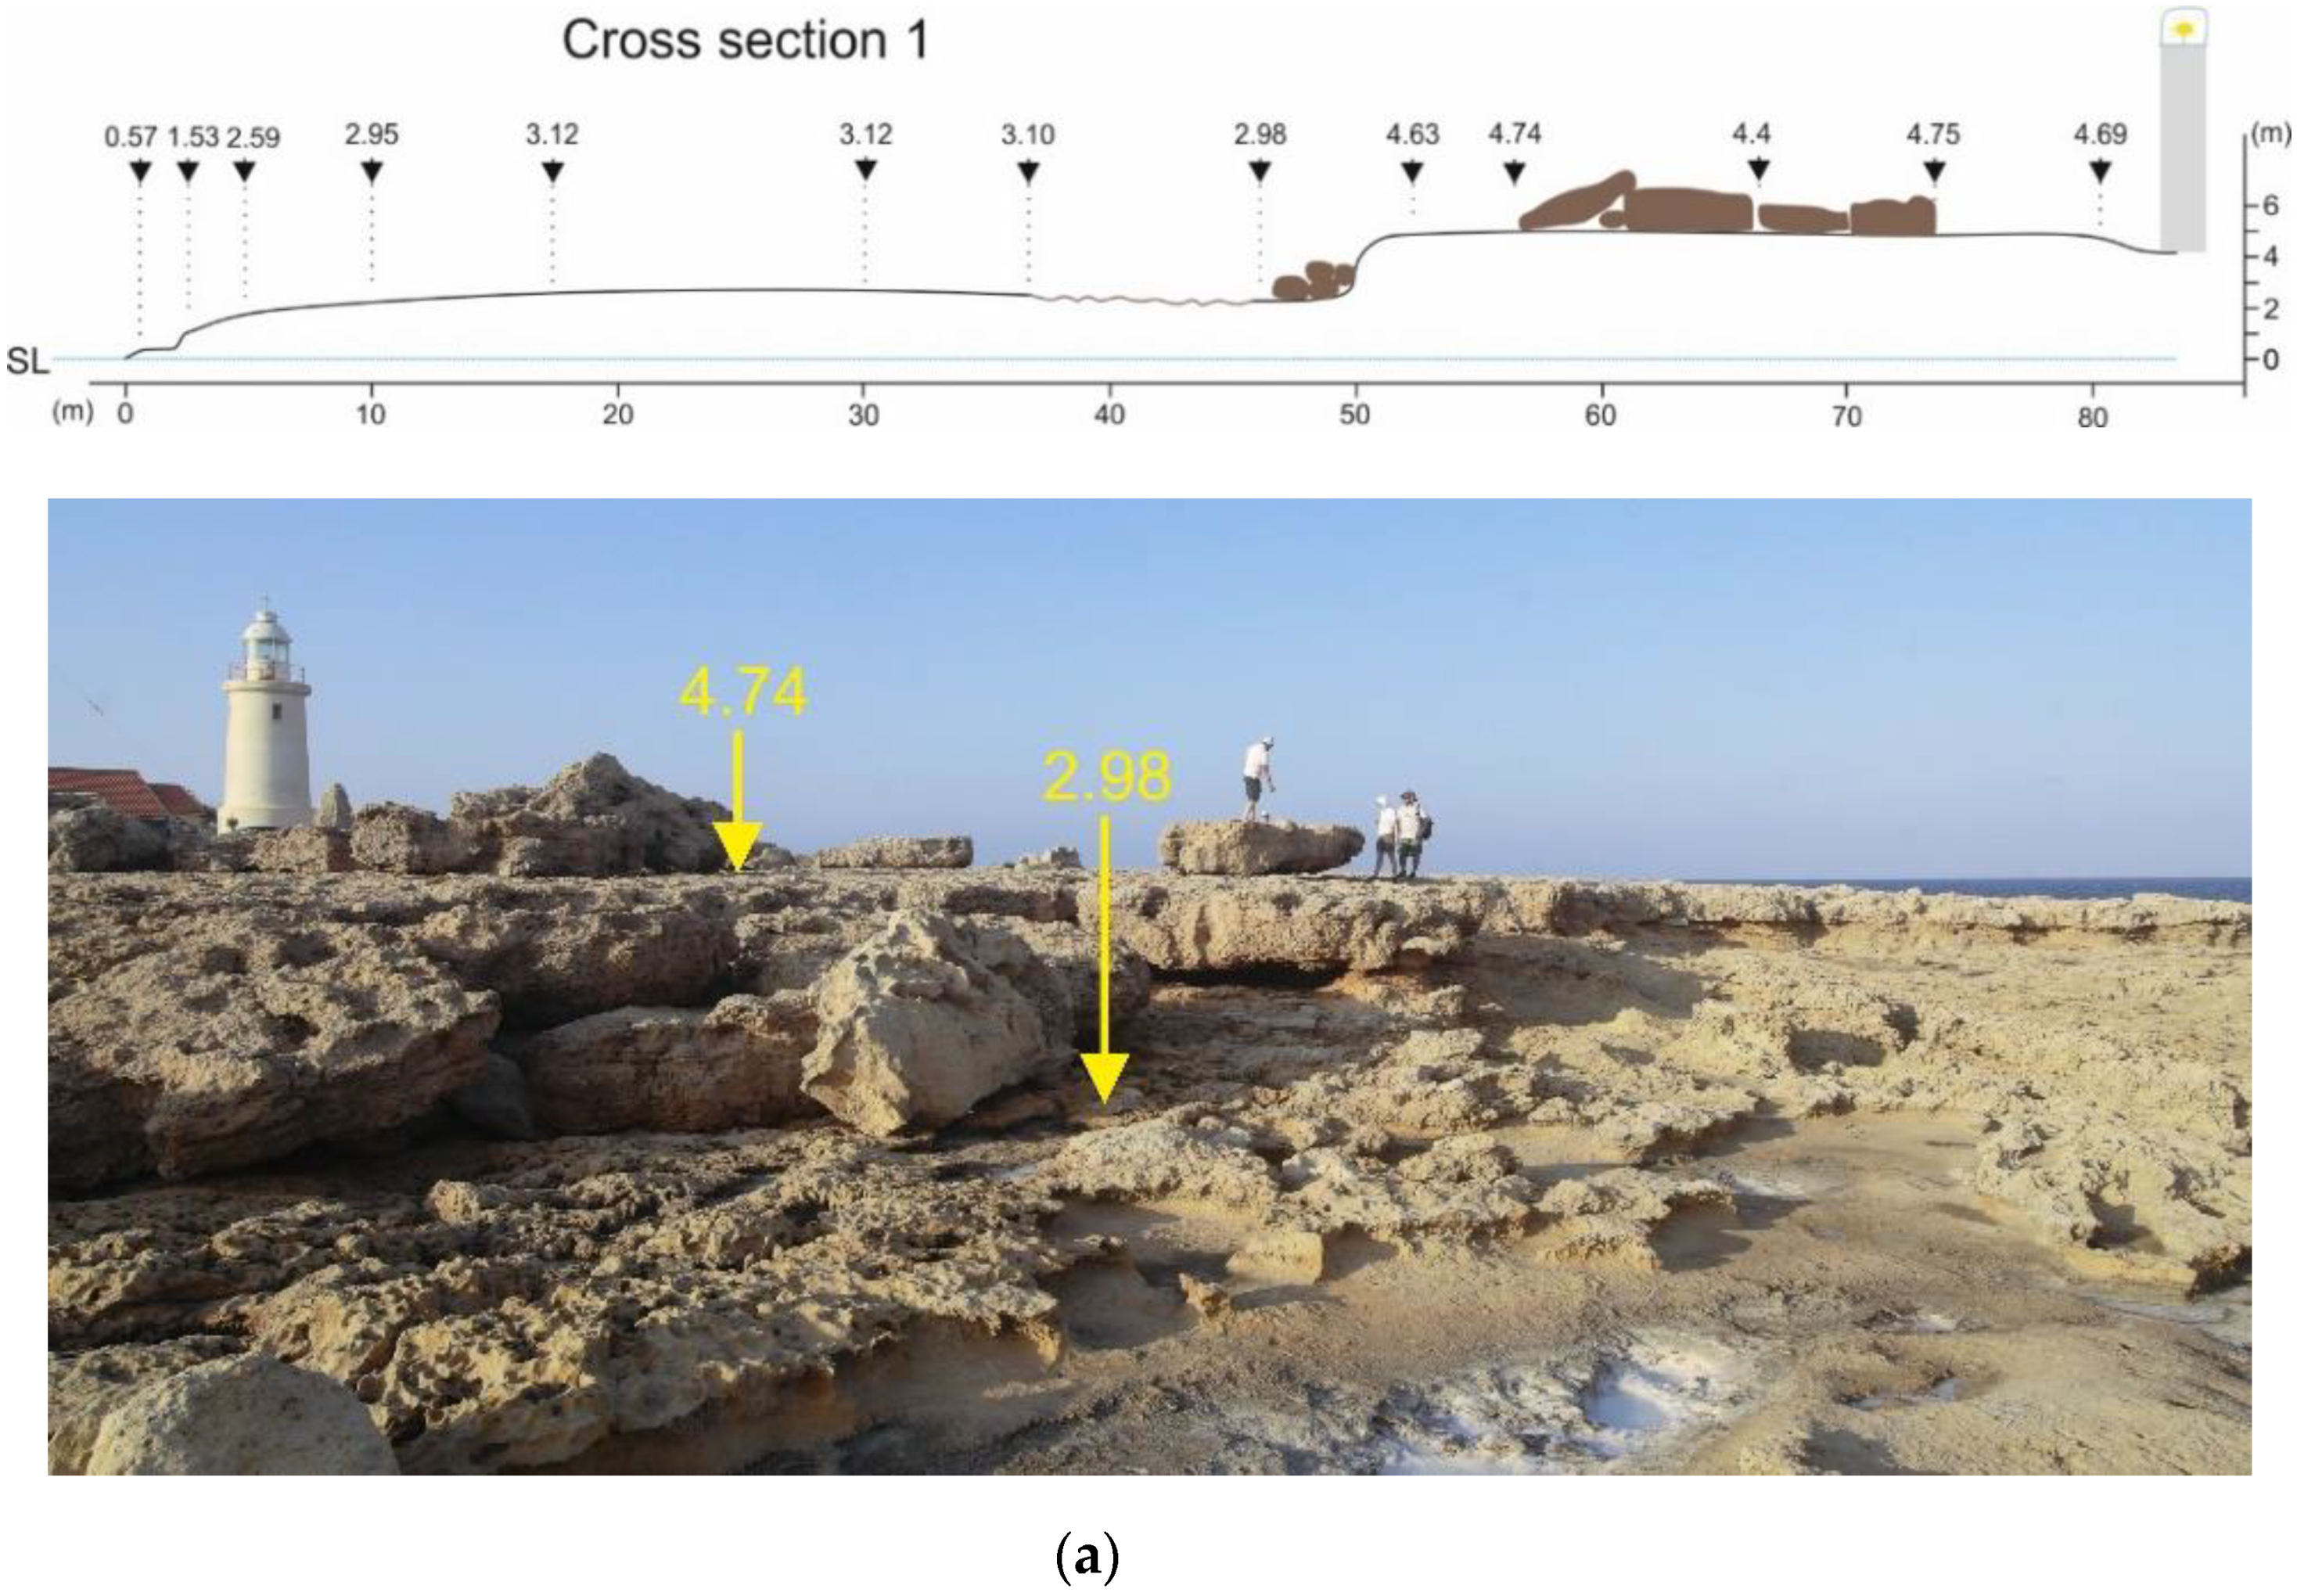
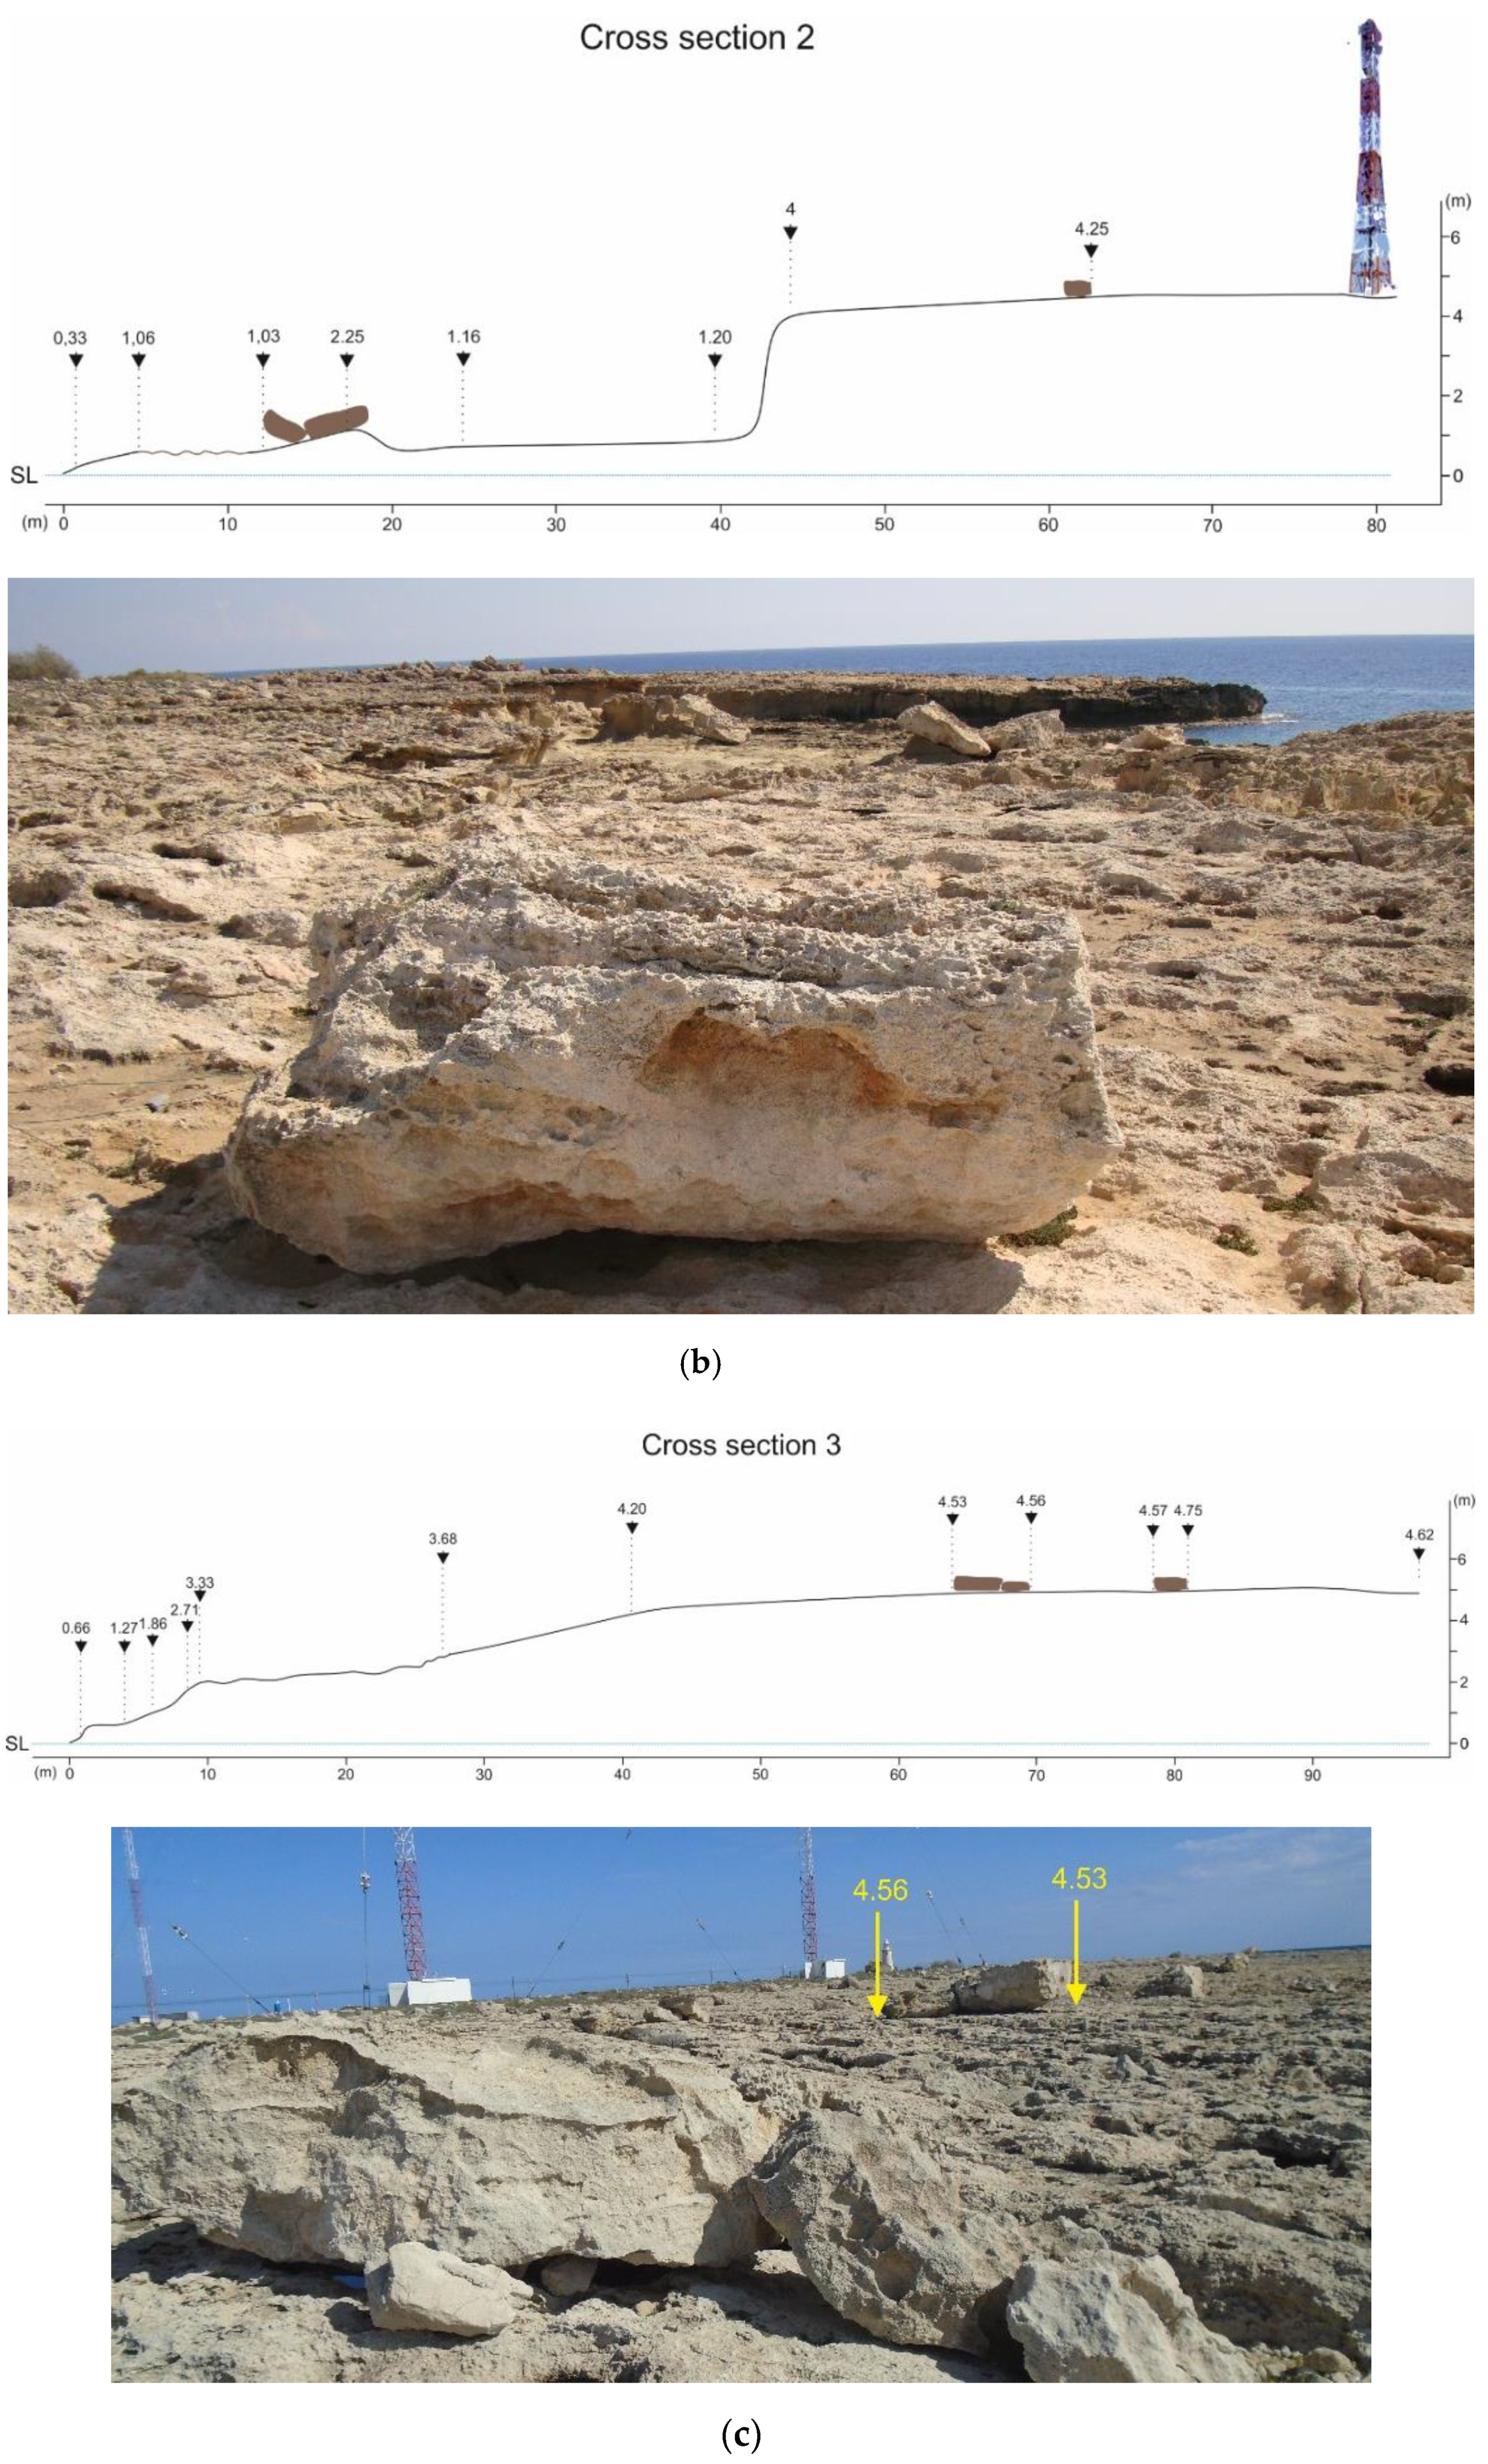
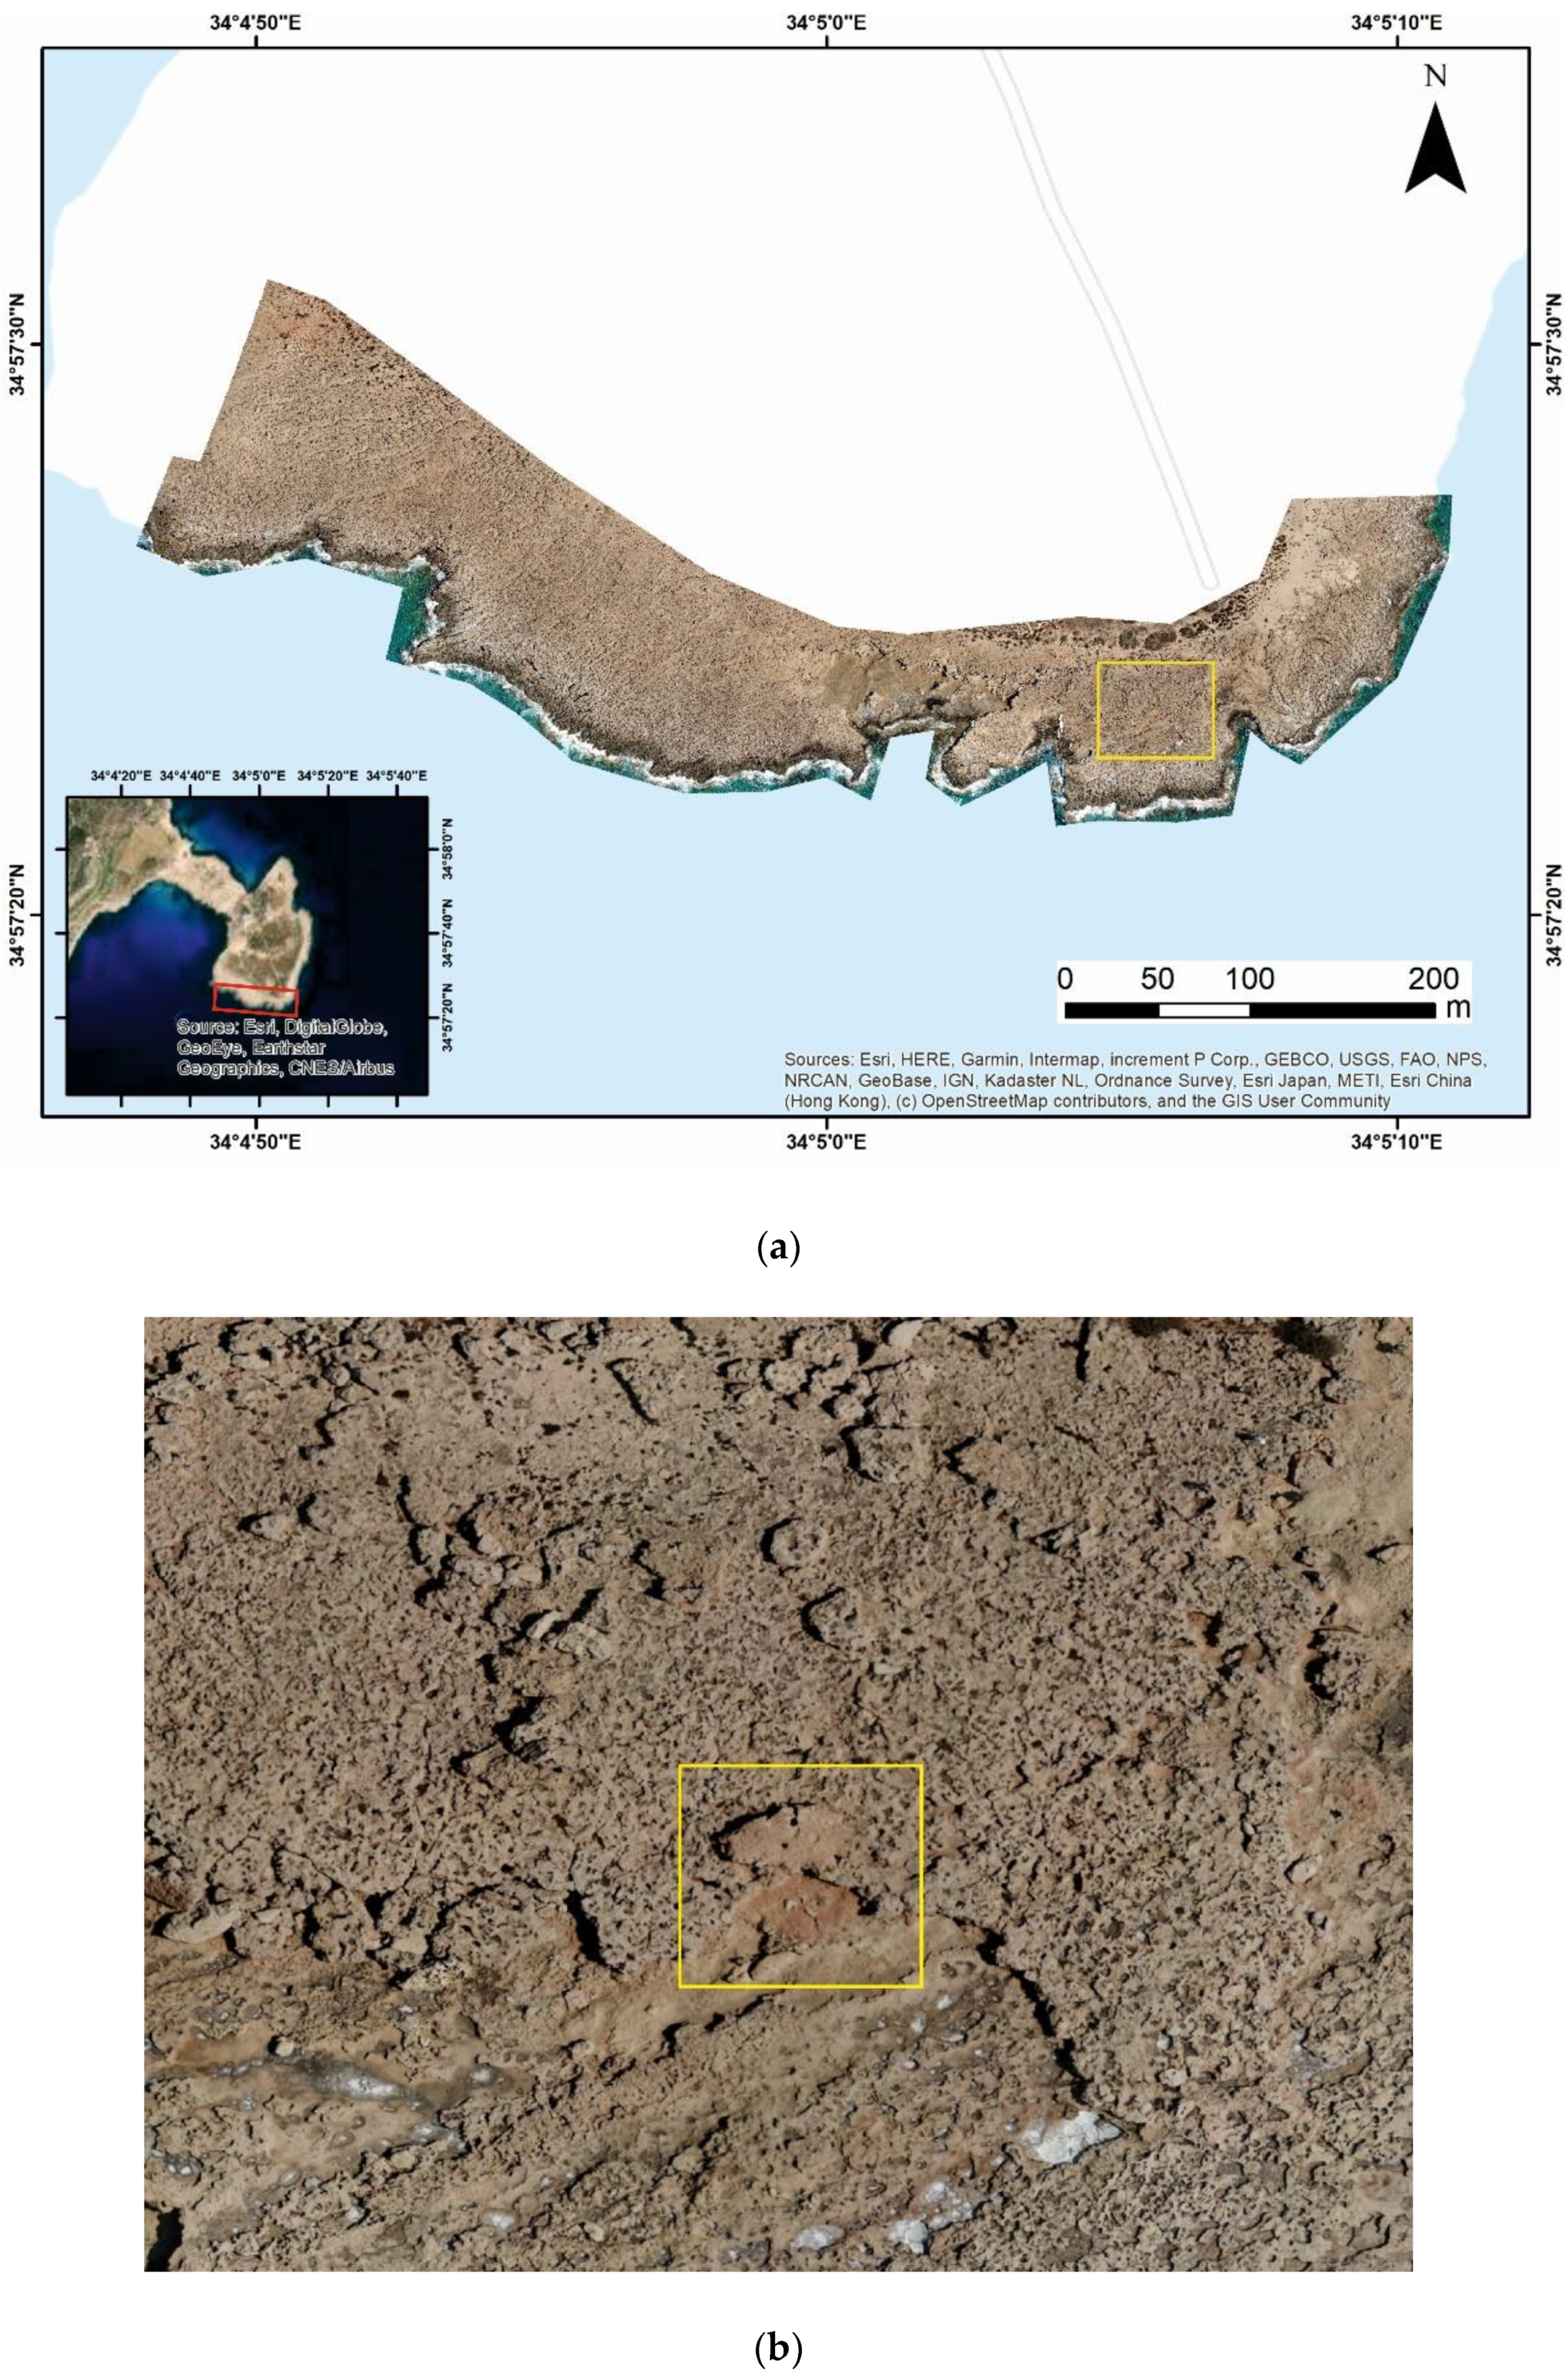
3.1. Fieldwork
3.2. Radiocarbon Dating
3.3. Estimation of Boulder Weight and Volume
3.4. Hydrodynamic Equations
4. Results
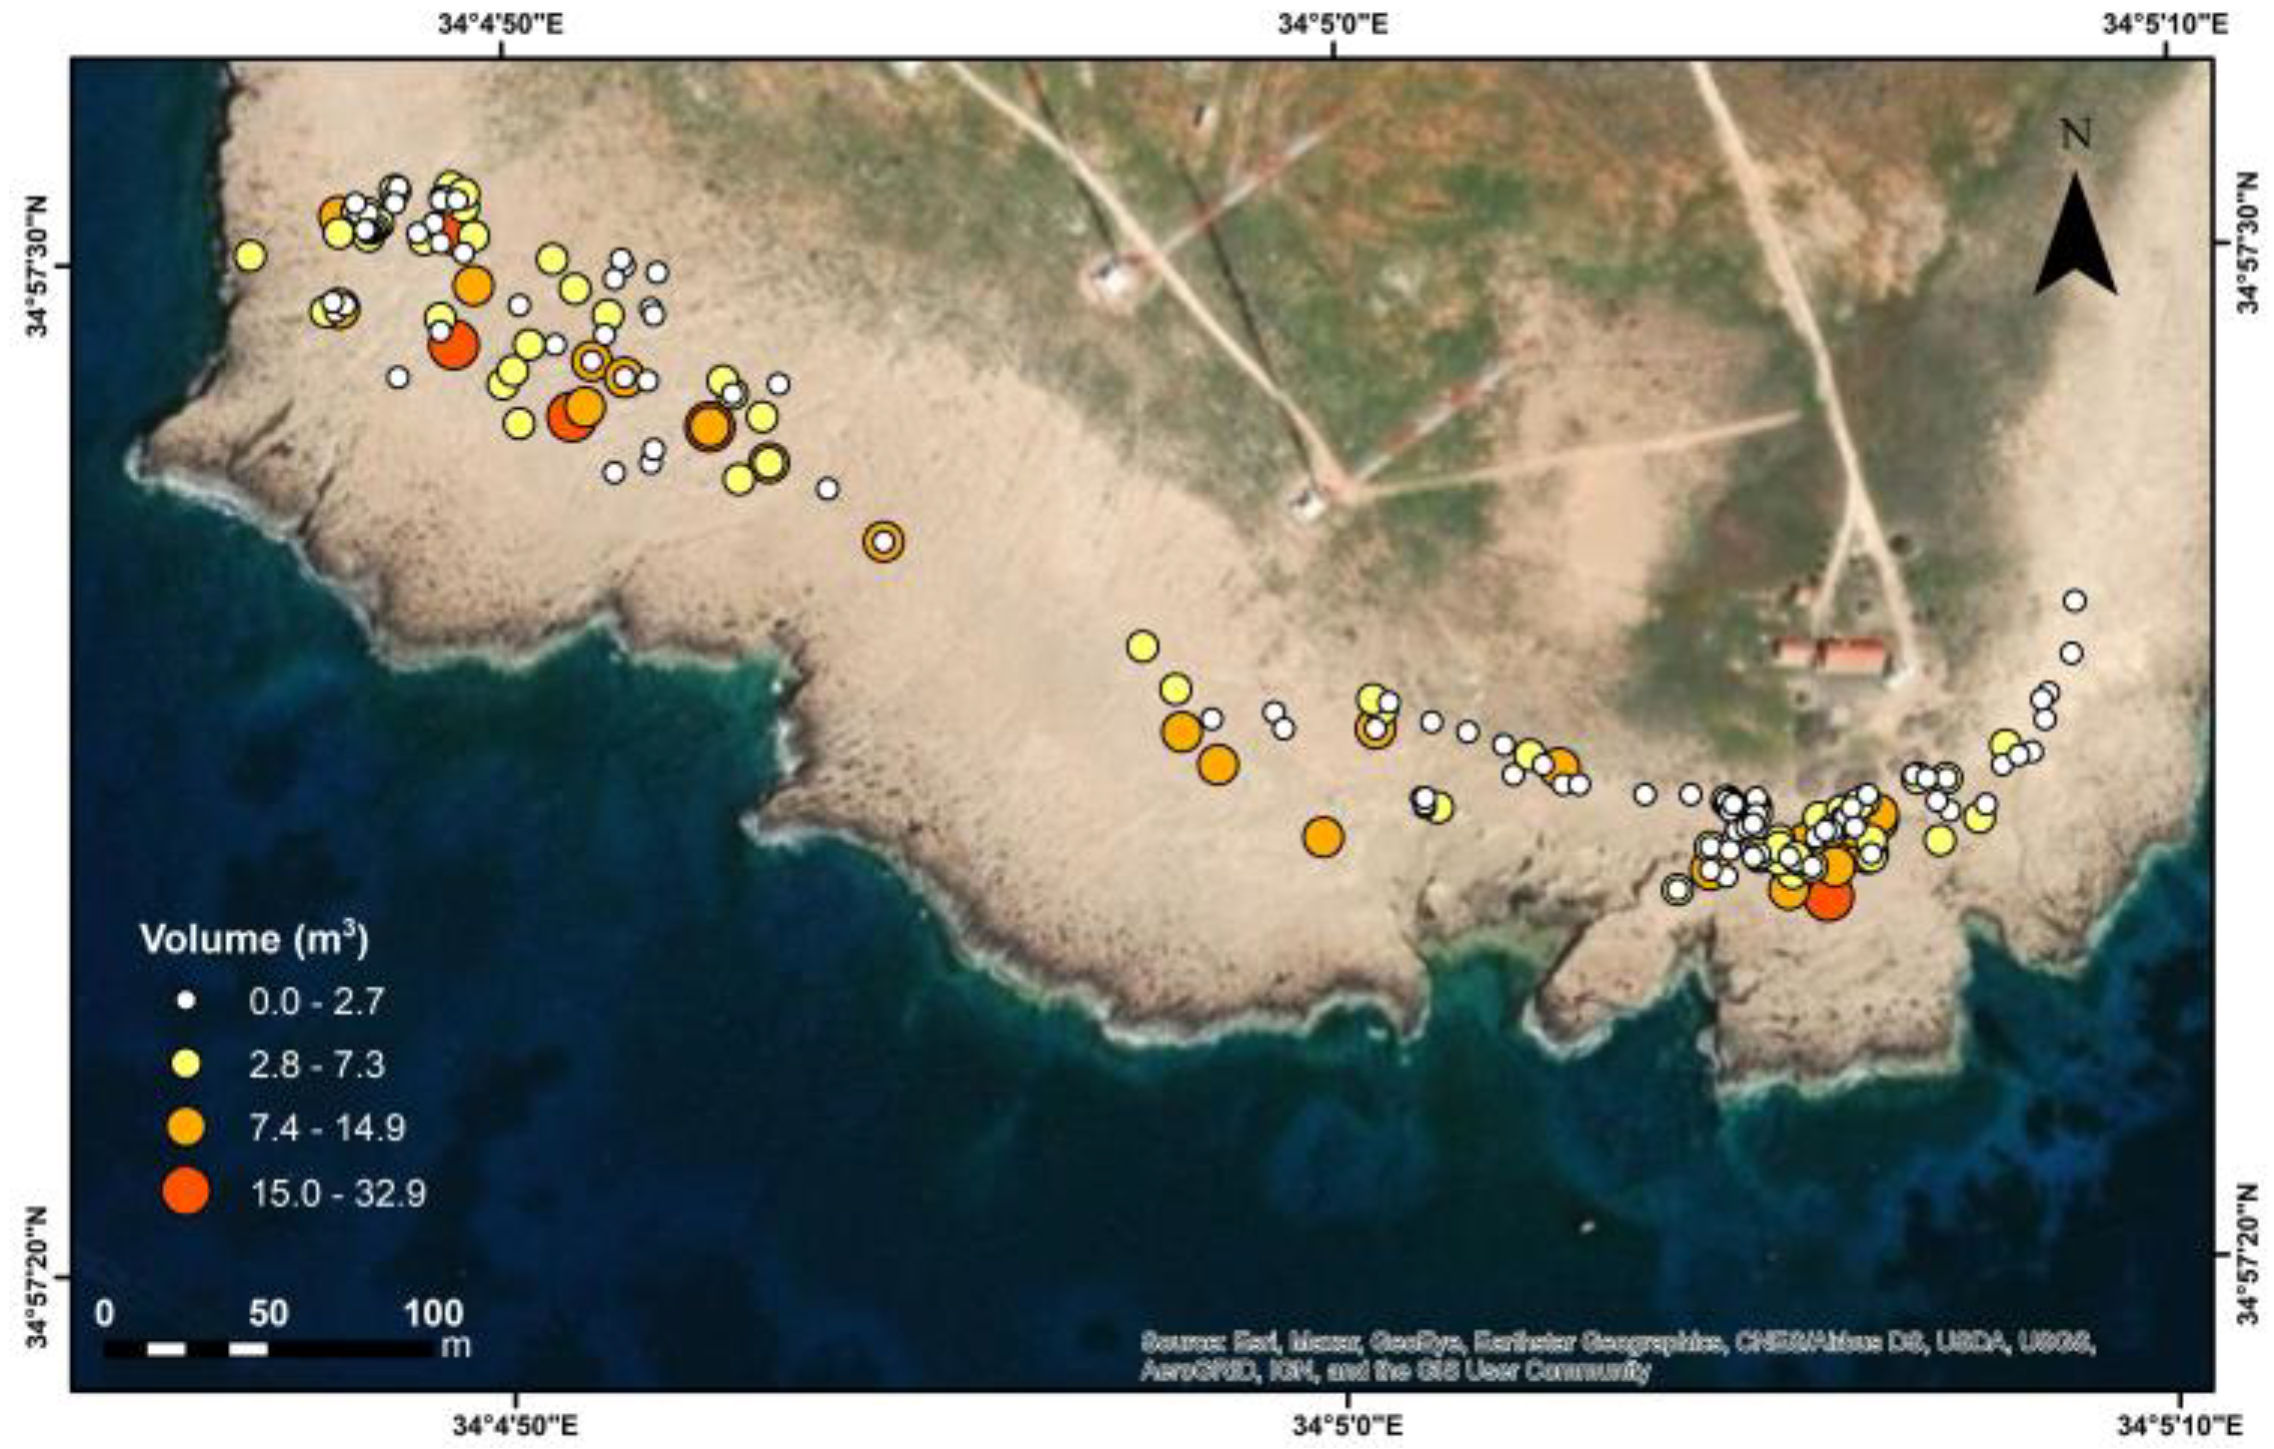
4.1. Field Investigation and Boulders Distribution
4.2. Wave Height Calculation
4.3. Radiocarbon Results
5. Discussion
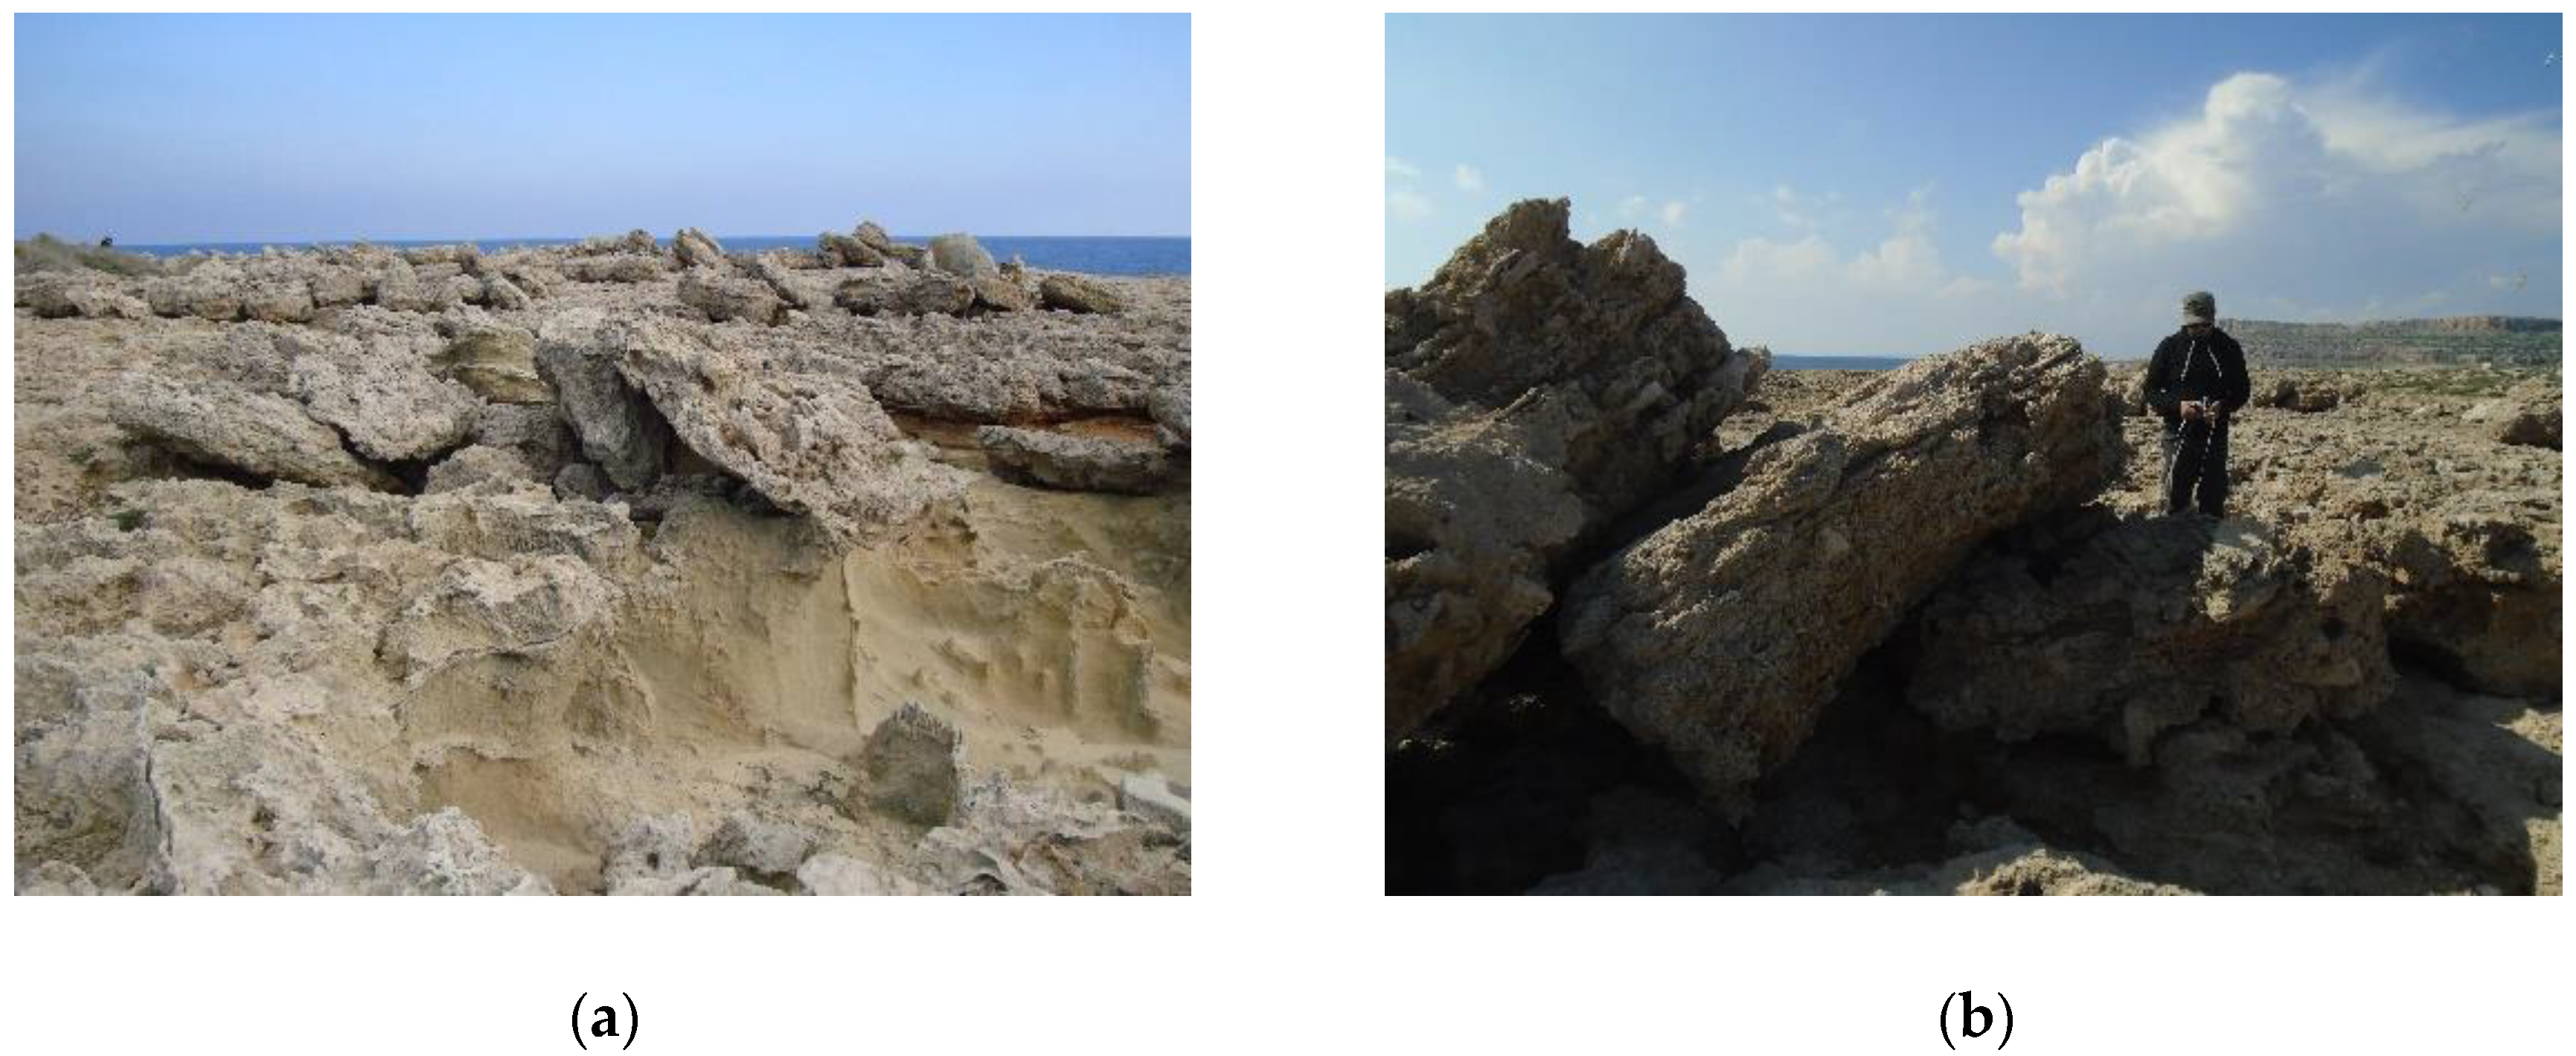
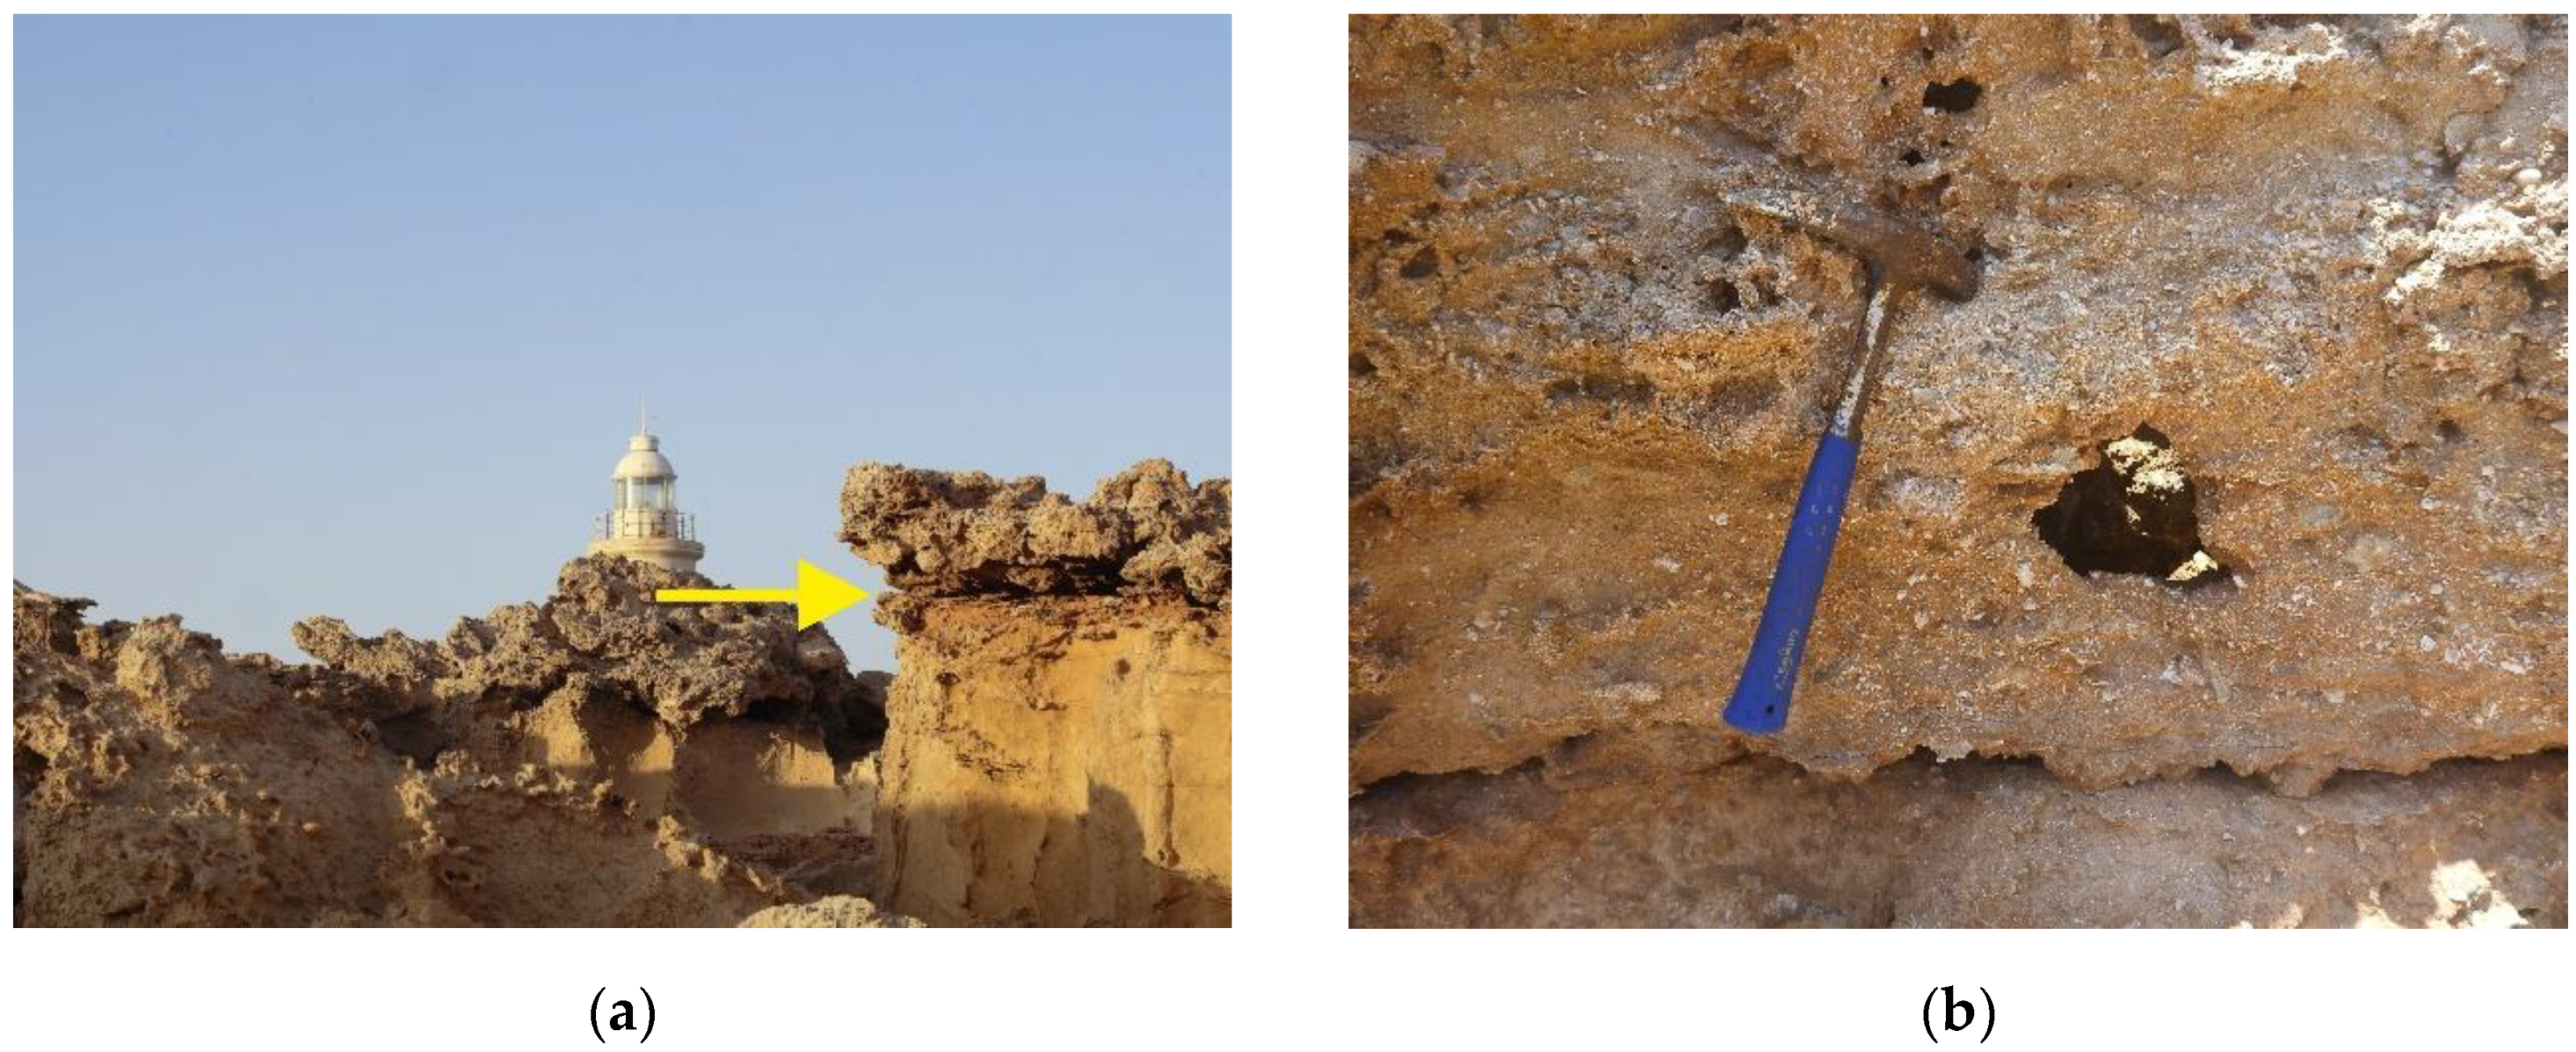
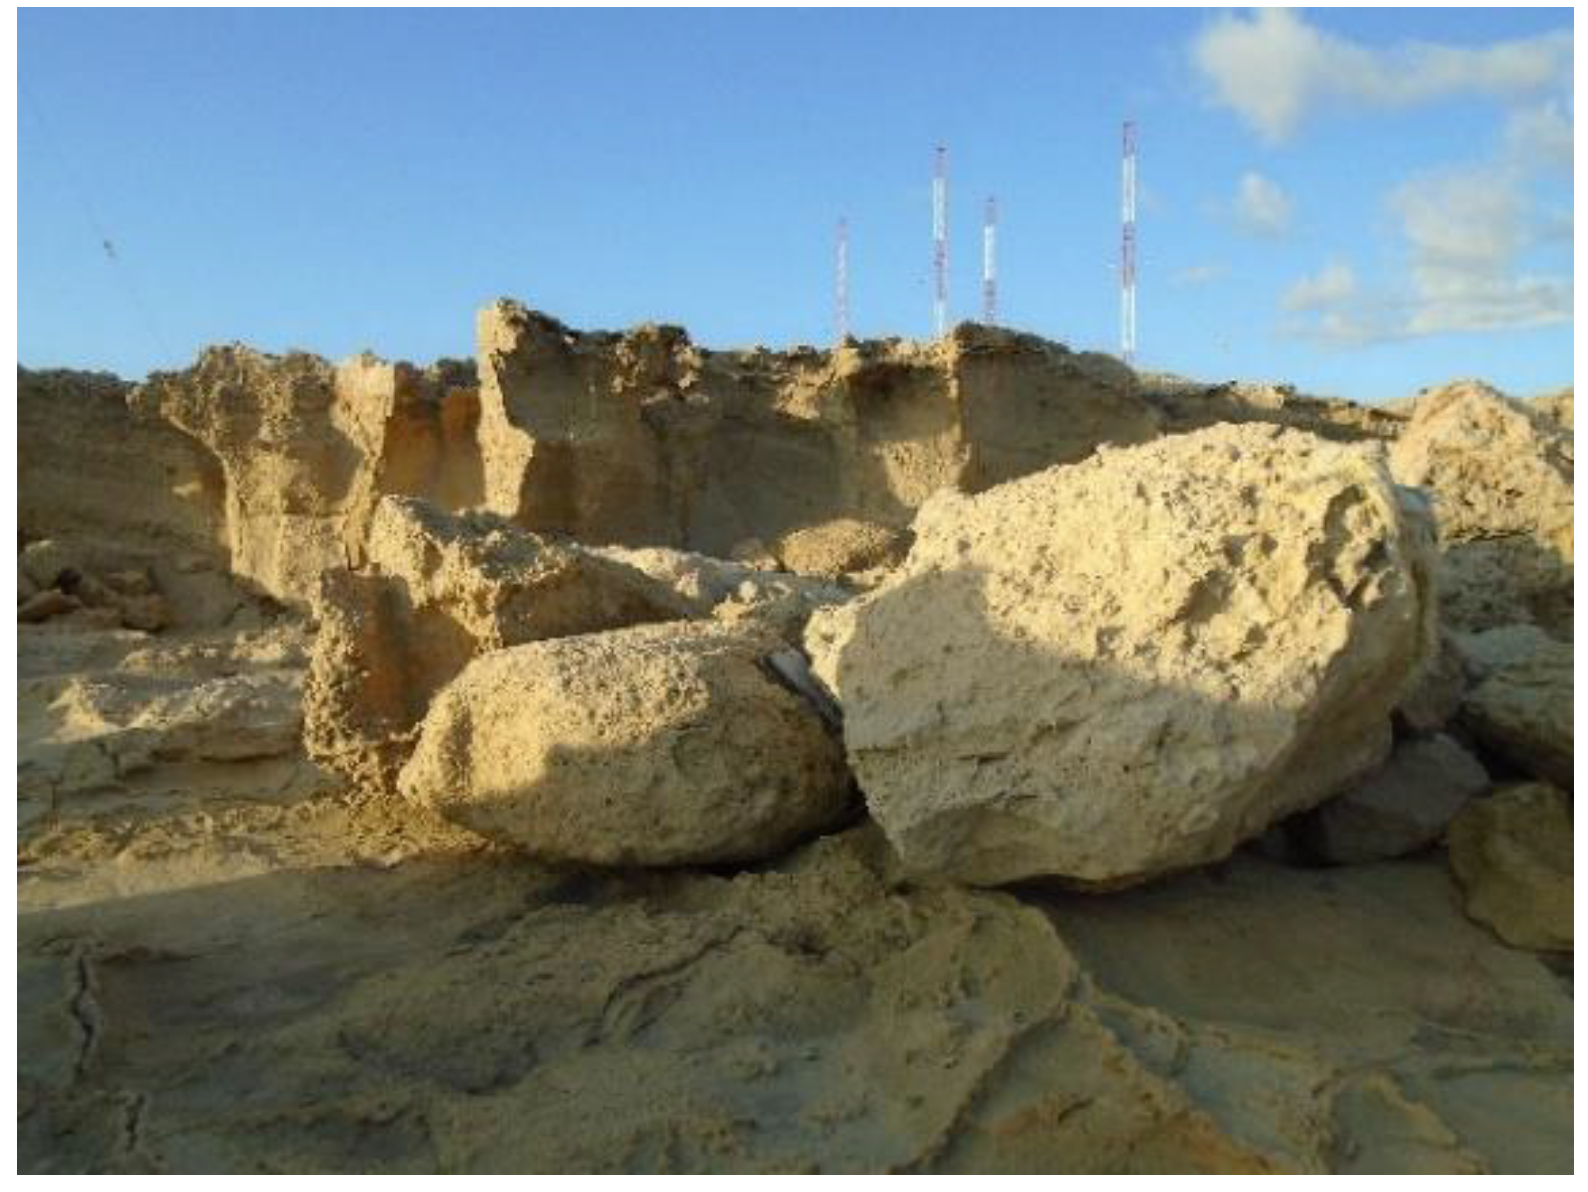
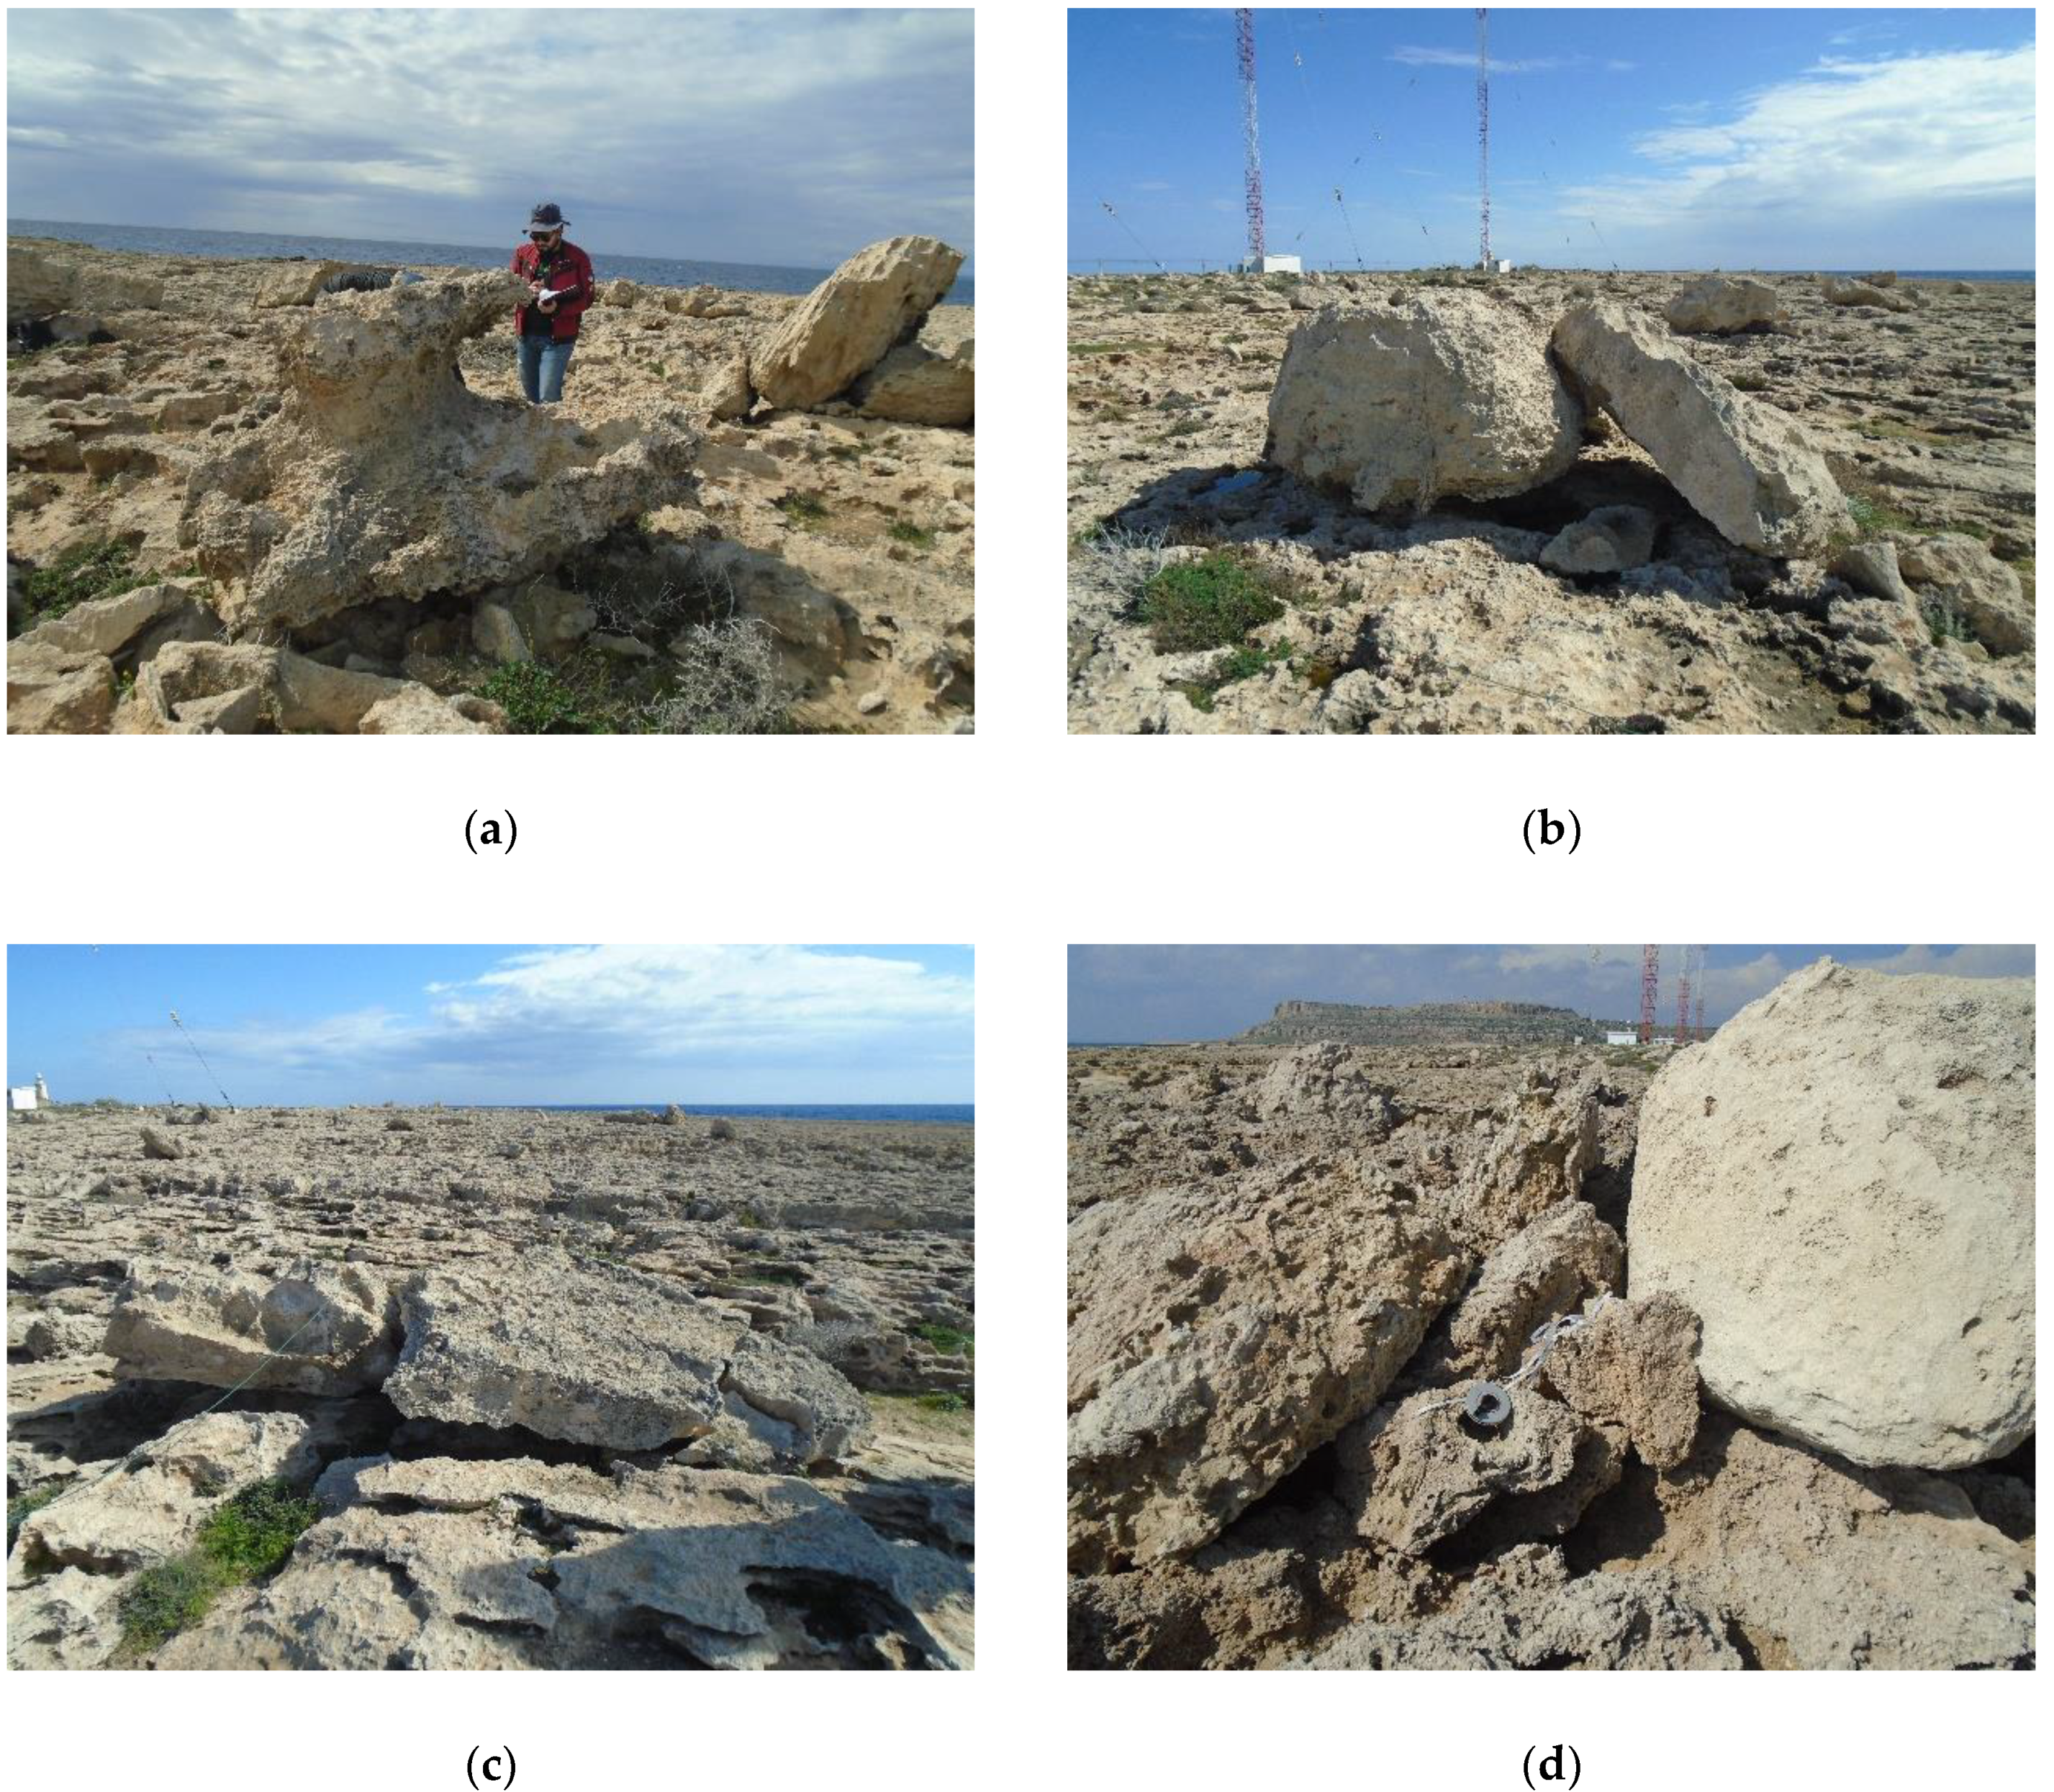
5.1. Geomorphological Evidence and Boulder Origin
5.2. Storm or Tsunami Origin of Deposits?
5.3. Correlation with Known Tsunami Events
6. Conclusions
Supplementary Materials
Author Contributions
Funding
Acknowledgments
Conflicts of Interest
References
- Goto, K.; Okada, K.; Imamura, F. Characteristics and hydrodynamics of boulders transported by storm waves at Kudaka Island, Japan. Mar. Geol. 2009, 262, 14–24. [Google Scholar] [CrossRef]
- Etienne, S.; Paris, R. Boulder accumulations related to storms on the south coast of the Reykjanes Peninsula (Iceland). Geomorphology 2010, 114, 55–70. [Google Scholar] [CrossRef]
- Piscitelli, A.; Milella, M.; Hippolyte, J.-C.; Shah-Hosseini, M.; Morhange, C.; Mastronuzzi, G. Numerical approach to the study of coastal boulders: The case of Martigues, Marseille, France. Quat. Int. 2017, 439, 52–64. [Google Scholar] [CrossRef]
- Cox, R.; Jahn, K.L.; Watkins, O.G.; Cox, P. Extraordinary boulder transport by storm waves (west of Ireland, winter 2013–2014), and criteria for analysing coastal boulder deposits. Earth-Sci. Rev. 2018, 177, 623–636. [Google Scholar] [CrossRef]
- Mastronuzzi, G.; Pignatelli, C.; Sansò, P.; Selleri, G. Boulder accumulations produced by the 20th of February, 1743 tsunami along the coast of southeastern Salento (Apulia region, Italy). Mar. Geol. 2007, 242, 191–205. [Google Scholar] [CrossRef]
- Scicchitano, G.; Monaco, C.; Tortorici, L. Large boulder deposits by tsunami waves along the Ionian coast of south-eastern Sicily (Italy). Mar. Geol. 2007, 238, 75–91. [Google Scholar] [CrossRef]
- Etienne, S.; Buckley, M.; Paris, R.; Nandasena, A.K.; Clark, K.; Strotz, L.; Chagué-Goff, C.; Richmond, B. The use of boulders for characterising past tsunamis: Lessons from the 2004 Indian Ocean and 2009 South Pacific tsunamis. Earth-Sci. Rev. 2011, 107, 76–90. [Google Scholar] [CrossRef]
- Hoffmann, G.; Reicherter, K.; Wiatr, T.; Grützner, C.; Rausch, T. Block and boulder accumulations along the coastline between Fins and Sur (Sultanate of Oman): Tsunamigenic remains? Nat. Hazards 2013, 65, 851–873. [Google Scholar] [CrossRef]
- Nandasena, N.A.K.; Tanaka, N. Boulder transport by high energy: Numerical model-fitting experimental observations. Ocean Eng. 2013, 57, 163–179. [Google Scholar] [CrossRef]
- Mottershead, D.; Bray, M.; Soar, P.; Farres, P.J. Extreme wave events in the central Mediterranean: Geomorphic evidence of tsunami on the Maltese Islands. Z. Geomorphol. 2014, 58, 385–411. [Google Scholar] [CrossRef] [Green Version]
- Roig-Munar, F.X.; Rodríguez-Perea, A.; Martín-Prieto, J.A.; Gelabert, B.; Vilaplana, J.M. Tsunami boulders on the rocky coasts of Ibiza and Formentera (Balearic Islands). J. Mar. Sci. Eng. 2019, 7, 327. [Google Scholar] [CrossRef] [Green Version]
- Scheffers, A.; Kelletat, D.; Haslett, S.; Scheffers, S.; Browne, T. Coastal boulder deposits in Galway Bay and the Aran Islands, western Ireland. Z. Geomorphol. 2010, 54, 247–279. [Google Scholar] [CrossRef]
- Kortekaas, S.; Dawson, A.G. Distinguishing tsunami and storm deposits: An example from Martinhal, SW Portugal. Sediment. Geol. 2007, 200, 208–221. [Google Scholar] [CrossRef]
- Morton, R.A.; Gelfenbaum, G.; Jaffe, B.E. Physical criteria for distinguishing sandy tsunami and storm deposits using modern examples. Sediment. Geol. 2007, 200, 184–207. [Google Scholar] [CrossRef]
- Goto, K.; Chavanich, S.A.; Imamura, F.; Kunthasap, P.; Matsui, T.; Minoura, K.; Sugawara, D.; Yanagisawa, H. Distribution, origin and transport process of boulders deposited by the 2004 Indian Ocean tsunami at Pakarang Cape, Thailand. Sediment. Geol. 2007, 202, 821–837. [Google Scholar] [CrossRef]
- Goto, K.; Chagué-Goff, C.; Goff, J.; Jaffe, B. The future of tsunami research following the 2011 Tohoku-oki event. Sediment. Geol. 2012, 282, 1–13. [Google Scholar] [CrossRef]
- Goto, K.; Sugawara, D.; Ikema, S.; Miyagi, T. Sedimentary processes associated with sand and boulder deposits formed by the 2011 Tohoku-oki tsunami at Sabusawa Island, Japan. Sediment. Geol. 2012, 282, 188–198. [Google Scholar] [CrossRef]
- Nandasena, N.A.K.; Tanaka, N.; Sasaki, Y.; Osada, M. Boulder transport by the 2011 Great East Japan tsunami: Comprehensive field observations and whither model predictions? Mar. Geol. 2013, 346, 292–309. [Google Scholar] [CrossRef]
- Morton, R.A.; Richmond, B.M.; Jaffe, B.E.; Gelfenbaum, G. Coarse-Clast Ridge Complexes of the Caribbean: A Preliminary Basis for Distinguishing Tsunami and Storm-Wave Origins. J. Sediment. Res. 2008, 78, 624–637. [Google Scholar] [CrossRef]
- Boulton, S.J.; Whitworth, M.R.Z. Block and boulder accumulations on the southern coast of Crete (Greece): Evidence for the 365 CE tsunami in the Eastern Mediterranean. In Tsunamis: Geology, Hazards and Risks; Chapman, N.A., Tappin, D.R., Wallis, S.R., Eds.; The Geological Society of London: London, UK, 2017. [Google Scholar]
- Nott, J. Waves, coastal boulder deposits and the importance of the pre-transport setting. Earth Planet. Sci. Lett. 2003, 210, 269–276. [Google Scholar] [CrossRef]
- Pignatelli, C.; Sansò, P.; Mastronuzzi, G. Evaluation of tsunami flooding using geomorphologic evidence. Mar. Geol. 2009, 260, 6–18. [Google Scholar] [CrossRef]
- Benner, R.; Browne, T.; Bruckner, H.; Kelletat, D.; Scheffers, A. Boulder Transport by Waves: Progress in Physical Modelling. Z. Geomorphol. 2010, 54, 127–146. [Google Scholar] [CrossRef]
- Engel, M.; May, S.M. Bonaire’s boulder fields revisited: Evidence for Holocene tsunami impact on the Leeward Antilles. Quat. Sci. Rev. 2012, 54, 126–141. [Google Scholar] [CrossRef]
- Fokaefs, A.; Papadopoulos, G.A. Tsunami hazard in the Eastern Mediterranean: Strong earthquakes and tsunamis in Cyprus and the Levantine Sea. Nat. Hazards 2007, 40, 503–526. [Google Scholar] [CrossRef]
- Ambraseys, N.N.; Synolakis, C. Tsunami Catalogs for the Eastern Mediterranean, Revisited. J. Earthq. Eng. 2010, 14, 309–330. [Google Scholar] [CrossRef]
- Kelletat, D.; Schellmann, G. Tsunamis on Cyprus: Field evidences and 14C dating results. Z. Geomorphol. 2002, 46, 19–34. [Google Scholar] [CrossRef]
- Whelan, F.; Kelletat, D. Geomorphic evidence and relative and absolute dating results for tsunami events on Cyprus. Sci. Tsunami Hazards 2002, 20, 3–18. [Google Scholar]
- Noller, J.S.; Zomeni, Z.; Panayides, I. Preliminary field and GIS-based assessment of tsunami hazard on Cyprus. CIESM Workshop Monogr. 2011, 42, 49–58. [Google Scholar]
- Vita-Finzi, C. Evaluating Late Quaternary uplift in Greece and Cyprus. Geol. Soc. Spec. Publ. 1993, 76, 417–424. [Google Scholar] [CrossRef]
- Alves, T.M.; Kokinou, E.; Zodiatis, G.; Lardner, R. Hindcast, GIS and susceptibility modelling to assist oil spill clean-up and mitigation on the southern coast of Cyprus (Eastern Mediterranean). Deep. Res. Part II Top. Stud. Oceanogr. 2016, 133, 159–175. [Google Scholar] [CrossRef]
- Eaton, S.; Robertson, A. The Miocene Pakhna Formation, southern Cyprus and its relationship to the Neogene tectonic evolution of the Eastern Mediterranean. Sediment. Geol. 1993, 86, 273–296. [Google Scholar] [CrossRef]
- Ambraseys, N.N.; Adams, R.D. Seismicity of the Cyprus region. Terra Nov. 1993, 5, 85–94. [Google Scholar] [CrossRef]
- Ambraseys, N.N.; Melville, C.P.; Adams, R.D. The Seismicity of Egypt, Arabia and the Red Sea; Cambridge University Press: Cambridge, UK, 1994. [Google Scholar]
- Amiran, D.H.K.; Arieh, E.; Turcotte, T. Earthquakes in Israel and Adjacent Areas: Macroseismic Observations since 100 B.C.E. Isr. Explor. J. 1994, 44, 260–305. [Google Scholar]
- Soloviev, S.L.; Solovieva, O.N. Tsunamis in the Mediterranean Sea 2000 B.C.-2000 A.D.; Springer: Dordrecht, The Netherlands, 2000. [Google Scholar]
- Soren, D. University of Arizona excavations at Kourion, Cyprus. Am. J. Archaeol. 1988, 92, 265. [Google Scholar]
- Christou, D. Kourion. Its Monuments and Local Museum; Filokipros: Nicosia, Cyprus, 1996. [Google Scholar]
- Evagelatou-Notara, F. Earthquakes in Byzantium from 13th to 15th Century—A Historical Examination; Parousia: Athens, Greece, 1993; ISBN 960-852025-8. [Google Scholar]
- Guidoboni, E.; Comastri, A.; Traina, A.G. Catalogue of Ancient Earthquakes in the Mediterranean Area up to 10th Century; Istituto Nazionale di Geofisica: Rome, Italy, 1994.
- Noller, J.; Panayides, I.; Zomeni, Z. Report on the Preliminary Assessment of Tsunami Hazard in Cyprus; Geological Survey Department: Lefkosia, Cyprus, 2005.
- Ambraseys, N.N.; Melville, C.P. An analysis of the Eastern Mediterranean Earthquake of 20 May 1202. In Historical Seismograms and Earthquakes of the World; Lee, W.H.K., Meyers, H., Shimazaki, K., Eds.; Academic Press: London, UK, 1988; pp. 181–200. [Google Scholar]
- Yolsal, S.; Taymaz, T.; Yalçiner, A.C. Understanding tsunamis, potential source regions and tsunami-prone mechanisms in the Eastern Mediterranean. Geol. Soc. Lond. Spec. Publ. 2007, 291, 201–230. [Google Scholar] [CrossRef]
- Loizidou, X.I.; Dekker, J. Nearshore Wave Climate Analysis for Cyprus, Nicosia, Cyprus; Internal Report; Ministry of Transport, Communication and Work, Department of Public Works: Nicosia, Cyprus, 1994.
- Ministry of Commerce. Strategic Environmental Assessment (SEA) Concerning Hydrocarbon Activities within the Exclusive Economic Zone of the Republic of Cyprus; Ministry of Commerce, Industry and Tourism of the Republic of Cyprus: Nicosia, Cyprus, 2008.
- Stuiver, M.; Reimer, P.J.; Reimer, R.W. CALIB 7.1 [WWW Program]. Available online: http://calib.org (accessed on 9 August 2020).
- Reimer, P.J.; McCormac, F.G. Marine radiocarbon reservoir corrections for the Mediterranean and Aegean Seas. Radiocarbon 2002, 44, 159–166. [Google Scholar] [CrossRef] [Green Version]
- Nandasena, N.A.K.; Paris, R.; Tanaka, N. Reassessment of hydrodynamic equations: Minimum flow velocity to initiate boulder transport by high energy events (storms, tsunamis). Mar. Geol. 2011, 281, 70–84. [Google Scholar] [CrossRef]
- Barbano, M.S.; Pirrotta, C.; Gerardi, F. Large boulders along the south-eastern Ionian coast of Sicily: Storm or tsunami deposits? Mar. Geol. 2010, 275, 140–154. [Google Scholar] [CrossRef]
- Helley, E.J. Field Measurement of the Initiation of Large Bed Particle Motion in Blue Creek Near Klamath, California; USGS Professional Paper 562; United States Government Printing Office: Washington, DC, USA, 1969; pp. 1–19. [CrossRef]
- Noormets, R.; Crook, K.A.W.; Felton, E.A. Sedimentology of rocky shorelines: 3. Hydrodynamics ofmegaclast emplacement and transport on a shore platform, Oahu, Hawaii. Sediment. Geol. 2004, 172, 41–65. [Google Scholar] [CrossRef]
- Spiske, M.; Böröcz, Z.; Bahlburg, H. The role of porosity in discriminating between tsunami and hurricane emplacement of boulders–A case study from the Lesser Antilles, southern Caribbean. Earth Planet. Sci. Lett. 2008, 268, 384–396. [Google Scholar] [CrossRef]
- Hoffmeister, D.; Tilly, N.; Curdt, C.; Aasen, H.; Ntageretzis, K.; Hadler, H.; Willershäuser, T.; Vött, A.; Bareth, G. Terrestrial Laser Scanning for Coastal Geomorphologic Research in Western Greece. ISPRS-Int. Arch. Photogramm. Remote Sens. Spat. Inf. Sci. 2012, XXXIX-B5, 511–516. [Google Scholar] [CrossRef] [Green Version]
- Shah-Hosseini, M.; Saleem, A.; Mahmoud, A.M.A.; Morhange, C. Coastal boulder deposits attesting to large wave impacts on the Mediterranean coast of Egypt. Nat. Hazards 2016, 83, 849–865. [Google Scholar] [CrossRef]
- Galanis, G.; Hayes, D.; Zodiatis, G.; Chu, P.C.; Kuo, Y.-H.; Kallos, G. Wave height characteristics in the Mediterranean Sea by means of numerical modeling, satellite data, statistical and geometrical techniques. Mar. Geophys. Res. 2012, 33, 1–15. [Google Scholar] [CrossRef] [Green Version]
- Ambraseys, N. Earthquakes in the Eastern Mediterranean and the Middle East; Cambridge University Press: New York, NY, USA, 2009; ISBN 9780521872928. [Google Scholar]
- Antonopoulos, J.A. Data from investigation on seismic Sea waves events in the Eastern Mediterranean from 1000 to 1500 A.D. Ann. Geofis. 1980, 19, 141–248. [Google Scholar]
- Guidoboni, E.; Comastri, A. The large earthquake of 8 August 1303 in Crete: Seismic scenario and tsunami in the Mediterranean area. J. Seismol. 1997, 1, 55–72. [Google Scholar] [CrossRef]


| Date | Source | Area Affected | Description | Reference |
|---|---|---|---|---|
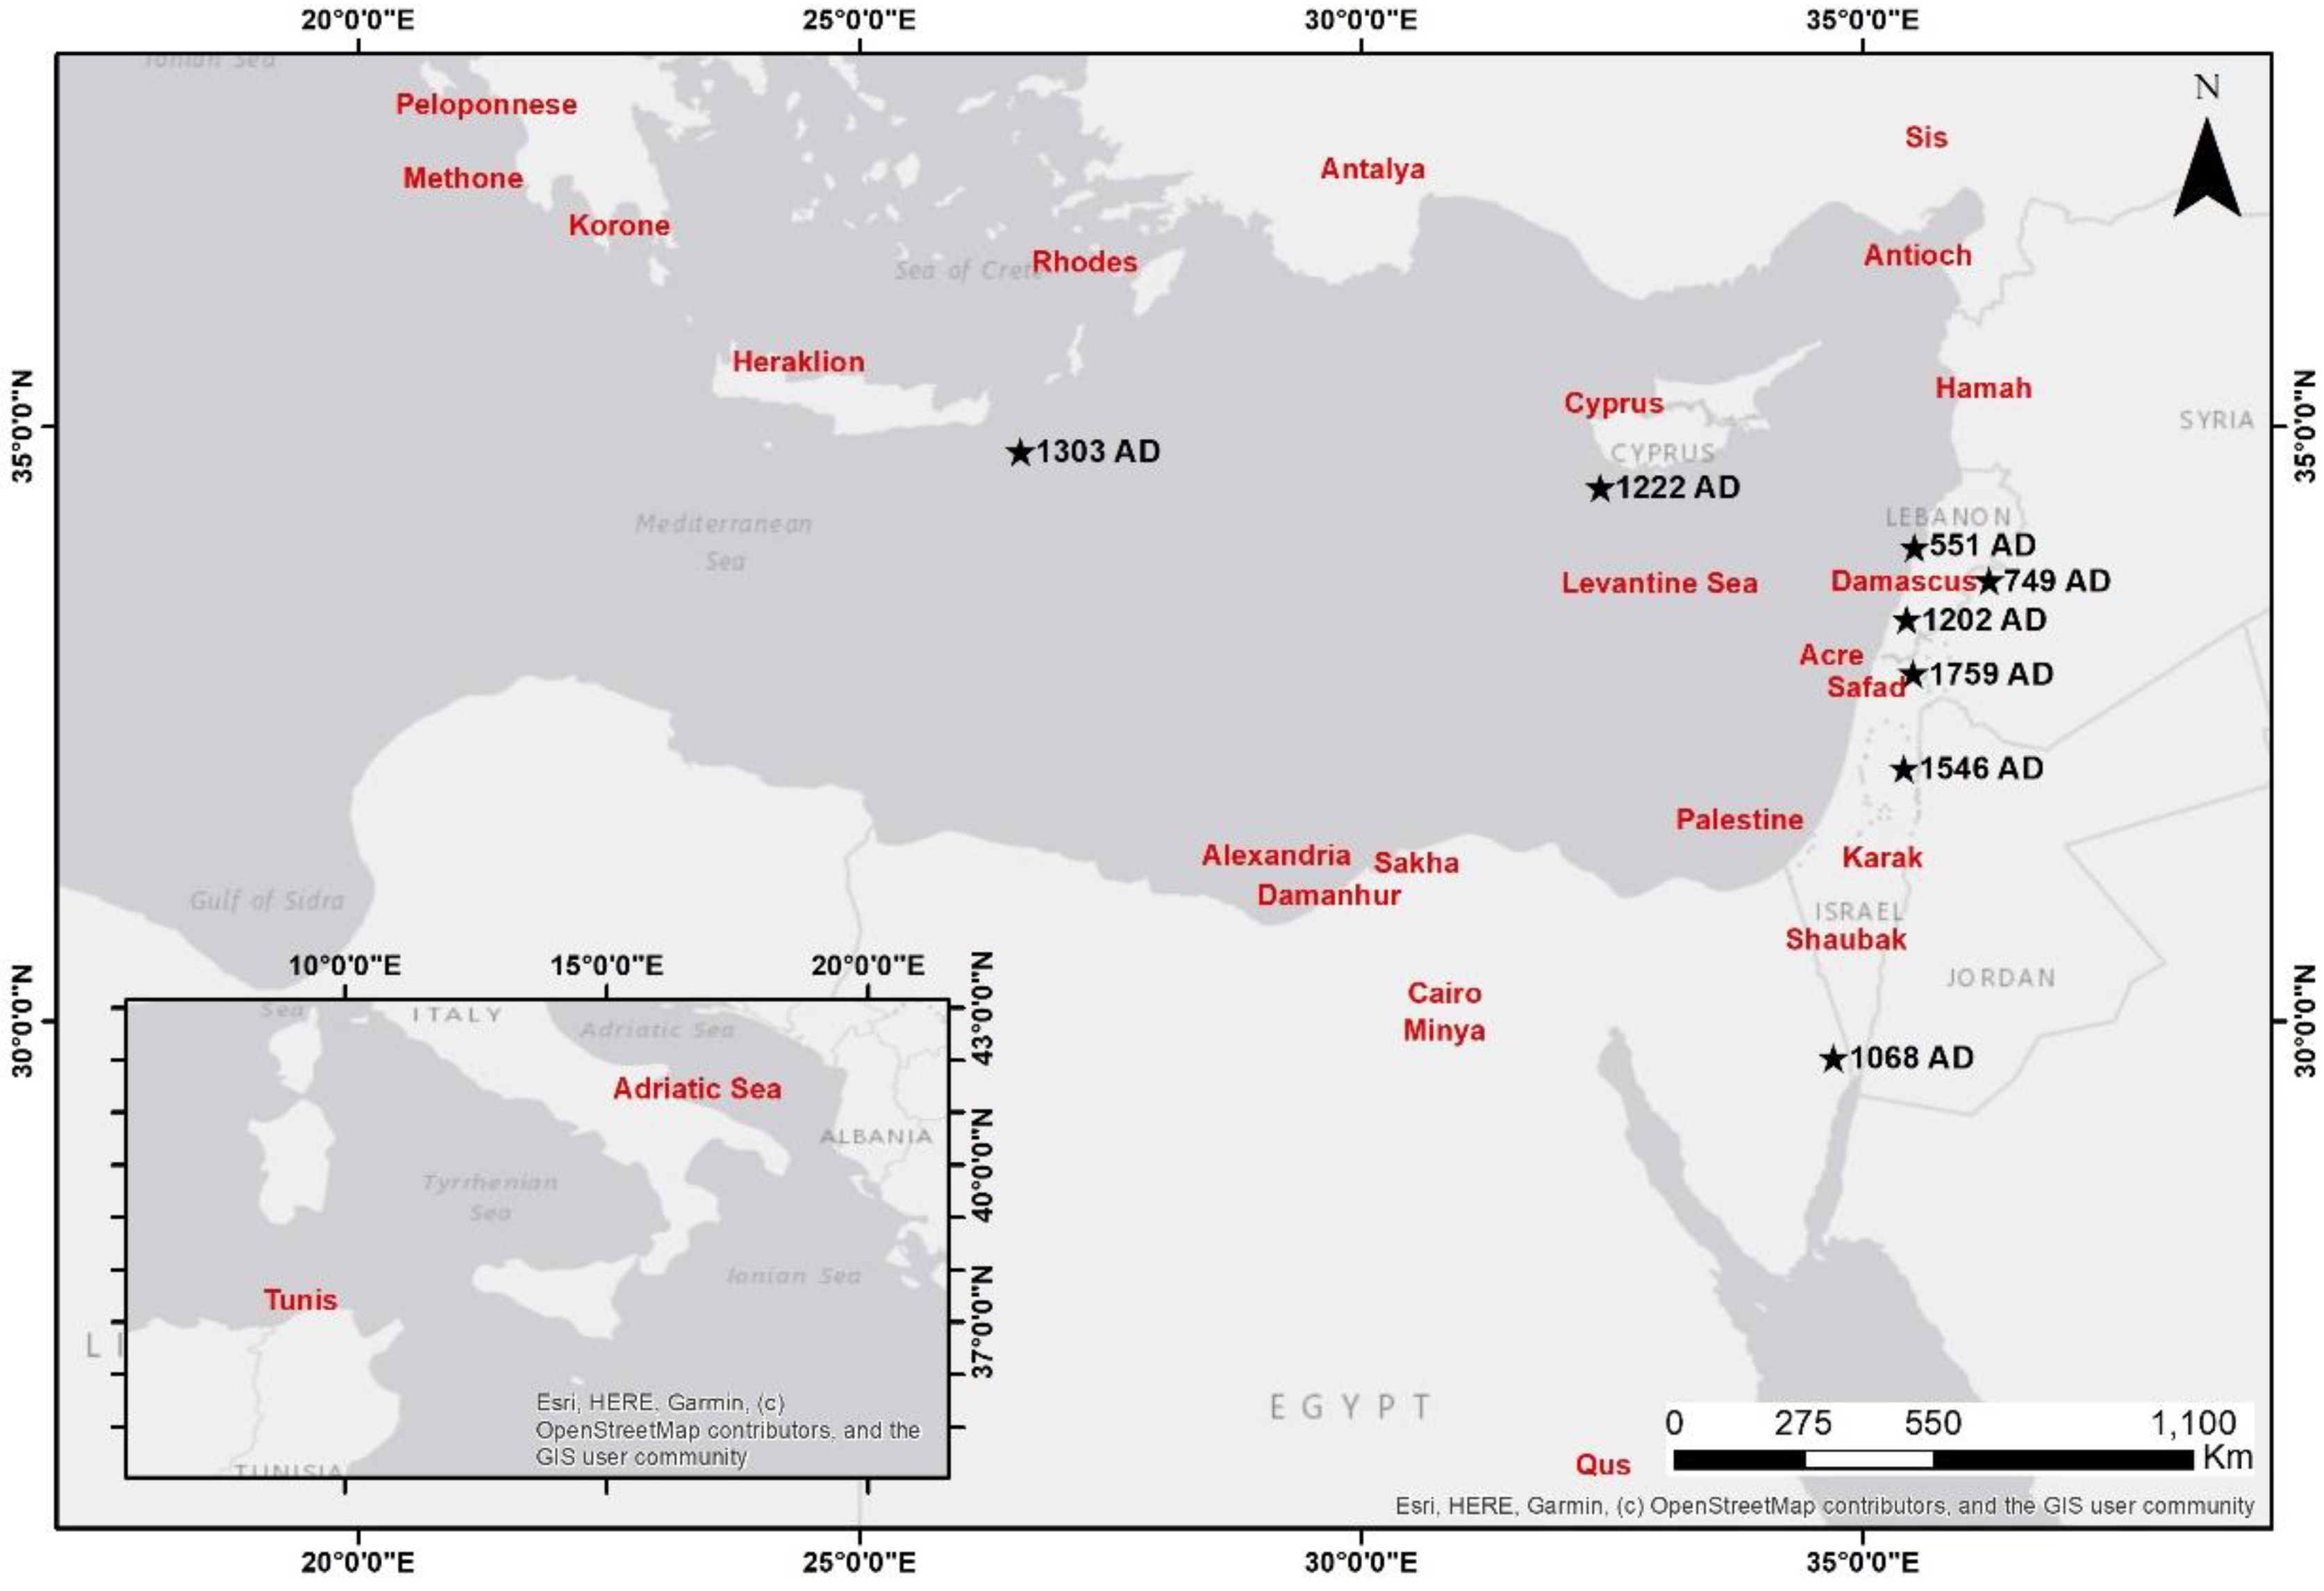
| 1202 | Possibly landslide near the Levantine coast due to a strong earthquake | Levantine coast and Cyprus | The sea between Cyprus and the Levantine coast parted and mountainous waves piled up throwing ships onto the land. Eastern parts of the island were flooded. | [34] |
| 1222 | Strong submarine earthquake south of Pafos | Cyprus | Earthquake destruction and destructive tsunami flooding in Pafos and Lemesos. The castle of Pafos collapsed and the harbor was left without water. | [25] |
| 1303 | Strong earthquake in Hellenic Arc between Crete and Rhodes | From Crete to Levantine coasts | Destructive tsunami in Crete. Damaging sea-wave in Rhodes. Tsunami reported to be seen at SW Turkey, Egypt, Cyprus, and Palestine. | [43] |
| 1953 | Strong double earthquake south-west of Cyprus | Cyprus | Destructive tsunami in Crete. Damaging sea-wave in Rhodes. Tsunami reported to be seen at SW Turkey, Egypt, Cyprus, and Palestine. Small tsunami along the coast of Pafos which caused no damage. | [25] |
| Five Largest Values of Storm Wave Height for JBB Scenario | SAB Scenario | |||||||||
|---|---|---|---|---|---|---|---|---|---|---|
| Boulder No | Axes (m) | Volume (m3) | Pignatelli et al. (2009) | Nandasena et al. (2011) | Engel and May (2012) | |||||
| a-axis | b-axis | c-axis | Hs (m) | Ht (m) | Hs (m) | Ht (m) | Hs (m) | Ht (m) | ||
| 57 | 1.77 | 1.09 | 1.87 | 2.71 | 19.57 | 4.89 | 15.24 | 3.81 | 32.03 | 8.01 |
| 41 | 5.13 | 3.10 | 1.62 | 19.32 | 16.95 | 4.24 | 13.20 | 3.30 | 573.86 | 143.47 |
| 86 | 4.80 | 4.29 | 1.60 | 24.71 | 16.74 | 4.19 | 13.04 | 3.26 | 678.34 | 169.58 |
| 94 | 4.31 | 1.98 | 1.58 | 10.11 | 16.53 | 4.13 | 12.87 | 3.22 | 246.07 | 61.52 |
| 98 | 3.50 | 1.52 | 1.52 | 6.07 | 15.91 | 3.98 | 12.39 | 3.10 | 115.37 | 28.84 |
| Five Largest Values of Storm Wave Height for SMB Scenario | ||||||||||
| Boulder No | Axes (m) | Volume (m3) | Nandasena et al. (2011) | Barbano et al. (2010) | Benner et al. (2010) | |||||
| a-axis | b-axis | c-axis | Hs (m) | Ht (m) | Hs (m) | Ht (m) | Hs (m) | Ht (m) | ||
| 86 | 4.80 | 4.29 | 1.60 | 24.71 | 7.40 | 1.85 | 8.64 | 2.16 | 72.78 | 18.20 |
| 53 | 5.49 | 4.41 | 1.12 | 20.34 | 7.27 | 1.82 | 8.17 | 2.04 | 72.79 | 18.23 |
| 87 | 2.62 | 4.46 | 1.10 | 9.638 | 7.28 | 1.82 | 8.16 | 2.04 | 73.12 | 18.28 |
| 3 | 4.10 | 3.70 | 0.98 | 11.15 | 6.17 | 1.54 | 6.96 | 1.74 | 61.83 | 15.46 |
| 72 | 5.18 | 3.32 | 1.23 | 15.86 | 5.73 | 1.43 | 6.69 | 1.67 | 56.38 | 14.10 |
| Boulder No | Sample Code | Lab Code | Material | 14C Age (BP) | Calibrated Age (BC/AD) |
|---|---|---|---|---|---|
| 6 | ANT001 | LTL19209A | Vermetus sp. | 696 ± 45 BP | AD 1512-1824 |
| 26 | ANT002 | LTL19210A | Vermetus sp. | 987 ± 45 BP | AD 1309-1496 |
| 31 | ANT003 | LTL19211A | Vermetus sp. | >1950 AD | - |
Publisher’s Note: MDPI stays neutral with regard to jurisdictional claims in published maps and institutional affiliations. |
© 2020 by the authors. Licensee MDPI, Basel, Switzerland. This article is an open access article distributed under the terms and conditions of the Creative Commons Attribution (CC BY) license (http://creativecommons.org/licenses/by/4.0/).
Share and Cite
Evelpidou, N.; Zerefos, C.; Synolakis, C.; Repapis, C.; Karkani, A.; Polidorou, M.; Saitis, G. Coastal Boulders on the SE Coasts of Cyprus as Evidence of Palaeo-Tsunami Events. J. Mar. Sci. Eng. 2020, 8, 812. https://doi.org/10.3390/jmse8100812
Evelpidou N, Zerefos C, Synolakis C, Repapis C, Karkani A, Polidorou M, Saitis G. Coastal Boulders on the SE Coasts of Cyprus as Evidence of Palaeo-Tsunami Events. Journal of Marine Science and Engineering. 2020; 8(10):812. https://doi.org/10.3390/jmse8100812
Chicago/Turabian StyleEvelpidou, Niki, Christos Zerefos, Costas Synolakis, Christos Repapis, Anna Karkani, Miltiadis Polidorou, and Giannis Saitis. 2020. "Coastal Boulders on the SE Coasts of Cyprus as Evidence of Palaeo-Tsunami Events" Journal of Marine Science and Engineering 8, no. 10: 812. https://doi.org/10.3390/jmse8100812