Systematic Review and Quantitative Comparison of Cyberattack Scenario Detection and Projection


University of Zagreb, Faculty of Electrical Engineering and Computing, Unska 3, HR-10000 Zagreb, Croatia
*
Author to whom correspondence should be addressed.
Electronics 2020, 9(10), 1722; https://doi.org/10.3390/electronics9101722
Submission received: 15 September 2020
/
Revised: 13 October 2020
/
Accepted: 15 October 2020
/
Published: 19 October 2020
(This article belongs to the Special Issue Advanced Cybersecurity Services Design)
Abstract
:Intrusion Detection Systems (IDSs) automatically analyze event logs and network traffic in order to detect malicious activity and policy violations. Because IDSs have a large number of false positives and false negatives and the technical nature of their alerts requires a lot of manual analysis, the researchers proposed approaches that automate the analysis of alerts to detect large-scale attacks and predict the attacker’s next steps. Unfortunately, many such approaches use unique datasets and success metrics, making comparison difficult. This survey provides an overview of the state of the art in detecting and projecting cyberattack scenarios, with a focus on evaluation and the corresponding metrics. Representative papers are collected while using Google Scholar and Scopus searches. Mutually comparable success metrics are calculated and several comparison tables are provided. Our results show that commonly used metrics are saturated on popular datasets and cannot assess the practical usability of the approaches. In addition, approaches with knowledge bases require constant maintenance, while data mining and ML approaches depend on the quality of available datasets, which, at the time of writing, are not representative enough to provide general knowledge regarding attack scenarios, so more emphasis needs to be placed on researching the behavior of attackers.
1. Introduction
The disappointing truth about cyber security today is that targeted cyberattacks, which are usually motivated by financial gain, often go undetected for weeks, even months [1], allowing for attackers to do a lot of damage. If attacks were discovered at an early stage, the damage they cause could be significantly reduced. At the time of writing, attacks are primarily detected using network and host intrusion detection systems (NIDS and HIDS, respectively). Network intrusion detection systems monitor network traffic, while host intrusion detection system monitor different data sources on a host (logs, network traffic, system parameters). They both try to detect incidents primarily using rules that describe what incidents are, with more and more tools appearing on the market trying to use anomaly detection. No matter the approach, those tools generate a lot of noise, visible in high amount of detections and false alarms, and often provide multiple detections of the same attack. Finally, they do not provide sufficient insights regarding security-related events they detect, resulting in attacks being overlooked by the security personnel [2]. The main problem is that attackers, while trying to achieve their goals by going through an attack scenario, often cause a lot of low-level incidents to be detected. We define an attack scenario as a partially ordered collection of attack steps or actions, such as information gathering, exploitation, malware installation, and credential misuse, which particular attackers perform in their attempt to compromise an organization. Examples of several attack scenarios can be found in [3]. IDSs can not detect such scenarios on their own, because they observe individual events and network connections, and can potentially detect attack techniques, technical errors, and anomalies they contain. An attack scenario, on the other hand, combines multiple attack techniques to reach the goals of the attacker, and usually results in multiple IDS alerts. In order to overcome those issues, approaches appeared that try to gain higher-level insights by combining multiple low-level incidents into larger attack scenarios that caused them. They work with alerts that have already been generated by an IDS component. Furthermore, when certain attack scenario is detected, it is—at least theoretically—possible to predict its future phases. Predicting future phases of attacks is usually called attack projection.
As researchers use a plethora of different success metrics and datasets to evaluate their approaches, it is not immediately clear how to compare their results and draw conclusions about them. In many cases, articles avoid using previously defined metrics and only report results using their own metric, making their results biased. The main goal of this survey is to enumerate and describe frequently used datasets and success metrics, and provide expanded comparison tables in an attempt to reduce the bias of published work in this research area.
Overall, this survey presents an overview of cyberattack scenarios’ detection and projection research and its state-of-the-art, together with an overview of the underlying concepts and practical problems. Because of this focus on high-level attack scenarios, low-level intrusion and anomaly detection methods are outside of the scope of this survey. Unlike other related surveys, this survey makes a more thorough effort of comparing the results of the various approaches and the available evaluation metrics, so the main contributions of this survey are a unified comparison of results of relevant papers and the evaluation metrics in this research area.
The structure of the paper is as follows. Section 2 gives some preliminaries by describing the goals of attack scenario detection and projection in the context of cyber situational awareness. The following section, Section 3 gives an overview of novel existing surveys in this area, which constitute related work. In Section 4, relevant evaluation metrics for alert correlation and attack scenario detection are discussed and compared. Section 5 presents some of the commonly used datasets, as well as some novel datasets that show potential, with their pros and cons. After that, Section 6 describes our methods and gives a narrative overview of selected research papers published in this area, beginning from the early, pioneering approaches, and finishing with the state-of-the-art at the time of writing. The central contribution of this paper is given in Section 7, where common evaluation measures are calculated and displayed on several comparison tables. Finally, the paper gives a discussion in Section 8, and closes with the conclusion in Section 9, followed by a list of references.
2. Preliminaries: Achieving Cyber Situational Awareness
Cyber situational awareness (CSA) is the application of the model of situational awareness (SA), elaborated in the military domain by Endsley [4], in the context of information systems. The original SA model consists of three levels: (i) perception, (ii) comprehension, and (iii) projection, and it considers SA separately from decision-making and performance outcome, as shown in Figure 1. Perception focuses on gathering elements that contribute to the current situation, upon which comprehension then builds a meaningful representation of the situation. Finally, once the current situation has been comprehended, projection aims to foresee the possible future developments of the situation and its elements [5]. Because humans have a very limited attention and working memory capacity, Endsley suggested that systems should be designed to automate some SA tasks, and fuse the numerous and diverse elements of the situation into a small and manageable number of meaningful objects [4]. This would allow human attention to shift towards the most relevant aspects of the situation, consequently improving the decision-making process.
The following three subsections describe some aspects of CSA that are closely related to the scope of this paper: (A) attack detection, (B) attack projection, and (C) the problem of uncertainty. Attack detection includes perception and comprehension, while attack projection includes the projection level of CSA. The problem of uncertainty refers to uncertainty that is present in all CSA tasks that can distort CSA and lead to misinterpretation of the current situation.
2.1. Attack Detection
The primary means of performing attack detection is via intrusion detection systems, which are in CSA considered to be a simple sensors, belonging to the perception level of CSA [6]. The first big problem with intrusion detection systems in practice is the high number of generated low-level alerts making their analysis hard [2] and prone to errors [6]. IDS systems also suffer from large false positive (FP) and false negative (FN) error rates [7,8].
The second problem is the difficulty of comprehending the alerts’ meaning and context, vital for making decisions upon which appropriate actions are taken, which is, IDSs often fail to lead to the detection of sophisticated attacks [9]. To make matters worse, the investigation of numerous false alerts, as well as the resulting quarantining of suspicious computer systems, can end up being very expensive for organizations [9]. Because IDSs generate alarms for individual events, these alarms can be grouped and analyzed to produce high-level information that is more comprehensible for personnel [6]. For example, one attack could result in numerous IDS alarms, and it would be beneficial to group those alarms according to attacks they probably resulted from [5].
Tadda and Salerno [5] analyzed the application of SA principles to the cyber domain, specifically in the detection of multi-stage attacks. They formulated the goal of CSA in cyber defense as the creation of attack tracks. Attack tracks are hypotheses of complex multi-stage attacks containing all of the supporting evidence extracted from the system’s data. Essentially, events and alerts are grouped and correlated according to a potential multi-stage attack scenario they may be resulting from.
2.2. Attack Projection
The highest level of CSA is attack projection, as summarized by Yang et al. [10]. Attack projection aims to predict the future phases of an attack by combining the observed malicious activities with the knowledge about the system’s configuration and vulnerabilities, and the attacker’s behavior patterns. In theory, taking a proactive approach and predicting the next moves of an attacker should be possible [11]. Problems that make attack projection hard in practice are sensor inaccuracy, attack obfuscation, development of new attack strategies over time, and a lack of datasets required for comprehensive evaluation [10]. Sensor inaccuracy refers to FP and FN errors, while the obfuscation and development of new attacks stem from the attacker actively trying to conceal the attack [10].
A recent survey of attack projection was made by Husák et al. [11]. In addition to attack projection, they also surveyed related tasks, specifically intention recognition, intrusion prediction, and network security situation forecasting. The task of intention recognition, as described by Ahmed and Zaman [12], focuses on estimating the ultimate goal of an attack, and as such is closely related to attack projection. Intrusion prediction [13] attempts to predict future intrusions based on the knowledge of past intrusions combined with various additional data, while network security situation prediction [14] tries to forecast the overall future tendency of the risk of the network being attacked. The tasks of intrusion prediction and network security situation forecasting are outside of the scope of this survey.
2.3. The Problem of Uncertainty
The greatest challenge in CSA, which manifests in all CSA tasks, is managing uncertainty [15], which can distort SA and mislead the interpretation of the situation [16]. One type of uncertainty stems from the lacking knowledge about existing vulnerabilities and the chances of their exploitation, which also includes the security awareness of the organization’s employees, depending on which they could be more or less susceptible to social engineering [15]. Li et al. [15] refer to this type of uncertainty as static uncertainty. In contrast, dynamic uncertainty occurs as a consequence of attackers actively trying to avoid detection, and manifests itself during the intrusion, making the attack very hard to detect and trace, as well as after the intrusion has ended during analysis and forensics. They argue that cyber defense systems must employ approaches that can deal with the all-present uncertainty, such as e.g., Bayesian networks, and that deterministic approaches, such as attack graphs, are not well suited for practical use in intrusion detection and response.
3. Related Work
There are several relevant surveys regarding cyber-attack detection and prediction. In this paper, we have chosen three recent surveys that we perceived as being of high quality, as related work. Table 1 gives an overview of those surveys with regard to their scope, classes of methods and systems they proposed, presented insights to evaluate efficiency, and some of the open research problems that their authors identified. We also elaborate the differences between our survey and four other surveys later in this section. It is important to note that surveys of low-level intrusion and anomaly detection methods that do not deal with high-level scenarios of attacks are outside the scope of this survey.
Salah et al. [17] proposed a classification of various products that implement alert correlation capabilities, such as IDS, Security Information, and Event Management (SIEM) systems, and network management tools, with regard to the number of different information sources that they use, type of application, correlation method, and their architecture. Depending on the architecture, they can be either centralized, decentralized, or hierarchical. Information sources discriminate between systems using single and multiple source types. Correlation methods are given in Table 1. Information source types that they reviewed are the following:
- alert database containing alerts from low-level sensors such as Network Intrusion Detection Systems (NIDS) or Host Intrusion Detection Systems (HIDS);
- topology information, such as hosts, connectivity, etc.;
- vulnerabilities database, e.g., Common Vulnerabilities and Exposures (CVE) database;
- trouble ticketing system information;
- ontology database, with domain semantics that can be used for automatic inference;
- cases database, containing rules for associating alerts with common and known problems; and,
- knowledge representation, rules and models either put together by experts or inferred from datasets, which are used for correlating alerts.
Finally, they proposed an alert correlation process model that consists of four phases: (i) alert preprocessing, () alert reduction, () alert correlation, and () alert prioritization; and made an analysis of various products with regard to the proposed dimensions. Our survey differs from this survey in that, while they focus on correlation systems’ architecture, we focus on success metrics and compare the approaches’ results.
Hubballi et al. [18] focused on the approaches for reducing false positive alerts, and gave a broader view and classification than the survey mentioned earlier. This survey also gave an overview of the use of the various techniques in commercial SIEM systems together with their performance scores. This survey focuses on approach classification and determining the pros and cons of various classes, and unlike our survey, does not deal with results of their evaluation.
Husák et al. [11] has the closest scope to the scope of this paper. They analyze attack projection, attack prediction, intention recognition, and network security situation forecasting. In contrast to the previously listed surveys [17,18], this survey gives a summary of the results from the published approaches, but, unlike our survey, does not examine those results and limits itself to a small set of metrics. Additionally, Husák et al. [11] analyze several novel proposals that we omitted here, most of which are either out of scope of our paper or use their own datasets or evafluation. The readers are encouraged to refer to Tables 2–5 in that survey for an overview of evaluation details for papers that are not covered here. Their survey also includes attack projection related research and concludes that it has seen much less research than attack detection [11]. Husák states that the main research trend in this area is using methods, such as e.g., data mining, in order to discover new attack patterns from datasets. It is also worth mentioning that Husák in [19] already did some work consistent with that trend. Finally, one of their conclusions was that approaches published in modern papers support real-time operation, while the older ones did not focus on it as much.
There was also a recent survey by Navarro et al. [20], which focused on problems of reproducibility and replicability, and the properties of datasets the approaches used. Although they covered a large number of papers and datasets, they did not deal with evaluation metrics and results. An older survey by Mirheidari et al. [21] examined the properties of different classes of algorithms used in alert correlation, such as their memory requirements and ability to identify false positive detections and previously not seen attacks, but did not examine and compare individual approaches and their evaluation methods.
We also found several surveys regarding collaborative intrusion detection systems (CIDSs), such as [22,23], but these primarily focus on correlation and integration of alerts from distributed intrusion detection sensors with the goal of detecting coordinated distributed attacks, rather than reconstructing attack scenarios.
Although the surveys differ in scope and depth, a large portion of each focuses on the same set of problems common to attack detection and projection. Various authors came to similar conclusions about the articles published in this area, especially with regard to the open research questions. The recurring themes are the lack of proper evaluation methods and success measures, low quality of available datasets, bad performance in practical operation, scalability issues, as well as the detection of unknown attacks. Problems with performance in practical application and the discovery of unknown attacks could stem from the flaws in the way that the attacks and attackers have been researched and modeled, and further research on attackers’ behavior could result in better models and improvements in the aforementioned areas.
This survey selects representative papers regarding attack scenario detection and projection, and it focuses on presenting their crucial points and practical aspects. Our methods are described in Section 6.1. Unlike the other related surveys identified in this section, this survey makes a more thorough effort of comparing the results of the various approaches and their evaluation methods in the context of situational awareness. This also includes the comparison of approaches over several datasets and success metrics, which was not provided by any of the other surveys reviewed in this section. Finally, our survey contains several recent approaches that were not included the surveys above. The details of our contributions are further discussed in Section 7.
4. Evaluation Metrics
Metrics for cyberattack scenario detection are needed in order to compare the success of various approaches. Because the problem is not a simple matter of TP and TN errors, like in low-level intrusion detection, each of them measures the success in terms of achieving a goal and poses a certain research challenge. This section gives an overview of some of the proposed metrics for cyberattack scenario detection. Similarly to FP and FN errors in low-level intrusion detection, Tadda and Salerno [5,24] defined success metrics in the context of systems providing high-level CSA. These metrics are divided into confidence, purity, cost utility, timeliness, and effectiveness metrics, and share similarities with success metrics used in data science. All of them rely on the notion of attack tracks described earlier. However, the survey of the representative papers has shown that, out of those metrics, only the confidence metrics, namely precision, are somewhat used in practice. This can be seen in Table 2, where the metrics usage frequency among the surveyed articles is shown.
Confidence metrics score the detection of real attack tracks. Tadda and Salerno define four confidence metrics: recall (1), precision (2), fragmentation (3), and mis-association (4).
In expressions (1)–(4), known attack tracks (KAT) are the attack tracks labeled in the dataset as the ground truth, detected attack tracks (DAT) are those detected by the system, correct detections (CD) are detected attack tracks that are at the same time known attack tracks, and fragments (F) are detections that should have been detected as a part of a larger attack track.
In expressions (5) and (6), correlated alerts (CA) are alerts that the system classified as part of the attack tracks, related alerts (RA) are alerts that belong to the real attack tracks in the dataset, and correctly correlated alerts (CCA) are alerts classified into correct attack tracks [34].
Yu and Frinckle [41] used a metric that aims at scoring the quality of the alerts that are produced by alert correlation systems from the viewpoint of the security analyst, called the Quality of Alers (QoA) (7).
In expression (7), FP is the number of the false positive alerts generated by the system, FN is the number of the false negatives, RT is the number of repeated true alerts, and TA is the number of real intrusive actions [41]. To the best of our knowledge, only Yu and Frinckle use this metric, but it nonetheless captures important information regarding the evaluated system, and calculating it for other papers is possible. It is worth noting that this measure is high if the number of errors produced by the system is low, but also indicates that the number of repeated true alerts should be low.
Some authors, such as [27], aim at minimizing the number of alerts, and measure the amount of reduction between the original number of alerts and the number of new, often high-level alerts, which result from the alert correlation systems. Although this type of reduction measurement (8) is common among most of the surveyed papers, some of them, such as [39,40], use another variant, called episode reduction, abbreviated here as ER (9).
In [39], episodes are mined collections of alerts that could potentially represent multi-step attack scenarios. Episode reduction in those papers refers to filtering out meaningless episodes and benign episodes. In addition to episode reduction, the papers [39,40] also use other episode-related metrics, but as they are highly dependent on the methodology and circumstances, they cannot be directly used for comparison with other papers.
Another evaluation metric used in attack projection, such as in the approach that was proposed by Fava et al. [42], is the ratio of correct predictions of the next scenario steps. Farhadi et al. [43] went for a more loose approach, in which they also measured the ratio of predictions in which the real next attack scenario step was one of the two predicted as most probable. Approaches that include an implementation, such as e.g., Wang et al. [44], often benchmark performance in terms of latencies on expected real-time load. In-depth comparison of attack projection metrics and evaluation results will be left for future work.
Some metrics above are representations of other metrics used in artificial intelligence, with a difference in their semantics. (5), for example, is equivalent to another commonly used metric, the true positive rate (TPR), with the main difference being that is specialized for alerts and attack tracks. The equivalence becomes evident when CCA in (5) is replaced with TP, and RA with (TP+FN), which results in the TPR formula. Precision defined in (2) is a variant of the commonly used precision metrics, which is evident when CD in (2) is replaced with TP, and DAT with (TP+FP), resulting in the common precision metric. is also equivalent to precision, which again gets obvious when CCA in (6) is replaced with TP, and CA with (TP+FP). The difference between (2) and (6) is that (2) measures precision of attack tracks, while (6) measures the precision of assigning alerts to attack tracks.
Because most surveyed papers contain information regarding their alert and attack counts, it is possible to calculate completeness, soundness, and QoA metrics that can be used for comparison over a common dataset, regardless of the metrics used in the original papers. It is also possible to compare the reduction metrics, but these metrics lack deeper insight and should be used alongside other criteria. Any special considerations regarding success metrics will be discussed alongside the datasets and approaches in question in Section 5 and Section 6.
5. Evaluation Datasets
Measuring the performance and effectiveness of different approaches the key is to have good datasets. When different methods are evaluated against the same dataset then they can be easily compared while using the same success metrics. Yet, the nature of the attacks is such that a single dataset is not sufficient and there are a number of different datasets available each with their own advantages and disadvantages. Different attack and normal data used in different datasets make a comparison between methods tested on different datasets difficult and not worth doing. To make things more complicated, a number of papers use custom datasets that are not used by anyone else. In the following subsections, we provide an overview of some commonly used datasets across the reviewed papers, as well as some new datasets that appeared recently.
5.1. Darpa Intrusion Detection Evaluation Datasets
The first widely used dataset for IDS evaluation is DARPA1998, published by the MIT Lincoln laboratory in 1998. This dataset was originally used to evaluate intrusion detection systems in the Air Force Research Laboratory (AFRL). The dataset was generated using a simulated network and contains a mix of normal network activities and attacks. It is divided into a training set containing seven weeks of traffic and a test set of two weeks of traffic (MIT Lincoln Laboratory, 2019). All of the attacks in the dataset are labeled. The 300 simulated attacks that appear in the dataset are described in detail by Kendall [45] (Kendall, 1999). In 1999, a newer and improved version of the dataset was created, called the DARPA 1999 [46].
In the aftermath of the Wisconsin Evaluation Rethink workshop in 2000, and the subsequent meetings, the MIT Lincoln Laboratory produced a new dataset containing two DDoS attack scenarios, called the DARPA 2000 [3]. The first scenario, LLDOS 1.0, features a novice attacker performing a DDoS attack in several phases, beginning with the initial probing of the network from the internet, and ending with the abuse of an existing service to perform a DDoS attack. The second scenario, LLDOS 2.0.2, features a slightly stealthier attacker performing the same attack using a malware. As the two datasets hold information about attack scenarios, they are popular for evaluation of tasks, such as alert correlation and attack projection.
5.2. Def Con Ctf Datasets
Alongside annual DEF CON conference [47], a popular international capture the flag (iCTF) cybersecurity competition is held. After each competition, the organizers publish the collected network packet captures containing attack traffic, which researchers can use to analyze attacks and discover attack patterns. The packet captures are published on the DEF CON CTF web site [48]. A notable property of CTF datasets is that the vast majority of their traffic is attack traffic, as opposed to benign traffic in other datasets [49].
5.3. Cyber Treasure Hunt Dataset
Vigna [50] organized several cybersecurity exercises in order to evaluate students, one of which was a treasure hunt competition. The students were split into teams and tried to attack a simulated payroll system by following provided step-by-step instructions with the goal of performing malicious money transfers [50]. The students were required to document the details of the attacks, and network traffic was collected, resulting in a dataset containing labeled multi-step attack scenarios [51].
5.4. Unb Datasets
Because of the significant changes in network usage patterns since the age of DARPA datasets [49], as well as the criticism surrounding those datasets [52,53], the Canadian Institute of Cybersecurity (CIC) created several novel IDS/IPS datasets (University of New Brunswick—Canadian Institute for Cybersecurity, n.d.) that are still not much used. The first dataset ISCXIDS2012 was created in 2012, using simulated agents developed to mimic previously observed user behavior patterns in the Institute. Shiravi et al. [54] provided the detailed description of this dataset, as well as the guidelines and requirements for creating valid and realistic datasets. The main requirements can be summarized, as follows: (i) network traffic should not be modified after the capture has finished, (ii) the data should be labeled automatically during its creation, (iii) the capture should contain the entire network interactions and diverse intrusions, and (iv) the simulated data must eliminate the need for later sanitization and anonymization.
5.5. Other Datasets
The previous datasets are either heavily used by researchers, or they show a good promise as is the case with CICIDS2017. There is a number of other datasets used less frequently than the previous ones, but still interesting enough to be mentioned. One example of such datasets are the DARPA Grand Challenge Problem (GCP) datasets, which are used in four surveyed articles, but to the best of our knowledge are not publicly available.
Some datasets are collected while using honeypots. Honeypots are network decoys that are used to lure attackers and observe their actions [56], whose entire network traffic is, by definition, malicious. Thus, logged honeypot traffic can be used to research attackers and attack patterns. The next source of attack data comes from simulated attack scenarios in which a number of researchers pretended to be attackers and perform attacks, resulting in custom datasets. In both cases, honeypots and simulated attacks, it is frequently the case that the authors do not publish much details of the attacks that happened nor datasets used, hindering the reproducibility of their research.
An overview of several other notable intrusion detection datasets was given by Gharib et al. [49]. Besides the already mentioned, they reference the CAIDA, LBNL, CDX, Kyoto, Twente, UMASS, and ADFA datasets, each with its advantages and weaknesses. A plethora of additional datasets is available throughout the internet, e.g., packet captures [57]. In the authors’ opinion, these datasets are usually highly specific and, in most cases, not well fit for intrusion detection evaluation and learning.
5.6. Criticism of Existing Datasets
McHugh gave an extensive critique of the DARPA datasets in 2000 [52], mainly focusing on the suitability of its data and the simulated environment used to create it for intrusion detection evaluation. He argues that the dataset contains biases, with the major ones stemming from the employed attack taxonomy, which concentrates on the attacker’s viewpoint, ignoring the viewpoint of the IDS, and the simplistic false positive based receiver operator curves (ROC) used to present results, making them a nonrealistic general measure of success. Specifically, DARPA ‘98 was synthesized without deeper insights regarding the causes of real-word false positive alerts and lacks realistic statistical properties [52]. Further analysis performed by Brown et al. [53] confirmed that its statistical properties significantly differed from those expected in a real network.
Gharib et al. [49] analyzed and compared 11 commonly used datasets in 2016 using the dimensions they proposed, and came to the conclusion that all of them had severe weaknesses when it comes to traffic completeness. Most of them failed at either providing diverse attack examples, a sufficient variety of protocols, adequate data labeling, a good feature set, etc. For detailed information, readers are encouraged to examine Table 3 in their paper [49]. The authors also state that datasets should be produced in a dynamic manner, so they can be periodically updated to reflect changes in attack and network traffic patterns over time. Finally, they proposed a weighted ranking framework for the datasets based on the proposed dimensions.
6. Survey of Developments in Attack Scenario Detection and Projection
This section provides an overview of the developments in attack scenario detection and projection, beginning with early approaches in the 1990s, towards the state of the art approaches at the time of writing. The overview only examines the most important points of the articles, as perceived by the authors of this survey.
6.1. Methods
Surveyed articles were chosen in the following manner:
- Three Google Scholar and Scopus searches were performed, using the following keywords: “attack scenario detection alert correlation”, “attack scenario reconstruction alert correlation”, and “attack scenario projection alert correlation”.
- A table containing 300 articles was populated while using the top 100 articles returned by each Google Scholar search.
- We sorted the table by four criteria, each time listing the first 25 results whose titles and abstracts fell within the scope of the survey. The first criterion was the total number of citations, in order to find the most influential papers. The second criterion was the number of citations divided by the age of the paper, in order to find more recent papers that gained traction. The third criterion was the rank that the Google Scholar search yielded, used to measure the relevance of the paper. Finally, as we noticed the lack of newer papers on the list, we added a fourth criteria, which filtered out all papers older than 2015, and sorted the remaining papers using their Google Scholar ranks. At this point, the list contained 100 article mentions.
- All 23 articles ([25,26,31,32,33,34,38,58,59,60,61,62,63,64,65,66,67,68,69,70,71,72,73]) that appeared more than once on the list were considered for inclusion in the survey. Additionally, [35,36] were included, because, although each of them appeared only once on the list, they were in essence representing the same approach. Porras et al. [58] was excluded because it primarily concerns with mission impact and elimination of duplicate and false positive alerts, and not attack scenarios. Hossain et al. [59] were excluded, because they primarily focus on detecting low-level attacks on a single host. Pietraszek et al. [71] was excluded, because they primarily focused on reducing false-positive IDS alerts.
- The steps described above were repeated using Scopus searches with the same search terms. While the first search returned the target 100 results, subsequent searches only found a handful of articles. In this manner, additional 9 articles ([29,30,88,89,90,91,92,93,94]) were found and considered for inclusion in our survey. Alhaj et al. [92] was excluded because their goal is correlating alerts into individual attack steps, but they do not reconstruct the high-level attack scenarios, effectively performing alert aggregation.
- Finally, four articles were included on an individual basis. Huang et al. [95] was included, because it considers operational planning of attacks. Yu and Frincke [41] was included, because it introduced an expressive metrics, Quality of Alerts (7). GhasemiGol and Ghaemi-Bafghi [27], and Albanese et al. [96] were included due to using approaches whose types were underrepresented.
The annual distribution of surveyed methods and papers is shown in Figure 2. Interestingly, we noticed that older methods (i.e., [31,32,33,34]) were published while using a larger number of papers, with later papers extending and updating the originally presented method, while newer methods (i.e., [73]) are usually published using one or two papers. This can be seen as the difference between the numbers of papers and methods in Figure 2, especially noticeable between the years 2001 and 2004. It can also be observed that scientific production in this field peaked in the early 2000s, followed by research at a slower pace thereafter.
It should be noted that this method contains biases, as it only covers sources that are written in English and discriminates against articles on the basis of quantitative measures rather than their actual quality. Each article we surveyed is biased because it evaluates its approach using only a subset of datasets and success metrics. Our main goal in this survey is to try to expand this subset and quantify their individual bias. In Section 7, we collected the original counts of alerts from the papers and calculated commonly used success metrics described in Section 4 in order to provide a more complete comparison of the approaches’ results.
The approaches are split into several subsections according to their similarities. On the highest level are three subsections: State transition analysis technique (Section 6.2), Event and/or Alert Correlation Relying on Expert Knowledge (Section 6.3), and Event and/or Alert Correlation Relying on Data Mining and Machine Learning (Section 6.4). The first deals with older approaches, based on explicit attack scenario signatures, the second with approaches that do not describe explicit attack scenarios, but use some sort of rules to build attack scenarios, and the third with approaches that use machine learning, often combined with rules, to build attack scenarios.
6.2. State Transition Analysis Technique
Early research efforts in attack detection aimed to develop easy to understand and efficient ways of describing attack signatures independently of the underlying audit data formats, and flexible enough to cover the majority of possible attack scenarios. Several of these relied on describing low-level attack scenarios while using the state transition analysis technique (STAT). STAT defines a state machine with an initial state, transition states, a target state, and signature actions that trigger transitions between states [8]. Once event logs are transformed into a state transition diagram, the diagram can be compared with transition diagrams for known attacks. Approaches, such as these work directly with audit data, such as event logs, as opposed to latter approaches working on top of alerts generated from IDSs.
Ilgun et al. [8] proposed USTAT, a HIDS that is based on STAT, with the U in the abbreviation indicating that it is a UNIX-based STAT prototype. In USTAT, low-level attack scenarios are described using state machines that end in compromised states. States are logical expressions parametrized by the system’s attributes. Directed edges, called transitions, connect states that start with state being a precondition and end with a state being post-condition. Transitions are triggered when signatures of possibly malicious activities are detected, causing the state machine to enter a new state describing the expected resulting changes to the environment. As audit data enters USTAT, it performs state transitions, which are then analyzed by its inference engine. If the inference engine recognizes a described attack sequence, USTAT acts as an IPS, taking the action that is specified by its rules. USTAT was only able to recognize changes in known attributes in the system, ignoring any outer entities, such as users, and they could describe and recognize only explicitly specified scenario variant patterns inside the collected audit data. It was validated and compared to other tools while using a list of defined requirements for such tools.
Eckmann et al. [86] proposed a STAT based attack detection language called STAT language (STATL), a STAT based attack detection language, which is independent of the underlying IDS and provides performance enhancements over USTAT. The language compiles into rule formats for supported HIDSs and NIDSs, such as e.g., USTAT, NetSTAT, and WinSTAT, extended with applicable USTAT plugins. The authors validated STATL’s expressiveness by describing 48 different attack scenarios for various IDSs. They successfully described all of those 48 attack scenarios while using STATL.
6.3. Event and/or Alert Correlation Relying on Expert Knowledge
Research soon focused on intrusion detection on a higher level. Instead of analyzing audit data and raising low-level alerts, some researchers began combining the already generated alerts and additional data from various sources into plausible larger-scale attack scenarios. Huang et al. [95] made an analogy of intrusion detection and response to military operations. In military operations, commanders need to have some hypothesis regarding the adversary’s operational and strategic goals to decide on a proper reaction to his actions discovered on the tactical level, such as e.g., troop movements. In cybersecurity, low-level alerts, which could likely be FP or represent irrelevant attacks, do not provide the bigger picture and the higher-level insight that is needed to make decisions. Nevertheless, they can be combined to uncover possible attack strategies on the operational and strategic levels, which provide a deeper understanding of the current system state. Additionally, sensors that are based on different rulesets and detection types, especially if distributed over different parts of the network, offer diverse viewpoints on the information system, and should be used in a complementary manner [63].
6.3.1. Alert Correlation Based on Alert Attributes
Huang et al. [95] proposed a collaborative server-client IDS focused on the attacker’s higher-level strategies, mimicking military operations. The server collects alerts from the clients and hypothesizes about the possible large-scale attack strategy. Clients are informed of the hypothesis and they build a goal tree based on domain knowledge to check whether the detected alerts could prove it. Goal trees hold a hierarchical representation of an actor’s goal with the combination of sub-goals the actor used to achieve it. Finally, they send the evidence and detected low-level goals to the server, so it can adjust and possibly form a new hypothesis. The authors identified that further work needs to be done in detecting the attacker’s decoy attacks and adding probabilities to the goal tree.
Valdes and Skinner [25,85] proposed a probabilistic alert correlation approach based on attribute similarity. A similarity function and a threshold are defined for each alert attribute, as well as the situation-specific similarity expectation, correcting that similarity for some specific situations, such as e.g., IP spoofing. Similar alerts from various sensors are grouped into meta-alerts, containing lists of original attribute values. Evaluation was performed while using recorded live data, where the number of generated alerts was reduced seven times, and by performing experiments over a simulated e-commerce network, where the approach managed to reconstruct the basic steps of the attack scenario as meta-alerts.
Morin et al. [62] proposed a formal model for cyber security, called M2D2. The model introduces relations between information system characteristics, vulnerabilities, security tools (e.g., IDS), and events. Network topology is described using a hypergraph in which nodes represent network interfaces, while edges, which can connect more than two nodes, represent networks. Data is mostly populated from available databases, such as e.g., ICAT vulnerability database, but parts such as topology information must be entered manually. The model can be used for aggregating alerts and determining causality relations between them. An improved version, M4D4 [80], added support for various new network device types, and describes a higher-level attack nomenclature using graphs. At the time of publishing, the authors were working on a proof-of-concept M4D4 Prolog reasoning engine, integrated into an information system to aid in alert correlation. Because M2D2 and M4D4 were developed to describe networks ad attacks, the authors validated the models by describing several situations and use cases.
Morin and Debar [61] combined M2D2 [62] with the formalism of chronicles [97] in order to describe benign and malicious scenarios as chronicles using expert rules with temporal constraints. Benign chronicles contain false positive alerts, while malicious chronicles contain alerts and events related to recognized attack scenarios. M2D2 correlates alerts with chronicles into high-level alerts and security operators are presented with high-level alerts and alerts that do not belong to a chronicle, resulting in an alert reduction. The approach was validated while using recorded logs of alerts from a real network.
Qin and Lee [68] correlate alerts into attack scenarios that are based on the Granger Causality Test (GCT). This test aims to check whether lags between events in a time series could indicate a causality relationship between them. The authors construct ordered sequences of alerts, called hyper-alerts, based on feature similarity and prioritize them using a manually configured Bayesian Network. Prioritized hyper-alerts are presented to security analysts. When they choose to investigate a hyper-alert, the approach searches for other causality related hyper-alerts via GCT, potentially revealing neighboring steps of the attack scenario. The approach was evaluated while using Grand Challenge Problem (GCP) v3.1. and DEFCON 9 datasets. On the GCP dataset, they scored reduction, completeness, and soundness of , , and , respectively, while, on the DEFCON 9 dataset, they achieved alert reduction of . They identified missed IDS alerts as the main limiting factor of their approach. In [69], the authors improved alert prioritization by including a knowledge base containing information regarding the surrounding network assets, and added an auxiliary method of alert correlation based on a knowledge base containing known attack plans.
Valeur et al. [26] correlated alerts and used alert verification to identify failed attacks. e.g., if an attempt of a service exploit over a machine is detected, and that machine does not run or expose the targeted service, then that attack was a failure. This is done actively, while using a vulnerability scanner script executed each time an exploit alert is reported. Unfortunately, active alert verification has drawbacks regarding system performance and can produce alerts as a side effect. Related alerts are merged into a hierarchical tree of meta-alerts, alerts on a higher level of abstraction, according to common attribute values and a sliding time-window. The next stage of the proposed system is attack focus recognition, aiming to discover hosts that are often sources or destinations of attacks. Finally, high-level multistage attack scenarios are detected by matching chains of alerts to predefined attack scenarios described while using STATL, and displayed as graphs to the operators. Additional tools that are offered by the system are impact analysis, which follows dependencies within the system and tries to determine the full impact of an attack, and alert prioritization, assigning priority values to alerts. Evaluation of FP alert reduction was performed on several datasets, including DARPA, Honeypot, DEF CON CTF, and the Treasure Hunt dataset, as well as live data from the Rome Air Force Research Laboratory’s networks.
Barzegar and Shajari [38] converted each alert into an ontology according to its attributes. Alerts were considered to be neighboring steps of the attack if the ontology similarity according to their proposed measure was larger than a set treshold. The approach was evaluated using DARPA 2000 LLDOS 1.0 and MACCDC 2012 datasets. On DARPA 2000, it correlated alerts into four groups, three corresponding to parts of the attack scenario and one to false positive alerts. They provided completeness and soundness measures over only a subset of this dataset, and did not address the fragmentation of the reconstructed scenario, so we excluded those results from Section 7. The depictions of their latency results lack concrete time units and they seem to grow at least polynomially with the number of alerts, so we do not consider this approach to be applicable in real time.
6.3.2. Preconditions and Post-Conditions
As noted by Cheung et al. [67], low-level intrusion detection approaches relying on signatures, such as e.g., STATL, lack the flexibility to be used in order to describe high-level scenarios in a way that could support all their equivalent variants. They concluded that this lack of flexibility is addressed using the precondition and post-condition approach, in which scenarios are assembled from individual attacks by matching their preconditions and post-conditions.
Cuppens and Ortalo [81] proposed a language for describing cyberattacks, called LAMBDA. The language represents attacks using attacker actions defined through their preconditions and post-conditions, as well as their detection actions, describing steps needed to detect the action, and verification actions, describing the steps needed to confirm that the attack succeeded. The later can e.g., refer to determining that a vulnerable service is running on the target machine. In addition, the language defines event combination operators in order to specify ordering of events required for an action to be recognized, including e.g., parallel and sequential ordering. Attack actions can be combined if post-conditions of one action satisfy parts of the preconditions of the other. Cuppens and Miege [60] later used LAMBDA in the MIRADOR project to automatically generate a set of correlation rules from the described attacks. LAMBDA was validated by describing various attacks and situations.
Templeton and Levitt [82] introduced the model JIGSAW, which models attack scenarios while using attack actions with required capabilities, conceptually the same as preconditions, and provided capabilities, similar to post-conditions. Capabilities are atomic objects that describe the state of the system, and alongside technical attributes describe the attacker’s knowledge about the system and policy statements. They proposed use cases for the model in tasks, such as e.g., FP reduction, attack detection, and attack projection. Finally, they identified attack generation, formal theory of attacks, and attack nondeterminism as future research problems, and stated that models based on signatures and exploits do not generalize well. Similarly to LAMBDA, they validated JIGSAW by describing several examples of attacks.
Cuppens et al. [83] distance themselves from earlier works using explicit scenario specification, and concentrate on using plans and objectives to detect attack scenarios. Action preconditions and post-conditions are still defined while using LAMBDA, but they are not combined according to a pre-defined scenario. Instead, actions are treated as possible stepping-stones that lead the system to a state in which some given security properties have been compromised. The authors added a concept of virtual alerts, as placeholders to support possible attacker’s actions that were not detected, but are nonetheless required for the scenario. The article validates the proposed approach by describing example attack scenarios.
Ning et al. [31,32,34] and Ning and Xu [33] developed an alert correlation model and several alert analysis tools. The model shares similarities with JIGSAW and LAMBDA, since it describes attack scenarios while using the same precondition and post-condition paradigm, but it also presents a concrete alert correlation method. Alerts are mapped one-on-one to entities, called hyper-alerts, which are then correlated using partial preconditions and post-conditions that are specified by experts. Only a partial match of the conditions is required, because alerts corresponding to some preconditions required for later scenario steps could be missing (e.g., FN alerts). Correlation results in connected directed acyclic graphs (DAGs) of hyper-alerts representing possible attack scenarios. The authors later added concepts supporting attack strategy detection, by defining a measure of similarity of the previously generated DAG with known scenarios that are defined in the form of attack strategy graphs, and developed the toolkit TIAA for alert analysis. Attack strategy graphs are automatically built by generalizing already seen hyper-alert correlation graphs and extracting rules. Finally, they evaluated the method while using the DARPA 2000 dataset, and reported completeness scores between 62.5% and 94.74% and soundness scores between 92.3% and 100%, depending on the subset of the dataset.
Cheung et al. [67] proposed the Correlated Attack Modeling Language (CAML), based on the precondition post-condition paradigm. Unlike previous similar work, they primarily focused on modularity, and developed the language to describe modular scenarios. The main idea is that higher-level scenarios can be executed while using a combination of various lower-level scenarios, with the lowest level being individual attack steps. They validated a prototype by compiling the language to P-BEST expert rules [98], and then tested them on the DARPA Grand Challenge Problem (GCP) v2.0 dataset.
Ning et al. [66] argued that a major drawback of earlier precondition and post-condition based approaches is that they have problems with handling missed alerts. They proposed several techniques that combine the hyper-alert correlation graph generated while using approaches, such as Ning’s earlier work with graphs generated by techniques relying on alert attribute similarity and audit trails to complete the correlation graph. Two graphs are combined while using a set of proposed rules. They validated the proposed techniques while using the DARPA 2000 dataset, on which only one of the attacks had miscorrelated alerts.
Saad and Traore [35,36] introduced an ontology-based technique for semantically clustering alerts into attack scenarios. The proposed ontology contains various alert attributes and context information. For clustering, the semantic relevance between two alerts is calculated as the normalized sum of the weights of ontology relations occurring between them, resulting in an alert correlation graph (ACG). The ACG is then clustered into subgraphs that represent possible attack scenarios. Finally, causality relations between alerts of a possible attack scenario are determined using prerequisites and consequences of attacks stored in the ontology, resulting in an attack scenario graph. Evaluation was performed on the DARPA 2000 dataset, which resulted in soundness and completeness between 96% and 100%. As no details about counts of various alert classes are available in the paper, it was not possible to verify or revise these scores. The authors intended to continue improving the ontology relations, use machine learning to reduce FP alerts, and research attack-pattern similarity. They considered the latter very challenging, because the available datasets were very limited and outdated.
Milajerdi et al. [73] developed a system that contains a high-level host-based IDS component and an alert correlation system that builds high-level attack scenarios. The IDS component is based on high-level signatures that detect the attacker’s tactics, techniques, and procedures (TTPs) from system events. Detected TTPs are then correlated into high level scenario graphs (HSGs) using prerequisites based on the Mandiant Attack Lifecycle Model [99] and information flows between them. After additional preprocessing, HSGs are classified using estimated overall TTP severity scores into malicious attack scenarios and benign episodes. The approach was evaluated while using recorded traffic from a DARPA-organized red team exercise [100] and a live red team engagement over a simulated enterprise network. In both instances, it scored very high accuracy and recall rates in attack scenario detection. For the first experiment, both rates were .
6.3.3. Attack Graphs and Trees
Goldman et al. [84] and Geib and Goldman [75] proposed an IDS extension system, called SCYLLARUS, for attack plan recognition and projection. The system has a hierarchical plan library in which higher-level plans can be decomposed into a partially ordered series of lower-level plans. Top-level plans are complete attack scenarios, executed with concrete attacker goals. The system analyses IDS alerts, according to them, tries to determine the likelihood of a plan being executed, and provides information about probable next targets according to that plan for taking proactive measures. They evaluated the prototype of the first version of SCYLLARUS using a custom attack simulation dataset.
Hughes and Sheyner [74] describe attack scenario graphs, graphs that are based on vulnerabilities and exploits representing stages of possible attack scenarios reaching a target asset, and the possible usage of such graphs in a model for threat mitigation. Attack scenario graphs can be used in order to predict possible future steps of attacks. They validated the model by demonstrating several usage examples.
Noel et al. [79] used attack graphs that were constructed offline to correlate events into attack scenarios in real time. Events are matched to exploits on the attack graph, and a new weighted graph, the event graph, is constructed with edge weights representing event distances on the original attack graph. Event distances are used to calculate the measure of correlation of the observed sequence of events to the scenario represented by the attack graph. The approach was validated while using several practical experiments. The first experiment proved that the approach could filter out attacker’s actions based on preconditions and post-conditions. The second experiment, which contained seven attack scenarios mixed into a custom dataset, was used to tune and analyze hyper-parameters. Finally, the third experiment, in which they mixed 10,000 attack-scenario and other event-related alerts into a custom dataset, analyzed the system’s performance when confronted with larger number of alerts. The authors claimed that all 10,000 alerts were correctly identified by the system, but did not provide details regarding the alert counts.
Wang et al. [44,65] concentrated on addressing performance issues of attack graphs in real-time application. They proposed the queue-graph data structure, which only correlates the latest instances of alert types, to increase alert correlation performance, and performed aggregation over indistinguishable transitive alerts to produce a more compact graph. The approach also hypothesizes about missing alerts and predicts possible future attack steps. Alert correlation was validated using the DARPA 2000 dataset, but, besides a high-level overview and the claims of it being satisfactory, no additional results were presented [44]. Real-time performance was validated using the Treasure Hunt dataset [44].
Liu et al. [37] use attack patterns, described using proposed models called attack path graphs (APGs), in order to describe the attack phases an attacker has to make to reach his goal. The high-level attack pattern graph starts with a probing phase, continues with the scanning and intrusion phases, and ends with the goal phase. Alerts are correlated while using the edges of the APG for each source and target host, and an attack graph is constructed by aggregating APGs based on the attackers and victims. The approach was evaluated using the DARPA 2000 dataset, with a reported completeness measure of 100% and soundness measure ranging from 98.3% to 100%. Using the original counts from the article [37], we calculated the measures from scratch, resulting in lower scores than provided in the original paper. The revised scores are available in Section 7 and the explanation in Section 8.
Roschke et al. [29] improved upon the work in [65] by using explicit attack graph-based correlation and considering a larger number of alerts with the same type when building attack scenarios. Explicit correlation aids in forensic analysis, while the consideration of multiple alert type instances enables the detection of a larger number of similar attack scenarios. The method was evaluated over a custom dataset containing recorded university network traffic and simulated attacks. It managed to detect the simulated attack scenario and reduced the number of reported alerts by at least .
Ahmadinejad et al. [91] developed a hybrid approach that combines attack graphs that were constructed for the target network and alert feature similarity. Alerts for known attacks are correlated using the attack graph, with hypothesized unknown attack steps inserted into the graph in situations when the attack sequence on the graph is inconsistent, while alerts representing unknown attacks are grouped according to their feature similarity into collections that the authors refer to as hyper-alerts. Evaluation was performed over the DARPA 2000 dataset and several other synthetic datasets. The methods successfully reconstructed the attack scenario while providing sufficient performance for real-time operation. Although the results on the DARPA 2000 dataset indicate the accuracy and recall of , the authors never explicitly state this and do not provide sufficient quantitative success metrics, so we only managed to calculate the alert reduction of .
Albanese et al. [89] proposed a system that correlates alerts into attack scenarios while using a generalized dependency graph (GDG) and a probabilistic temporal attack graph (PTAG). The GDG describes the dependencies between IT resources and services provided by the organization, while the PTAG is an attack graph that contains temporal distributions for the delays between consecutive attack steps. The construction of these graphs requires a considerable amount of manual work. After the attack scenarios have been constructed, the system attempts to predict the most probable next attack steps using probabilities from the PTAG and their overall impacts on the system calculated from the GDG. Evaluation over synthetic attack graphs has shown that the system is able to perform in real time.
A later paper by Albanese et al. [96] presented a method for identifying sequences of events or alerts that are poorly explained by existing attack patterns in the knowledge base, and could potentially represent novel attacks. The method conceptually resembles anomaly detection and it is applicable to both IDS signatures and alert correlation, where high-level attack patterns are described using i.e., attack graphs. An evaluation on the IDS level was performed using two days of recorded traffic. However, the use case with high-level attack scenarios was not evaluated, hence the minus (−) sign in Section 7.
6.4. Event and/or Alert Correlation Relying on Data Mining and Machine Learning
Many of the surveyed later works criticized approaches relying on pre-defined knowledge and parameters, because they only worked well with pre-defined scenarios and could not detect previously unknown attacks. Recent research in this area aims at employing machine learning and data mining, often with specialized and pre-configured models, to learn new attack patterns from datasets and recorded network traffic.
Dain and Cunningham [77,78] defined attack scenarios as ordered sequences of alerts, in which new alerts can be added if they satisfied a similarity criteria. A new scenario was defined if an alert was not similar to any of the existing scenarios. The approach they called the heuristic approach, as compared the attributes of the new alert with the last alert in each scenario using a non-linear function, which was trained on the labeled DEF CON 8 CTF dataset using the square error minimization technique in MATLAB, and correctly joined 88.81% of alerts into scenarios on the test set. They compared this results to the naïve approach, which only compared the IP addresses of the results, but this approach scored better on the DEF CON 8 CTF dataset, by correctly assigning 93.91% of alerts. We can conclude that this was probably a result of the properties of this specific dataset. Another proposed technique was based on data mining. It considered previous three alerts in the scenario for comparison, and used some additional features. The best results were obtained while using decision trees, which correctly joined 99.99% of alerts to scenarios. Unfortuately, that particular dataset was rarely used, so these results cannot be directly compared to other methods, as visible in Section 7.
Zhu and Ghorbani [70] used a multi-layer perceptron (MLP) and a support vector machine (SVM), trained together with a pre-built alert correlation matrix (ACM) extracted from the training set, in order to learn a classifier to decide whether two alerts should be grouped in the same attack scenario or not. Validation was performed using the DARPA 2000 dataset. They extracted attack graphs from the predicted alert correlation scores, and concluded that both models managed to group a subset of alerts into meaningful scenarios. Although most of the discovered attack scenario’s steps resemble that of Ning et al. [34], the system failed to correlate the final DoS attack in the dataset due to spoofed IP addresses [70]. No quantitative results that could be compared to other approaches were provided in the article.
Yu and Frincke [41] described alerts as observations of hidden actions of attackers, and proposed to model attack scenarios using Hidden Colored Petri nets (HCPN). Action preconditions and post-conditions, as represented by input and output arcs in the HCPN, were taken from the work of Ning et al. [31,32,33,34]. HCPN colors represent actors, transitions represent actions, and places represent the system’s resources. Based on this model, they provided an algorithm to determine the next most probable steps of the attacker. Training and evaluation was performed on the DARPA 2000 dataset, resulting in a TP rate of next step prediction of 93.3%. They focused on a novel measure of success they introduced, Quality of Alerts (QoA) (7) [41], as the principal success metrics. We used the provided alert class counts and definitions from this article to check their QoA scores and calculate completeness and soundness scores. The results and comparison can be found in Section 7. In addition to DARPA 2000, the authors used the DARPA Grand Chellenge Problem dataset, reaching a QoA score of 93%.
Fava et al. [42] used Variable-Length Markov Models (VLMM) in order to discover scenarios, or more precisely the attacker’s behavior patterns, and to project the most probable next action of the attacker. The proposed methodology assigns symbols to alerts belonging to attack tracks based on their attributes and the chosen alphabet, and uses the generated symbol sequences in order to train VLMMs later used for projection. Evaluation was performed using a custom-built dataset, reaching a correct prediction rate of 90%.
Sadoddin and Ghorbani [28] proposed a modified version of the FP_Growth algorithm, based on structured patterns, for attack scenario pattern mining. Alerts are aggregated according to their sources and targets, and a Frequent Structure Pattern Tree (FSP_Tree) is incrementally built and frequent patterns are extracted. The method was evaluated while using the DARPA 2000 dataset, synthetically generated patterns, and real alert data from the Fred-eZone. The DARPA 2000 LLDOS 1.0 attack scenario was recognized as two scenarios, because of the IP spoofing used in the last step, and there were two more unlabeled scenarios detected inside the background LLDOS 1.0 traffic. Only alert reduction was scored, were the number of alerts was reduced from 922 to 29, resulting in a reduction ratio of 96,85%. In the second experiment, synthetic patterns were used to test performance, which seemed to support real-time application. Finally, by applying the system on real network traffic, they revealed patterns of a large number of various bot attacks.
Ren et al. [76] used Bayesian networks to group alerts that belong to the same scenario together. The proposed approach has an offline phase, in which features contributing to the correlation of alerts are identified, and an online phase, in which alerts are probabilistically correlated using the previously identified features. Before the offline phase is performed, features that represent the generalization hierarchy of existing features, e.g., IP address ranges, are added. Probabilities can be periodically recalculated to capture new correlation patterns. It is important to note that the correlation is not done on basis of alerts, but on the basis of the alert’s types. Evaluation was performed while using the DARPA 2000 dataset, correctly correlating 96.5% of alert pairs into scenarios, and a honeynet dataset labeled by experts, on which it correctly correlated 93.2% of alert pairs before recalculation, and 96.1%, after recalculation. It was possible to calculate completeness and soundness measures using the information provided in the article. Section 7 shows the results.
Soleimani and Ghorbani [39] proposed a correlation system relying on decision trees (DTs) to discover malicious attack scenarios. Alerts are first aggregated into hyper-alerts, in the context of the paper, groups of similar alerts. Hyper-alerts are then combined into episodes, sequences of hyper-alerts of various lengths. A DT classifier is used to determine whether the detected episodes are malicious, and adds malicious episodes into a model episode tree, a data structure used to store attack scenario patterns. The DT classifier is initially trained on labeled data. If the DT classifies episodes as benign, rules based on alert attributes are used to assess whether those episodes could be potential attack scenarios and, if so, they are presented to the admin who can approve them to be used to update the classifier. After malicious episodes have been detected, the model episode tree is used to calculate the probabilities of potential next hyper-alerts, and a prediction of next probable attacker’s steps is made. The detection and episode filtering was evaluated using the DARPA 2000 dataset and a recorded real worm attack from an ISP. After characteristic attack scenarios have been learned, the scenario detection rate scored between 94.61% and 99.78%, and episode reduction for episodes of length 6 reached 99.94%.
Fredj [90] extends attack graphs with probabilities of attacks, and refers to this type of graphs as Markov chain attack graphs (MCAG). The MCAG is constructed from a database of organization’s hosts and network information, including firewall policies, and statistical information from a dataset or online data containing attack traffic. Alerts are correlated using the MCAG and clustered into attack scenarios by finding their final states, which do not have outgoing edges to other states. The probabilities allow for predicting the next probable steps in the scenario. Evaluation was performed on the DEF CON CTF 17 dataset, where it correlated attacks by 97 attackers into 85 attack scenarios.
GhasemiGol and Ghaemi-Bafghi [27] used alerts partial entropy (APE) to identify alerts containing common information in order to produce hyper-alerts and attack scenarios. Their central idea is that alerts corresponding to same attacks will have more common information than alerts that correspond to different attacks. Alerts are clustered using the density-based spatial clustering of applications with noise (DBSCAN) algorithm based on the measure of partial entropy. DBSCAN was originaly proposed for spatial databases, and performs clustering on a basis of density [101]. After clustering, additional features describing alert generalization hierarchies are added, and only a specified number of alerts containing the largest amount of information in a cluster are chosen as its representatives. The approach was evaluated on the DARPA 2000 dataset, where it reduced the original 34,819 alerts to seven hyper-alerts, corresponding to major events in the scenario. Although the main semantics of the DARPA 2000 attacks were preserved, details regarding alert classification rates are not available in the paper. Finally, they argue that the resulting hyper-alerts could be further filtered by editing the thresholds for entropy, but that would also cause information loss.
Ramaki et al. [40] proposed the real-time episode correlation algorithm (RTECA), which correlates alerts into scenarios using a causal correlation matrix (CCM), estimated during the algorithm’s offline phase using an alert dataset, and it predicts the next probable steps of the detected scenario. Alerts are aggregated into hyper-alerts, defined as alert aggregates, based on their attack type and a given time window. Variable-length hyper-alert sequences are then converted to directed acyclic graphs (DAGs), called episodes, which are, during the online phase of the algorithm, classified as either critical or benign, depending on the strength of the correlation between their hyper-alerts calculated using the CCM. Critical episodes are reported as potential attack scenarios, while the weakly correlated benign episodes are analyzed to learn potential new scenarios and update the CCM accordingly. CCM’s values are estimated offline while using distinct similarity functions over some of the hyper-alert’s attributes, and statistical properties calculated from a stored attack tree. The attack tree constitutes of correlated hyper-alerts from all identified critical episodes, together with frequencies of those episodes used to calculate conditional hyper-alert probabilities. These probabilities can be used to predict the most probable next steps of an attack scenario. Evaluation was performed using the DARPA 2000 LLDOS 1.0 dataset and DARPA Grand Challenge Problem dataset 3.1. On DARPA 2000, it successfully identified the main steps of the scenario, with an episode reduction score of 99.95% for episodes of length 4. Evaluation on the Grand Challenge Problem (GCP) v3.1 dataset successfully identified previously unknown attack patterns and correctly projected between 68.5% and 99.93% of next scenario steps, with an episode reduction score of 99.95%.
A later paper by Ramaki et al. [88] presents a method relying on Bayesian attack graphs (BAGs) for alert correlation and attack scenario projection. The BAG is an attack graph that contains conditional probabilities for attack steps when some preceding attack steps have been observed. This probabilities are estimated off-line using a dataset of recorded alerts. Evaluation was performed on the DARPA 2000 LLDOS 1.0 scenario, where it successfully discovered the entire attack scenario with an alert reduction of and projected the next steps of the attack with an accuracy between and . The authors claim that the entire attack sequence was correctly reconstructed, which is equivalent to the (5) score of .
Holgado et al. [72] used Hidden Markov Models (HMMs) with pre-defined attack stages to learn and predict steps of attacks. After pre-processing, alerts are labeled with keywords and severity scores obtained from the related CVE [102] records, to handle previously unknown types of alerts automatically. The approach was trained and evaluated while using DARPA 2000 LLDOS1.0 and a custom-made dataset containing scripted DDoS attacks. It was sucessful in identifying phases of the attack and calculated the risk of reaching the final phase for each alert. Although the authors provided a graphical representation of their results for DARPA 2000 that suggests a success rate of almost , they did not provide enough numerical information to calculate comparable metrics.
Husák and Kašpar [19] used sequential rule mining on alerts from the SABU alert sharing platform [103] to learn attack sequence rules, and evaluated their usability in attack scenario projection. The evaluation showed that the observed attack patterns change quickly, but they are nonetheless stable enough to be usable during several days. This paper was more focused on the properties of the dataset than the method itself.
Ghafir et al. [87] developed a machine-learning based IDS technology, called MLAPT, whose low-level detection modules are outside the scope of this survey. It correlates alerts of its detection modules into larger-scale attacks using pre-defined attack steps, and pre-defined grouping and correlation rules. Upon discovery of partial or full attack scenarios, it generates high-level alerts for the security team. The final component of MLAPT is an attack projection module that predicts next steps of partial attack scenarios. It relies on several ML algorithms that were trained over a dataset of attack scenarios the system detected in a period of six months. MLAPT was evaluated while using three proprietary datasets and simulated attack scenarios inside the campus network. It achieved a total of , of , and successfully predicted the next steps, depending on the classifier in 68 to of cases. In [64], the authors improved the attack scenario projection component with a Hidden Markov Model (HMM). The improved version was evaluated using two synthetic datasets, with a projection success rate of about for projection from the first step of a scenario, increasing to for projection from the middle of a scenario.
Zhang et al. [30] used alert attributes and Markov Chains (MC) to estimate alert causal probabilities from a dataset. Similar alerts were aggregated into hyper-alerts and then grouped according to the IP addresses they contained. A small set of alert attributes, such as the source IP address, was used to estimate the probability that alerts in an alert sequence are consequences of previous alerts. Using the mined statistics and alerts that involve multiple hosts, the method creates an attack graph that represents attack steps in the network. Evaluation was performed using the DARPA 2000 dataset. The method successfully reconstructed large parts of both attack scenarios, and led to an alert reduction of . Unfortunately, detailed evaluation results needed to calculate other metrics are not available. Because this approach is based on mining rules from a dataset, it is likely to give the best results when detecting repetitive attacks, such as those that are characteristic for computer worms, and will likely not perform as well when facing novel attack scenarios.
Zhang et al. [93] define rules and algorithms for grouping alerts into attack scenarios and reasoning about the next steps of the attacker. Alerts are first aggregated into intrusion actions with regard to their features. Intrusion actions are then added to sessions representing communication between pairs of hosts. The criteria for splitting sessions are unusually large time gaps between intrusion actions. Finally, sessions are grouped into attack scenarios if they share common intrusion actions. Historical data is used offline to estimate correlation probabilities of sessions, and this probabilities are used to predict the next steps of the attack. The method was evaluated on the DARPA LLDOS 1.0 scenario and the CICIDS 2017 dataset. It has shown a promising prediction accuracy larger than , and it managed to reconstruct the attack scenarios with alert reduction of on the LLDOS 1.0 scenario. Unfortunately, the reconstructed graphs of attack scenarios are large and difficult to analyze, and the available quantitative results were insufficient for calculating other success metrics.
Hu et al. [94] correlate alerts into attack sequences using network-specific attack graphs constructed with the MulVAL Toolkit [104]. The creation of the attack graph requires knowledge about the target network and existing vulnerabilities. Generated attack sequences are then clustered using a sequence similarity metric into attack scenarios. The method takes into account that attack steps may have been missed by the IDS, including both unknown and failed attacks. Validation is first preformed in an experimental setting, and later whlie using the DEF CON CTF 23 dataset. In both cases, the method successfully reconstructed the attack scenarios. Unfortunately, quantitative information on the results was not published.
7. Results
The main contribution of this survey is a unified comparison of results of the surveyed papers. A basic overview of the papers is shown in Table 3, with the following columns:
- Model gives a basic description of the concepts which the method or tool is based on. Some of the articles propose attack description languages, such as STATL, and are therefore labeled as Language. Similarity stands for feature similarity and refers to models which compare alert features, often using pre-defined formulas for similarity. Articles relying on attack graphs and attack trees are labeled as Graph. Most papers either use a knowledge base (KB) populated by experts, or machine learning (ML) or data mining (DM) to extract attack scenarios. In some cases, names of data mining algorithms or machine learning models are provided. Hidden Markov model is abbreviated as HMM, Similarity as Sim., Decision Trees as DT, and Markov chain as MCh.
- Domain knowledge refers to the amount of domain knowledge that needs to be provided to the model to be fully functional. Since languages can be used in all sorts of systems, based on KB, AI, or hybrid models, the field is left empty. One star means that there is only minimal domain knowledge entry needed, in most cases about IP ranges in the network. Three stars signify that the system needs regular maintenance of a knowledge base to operate, while two stars are between the two extremes.
- Level of evaluation describes whether the authors validated their approaches on datasets without quantitative success measurement, denoted by V, evaluated them on datasets using quantitative success metrics, denoted by E, or validated them using examples, use-cases, and/or formal proofs, denoted by F.
- Real-time refers to the ability of the proposed system to work in a real online environment. It is important to note that empty fields do not necessarily mean that the system is not applicable, but that the question of such use was not considered in the paper. The papers which support real-time operation are marked with a plus sign in this column. Question marks denote that the paper left an impression that it should support real-time usage, but it did not contain clear evidence for it.
The next seven columns indicate whether a particular dataset was used in the paper. Datasets that have been used in a paper either for validation or for evaluation are marked with a plus sign or with the version of the dataset. If the approach was evaluated over at least one of the selected datasets, and it contains evaluation results, it is denoted by E. The asterisk in the final column for [93] signifies that they used CICIDS 2017 rather than a custom dataset.
Analysis of the papers has shown that four datasets were used for evaluation in a consistent manner more than once, namely DARPA 2000, Cyber Treasure Hunt, GCP 3.1, and DEF CON 9 datasets. The results for those datasets are listed in Table 4, Table 5 and Table 6, with some additionally depicted in Figure 3. In most cases, we used original data from the papers (alert counts, false positives, false negatives, etc.) in order to calculate success metrics from scratch, according to the definitions in Section 4. Figures that were not given in the paper and are purely our own work are underlined, and the results that significantly differ from the ones stated in the papers are written in bold, with original values written in parenthesis.
Ning et al. calculated the completeness and soundness over subsets of the LLDOS 1.0 scenario, so the results in the table are also not available in their original articles and, hence, underlined. We encountered a similar situation with Liu et al., but our results on the dataset subset basis differed from those that are mentioned in the paper. Finally, in cases where original information was missing from the papers, we transcribed results directly from the papers. Such results are denoted with (P) in the table. Ramaki et al. [88] is a special case, because we converted their claim of detecting the entire attack scenario into the score of .
8. Discussion
We calculated new metrics for 9 articles, and verified others where possible, as can be seen in Table 4, Table 5 and Table 6. Soundness and completeness measures were not consistent for Liu et al. [37], where our calculations yielded lower values than reported in the original paper. We found that they may have made a typing error when presenting their correlation results. While calculating, they may have copied the number of correctly correlated results from the inside network in LLDOS 1.0 (44 in the paper), to the correctly correlated alert count from the DMZ portion of the scenario. If we assume that the latter number was actually 57 and not 44, the calculated results from the paper written in parenthesis are the correct values. In contrast, the calculation of episode reduction for Sadoddin and Ghorbani resulted in a slightly larger value than that presented in the paper, because the authors, possibly intentionally, made a rounding error. Because the reduction metrics shown in Table 5 and Table 6 depend heavily on the characteristics of initial alerts raised by the IDS, the fact that many authors use different IDS systems with different configurations makes them an imprecise comparison criteria.
In Table 4, we chose to sort the papers according to calculated scores for completeness, , because it reflects the absence of false negative errors, which are, in practice, much more dangerous than false positive errors. We expect that approaches exhibiting false negative errors in a controlled and sterile setting, such as a dataset, where the adversary is essentially a simple automaton, will be fairly easy to fool with novel and modified attack patterns when facing intelligent adversaries in real environments. Interestingly, if newer methods perform worse than older methods on some old datasets, they could still potentially perform better on contemporary attacks that are not represented in theese old datasets.
Knowledge-based approaches and approaches that learn attack patterns from datasets, are both types of signature recognition systems. As such, they must be constantly manually updated with new high-level attack patterns described by rules and/or new datasets in order to correlate alerts correctly. As a step in this direction, the authors of UNB datasets continuously publish new and updated datasets, as described in Section 5.4. Unfortunately, this procedure makes the comparison of attack detection approaches difficult, since older approaches would have to be re-evaluated each time that a new dataset is published in order to be comparable. A possible solution is to evaluate new approaches while using a larger number of datasets, including both older popular datasets and novel ones. To compensate for the inconsistent use of metrics, approaches should aim to publish detailed information on the correlation results, so that different evaluation metrics can be calculated independently if necessary. As shown in Table 4 and Table 5, 4 approaches did not provide the underlying counts of the alerts and only published their final results.
Another problem in detecting high-level attacks is missed alarms, i.e., situations where IDS did not trigger alarms for an attack. This usually happens, because the IDS does not have the appropriate signatures. Ning et al. [66] addressed this by using domain knowledge to create hypotheses for missed alerts and later validated these hypotheses while using raw audit data, while Wang et al. [44] handled this using alarm similarity. As some of the surveyed papers suggest, one possible solution to this problem would be to integrate different data sources, such as anomaly detector alarms and event logs, and another would be to incorporate more knowledge about attackers and their high-level targets into the approach. As for the first solution, Sommer and Paxson [105] argue that a serious disadvantage of anomaly detectors based on machine learning is that ML is not suitable for meaningful outlier detection. To expand on this, the fact that an event is an outlier has little to do with the fact that it is malicious, and most of the outliers can be traced back to software and policy changes and benign network errors, resulting in a large proportion of anomalies being false positives. The second solution deals with the attacker’s operations, tactics, and objectives, and may provide better quality, but it relies on large amounts of domain knowledge about attackers and continuous manual work. To quote all too often quoted Sun Tzu: “If you know others and know yourself, you will not be imperiled in a hundred battles”. An example of a high-level model that is based on attacker tactics is the MITRE ATT&CK framework [106], which we encourage all readers to review.
Most of the metrics collected in this survey measure the technical characteristics of the approaches, rather than their impact on productivity in a security operations center (SOC). The only metric in the surveyed literature that focuses on user experience is QoA (7), along with its weighted variant described in [41]. Together with the CSA metrics that were proposed in [5], it is largely ignored in the surveyed papers. Most commercial systems today rely on human operators, combine subscription-based domain knowledge with anomaly detection to find attacks, and provide analytical capabilities for further manual validation and investigation.
Finally, approaches since 2004 mostly support real-time operation, and would be sufficent for detecting scripted attack scenarios of computer worms and low-profile attackers. Some limited projection of attacks is also possible. However, they are far from detecting and projecting attack scenarios of high-profile intelligent adversaries, such as Advanced Persistent Threats (APTs), and a lot of research in applications of AI is needed to cope with them.
9. Conclusions
This paper gave an overview of notable advances in high-level attack scenario detection and projection. It explained the context, reasoning, and practical problems that encouraged research in this area, and followed the evolution of proposals from the pioneering approaches to the state-of-the-art at the time of writing. Approaches relying on manually defined domain knowledge require constant maintenance and are, in most cases, not very flexible, while data mining and ML approaches highly depend on the quality of the available datasets. In this survey, emphasis was put on comparing the papers by calculating comparable measures of success on two most commonly used datasets, namely the DARPA 2000 dataset and the Treasure Hunt dataset. We suggest that future approaches evaluate on a larger number of datasets, including both the popular older ones, and novel ones, and focus more on the value they provide to the security personell. At the time of writing, the available datasets do not seem representative enough to enable the extraction of knowledge regarding attackers and attack scenarios aside from bot attacks. The tasks of attack scenario detection and projection have proven to be very challenging, and they require further research.
Author Contributions
Conceptualization, I.K. and S.G.; methodology, I.K.; validation, I.K.; formal analysis, I.K.; investigation, I.K. and K.S.; data curation, I.K.; Writing—Original draft preparation, I.K.; Writing—Review and editing, I.K., S.G., and K.S.; visualization, I.K. and K.S.; supervision, S.G.; project administration, S.G.; funding acquisition, S.G. All authors have read and agreed to the published version of the manuscript.
Funding
This research was carried out as a part of Cyber Conflict Simulator research and development project co-financed by the EU under the KK.01.2.1.01.0054 grant agreement.
Conflicts of Interest
The authors declare no conflict of interest. The funders had no role in the design of the study, in the collection, analyses, and interpretation of data, in the writing of the manuscript, and in the decision to publish the results.
References
- Verizon. 2020 Data Breach Investigations Report (DBIR). 2020. Available online: https://enterprise.verizon.com/resources/reports/dbir/2020/introduction/ (accessed on 1 September 2020).
- Bhatt, S.; Manadhata, P.K.; Zomlot, L. The operational role of security information and event management systems. IEEE Secur. Priv. 2014, 12, 35–41. [Google Scholar] [CrossRef]
- MIT Lincoln Laboratory. 2000 DARPA Intrusion Detection Scenario Specific Datasets. Available online: https://www.ll.mit.edu/r-d/datasets/2000-darpa-intrusion-detection-scenario-specific-datasets (accessed on 11 August 2020).
- Endsley, M.R. Design and evaluation for situation awareness enhancement. In Proceedings of the Human Factors Society Annual Meeting; Sage: Los Angeles, CA, USA, 1988; pp. 97–101. [Google Scholar]
- Tadda, G.P.; Salerno, J.S. Overview of cyber situation awareness. In Cyber Situational Awareness; Springer: Boston, MA, USA, 2010; pp. 15–35. [Google Scholar]
- Barford, P.; Dacier, M.; Dietterich, T.G.; Fredrikson, M.; Giffin, J.; Jajodia, S.; Jha, S.; Li, J.; Liu, P.; Ning, P.; et al. Cyber SA: Situational awareness for cyber defense. In Cyber Situational Awareness; Springer: Boston, MA, USA, 2010; pp. 3–13. [Google Scholar]
- Axelsson, S. The base-rate fallacy and the difficulty of intrusion detection. ACM Trans. Inf. Syst. Secur. (TISSEC) 2000, 3, 186–205. [Google Scholar] [CrossRef]
- Ilgun, K.; Kemmerer, R.A.; Porras, P.A. State transition analysis: A rule-based intrusion detection approach. IEEE Trans. Softw. Eng. 1995, 21, 181–199. [Google Scholar] [CrossRef]
- Bass, T. Intrusion detection systems and multisensor data fusion. Commun. ACM 2000, 43, 99–105. [Google Scholar] [CrossRef]
- Yang, S.J.; Du, H.; Holsopple, J.; Sudit, M. Attack projection. In Cyber Defense and Situational Awareness; Springer: New York, NY, USA, 2014; pp. 239–261. [Google Scholar]
- Husák, M.; Komárková, J.; Bou-Harb, E.; Čeleda, P. Survey of attack projection, prediction, and forecasting in cyber security. IEEE Commun. Surv. Tutor. 2018, 21, 640–660. [Google Scholar] [CrossRef] [Green Version]
- Ahmed, A.A.; Zaman, N.A.K. Attack Intention Recognition: A Review. IJ Netw. Secur. 2017, 19, 244–250. [Google Scholar]
- Abdlhamed, M.; Kifayat, K.; Shi, Q.; Hurst, W. Intrusion prediction systems. In Information Fusion for Cyber-Security Analytics; Springer International Publishing: Cham, Switzerland, 2017; pp. 155–174. [Google Scholar]
- Leau, Y.B.; Manickam, S. Network security situation prediction: A review and discussion. In International Conference on Soft Computing, Intelligence Systems, and Information Technology; Springer: Berlin/Heidelberg, Germany, 2015; pp. 424–435. [Google Scholar]
- Li, J.; Ou, X.; Rajagopalan, R. Uncertainty and risk management in cyber situational awareness. In Cyber Situational Awareness; Springer: Boston, MA, USA, 2010; pp. 51–68. [Google Scholar]
- Endsley, M.R.; Connors, E.S. Foundation and challenges. In Cyber Defense and Situational Awareness; Springer: New York, NY, USA, 2014; pp. 7–27. [Google Scholar]
- Salah, S.; Maciá-Fernández, G.; DíAz-Verdejo, J.E. A model-based survey of alert correlation techniques. Comput. Netw. 2013, 57, 1289–1317. [Google Scholar] [CrossRef]
- Hubballi, N.; Suryanarayanan, V. False alarm minimization techniques in signature-based intrusion detection systems: A survey. Comput. Commun. 2014, 49, 1–17. [Google Scholar] [CrossRef] [Green Version]
- Husák, M.; Kašpar, J. Towards predicting cyber attacks using information exchange and data mining. In Proceedings of the 2018 14th International Wireless Communications & Mobile Computing Conference (IWCMC), Limassol, Cyprus, 25–29 June 2018; pp. 536–541. [Google Scholar]
- Navarro, J.; Deruyver, A.; Parrend, P. A systematic survey on multi-step attack detection. Comput. Secur. 2018, 76, 214–249. [Google Scholar] [CrossRef]
- Mirheidari, S.A.; Arshad, S.; Jalili, R. Alert correlation algorithms: A survey and taxonomy. In Cyberspace Safety and Security; Springer: New York, NY, USA, 2013; pp. 183–197. [Google Scholar]
- Zhou, C.V.; Leckie, C.; Karunasekera, S. A survey of coordinated attacks and collaborative intrusion detection. Comput. Secur. 2010, 29, 124–140. [Google Scholar] [CrossRef]
- Vasilomanolakis, E.; Karuppayah, S.; Mühlhäuser, M.; Fischer, M. Taxonomy and survey of collaborative intrusion detection. ACM Comput. Surv. (CSUR) 2015, 47, 1–33. [Google Scholar] [CrossRef]
- Salerno, J. Measuring situation assessment performance through the activities of interest score. In Proceedings of the 2008 11th International Conference on Information Fusion, Cologne, Germany, 30 June–3 July 2008; pp. 1–8. [Google Scholar]
- Valdes, A.; Skinner, K. Probabilistic alert correlation. In International Workshop on Recent Advances in Intrusion Detection; Springer: Berlin/Heidelberg, Germany, 2001; pp. 54–68. [Google Scholar]
- Valeur, F.; Vigna, G.; Kruegel, C.; Kemmerer, R.A. Comprehensive approach to intrusion detection alert correlation. IEEE Trans. Dependable Secur. Comput. 2004, 1, 146–169. [Google Scholar] [CrossRef] [Green Version]
- GhasemiGol, M.; Ghaemi-Bafghi, A. E-correlator: An entropy-based alert correlation system. Secur. Commun. Netw. 2015, 8, 822–836. [Google Scholar] [CrossRef]
- Sadoddin, R.; Ghorbani, A.A. An incremental frequent structure mining framework for real-time alert correlation. Comput. Secur. 2009, 28, 153–173. [Google Scholar] [CrossRef]
- Roschke, S.; Cheng, F.; Meinel, C. A new alert correlation algorithm based on attack graph. In Computational Intelligence in Security for Information Systems; Springer: Berlin/Heidelberg, Germany, 2011; pp. 58–67. [Google Scholar]
- Zhang, Y.; Zhao, S.; Zhang, J. RTMA: Real time mining algorithm for multi-step attack scenarios reconstruction. In Proceedings of the 2019 IEEE 21st International Conference on High Performance Computing and Communications; IEEE 17th International Conference on Smart City; IEEE 5th International Conference on Data Science and Systems (HPCC/SmartCity/DSS), Zhangjiajie, China, 10–12 August 2019; pp. 2103–2110. [Google Scholar]
- Ning, P.; Cui, Y.; Reeves, D.S. Constructing attack scenarios through correlation of intrusion alerts. In Proceedings of the 9th ACM Conference on Computer and Communications Security, Washington, DC, USA, 18–22 November 2002; pp. 245–254. [Google Scholar]
- Ning, P.; Cui, Y.; Reeves, D.S. Analyzing intensive intrusion alerts via correlation. In International Workshop on Recent Advances in Intrusion Detection; Springer: Berlin/Heidelberg, Germany, 2002; pp. 74–94. [Google Scholar]
- Ning, P.; Xu, D. Learning attack strategies from intrusion alerts. In Proceedings of the 10th ACM Conference on Computer and Communications Security, New York, NY, USA, 27–31 October 2003; pp. 200–209. [Google Scholar]
- Ning, P.; Cui, Y.; Reeves, D.S.; Xu, D. Techniques and tools for analyzing intrusion alerts. ACM Trans. Inf. Syst. Secur. (TISSEC) 2004, 7, 274–318. [Google Scholar] [CrossRef]
- Saad, S.; Traore, I. Extracting attack scenarios using intrusion semantics. In International Symposium on Foundations and Practice of Security; Springer: Berlin/Heidelberg, Germany, 2012; pp. 278–292. [Google Scholar]
- Saad, S.; Traore, I. Semantic aware attack scenarios reconstruction. J. Inf. Secur. Appl. 2013, 18, 53–67. [Google Scholar] [CrossRef]
- Liu, Z.; Wang, C.; Chen, S. Correlating multi-step attack and constructing attack scenarios based on attack pattern modeling. In Proceedings of the 2008 International Conference on Information Security and Assurance (ISA 2008), Busan, Korea, 24–26 April 2008; pp. 214–219. [Google Scholar]
- Barzegar, M.; Shajari, M. Attack scenario reconstruction using intrusion semantics. Expert Syst. Appl. 2018, 108, 119–133. [Google Scholar] [CrossRef]
- Soleimani, M.; Ghorbani, A.A. Multi-layer episode filtering for the multi-step attack detection. Comput. Commun. 2012, 35, 1368–1379. [Google Scholar] [CrossRef]
- Ramaki, A.A.; Amini, M.; Atani, R.E. RTECA: Real time episode correlation algorithm for multi-step attack scenarios detection. Comput. Secur. 2015, 49, 206–219. [Google Scholar] [CrossRef]
- Yu, D.; Frincke, D. Improving the quality of alerts and predicting intruder’s next goal with Hidden Colored Petri-Net. Comput. Netw. 2007, 51, 632–654. [Google Scholar] [CrossRef]
- Fava, D.S.; Byers, S.R.; Yang, S.J. Projecting cyberattacks through variable-length markov models. IEEE Trans. Inf. Forensics Secur. 2008, 3, 359–369. [Google Scholar] [CrossRef]
- Farhadi, H.; AmirHaeri, M.; Khansari, M. Alert correlation and prediction using data mining and HMM. ISeCure ISC Int. J. Inf. Secur. 2011, 3, 77–101. [Google Scholar]
- Wang, L.; Liu, A.; Jajodia, S. An efficient and unified approach to correlating, hypothesizing, and predicting intrusion alerts. In European Symposium on Research in Computer Security; Springer: Berlin/Heidelberg, Germany, 2005; pp. 247–266. [Google Scholar]
- Kendall, K.K.R. A Database of Computer Attacks for the Evaluation of Intrusion Detection Systems. Ph.D. Thesis, Massachusetts Institute of Technology, Cambridge, MA, USA, 1999. [Google Scholar]
- MIT Lincoln Laboratory. 1999 DARPA Intrusion Detection Evaluation Dataset. 1999. Available online: https://www.ll.mit.edu/r-d/datasets/1999-darpa-intrusion-detection-evaluation-dataset (accessed on 11 August 2020).
- DEF CON. DEF CON. Available online: https://www.defcon.org (accessed on 26 August 2020).
- DEF CON. DEF CON CTF Archive. Available online: https://www.defcon.org/html/links/dc-ctf.html (accessed on 11 August 2020).
- Gharib, A.; Sharafaldin, I.; Lashkari, A.H.; Ghorbani, A.A. An evaluation framework for intrusion detection dataset. In Proceedings of the 2016 International Conference on Information Science and Security (ICISS), Pattaya, Thailand, 19–22 December 2016; pp. 1–6. [Google Scholar]
- Vigna, G. Teaching hands-on network security: Testbeds and live exercises. J. Inf. Warf. 2003, 2, 8–24. [Google Scholar]
- Vigna, G.; Eckmann, S.T.; Kemmerer, R.A. Attack languages. In Proceedings of the IEEE Information Survivability Workshop, Boston, MA, USA, 24–26 October 2000. [Google Scholar]
- McHugh, J. Testing intrusion detection systems: A critique of the 1998 and 1999 darpa intrusion detection system evaluations as performed by lincoln laboratory. ACM Trans. Inf. Syst. Secur. (TISSEC) 2000, 3, 262–294. [Google Scholar] [CrossRef]
- Brown, C.; Cowperthwaite, A.; Hijazi, A.; Somayaji, A. Analysis of the 1999 darpa/lincoln laboratory ids evaluation data with netadhict. In Proceedings of the 2009 IEEE Symposium on Computational Intelligence for Security and Defense Applications, Ottawa, ON, Canada, 8–10 July 2009; pp. 1–7. [Google Scholar]
- Shiravi, A.; Shiravi, H.; Tavallaee, M.; Ghorbani, A.A. Toward developing a systematic approach to generate benchmark datasets for intrusion detection. Comput. Secur. 2012, 31, 357–374. [Google Scholar] [CrossRef]
- Sharafaldin, I.; Lashkari, A.H.; Ghorbani, A.A. Toward Generating a New Intrusion Detection Dataset and Intrusion Traffic Characterization. In Proceedings of the 4th International Conference on Information Systems Security and Privacy (ICISSP 2018), Funchal, Portugal, 22–24 January 2018; pp. 108–116. [Google Scholar]
- Provos, N. A Virtual Honeypot Framework. In Proceedings of the USENIX Security Symposium, San Diego, CA, USA, 9–13 August 2004; pp. 1–14. [Google Scholar]
- NETRESEC AB. Publicly Available PCAP Files. 2015. Available online: https://www.netresec.com/?page=PcapFiles (accessed on 13 May 2020).
- Porras, P.A.; Fong, M.W.; Valdes, A. A mission-impact-based approach to INFOSEC alarm correlation. In International Workshop on Recent Advances in Intrusion Detection; Springer: Berlin/Heidelberg, Germany, 2002; pp. 95–114. [Google Scholar]
- Hossain, M.N.; Milajerdi, S.M.; Wang, J.; Eshete, B.; Gjomemo, R.; Sekar, R.; Stoller, S.; Venkatakrishnan, V. SLEUTH: Real-time attack scenario reconstruction from COTS audit data. In Proceedings of the 26th USENIX Security Symposium (USENIX Security 17), Vancouver, BC, Canada, 16–18 August 2017; pp. 487–504. [Google Scholar]
- Cuppens, F.; Miege, A. Alert correlation in a cooperative intrusion detection framework. In Proceedings of the 2002 IEEE Symposium on Security and Privacy, Berkeley, CA, USA, 12–15 May 2002; pp. 202–215. [Google Scholar]
- Morin, B.; Debar, H. Correlation of intrusion symptoms: An application of chronicles. In International Workshop on Recent Advances in Intrusion Detection; Springer: Berlin/Heidelberg, Germany, 2003; pp. 94–112. [Google Scholar]
- Morin, B.; Mé, L.; Debar, H.; Ducassé, M. M2D2: A formal data model for IDS alert correlation. In International Workshop on Recent Advances in Intrusion Detection; Springer: Berlin/Heidelberg, Germany, 2002; pp. 115–137. [Google Scholar]
- Cuppens, F. Managing alerts in a multi-intrusion detection environment. In Proceedings of the Seventeenth Annual Computer Security Applications Conference, New Orleans, LA, USA, 10–14 December 2001. [Google Scholar]
- Ghafir, I.; Kyriakopoulos, K.G.; Lambotharan, S.; Aparicio-Navarro, F.J.; AsSadhan, B.; BinSalleeh, H.; Diab, D.M. Hidden Markov models and alert correlations for the prediction of advanced persistent threats. IEEE Access 2019, 7, 99508–99520. [Google Scholar] [CrossRef]
- Wang, L.; Liu, A.; Jajodia, S. Using attack graphs for correlating, hypothesizing, and predicting intrusion alerts. Comput. Commun. 2006, 29, 2917–2933. [Google Scholar] [CrossRef] [Green Version]
- Ning, P.; Xu, D.; Healey, C.G.; Amant, R.S. Building Attack Scenarios through Integration of Complementary Alert Correlation Method. 2004. Available online: http://citeseerx.ist.psu.edu/viewdoc/summary?doi=10.1.1.60.4412 (accessed on 19 October 2020).
- Cheung, S.; Lindqvist, U.; Fong, M.W. Modeling multistep cyber attacks for scenario recognition. In Proceedings of the DARPA Information Survivability Conference and Exposition, Washington, DC, USA, 22–24 April 2003; pp. 284–292. [Google Scholar]
- Qin, X.; Lee, W. Statistical causality analysis of infosec alert data. In International Workshop on Recent Advances in Intrusion Detection; Springer: Berlin/Heidelberg, Germany, 2003; pp. 73–93. [Google Scholar]
- Qin, X.; Lee, W. Attack plan recognition and prediction using causal networks. In Proceedings of the 20th Annual Computer Security Applications Conference, Tucson, AZ, USA, 6–10 December 2004; pp. 370–379. [Google Scholar]
- Zhu, B.; Ghorbani, A.A. Alert correlation for extracting attack strategies. IJ Netw. Secur. 2006, 3, 244–258. [Google Scholar]
- Pietraszek, T.; Tanner, A. Data mining and machine learning—Towards reducing false positives in intrusion detection. Inf. Secur. Tech. Rep. 2005, 10, 169–183. [Google Scholar] [CrossRef]
- Holgado, P.; Villagrá, V.A.; Vazquez, L. Real-time multistep attack prediction based on hidden markov models. IEEE Trans. Dependable Secur. Comput. 2017, 17, 134–147. [Google Scholar] [CrossRef]
- Milajerdi, S.M.; Gjomemo, R.; Eshete, B.; Sekar, R.; Venkatakrishnan, V. Holmes: Real-time apt detection through correlation of suspicious information flows. In Proceedings of the 2019 IEEE Symposium on Security and Privacy (SP), San Francisco, CA, USA, 19–23 May 2019; pp. 1137–1152. [Google Scholar]
- Hughes, T.; Sheyner, O. Attack scenario graphs for computer network threat analysis and prediction. Complexity 2003, 9, 15–18. [Google Scholar] [CrossRef]
- Geib, C.W.; Goldman, R.P. Plan recognition in intrusion detection systems. In Proceedings of the DARPA Information Survivability Conference and Exposition II. DISCEX’01, Anaheim, CA, USA, 12–14 June 2001; pp. 46–55. [Google Scholar]
- Ren, H.; Stakhanova, N.; Ghorbani, A.A. An online adaptive approach to alert correlation. In International Conference on Detection of Intrusions and Malware, and Vulnerability Assessment; Springer: Berlin/Heidelberg, Germany, 2010; pp. 153–172. [Google Scholar]
- Dain, O.M.; Cunningham, R.K. Building scenarios from a heterogeneous alert stream. In Proceedings of the 2001 IEEE Workshop on Information Assurance and Security; United States Military Academy: West Point, NY, USA, 2001. [Google Scholar]
- Dain, O.; Cunningham, R.K. Fusing a heterogeneous alert stream into scenarios. In Applications of Data Mining in Computer Security; Springer: Boston, MA, USA, 2002; pp. 103–122. [Google Scholar]
- Noel, S.; Robertson, E.; Jajodia, S. Correlating intrusion events and building attack scenarios through attack graph distances. In Proceedings of the 20th Annual Computer Security Applications Conference, Tucson, AZ, USA, 6–10 December 2004; pp. 350–359. [Google Scholar]
- Morin, B.; Mé, L.; Debar, H.; Ducassé, M. A logic-based model to support alert correlation in intrusion detection. Inf. Fusion 2009, 10, 285–299. [Google Scholar] [CrossRef]
- Cuppens, F.; Ortalo, R. Lambda: A language to model a database for detection of attacks. In International Workshop on Recent Advances in Intrusion Detection; Springer: Berlin/Heidelberg, Germany, 2000; pp. 197–216. [Google Scholar]
- Templeton, S.J.; Levitt, K. A requires/provides model for computer attacks. In NSPW ’00: Proceedings of the 2000 Workshop on New Security Paradigms; Association for Computing Machinery: New York, NY, USA, 2001; pp. 31–38. [Google Scholar]
- Cuppens, F.; Autrel, F.; Miege, A.; Benferhat, S. Correlation in an intrusion detection process. In Proceedings of the Internet Security Communication Workshop, Tunis, Tunisia, 19–21 September 2002; pp. 153–172. [Google Scholar]
- Goldman, R.P.; Heimerdinger, W.; Harp, S.A.; Geib, C.W.; Thomas, V.; Carter, R.L. Information modeling for intrusion report aggregation. In Proceedings of the DARPA Information Survivability Conference and Exposition II. DISCEX’01, Anaheim, CA, USA, 12–14 June 2001; pp. 329–342. [Google Scholar]
- Valdes, A.D.J.; Skinner, K. Probabilistic Alert Correlation. U.S. Patent 7,917,393, 29 March 2011. [Google Scholar]
- Eckmann, S.T.; Vigna, G.; Kemmerer, R.A. STATL: An attack language for state-based intrusion detection. J. Comput. Secur. 2002, 10, 71–103. [Google Scholar] [CrossRef] [Green Version]
- Ghafir, I.; Hammoudeh, M.; Prenosil, V.; Han, L.; Hegarty, R.; Rabie, K.; Aparicio-Navarro, F.J. Detection of advanced persistent threat using machine-learning correlation analysis. Future Gener. Comput. Syst. 2018, 89, 349–359. [Google Scholar] [CrossRef] [Green Version]
- Ramaki, A.A.; Khosravi-Farmad, M.; Bafghi, A.G. Real time alert correlation and prediction using Bayesian networks. In Proceedings of the 2015 12th International Iranian Society of Cryptology Conference on Information Security and Cryptology (ISCISC), Rasht, Iran, 8–10 September 2015; pp. 98–103. [Google Scholar]
- Albanese, M.; Jajodia, S.; Pugliese, A.; Subrahmanian, V. Scalable analysis of attack scenarios. In European Symposium on Research in Computer Security; Springer: Berlin/Heidelberg, Germany, 2011; pp. 416–433. [Google Scholar]
- Fredj, O.B. A realistic graph-based alert correlation system. Secur. Commun. Netw. 2015, 8, 2477–2493. [Google Scholar] [CrossRef]
- Ahmadinejad, S.H.; Jalili, S.; Abadi, M. A hybrid model for correlating alerts of known and unknown attack scenarios and updating attack graphs. Comput. Netw. 2011, 55, 2221–2240. [Google Scholar] [CrossRef]
- Alhaj, T.A.; Siraj, M.M.; Zainal, A.; Elshoush, H.T.; Elhaj, F. Feature selection using information gain for improved structural-based alert correlation. PLoS ONE 2016, 11, e0166017. [Google Scholar] [CrossRef] [Green Version]
- Zhang, K.; Zhao, F.; Luo, S.; Xin, Y.; Zhu, H. An intrusion action-based IDS alert correlation analysis and prediction framework. IEEE Access 2019, 7, 150540–150551. [Google Scholar] [CrossRef]
- Hu, H.; Liu, J.; Zhang, Y.; Liu, Y.; Xu, X.; Huang, J. Attack scenario reconstruction approach using attack graph and alert data mining. J. Inf. Secur. Appl. 2020, 54, 102522. [Google Scholar] [CrossRef]
- Huang, M.Y.; Jasper, R.J.; Wicks, T.M. A large scale distributed intrusion detection framework based on attack strategy analysis. Comput. Netw. 1999, 31, 2465–2475. [Google Scholar] [CrossRef]
- Albanese, M.; Erbacher, R.F.; Jajodia, S.; Molinaro, C.; Persia, F.; Picariello, A.; Sperlì, G.; Subrahmanian, V. Recognizing unexplained behavior in network traffic. In Network Science and Cybersecurity; Springer: New York, NY, USA, 2014; pp. 39–62. [Google Scholar]
- Dousson, C. Extending and unifying chronicle representation with event counters. In Proceedings of the 15th European Conference on Artificial Intelligence, Lyon, France, 21–26 July 2002; IOS Press: Amsterdam, The Netherlands, 2002; pp. 257–261. [Google Scholar]
- Lindqvist, U.; Porras, P.A. Detecting computer and network misuse through the production-based expert system toolset (P-BEST). In Proceedings of the 1999 IEEE Symposium on Security and Privacy (Cat. No. 99CB36344), Oakland, CA, USA, 14 May 1999; pp. 146–161. [Google Scholar]
- Mandiant, A. Exposing One of China’s Cyber Espionage Units. 2013. Available online: https://www.fireeye.com/content/dam/fireeye-www/services/pdfs/mandiant-apt1-report.pdf (accessed on 13 May 2020).
- Keromytis, A.D. Transparent Computing Engagement 3 Data Release. 2018. Available online: https://github.com/darpa-i2o/Transparent-Computing (accessed on 8 October 2020).
- Ester, M.; Kriegel, H.P.; Sander, J.; Xu, X. A Density-Based Algorithm for Discovering Clusters in Large Spatial Databases with Noise; Kdd: Seattle, WA, USA, 1996; pp. 226–231. [Google Scholar]
- Common Vulnerabilities and Exposures (CVE); The MITRE Corporation: McLean, VA, USA; Available online: https://cve.mitre.org/ (accessed on 1 September 2020).
- CESNET. 1998 DARPA Intrusion Detection Evaluation Dataset. 2016. Available online: https://sabu.cesnet.cz/en/start (accessed on 21 August 2020).
- Ou, X.; Govindavajhala, S.; Appel, A.W. MulVAL: A Logic-Based Network Security Analyzer. In Proceedings of the USENIX Security Symposium, Baltimore, MD, USA, 31 July–5 August 2005; pp. 113–128. [Google Scholar]
- Sommer, R.; Paxson, V. Outside the closed world: On using machine learning for network intrusion detection. In Proceedings of the 2010 IEEE Symposium on Security and Privacy, Oakland, CA, USA, 16–19 May 2010; pp. 305–316. [Google Scholar]
- Strom, B.E.; Applebaum, A.; Miller, D.P.; Nickels, K.C.; Pennington, A.G.; Thomas, C.B. Mitre Att&ck: Design and Philosophy; Technical Report; The MITRE Corporation: McLean, VA, USA, 2018; Available online: https://www.mitre.org/sites/default/files/publications/pr-18-0944-11-mitre-attack-design-and-philosophy.pdf (accessed on 1 September 2020).
Figure 1.
Endsley’s model of situational awareness.

Figure 2.
Annual distribution of surveyed methods (blue) and papers (green).

Figure 3.
Scores achieved (percentages) on the DARPA 2000 LLDOS 1.0 scenario over years.


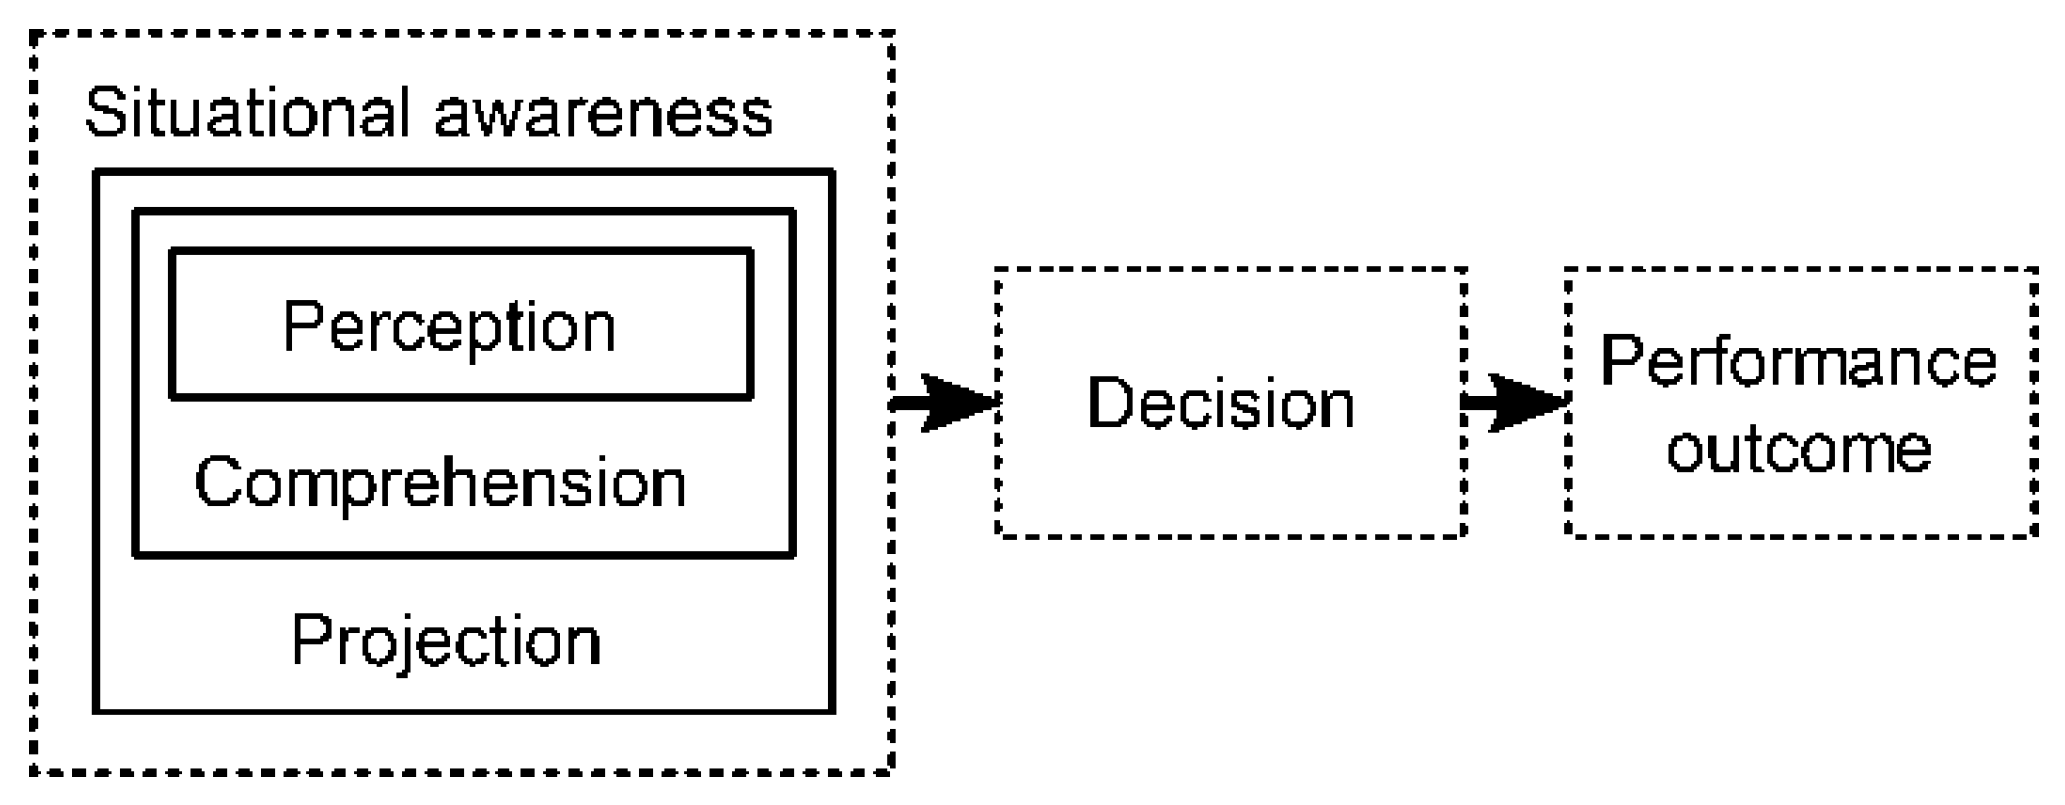
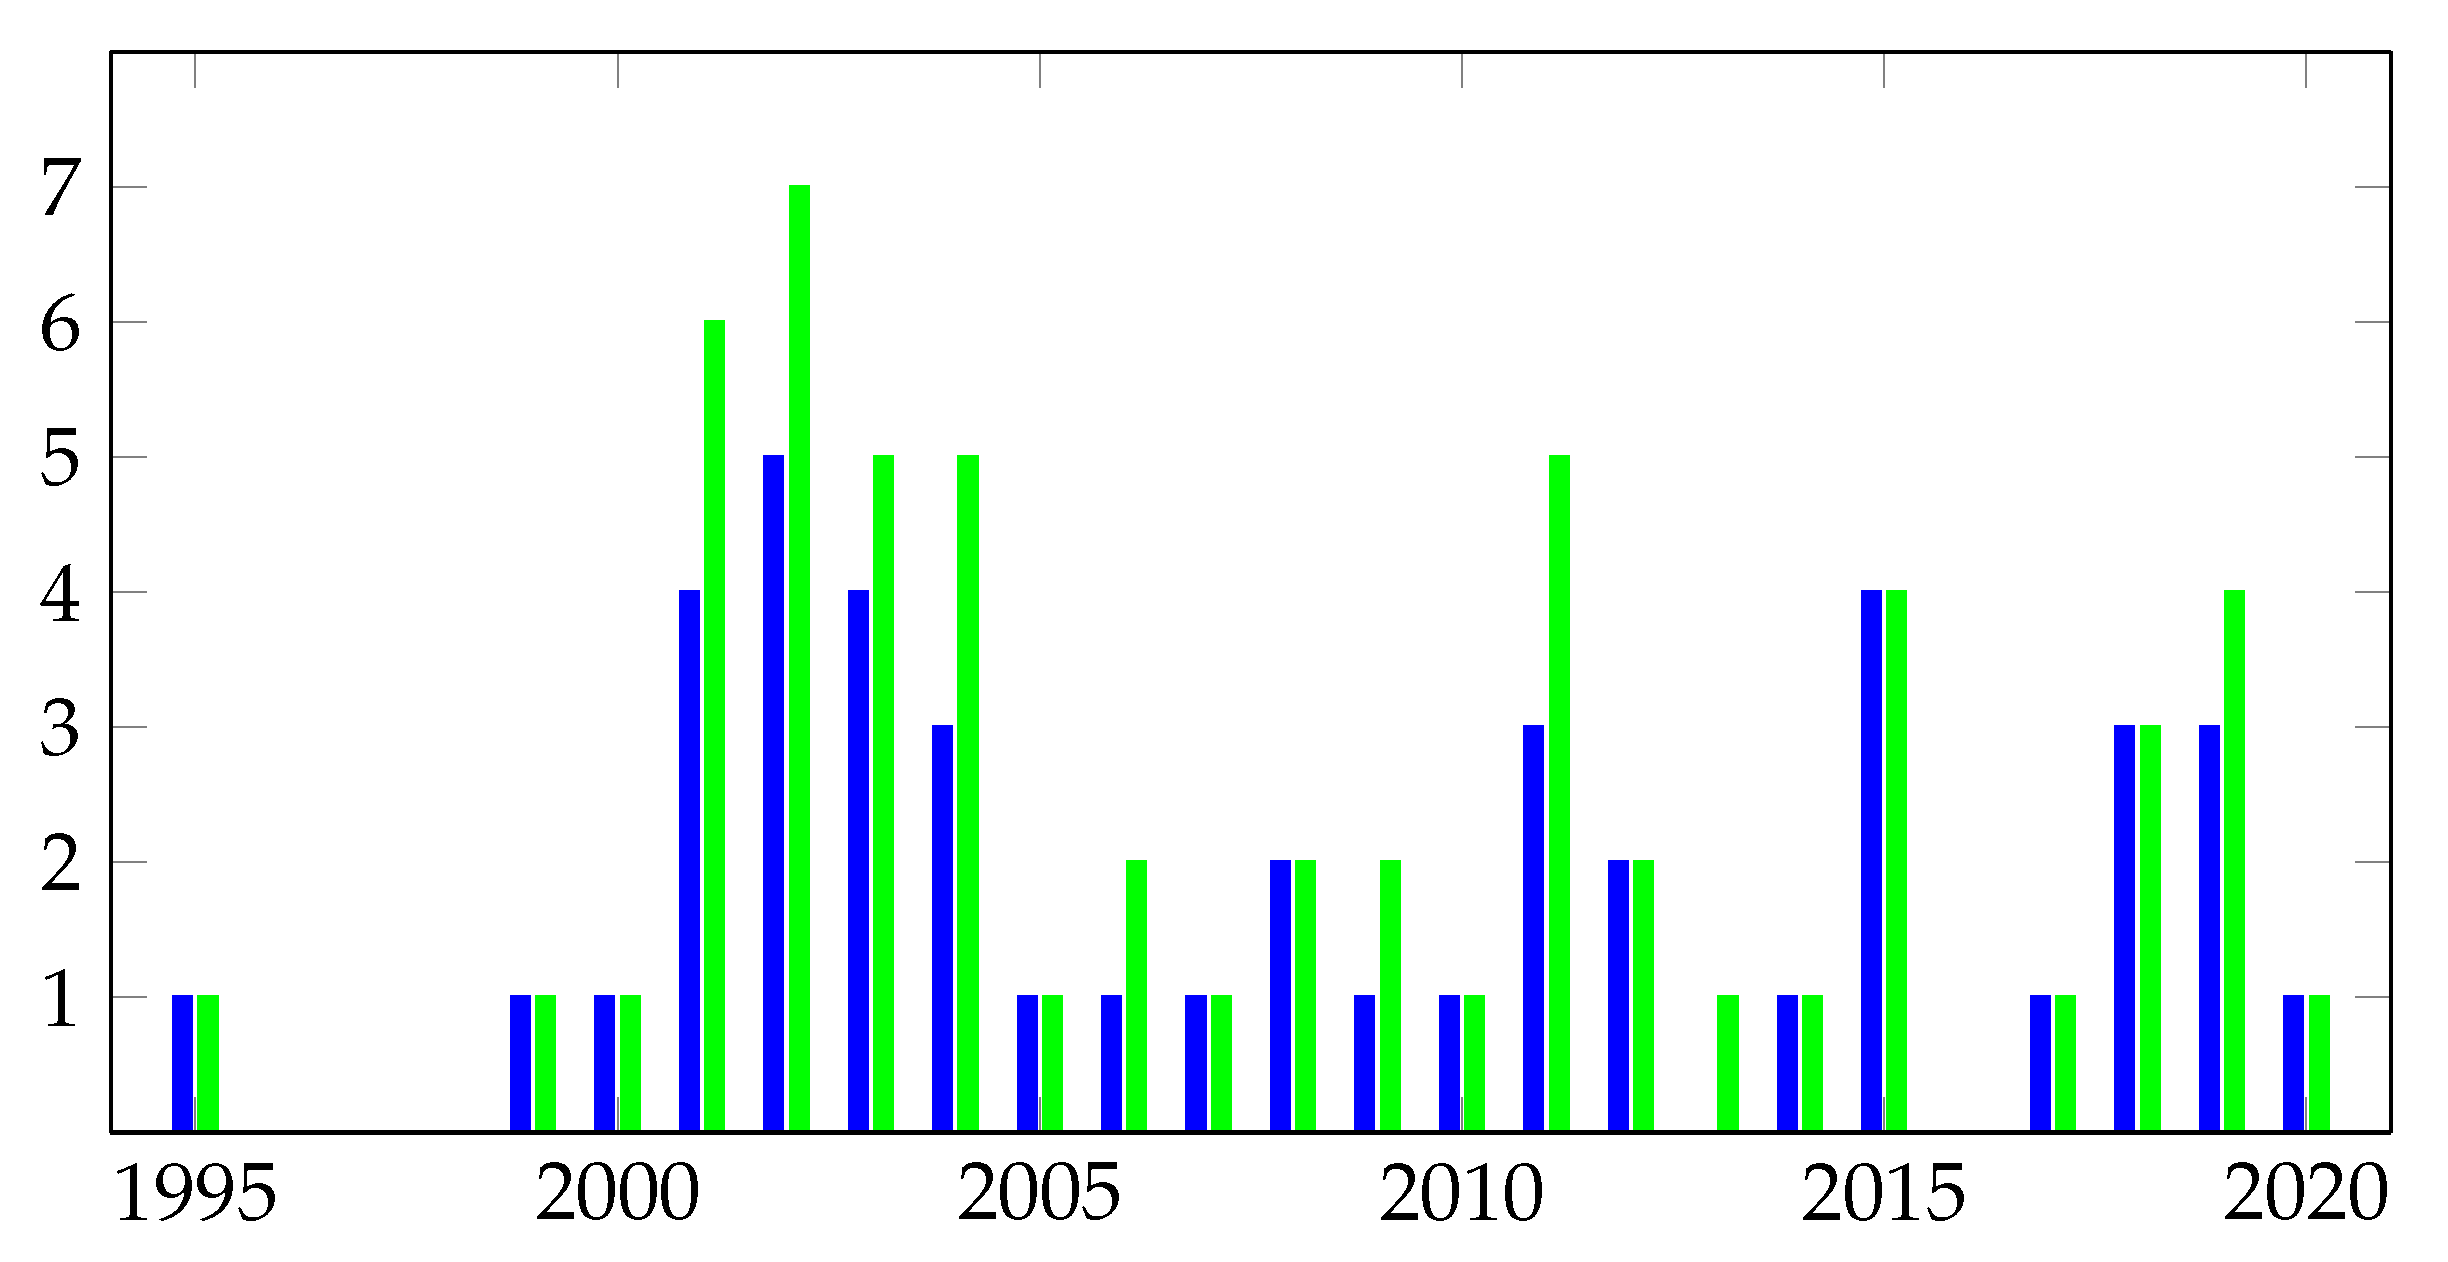
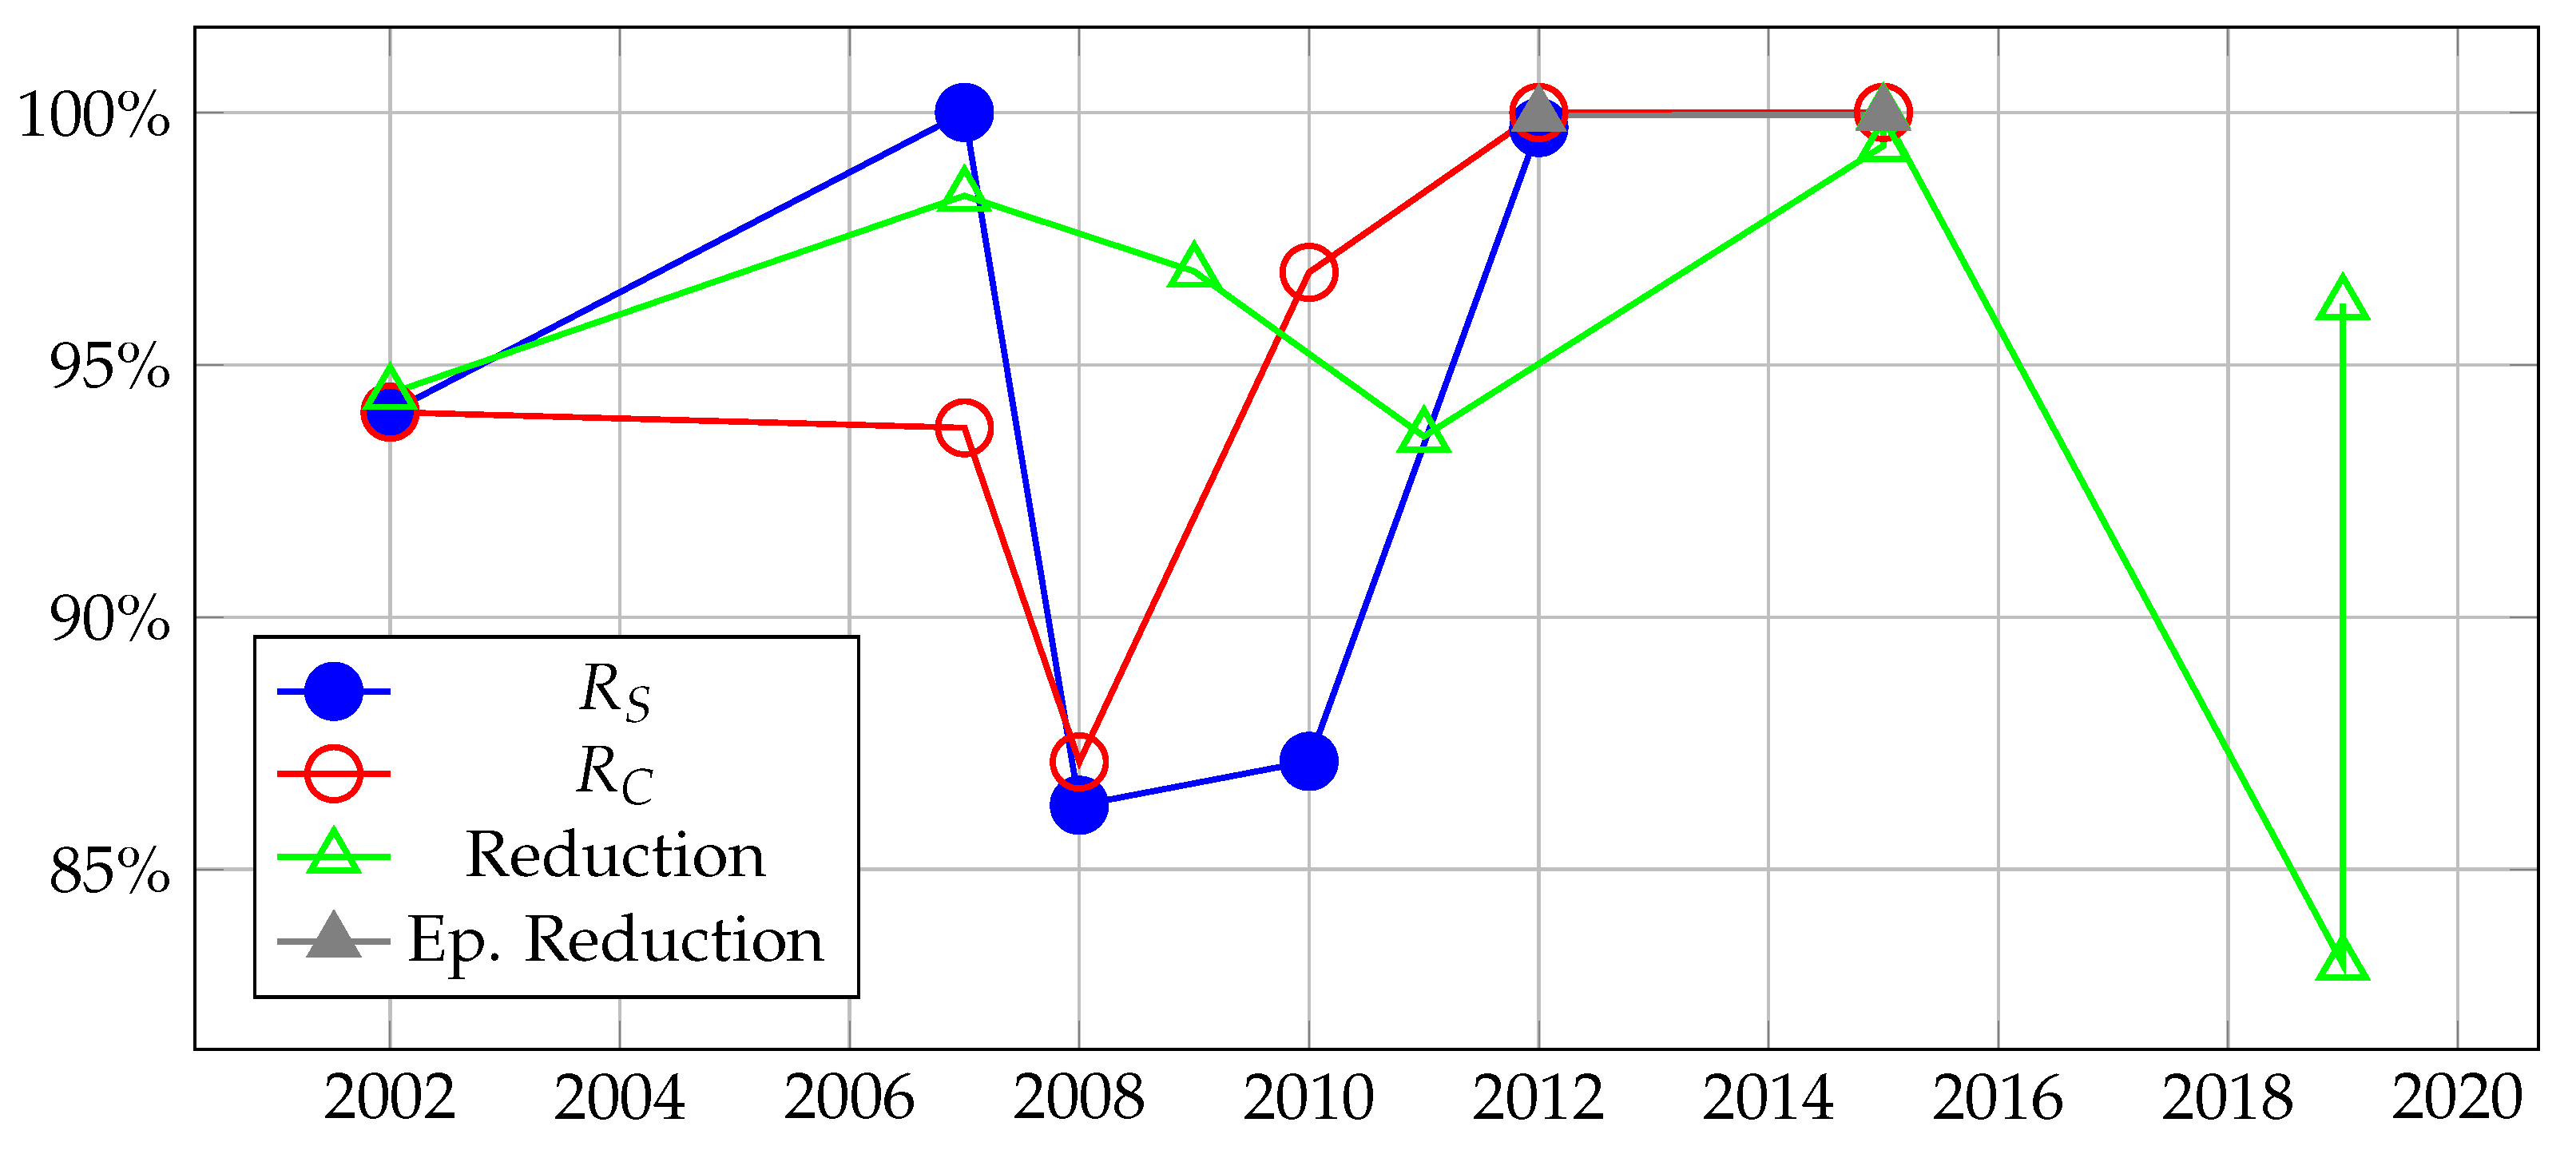
Table 1.
Overview of analyzed surveys in attack detection and prediction.
| Salah et al. [17] | Hubballi and Suryanarayanan [18] | Husák et al. [11] | |
|---|---|---|---|
| Year | 2013 | 2014 | 2018 |
| Scope | Alert correlation | False alert minimization (a subset of more specific methods) | Attack projection Attack intention recognition Attack prediction Network security situation forecasting |
| Classes of models / methods / techniques | Similarity based methods Attribute based Temporal based Sequential based Pre-post conditions Graphs Codebook Markov models Bayesian networks Neural networks Others Case based methods Expert based Expert rules Pre-defined scenarios Inferred knowledge | Signature enhancement Stateful signatures Vulnerability signatures Alarm Mining Clustering Classification Neural Network Frequent pattern mining Alarm Correlation Multi-Step Knowledge based Complementary evidence based Causal relation based Fusion based Attack Graph based Rule based Alarm Verification Flow analysis Alarm Prioritization Hybrid methods | Discrete Models Graph models Attack Graphs Bayesian Networks Markov Models Game Theoretical models Continuous Models Time Series Grey Models Machine Learning and Data Mining Machine Learning Neural Networks SVM (etc.) Data Mining Other Approaches (e.g., similarity based correlation) |
| Notes regarding evaluation | - | - | Evaluation in surveyed proposals: Proof-of-concept Testbed Live data (e.g., honeynet) Public Dataset (DARPA, etc.) Custom Dataset Virtual Attacks Comparison with other algorithms |
| Identified open research problems | Lack of standard strategies for evaluating performance and effectiveness Development of scalable system architectures Improving FP reduction Development of new strategies for coping with unseen types of attacks | Evaluation on a common dataset Analysis of approach performance Standardization of formats and reports Evaluation of systems’ real time operation Adapting to changes in the environment | Methods relying on attack models require continuous model maintenance Low quality of evaluation datasets Low prediction accuracy and usability in practice Evaluation of methods on a common dataset with common and meaningful metrics Discovering novel attacks and security paradigms |
Table 2.
Usage of evaluation metrics in the surveyed papers.
| Metric | Used in # Approaches | References |
|---|---|---|
| Reduction (8) | 6 | [25,26,27,28,29,30] |
| (5) | 4 | [31,32,33,34,35,36,37,38] |
| (6) | 4 | [31,32,33,34,35,36,37,38] |
| Episode Reduction (9) | 2 | [39,40] |
| QoA (7) | 1 | [41] |
| Recall (1) | 0 | - |
| Precision (2) | 0 | - |
| Fragmentation (3) | 0 | - |
| Misassociation (4) | 0 | - |
Table 3.
Overview of the basic properties and evaluation details of the surveyed papers.
| Details | Datasets Used | |||||||||||
|---|---|---|---|---|---|---|---|---|---|---|---|---|
| Papers | Year | Models | Domain Knowledge | Level of Evaluation | Real-Time | Cyber Treasure Hunt | DARPA 1999 | DARPA 2000 | DARPA GCP (ver.) | DEFCON (#) | LiveD-Data | Custom/Experiment |
| Ilgun et al. [8] | 1995 | Language | V | + | ||||||||
| Huang et al. [95] | 1999 | Language | - | |||||||||
| Cuppens and Ortalo [81] | 2000 | Language | F | |||||||||
| Valdes and Skinner [25] | 2001 | Sim. | * | E | + | + | ||||||
| Templeton and Levitt [82] | 2001 | Language | F | |||||||||
| Goldman et al. [75,84] | 2001 | KB, Graph | *** | V | + | |||||||
| Dain and Cunningham [77] | 2001 | ML, DM | * | E | + | 8 | ||||||
| Ning et al. [31,32,33,34] | 2002 | KB | *** | E | + | 8 | ||||||
| Eckmann et al. [86] | 2002 | Language | V | + | ||||||||
| Morin et al. [62,80] | 2002 | KB | *** | F | ||||||||
| Morin and Debar [61] | 2003 | KB | *** | V | ? | + | ||||||
| Cuppens and Miege [60] | 2002 | KB | *** | V | + | |||||||
| Cuppens et al. [83] | 2002 | KB | *** | F | ||||||||
| Cheung et al. [67] | 2003 | KB | *** | V | + | 2.0 | ||||||
| Hughes and Sheyner [74] | 2003 | KB, Graph | *** | F | ||||||||
| Qin and Lee [68,69] | 2003 | Sim., KB | ** | E | 3.1 | 9 | ||||||
| Valeur et al. [26] | 2004 | Sim. | * | E | + | + | + | 9 | + | + | ||
| Ning et al. [66] | 2004 | Sim., KB | ** | V | + | |||||||
| Noel et al. [79] | 2004 | KB, Graph | *** | V | ? | + | ||||||
| Wang et al. [44,65] | 2005 | Sim., Graph | ** | V | + | + | + | + | ||||
| Zhu and Ghorbani [70] | 2006 | ML Ensemble | * | V | ? | + | ||||||
| Yu and Frincke [41] | 2007 | KB, HCPN | ** | E | + | + | ? | |||||
| Liu et al. [37] | 2008 | KB, Graph | ** | E | ? | + | ||||||
| Fava et al. [42] | 2008 | Markov models | * | E | + | + | ||||||
| Sadoddin and Ghorbani [28] | 2009 | DM: FSP_Growth | * | E | ? | + | + | + | ||||
| Ren et al. [76] | 2010 | Sim., ML | * | E | + | + | + | |||||
| Roschke et al. [29] | 2011 | Graph | ** | E | ? | + | ||||||
| Ahmadinejad et al. [91] | 2011 | Graph, Sim. | ** | E | + | + | + | |||||
| Albanese et al. [89] | 2011 | KB, Graph | *** | E | + | + | ||||||
| Saad and Traore [35,36] | 2012 | KB, Graph | ** | E | + | + | ||||||
| Soleimani and Ghorbani [39] | 2012 | DM, ML: DT | * | E | + | + | + | |||||
| Albanese et al. [96] | 2014 | KB, Rules | *** | - | + | |||||||
| Fredj [90] | 2015 | KB, Graph | ** | E | + | 17 | ||||||
| GhasemiGol and Ghaemi-Bafghi [27] | 2015 | ML | * | E | + | |||||||
| Ramaki et al. [40] | 2015 | DM on streams | ** | E | + | + | 3.1 | + | ||||
| Ramaki et al. [88] | 2015 | KB, Graph, ML | ** | E | + | + | ||||||
| Holgado et al. [72] | 2017 | KB, ML: HMM | ** | V | + | + | + | |||||
| Barzegar and Shajari [38] | 2018 | Sim. | * | E | + | + | ||||||
| Husák and Kašpar [11] | 2018 | DM: TopKRules | * | V | ? | + | ||||||
| Ghafir et al. [64,87] | 2018 | KB, ML: HMM | ** | E | + | + | + | |||||
| Milajerdi et al. [73] | 2019 | KB, Graph | *** | E | + | + | + | |||||
| Zhang et al. [30] | 2019 | ML: MCh | * | E | + | + | ||||||
| Zhang et al. [93] | 2019 | ML, Rules | * | E | + | + | * | |||||
| Hu et al. [94] | 2020 | ML, Graph | ** | V | 23 | + | ||||||
Table 4.
Selected success metrics calculated on the basis of results on the DARPA 2000 dataset.
| Papers | Year | Scenario LLDOS 1.0 | ||
|---|---|---|---|---|
| (6) | (5) | QoA (7) | ||
| Saad and Traore [35,36] | 2012 | (P) | (P) | |
| Ramaki et al. [88] | 2015 | (P) | ||
| Ren et al. [76] | 2010 | |||
| Ning et al. [31,32,33,34] | 2002 | |||
| Yu and Frinckle [41] | 2007 | |||
| Liu et al. [37] | 2008 | |||
Table 5.
Alert reduction calculated on the basis of results on the DARPA 2000 dataset.
| Papers | Year | LLDOS 1.0 | Reduction on LLDOS 1.0 and LLDOS 2.0.2 | |
|---|---|---|---|---|
| Reduction (8) | Episode Reduction (9) | |||
| GhasemiGol and Ghaemi-Bafghi [27] | 2015 | |||
| Ramaki et al. [88] | 2015 | |||
| Yu and Frincke [41] | 2007 | |||
| Sadoddin and Ghorbani [28] | 2009 | |||
| Zhang et al. [30] | 2019 | (P) | ||
| Ning et al., Ning and Xu [31,32,33,34] | 2002 | |||
| Ahmadinejad et al. [91] | 2011 | |||
| Zhang et al. [93] | 2019 | |||
| Valeur et al. [26] | 2004 | |||
| Ramaki et al. [40] | 2015 | (P) | ||
| Soleimani and Ghorbani [39] | 2012 | (P) | ||
Publisher’s Note: MDPI stays neutral with regard to jurisdictional claims in published maps and institutional affiliations. |
© 2020 by the authors. Licensee MDPI, Basel, Switzerland. This article is an open access article distributed under the terms and conditions of the Creative Commons Attribution (CC BY) license (http://creativecommons.org/licenses/by/4.0/).
Share and Cite
MDPI and ACS Style
Kovačević, I.; Groš, S.; Slovenec, K. Systematic Review and Quantitative Comparison of Cyberattack Scenario Detection and Projection. Electronics 2020, 9, 1722. https://doi.org/10.3390/electronics9101722
AMA Style
Kovačević I, Groš S, Slovenec K. Systematic Review and Quantitative Comparison of Cyberattack Scenario Detection and Projection. Electronics. 2020; 9(10):1722. https://doi.org/10.3390/electronics9101722
Chicago/Turabian StyleKovačević, Ivan, Stjepan Groš, and Karlo Slovenec. 2020. "Systematic Review and Quantitative Comparison of Cyberattack Scenario Detection and Projection" Electronics 9, no. 10: 1722. https://doi.org/10.3390/electronics9101722
Note that from the first issue of 2016, this journal uses article numbers instead of page numbers. See further details here.