Article

Minimizing Contamination from Plastic Labware in the Quantification of C16 and C18 Fatty Acids in Filter Samples of Atmospheric Particulate Matter and Their Utility in Apportioning Cooking Source Contribution to Urban PM2.5

1
Department of Chemistry, Hong Kong University of Science & Technology, Clear Water Bay, Hong Kong, China
2
Division of Environment & Sustainability, Hong Kong University of Science & Technology, Clear Water Bay, Hong Kong, China
3
Guangdong-Hongkong-Macau Joint Laboratory of Collaborative Innovation for Environmental Quality, Hong Kong University of Science & Technology, Clear Water Bay, Hong Kong, China
*
Author to whom correspondence should be addressed.
Atmosphere 2020, 11(10), 1120; https://doi.org/10.3390/atmos11101120
Submission received: 18 August 2020 / Revised: 12 October 2020 / Accepted: 14 October 2020 / Published: 19 October 2020
(This article belongs to the Special Issue Chemical Analysis Methods for Particle-Phase Pollutants)

Abstract

:
Palmitic acid (C16:0) and stearic acid (C18:0) are among the most abundant products in cooking emission, and thus could serve as potential molecular tracers in estimating the contributions of cooking emission to particulate matter (PM2.5) pollution in the atmosphere. Organic tracer analysis in filter-based samples generally involves extraction by organic solvents, followed by filtration. In these procedures, disposable plastic labware is commonly used due to convenience and as a precaution against sample-to-sample cross contamination. However, we observed contamination for both C16:0 and C18:0 fatty acids, their levels reaching 6–8 ppm in method blanks and leading to their detection in 9% and 42% of PM2.5 samples from Hong Kong, indistinguishable from the blank. We present in this work the identification of plastic syringe and plastic syringe filter disc as the contamination sources. We further demonstrated that a new method procedure using glass syringe and stainless-steel syringe filter holder offers a successful solution. The new method has reduced the contamination level from 6.6 ± 1.2 to 2.6 ± 0.9 ppm for C16:0 and from 8.9 ± 2.1 to 1.9 ± 0.8 ppm for C18:0 fatty acid. Consequently, the limit of detection (LOD) for C16:0 has decreased by 57% from 1.8 to 0.8 ppm and 56% for C18:0 fatty acid from 3.2 to 1.4 ppm. Reductions in both LOD and blank variability has allowed the increase in quantification rate of the two fatty acids in ambient samples and thereby retrieving more data for estimating the contribution of cooking emission to ambient PM2.5. With the assistance of three cooking related tracers, palmitic acid (C16:0), stearic acid (C18:0) and cholesterol, positive matrix factorization analysis of a dataset of PM2.5 samples collected from urban Hong Kong resolved a cooking emission source. The results indicate that cooking was a significant local PM2.5 source, contributing to an average of 2.2 µgC/m3 (19%) to organic carbon at a busy downtown roadside location and 1.8 µgC/m3 (15%) at a general urban site.

Graphical Abstract

1. Introduction

Palmitic acid (C16:0) and stearic acid (C18:0) are among the most abundant particulates in cooking emission. They exist in the form of triglycerides, phospholipids, or free fatty acids in oil or meat. They can be released or formed by hydrolysis or through thermal oxidation during heating [1,2]. Since they are ubiquitous in plants and animal fats, they were found in all cooking emission particulate matter (PM), with compositions mirroring that of cooking oil or meat kind [3]. Early literature [2] has pointed out that 21% of primary fine organic aerosol may very likely come from cooking in heavily industrialized and urbanized areas of Los Angeles. Continuing research found that different cooking styles involving various ingredients, procedures, fuel types, temperature and ventilation equipment would contribute to different pollutant emission magnitude [4,5]. A more recent air quality campaign in Beijing deployed more advanced instrumentation such as an Aerodyne High-Resolution Time-of-Flight Aerosol Mass Spectrometer (HR-ToF-AMS), and found that 24.4% of total organic mass could be attributed to cooking-related organic aerosols outdoors [6]. Later AMS and Aerosol Chemical Speciation Monitor (ACSM) studies conducted in an urban roadside location in Hong Kong also obtained similar contributions from cooking at 34.6% [7] and 24.2% [8]. In indoor environments, cooking could be a more important contributor to PM. In one study, cooking was revealed to be the biggest contributor of PM indoors, accounting for about 52.5% of the collected samples [9,10]. In both ambient and source samples, as well as in different cooking styles, palmitic acid and stearic acid were found to be among the most abundant species emitted in the particulate phase [2,3,4,10,11,12,13,14]. Thus, they would serve as potential organic tracers along with other cooking related organic species such as cholesterol to estimate the contribution of cooking emission to PM2.5 pollution in the atmosphere [15,16,17,18].
Organic tracer analysis of filter samples often involves extraction using organic solvents such as dichloromethane or methanol and subsequent filtration for purification, removal of filter fiber residue and insoluble particulate matter (e.g., [4,19,20]). In these procedures, disposable plastic labware, such as the syringe, syringe filter discs, and pipette tips, are commonly used due to convenience and as a precautionary measure to avoid sample-to-sample cross contamination. However, we have observed high background contamination of palmitic acid and stearic acid even in method blanks. The method blank could amount to 39% and 96% of palmitic acid and stearic acid, respectively, compared to what may be present in ambient samples, assuming their level at 38 and 20 ng/m3 as reported by [21] in most of their samples collected in Hong Kong.
Palmitic acid and stearic acid contamination issues were also found in the biological field assessing the impact of leachates from plastic consumables to biological samples [22,23,24,25]. A few studies further investigated the contamination levels of palmitic acid and stearic acid in biological samples and its origins [26,27,28]. It was found that the contamination might all or partially be associated with the plastic apparatuses that are commonly used in biological laboratories. Different extraction solvents were tested, showing organic solvent would most likely help leach the two fatty acids from plastics compared to water [28]. It was also reported that pre-washing or soaking the plastic materials with solvents was a way to remove the contaminants [28].
The findings from the literature as well as our own experience indicate that palmitic acid and stearic acid contamination is quite common in laboratories with different settings. Since the amount of fatty acid contamination might also be affected by different product brands, solvents used or different apparatus [28], the amount of contamination could be unique to different laboratories and method specific. Therefore, we have conducted this study to assess the fatty acid contamination level in the method used by our laboratory, which is a typical method for determining polar organic compounds in aerosol samples [29]. We examined the contamination of palmitic acid and stearic acid in different combinations of plastic ware and glassware used. The second objective is to propose and test a new method that minimizes the contamination of palmitic acid and stearic acid as to allow their reliable quantification in ambient PM samples. The third objective is to demonstrate the utility of palmitic and stearic acid in source apportionment analysis by the positive matrix factorization (PMF) model to quantify contributions of cooking emissions.

2. Experiments

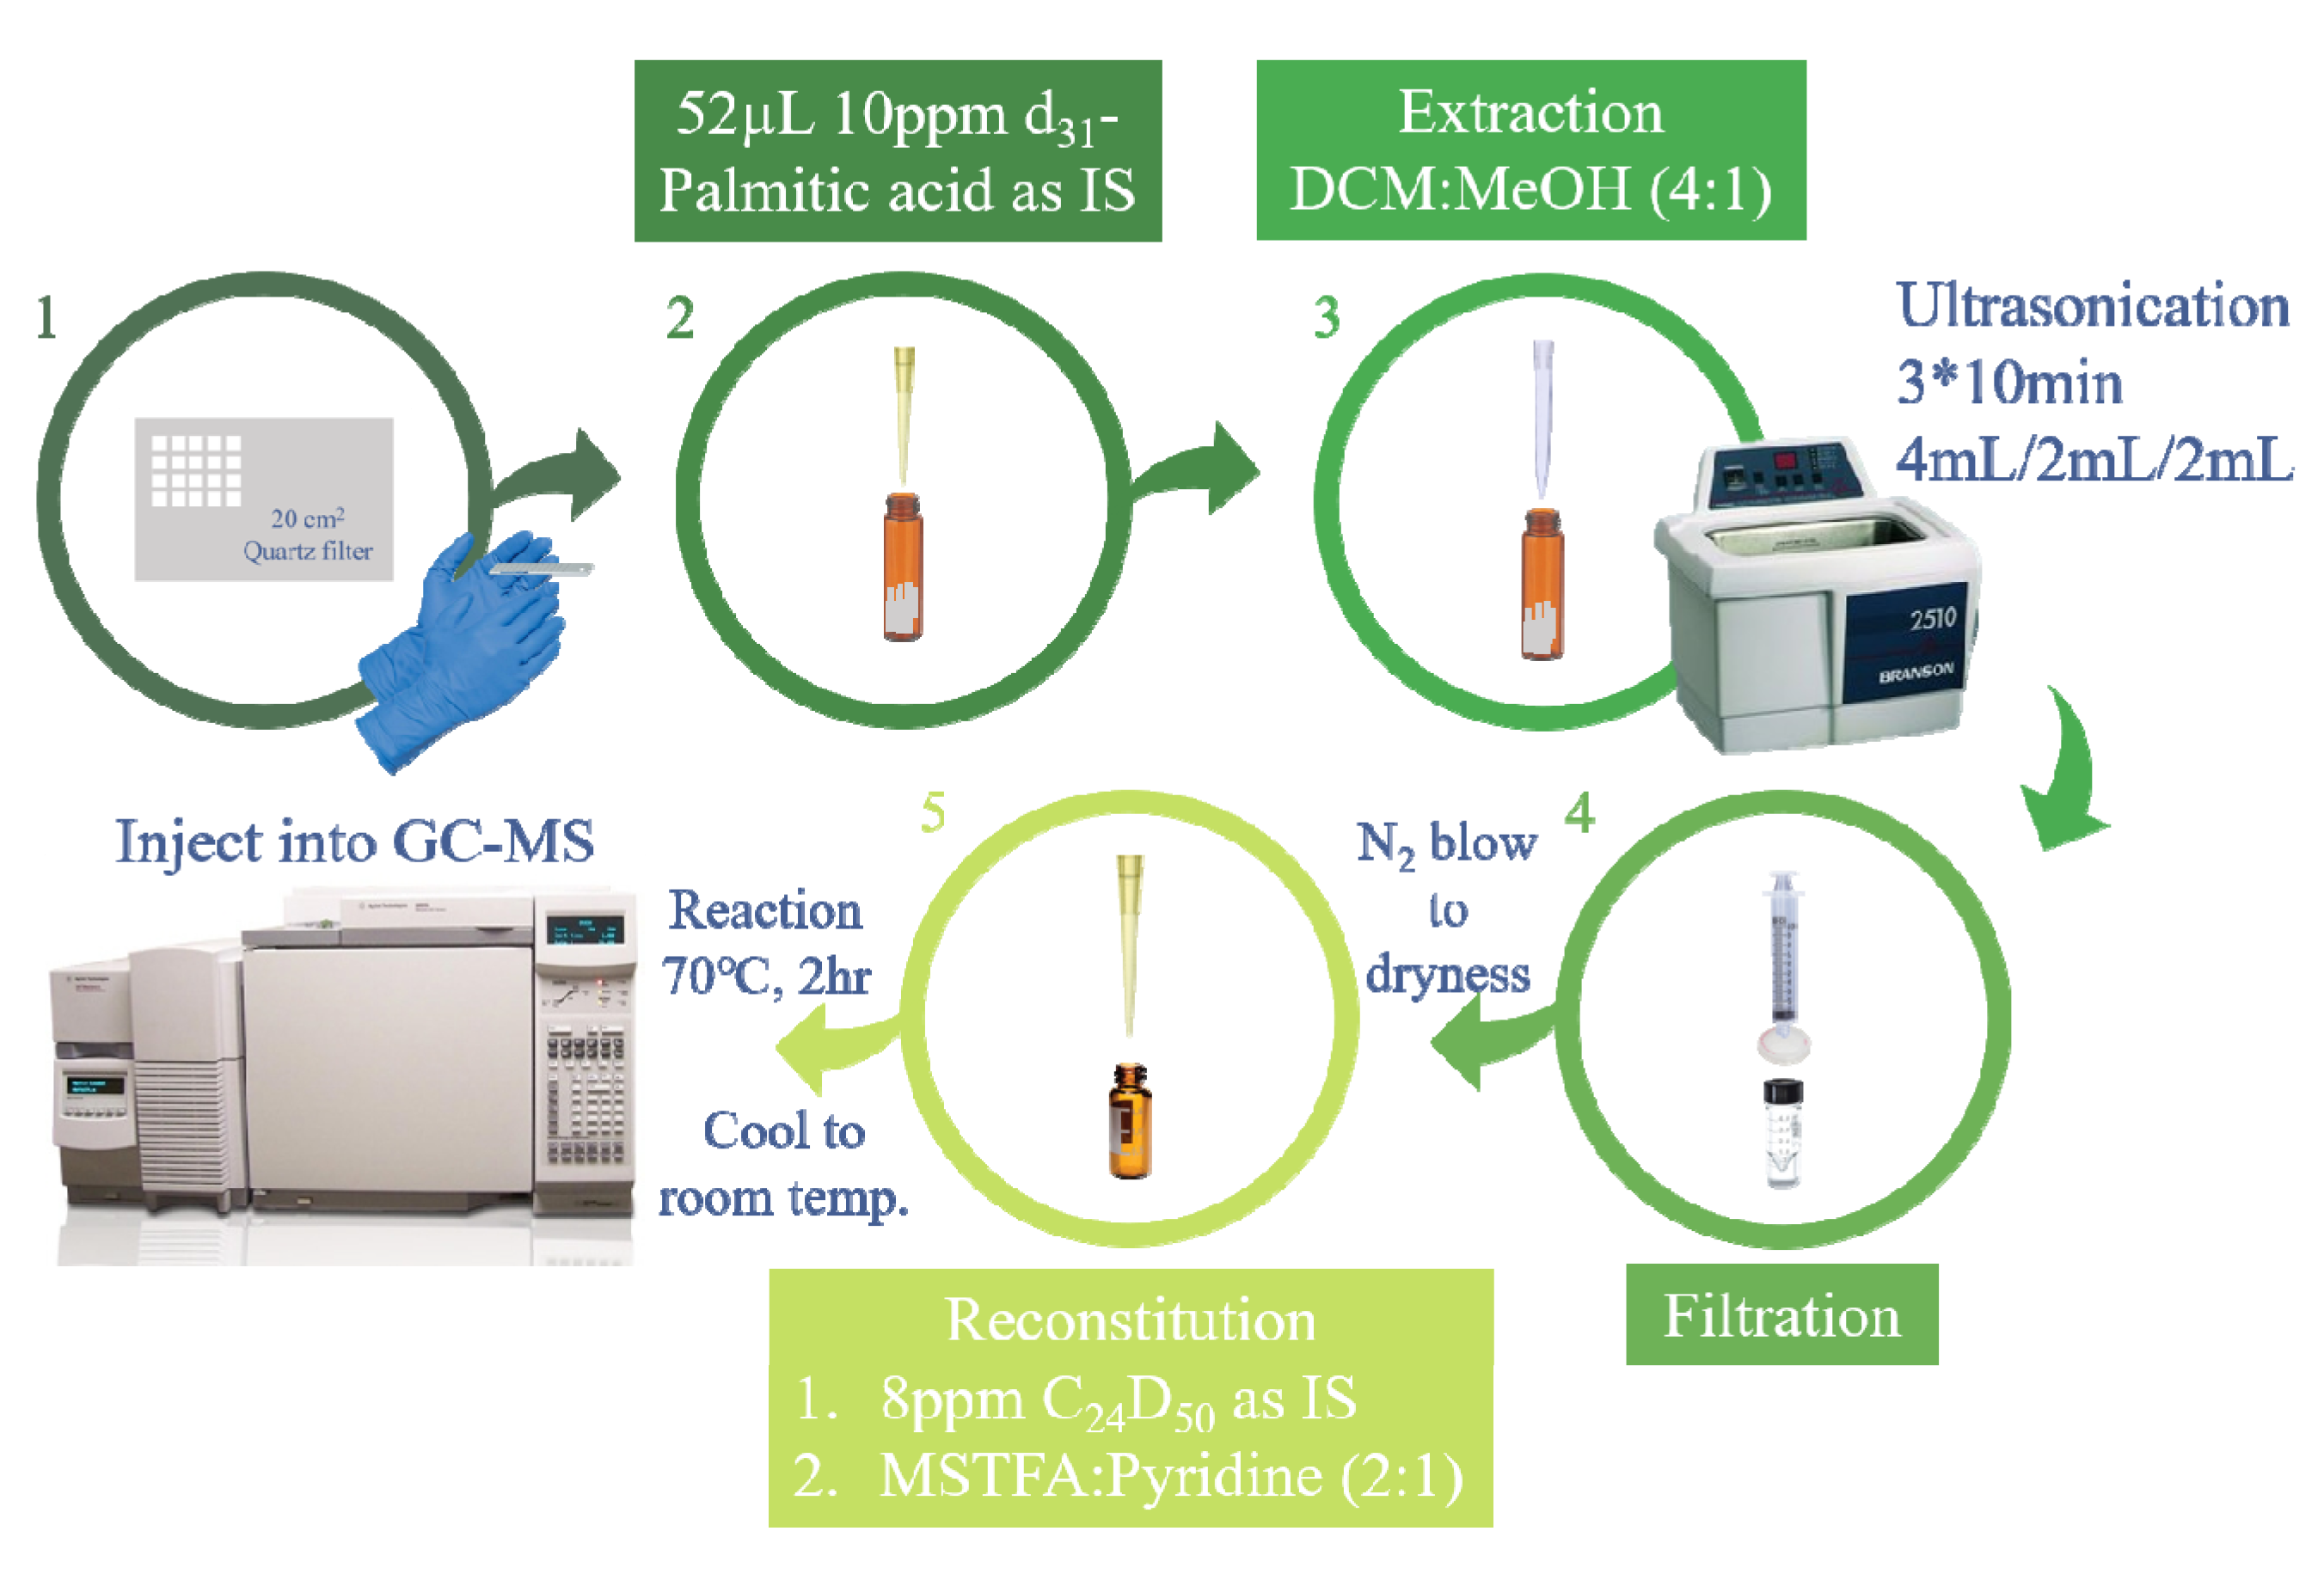
2.1. Original Analytical Method

Our original method has been used for analyzing a wide range of polar organic compounds including sugar alcohols, aromatic acids, dicarboxylic acids as well as fatty acids that can be derivatized and subsequently amenable for Gas Chromatography-Mass Spectrometry (GC-MS) analysis [29,30,31]. This method saves time from performing individual experiments for different compound classes. Figure 1 shows the flowchart of sample pretreatment steps of this method. Briefly, during sample pretreatment, an aliquot of 20 cm2 exposed filter material was removed from the whole filter (20 × 25 cm) for extraction. Before adding extraction solvent, consisting of dichloromethane (DCM):methanol (4:1) (HPLC grade, Duksan, Ansan City, Gyeonggi Province, South Korea), 52 µL 10 ppm d31-palmitic acid in acetonitrile was spiked onto the filter as internal standard and the filter was set aside for the solvent to dry. The solution was then ultra-sonicated in water bath at room temperature three times, each lasting 10 min. The solvent volume used for each extraction was 4, 2, and 2 mL, respectively. After that, the solution was filtered through the plastic syringe (Terumo, Tokyo, Japan) and hydrophobic polytetrafluororethylene (PTFE) membrane 0.2 µm syringe filter disc that is housed in polypropylene (PP) material (Pall). The filtrate was blown to dryness using ultra-high pure nitrogen gas and reconstituted to 200 µL with a mixture of N-methyl-N-trimethylsilyl-trifluoroacetamide (MSTFA) derivatization agent (Meryer, Shanghai, China, 97%), pyridine (Sigma-Aldrich, St. Louis, MO, USA) as a catalyst and a second internal standard of 8 ppm d50-tetracosane (C24D50) (Sigma-Aldrich) in hexane, (2:1:1.14 v/v). The derivatization reaction is required to increase the volatility and thermal stability of the polar target analytes for GC detection. MSTFA targets polar compounds containing functional groups with active hydrogen atoms such as that in carboxylic group, hydroxyl group etc. After the derivatization reaction, the active hydrogens are replaced with trimethylsilyl groups. The final solution was allowed to react at 70 °C for 2 h. After cooling to room temperature, 1 µL of the sample was injected into a GC-MS system (Agilent 6890/5973N) for analysis. The GC-MS instrumental parameters were set as the following. The injector, operated in splitless mode, was set at 275 °C. Compounds were separated on a DB-5MS column (30 m × 0.25 mm × 0.25 μm, J&W Scientific, Folsom, CA, USA) using ultra high pure helium as the carrier gas at 1.2 mL/min. The GC oven temperature was initially set at 80 °C for 5 min, increased to 200 °C at 3 °C/min and held for 2 min, then to 310 °C at 10 °C/min and held for 25 min. The MS analysis was conducted in electron impact positive (EI+) scan mode over an m/z range of 50−650 amu. The ion source, quadrupole, and interface temperatures were kept at 230, 150, and 280 °C, respectively. The quantification ions for palmitic acid and stearic acid were m/z 313 and 341. Plastic pipette tips were used in steps 2, 3 and 5, as shown in Figure 1, for transferring different solutions. Calibration was completed with the same approach by first spiking d31-palmitic acid as the internal standard and mixed standard solutions on an aliquot of 20 cm2 prebaked (at 550 °C for 12 h) blank filter material, then following the whole procedure described above. The calibration had six calibration points ranging from 0 ppm to 5 ppm.

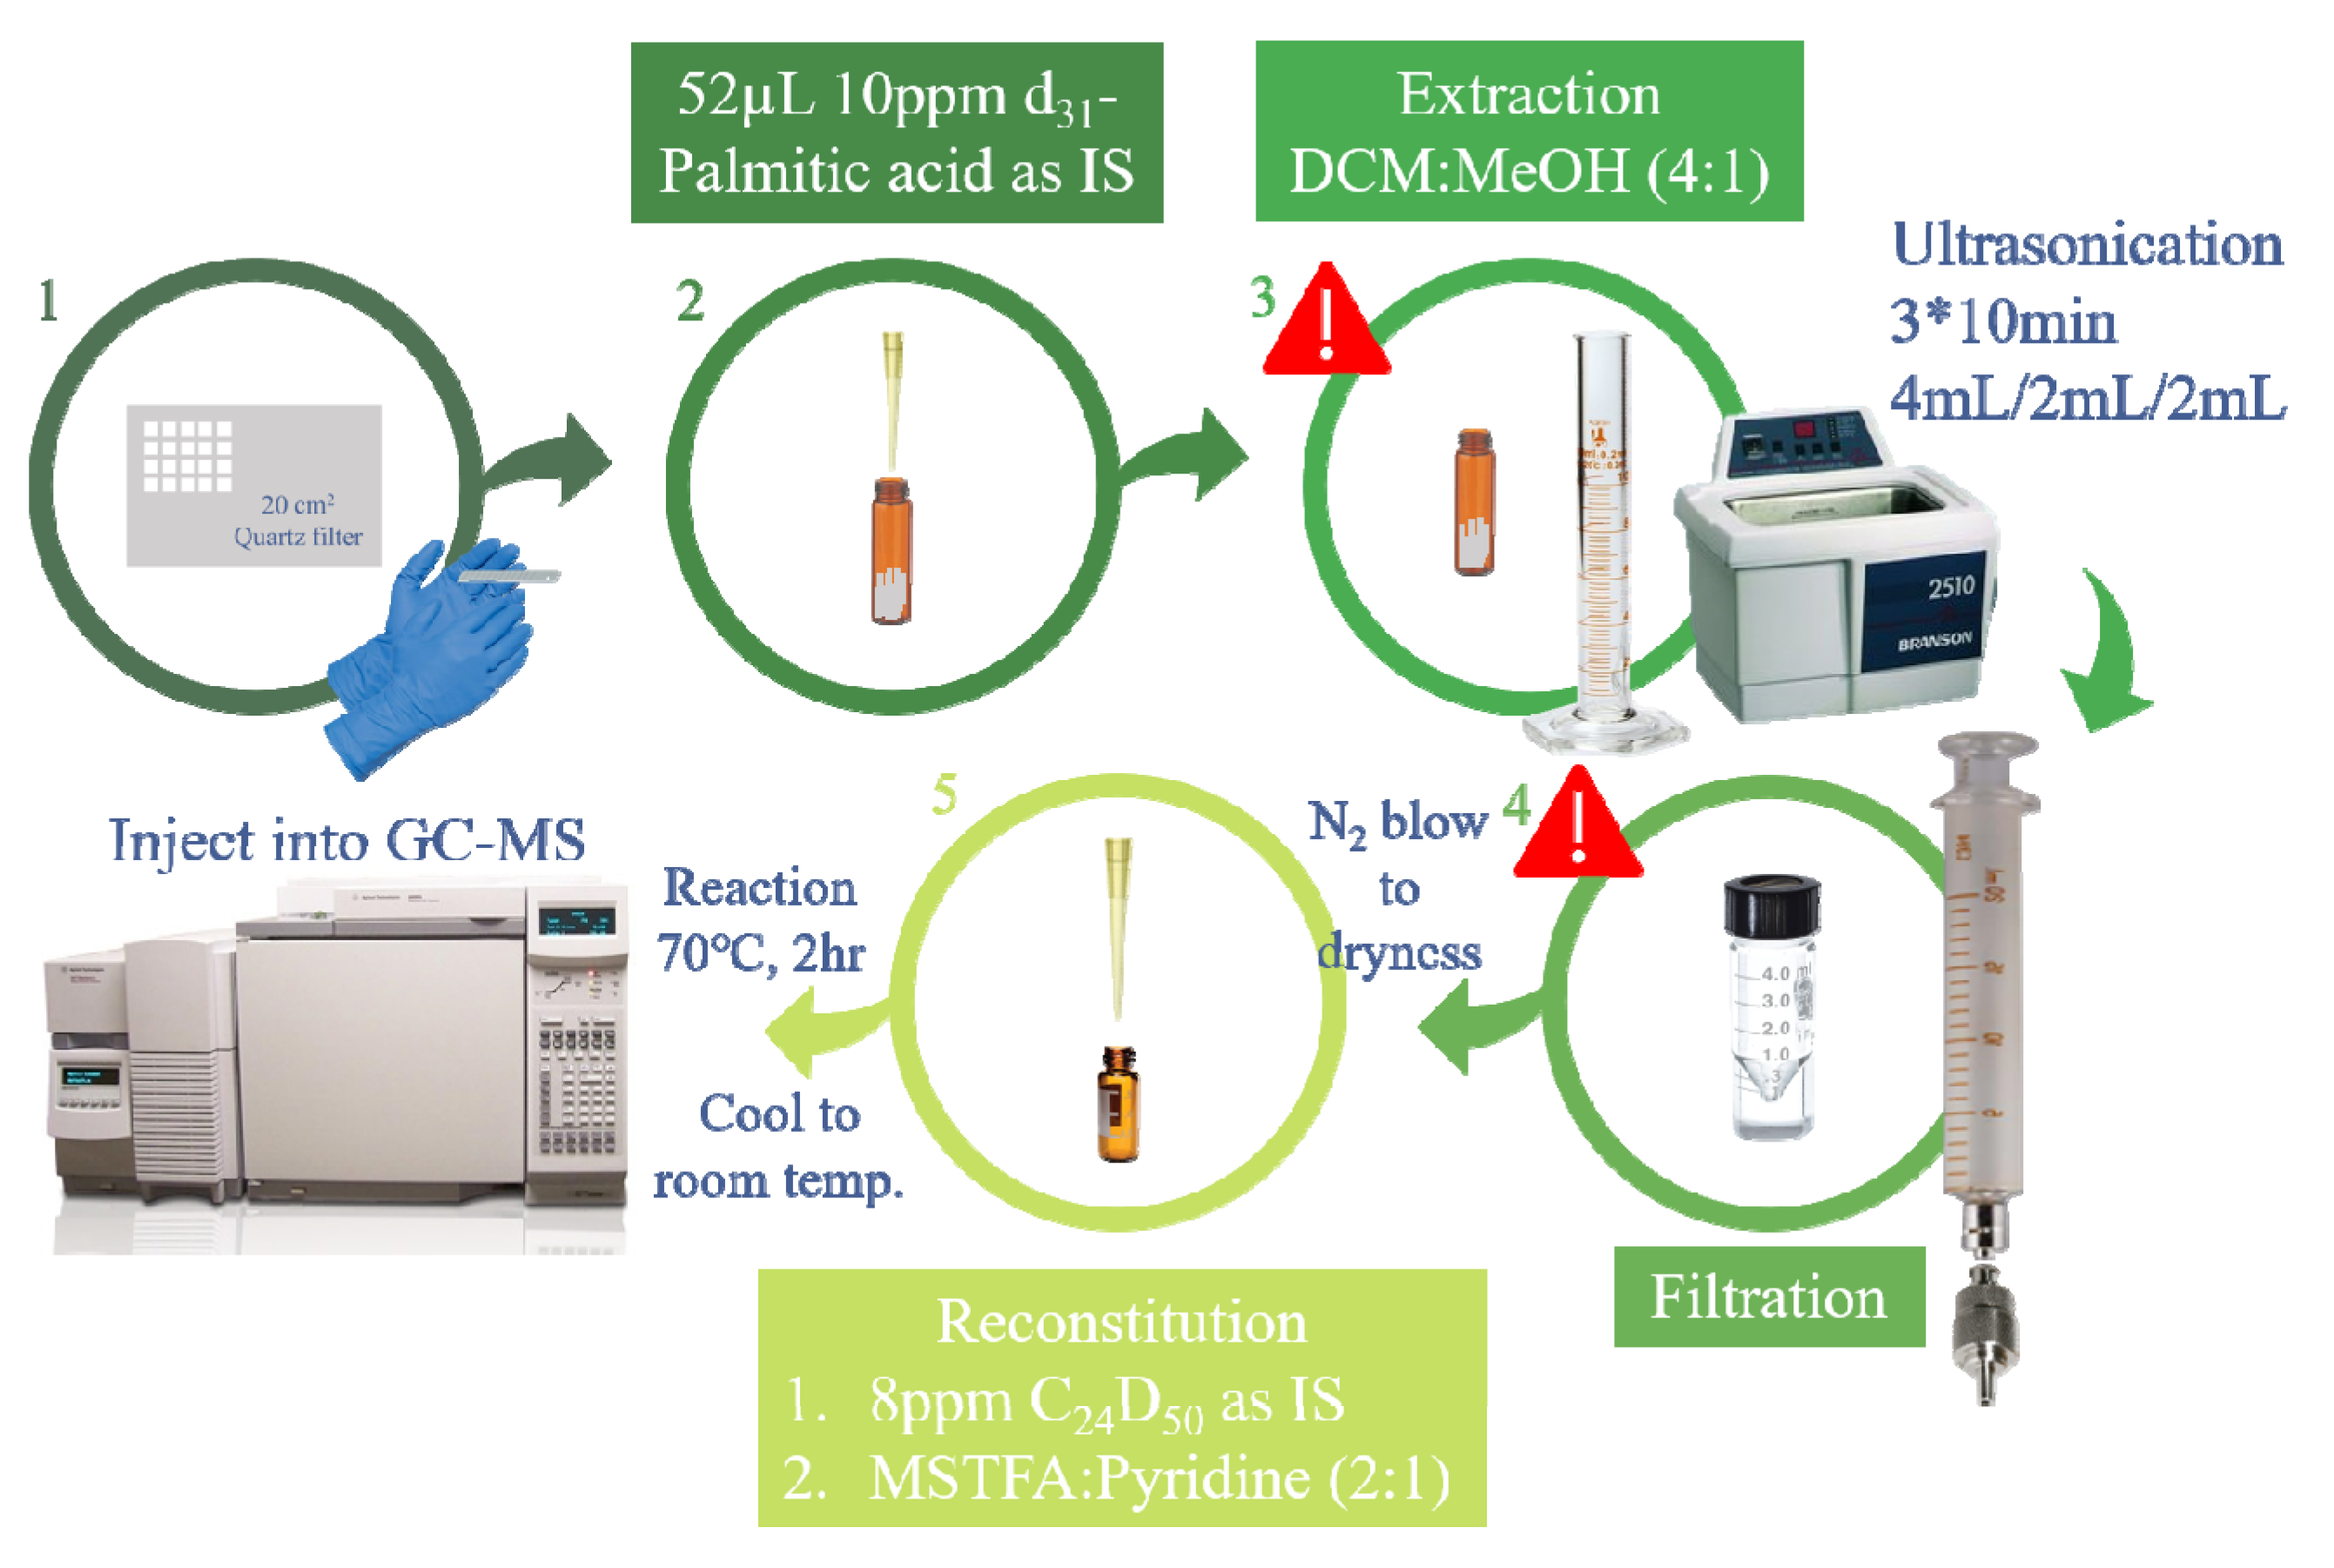
2.2. Revised Analytical Method

A new method has been devised to minimize contamination of palmitic acid and stearic acid. The new sample preparation procedure is shown in Figure 2. The exclamation marks in the figure highlight the steps that have been revised from the original method. The other experimental procedure steps have remained unchanged.
Specifically, the glass measuring cylinder and glass syringe became the alternatives in the extraction and filtration process. As for syringe filter discs, there are no commercially available plastic-free products that integrate holder and filter, therefore a stainless-steel syringe filter holder (Millipore), together with a PTFE membrane filter (Pall), was proposed. The reusable stainless-steel syringe filter holder is an environmentally friendly alternative to reduce the amount of plastic consumable waste. The PTFE filter was the same size specification as the one contained in the syringe filter discs. The stainless-steel filter holder contains a pair of PTFE O-rings and gaskets to seal the gap between inlet cover and outlet base to prevent leakage and to secure filter membrane to assure all solution pass through the membrane. PTFE is commonly known for its chemical resistance to aggressive organic solvents and expected to be free from fatty acids.

2.3. Ambient Filter Samples and Their Analysis

There are two groups of ambient samples involved in this work, analyzed using the original and the revised methods, respectively. The first group of samples, analyzed using the original method, consists of 175 ambient PM2.5 filter samples from four sites in the Pearl River Delta (PRD) in South China, namely urban Guangzhou, Dongguan, Nansha, and Nanhai, and of 87 PM2.5 filter samples from two sites in Hong Kong (HK) (Yuen Long and Lok Ma Chau). Additionally, 39 field blanks were analyzed using the original method. The second group consists of 27 PM2.5 filter samples from one site (Mong Kok) in HK. A set of 16 HK ambient PM2.5 filter samples were re-analyzed to compare the performance of the original and revised method.
Among all the ambient samples, we chose a sub-set of 55 samples collected at two urban locations in HK to demonstrate the utility of C16:0 and C18:0 fatty acids in apportioning source contributions of cooking emissions to PM2.5 by a receptor model. These two urban sites, ~25 km apart, are expected to share similar major urban sources such as cooking emissions and vehicular emissions and regional sources. Combining samples from the two sites also provides an adequate sample size needed for PMF analysis. The details of sampling and site characteristics for these samples are relevant in informing the source apportionment results and thus described below.
The 55 samples include 28 from Yuen Long (YL), an urban air quality monitoring station (AQMS), and 27 from Mong Kok (MK), a roadside site in a downtown district of high-density business establishments. The YL site is located on the rooftop of Yuen Long District Branch Office Building (22°26′41.7″ N, 114°01′21.7″ E) in a mixed residential/commercial area but also near traffic. The MK site is located at the junction of two main roads (22°19′26.4″ N, 114°9′57.6″ E) where vehicle exhaust is a major air pollution source. Restaurants were established around the two sampling sites. The PM2.5 filter-based samples were collected onto prebaked 8″ × 10″ quartz fiber filters by high-volume PM2.5 samplers at a flow rate of 1.13 m3/min. At the YL site, PM2.5 filter-based samples were collected during wintertime from 6 December to 30 December 2016. There was one sampling day every 4 days and each sampling day was divided into 4 sampling periods, namely 06:00–11:00 (P1), 11:00–16:00 (P2), 16:00–21:00 (P3) and 21:00–06:00 (P4). At the MK site, PM2.5 quartz filter-based samples were collected in summer 2017 from 9 May to 30 May. The samples were collected once every 3 days and each sampling day was divided to 3 sampling periods only, from P1 to P3. Prior to sampling, blank quartz fiber filters were prebaked at 550 °C for 12 h to remove any organic contaminants. Two field blanks at each site were collected to check for contamination from the field. After sampling, all filter samples were stored at −18 °C before analysis.
The input chemical compounds for the receptor model were analyzed by a suite of standardized chemical speciation protocols [31], which are briefly described below. Teflon filters obtained for PM2.5 were mass measured by a gravimetric method and elementals by energy dispersive X-ray fluorescence spectrometer. Water-soluble ions were quantified also on Teflon filters by ion chromatography. The quartz filters obtained were analyzed for (1) organic carbon (OC) and elemental carbon (EC) by a thermal/optical transmittance method; (2) non-polar organic compounds (NPOCs) including polycyclic aromatic hydrocarbons (PAHs), hopanes and alkanes by thermal-desorption gas chromatography coupled with mass spectrometry (TD-GC/MS), and (3) polar organic compounds and secondary organic aerosol (SOA) tracers by GC/MS with n-methyl-n-(trimethylsilyl)trifluoroacetamide (MSTFA) derivatization method described above.

2.4. Source Apportionment by PMF Model with Cooking Related Tracers

The potential of fatty acids and cholesterol to act as cooking emission tracers was studied through the PMF model (EPA-PMF v5.0). The PMF receptor model is a multivariate factor analysis tool to solve the chemical mass balance equation (Equation (1)), with the purpose of minimizing the object function Q (Equation (2)), based upon the uncertainties [32,33].
X i j = k = 1 p g i k f k j + e i j
Q = i = 1 n j = 1 m [ x i j k = 1 p g i k f k j u i j ] 2
More details about the input species, uncertainties calculation and parameter settings are mentioned in Section 3.4 and details of the model inputs can also be found in Table S1.

3. Results and Discussions

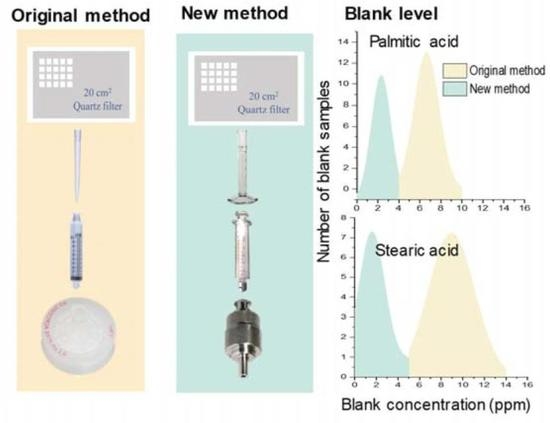
3.1. Characterization of Contamination of C16:0 and C18:0 Fatty Acids in the Original Method

With the original method, contamination was observed in both field blanks and method blanks but not in instrument blanks. Method blanks and field blanks went through all the procedures shown in Figure 1, while instrument blanks preparation started from nitrogen blow-drying onwards, after spiking internal standard d31-palmitic acid. Therefore, suspicion of contamination source was placed on sample preparation from step one to four (Figure 1). Figure 3 shows the concentration frequency distribution histograms for field blanks and comparison with those of the ambient samples. The amount of fatty acid contamination level was calculated using the following equation:
CFA = Cd31 × (PAFA/PAd31),
where PA denotes the peak areas, C denotes the concentrations in ppm or ng/aliquot sample (20 cm2), FA can be C16:0 or C18:0 fatty acids and d31 refers to the internal standard, d31-palmitic acid. Here, we assume that the GC-MS response of palmitic acid and stearic acid is the same as d31-palmitic acid since these fatty acids have similar molecular weights and structures.
The average contamination level is about 6.6 ppm (±18% as relative standard variation) for palmitic acid and 8.9 ppm (±24%) for stearic acid. The insert plots in Figure 3 show that this contamination level interferes the quantification of palmitic acid and stearic acid in samples collected in Hong Kong, which have lower concentrations of fatty acids. More specifically, concentration distribution of palmitic acid in field blanks has ~50% overlap with that of ambient samples, with their mean concentrations 3.5 ppm apart. The situation for stearic acid was even worse. The concentration distribution of the blank samples and ambient samples nearly overlap, and their means are only 0.38 ppm apart. The data could also be construed as 42.5% of stearic acid and 9.2% of palmitic acid data in the HK samples being indistinguishable from the blank. Due to the small difference in the means of the blank and the ambient samples in HK, as well as the variability of the blank, it is simply not possible to provide an accurate quantification of the analytes in the ambient samples by subtracting the background measured from a blank.

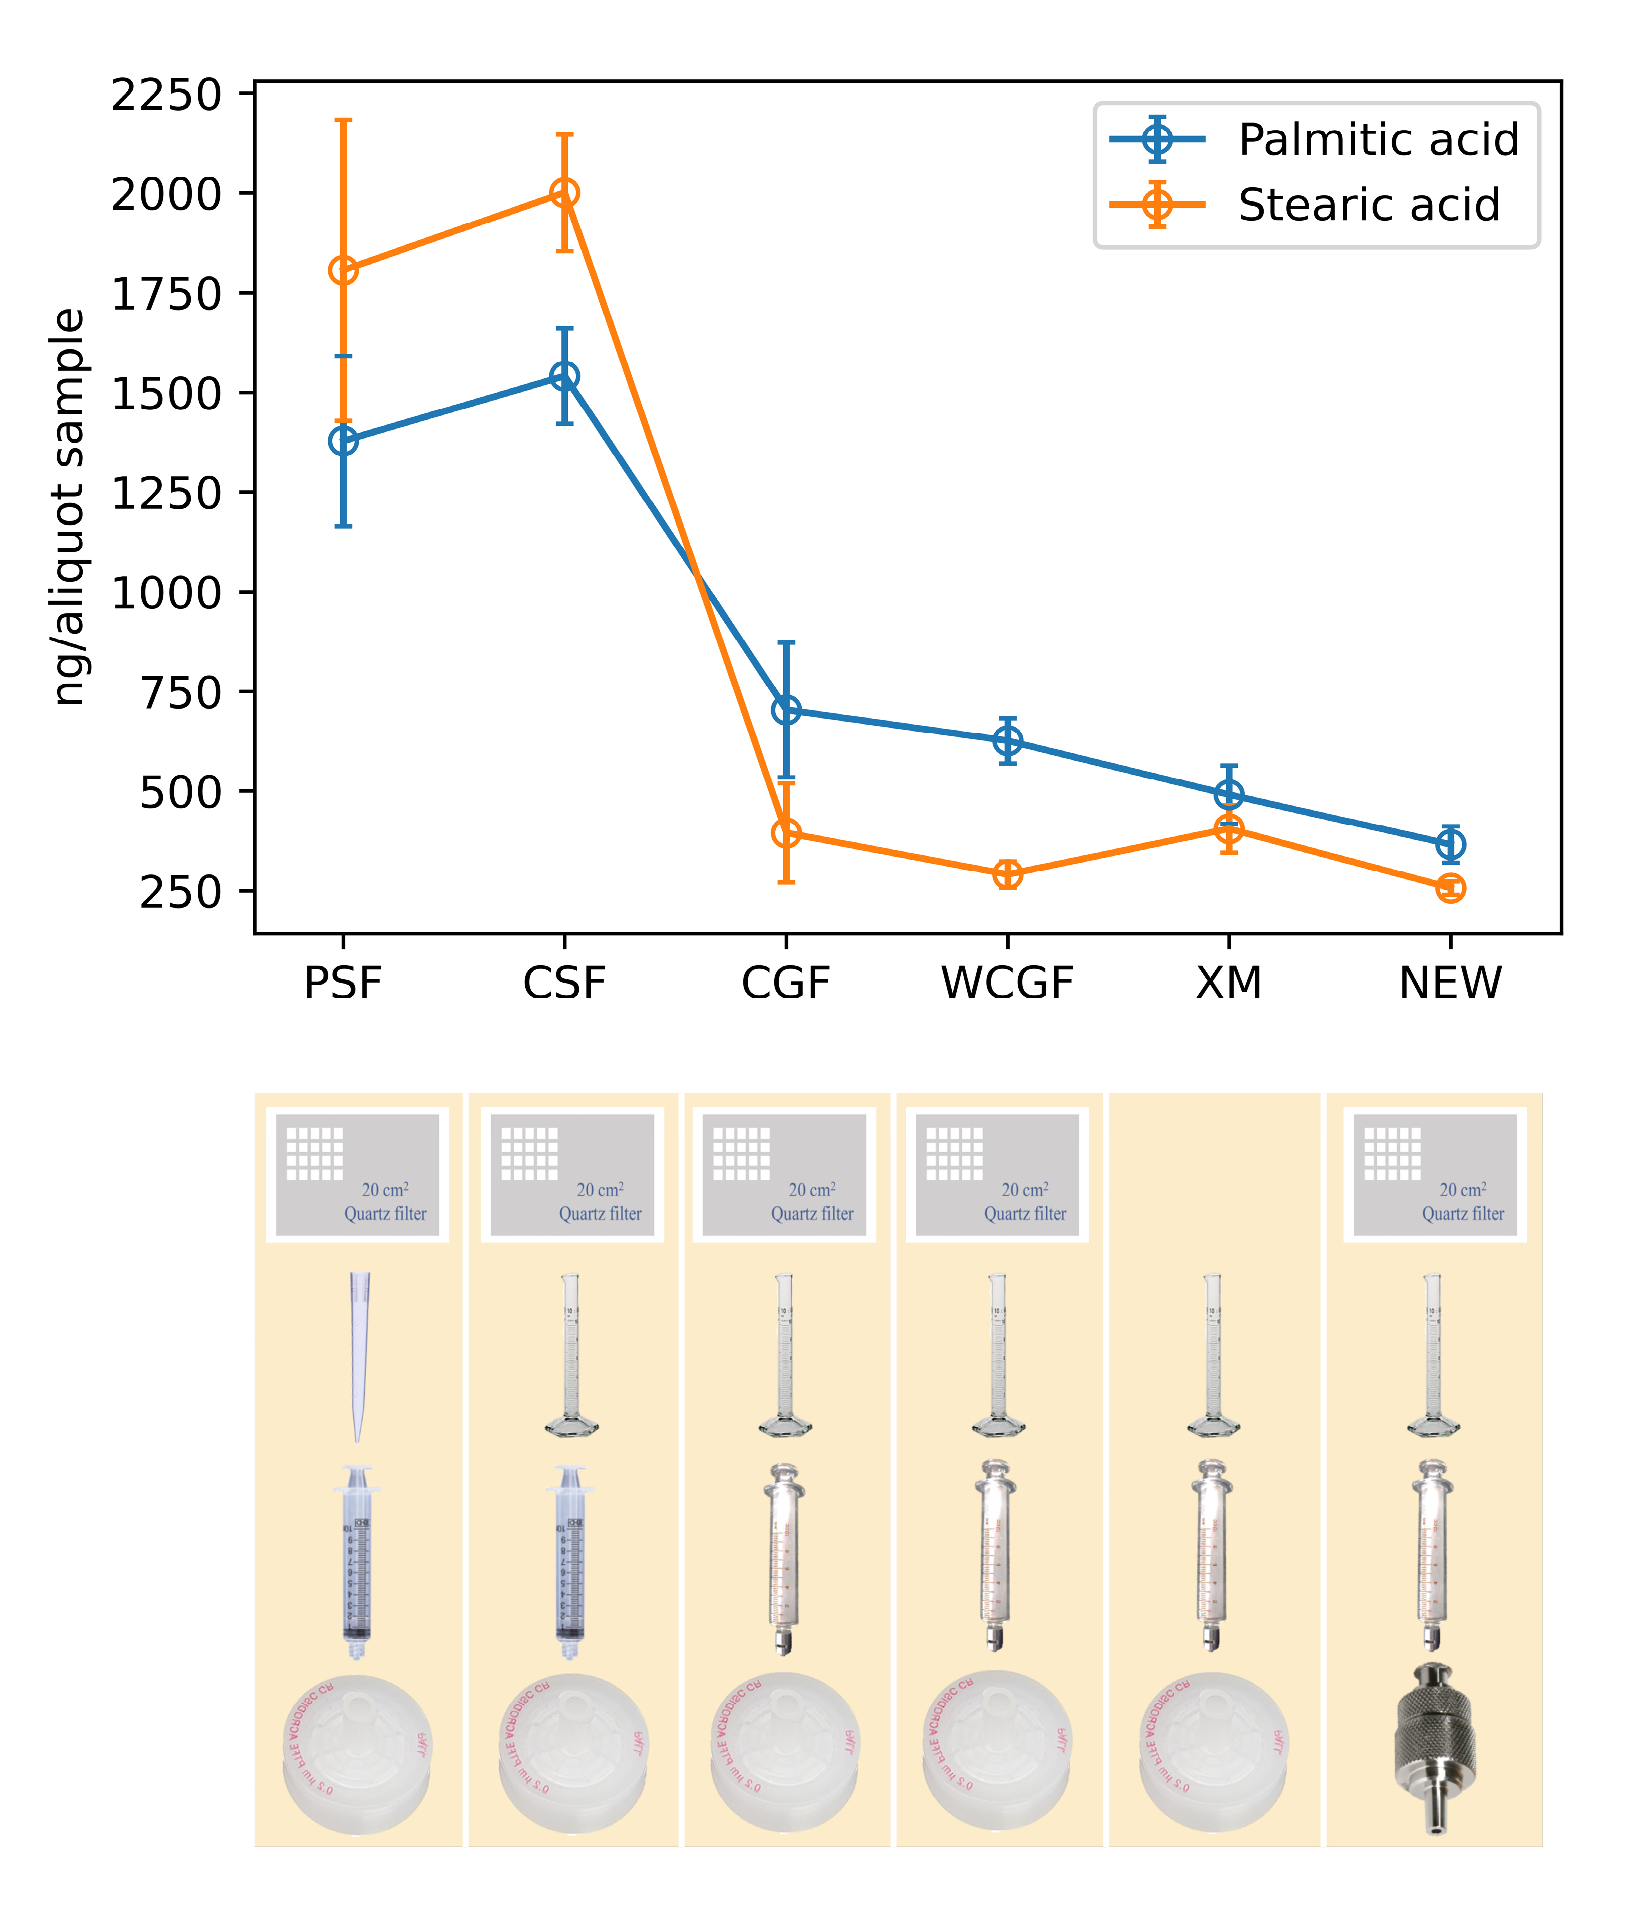
3.2. Identification of Contamination Sources

Enlightened by the literature results, we suspected plastic labware as the contamination source of palmitic acid and stearic acid. The primary suspects were the plastic syringe, the syringe filter disc and pipette tips, which are utilized in the extraction and filtration procedure (Figure 1), as they all have direct contact with the sample solution. All apparatus used were either made from or housed (syringe filter disc) in polypropylene (PP) material. Different combinations of plastic and glass labware were tested for contamination of the fatty acids. The blank quartz filters used in these experiments were pre-baked at 550 °C for 12 h to remove any organic contaminants. Plastic pipette tips were replaced by glass measuring cylinder for transferring the extraction solvent in step three and plastic syringes were replaced by glass ones for filtration in step four when following the method (Figure 1). Figure 4 compares the contamination levels from the different combinations of plastic and glassware.
The comparison results indicate that the significant source of fatty acid contamination was associated with the plastic syringe as its contamination dropped by 2–5 times once it was replaced (i.e., a glass measuring cylinder and a glass syringe and plastic filter cassette combination (CGF) vs. pipette, syringe and filter cassette (all plastic) used in the original method (PSF) in Figure 4). The reduction was more obvious for stearic acid as the contamination has decreased by over 1600 (±12%) ng/aliquot sample (20 cm2). For palmitic acid, the contamination has decreased by over 800 (±25%) ng/aliquot sample (i.e., from a glass measuring cylinder, plastic syringe, and plastic filter cassette combination (CSF) to CGF). It indicates that the plastic syringe fortified more stearic acid than palmitic acid.
Washing the filtration set with methanol 3 × 2 mL helped slightly in reducing the remaining contamination level after removing the influence of plastic syringe (i.e., wash the CGF filtration set with 2 mL methanol three times (WCGF) vs. CGF in Figure 4). Palmitic acid contamination level had decreased by 77 (±178) ng/aliquot sample and stearic acid by 104 (±129) ng/aliquot sample when washing was introduced. Examining results from CGF, WCGF and CGF combination but without aerosol filter matrix (XM), one could conclude that the effect of pre-washing and contamination from the quartz fiber filter material were insignificant in comparison with the amount contributed to the contamination from plastic syringes (i.e., PSF and CSF). When the plastic filtration unit was replaced with the stainless steel one, further reduction in the contamination of palmitic acid by 42% and of stearic acid by 12% was recorded (i.e., revised method in which a glass measuring cylinder, a glass syringe and a stainless-steel syringe holder were used (NEW) vs. WCGF in Figure 4).
The contamination due to plastics was believed to originate from the fatty acids embedded in the plastic materials in combination with the high ratio of DCM used. In plastic products, polymers are rarely used in pure form since they often require modification to achieve optimal properties. Instead, polymers are frequently mixed with additives. In a publication on plastic additives (Bolgar et al., 2015), palmitic acid and stearic acid were reported to act as lubricants and plasticizers to facilitate the polymerization and manufacturing processes. These additives might be tagged in different brand names and present in various amounts per product. Due to the proprietary nature of manufacturing processes and diversity of choice, it is hard to trace which plastics contain these fatty acids as well as by how much [23]. For plastics containing fatty acids, the amount of fatty acid released depends on solvent used and contact time. DCM is a strong solvent for organics. As an example, DCM will cause degradation in nitrile gloves and only few types of gloves are considered safe to work with DCM.
In short, the major contamination source of palmitic acid and stearic acid was the plastic syringe, conceivably followed by syringe filter disc that was housed in PP material. The high proportion of DCM used in extraction solvent system also aided the release of fatty acids from plastics into the samples and pre-washing seemed to reduce the rest of the contamination only by a very small amount. The results reveal the contamination contributed from the apparatus used in our method and could be applied to laboratories that also perform fatty acid analysis using similar procedures, extraction solvents and plastic products. Contamination impact could be different with respect to different analytical procedures. Our results demonstrate the need for substitutions for plastics to reduce background contamination of fatty acids. Otherwise, quantification of palmitic acid and stearic acid will be subject to substantial uncertainty and quantitative information for samples containing lower concentrations of fatty acids will be lost.

3.3. Evaluation of Revised Method

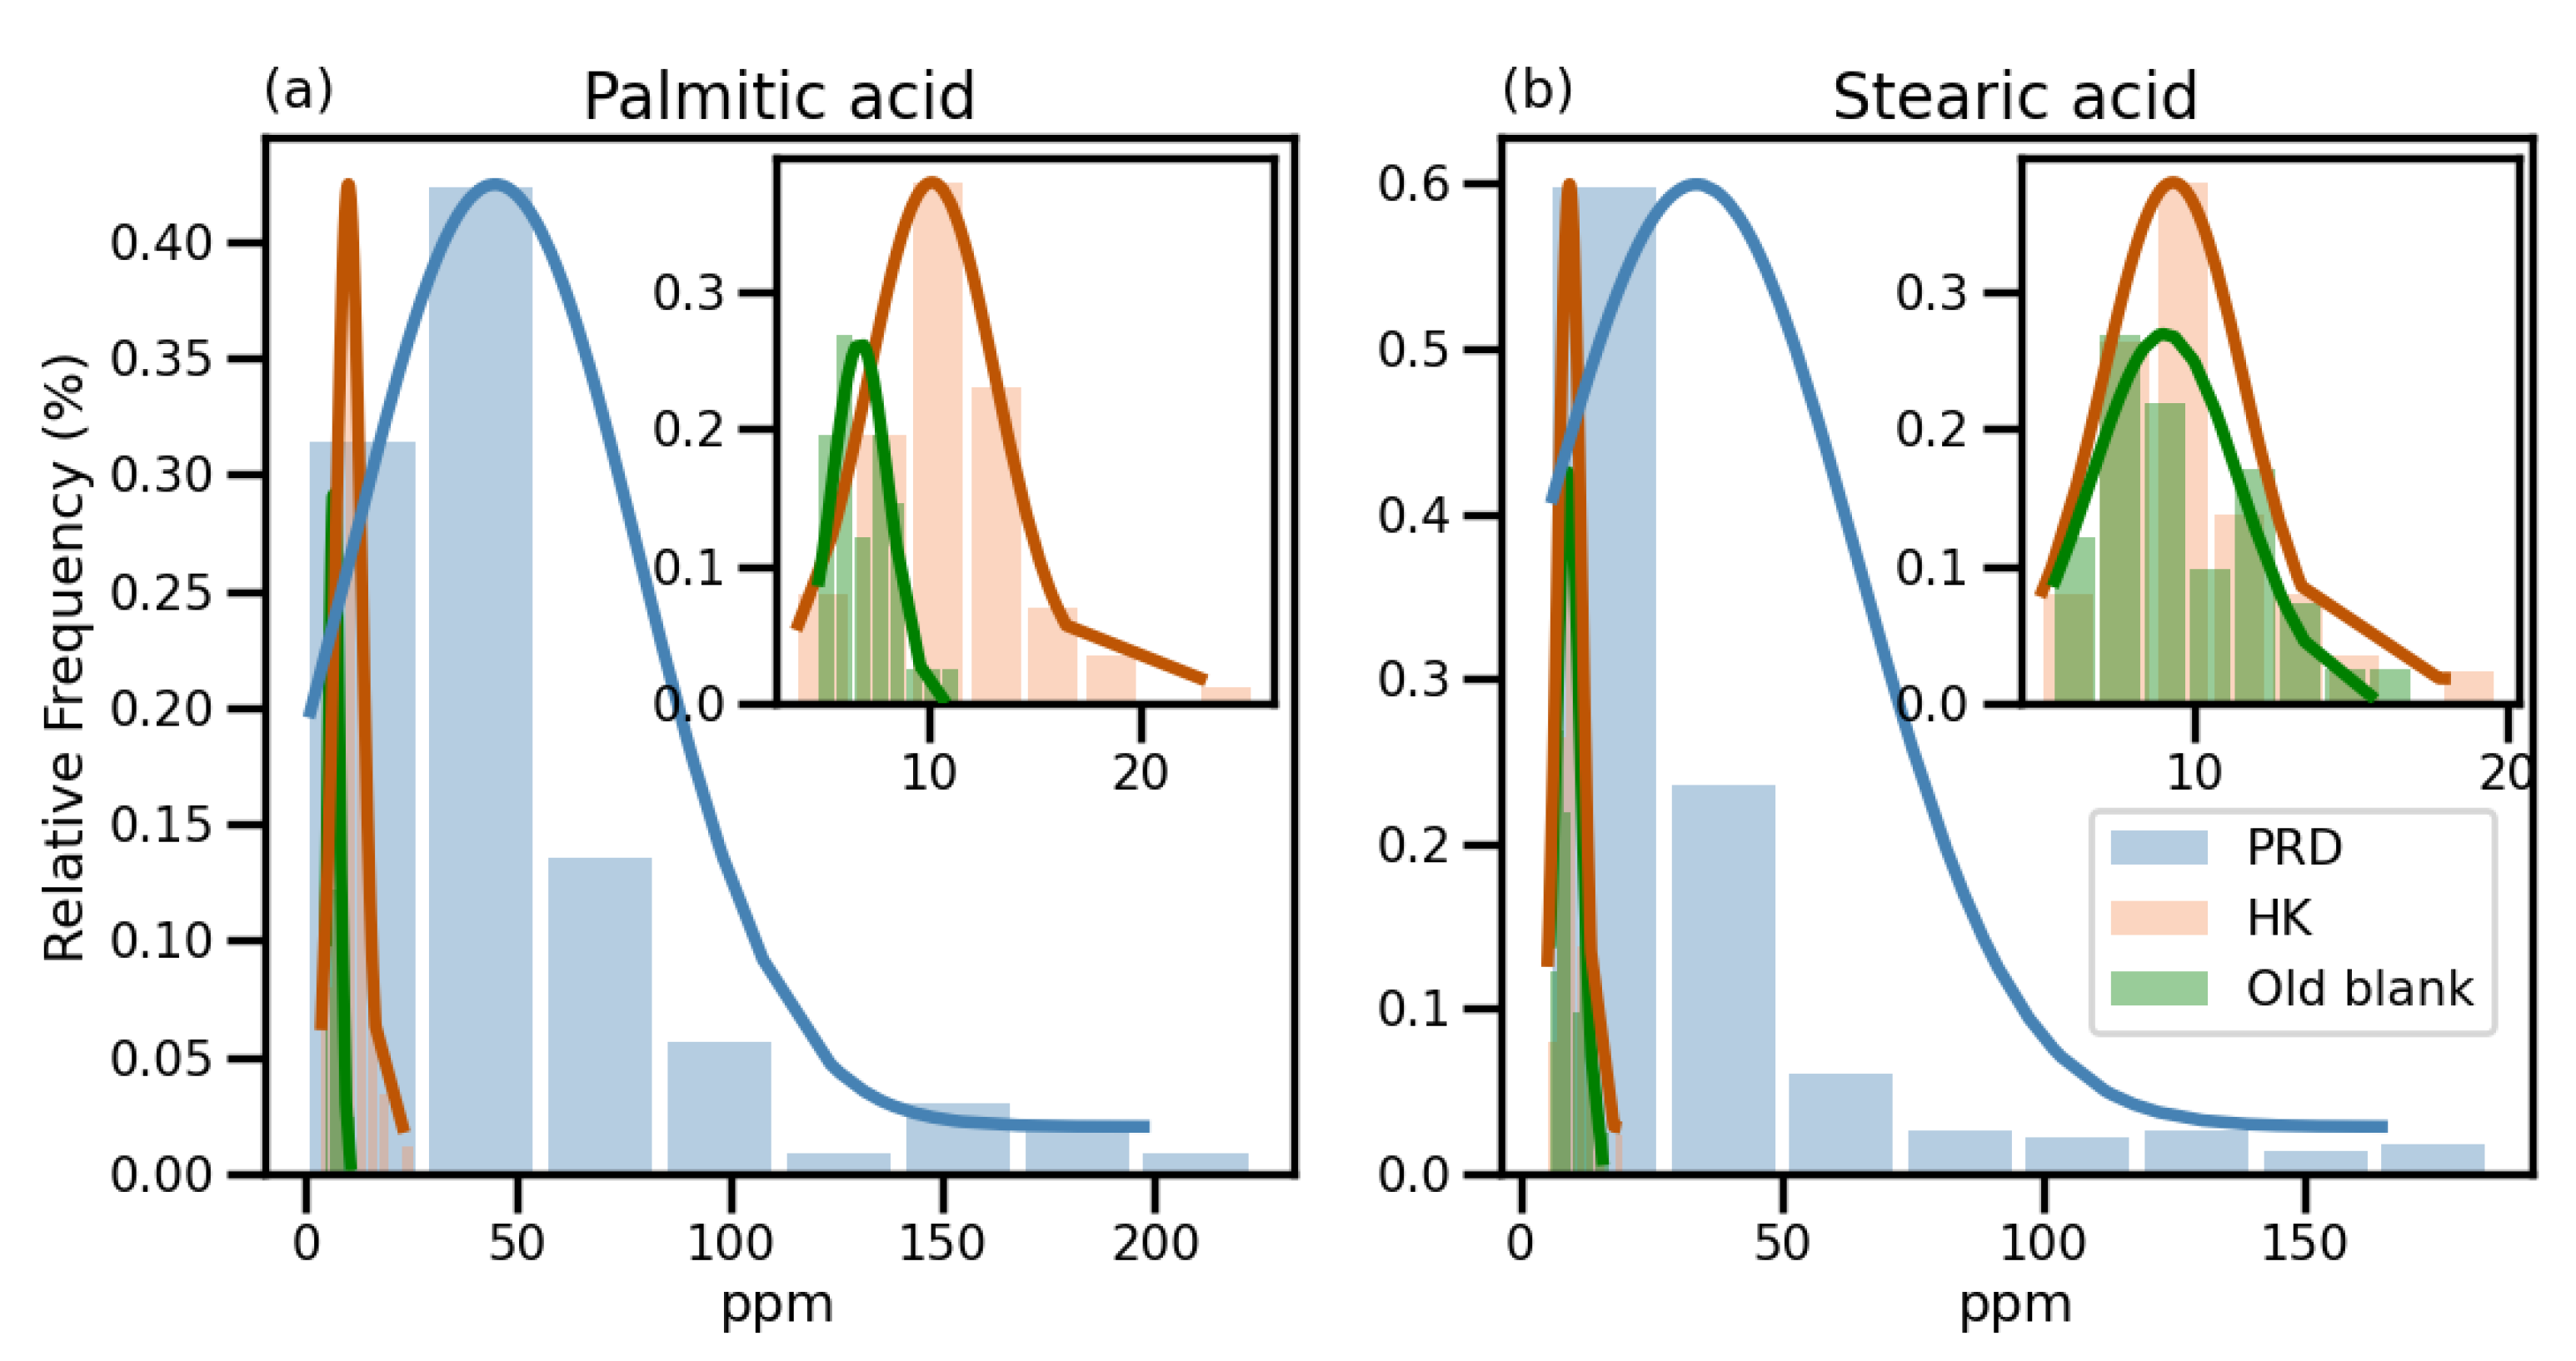
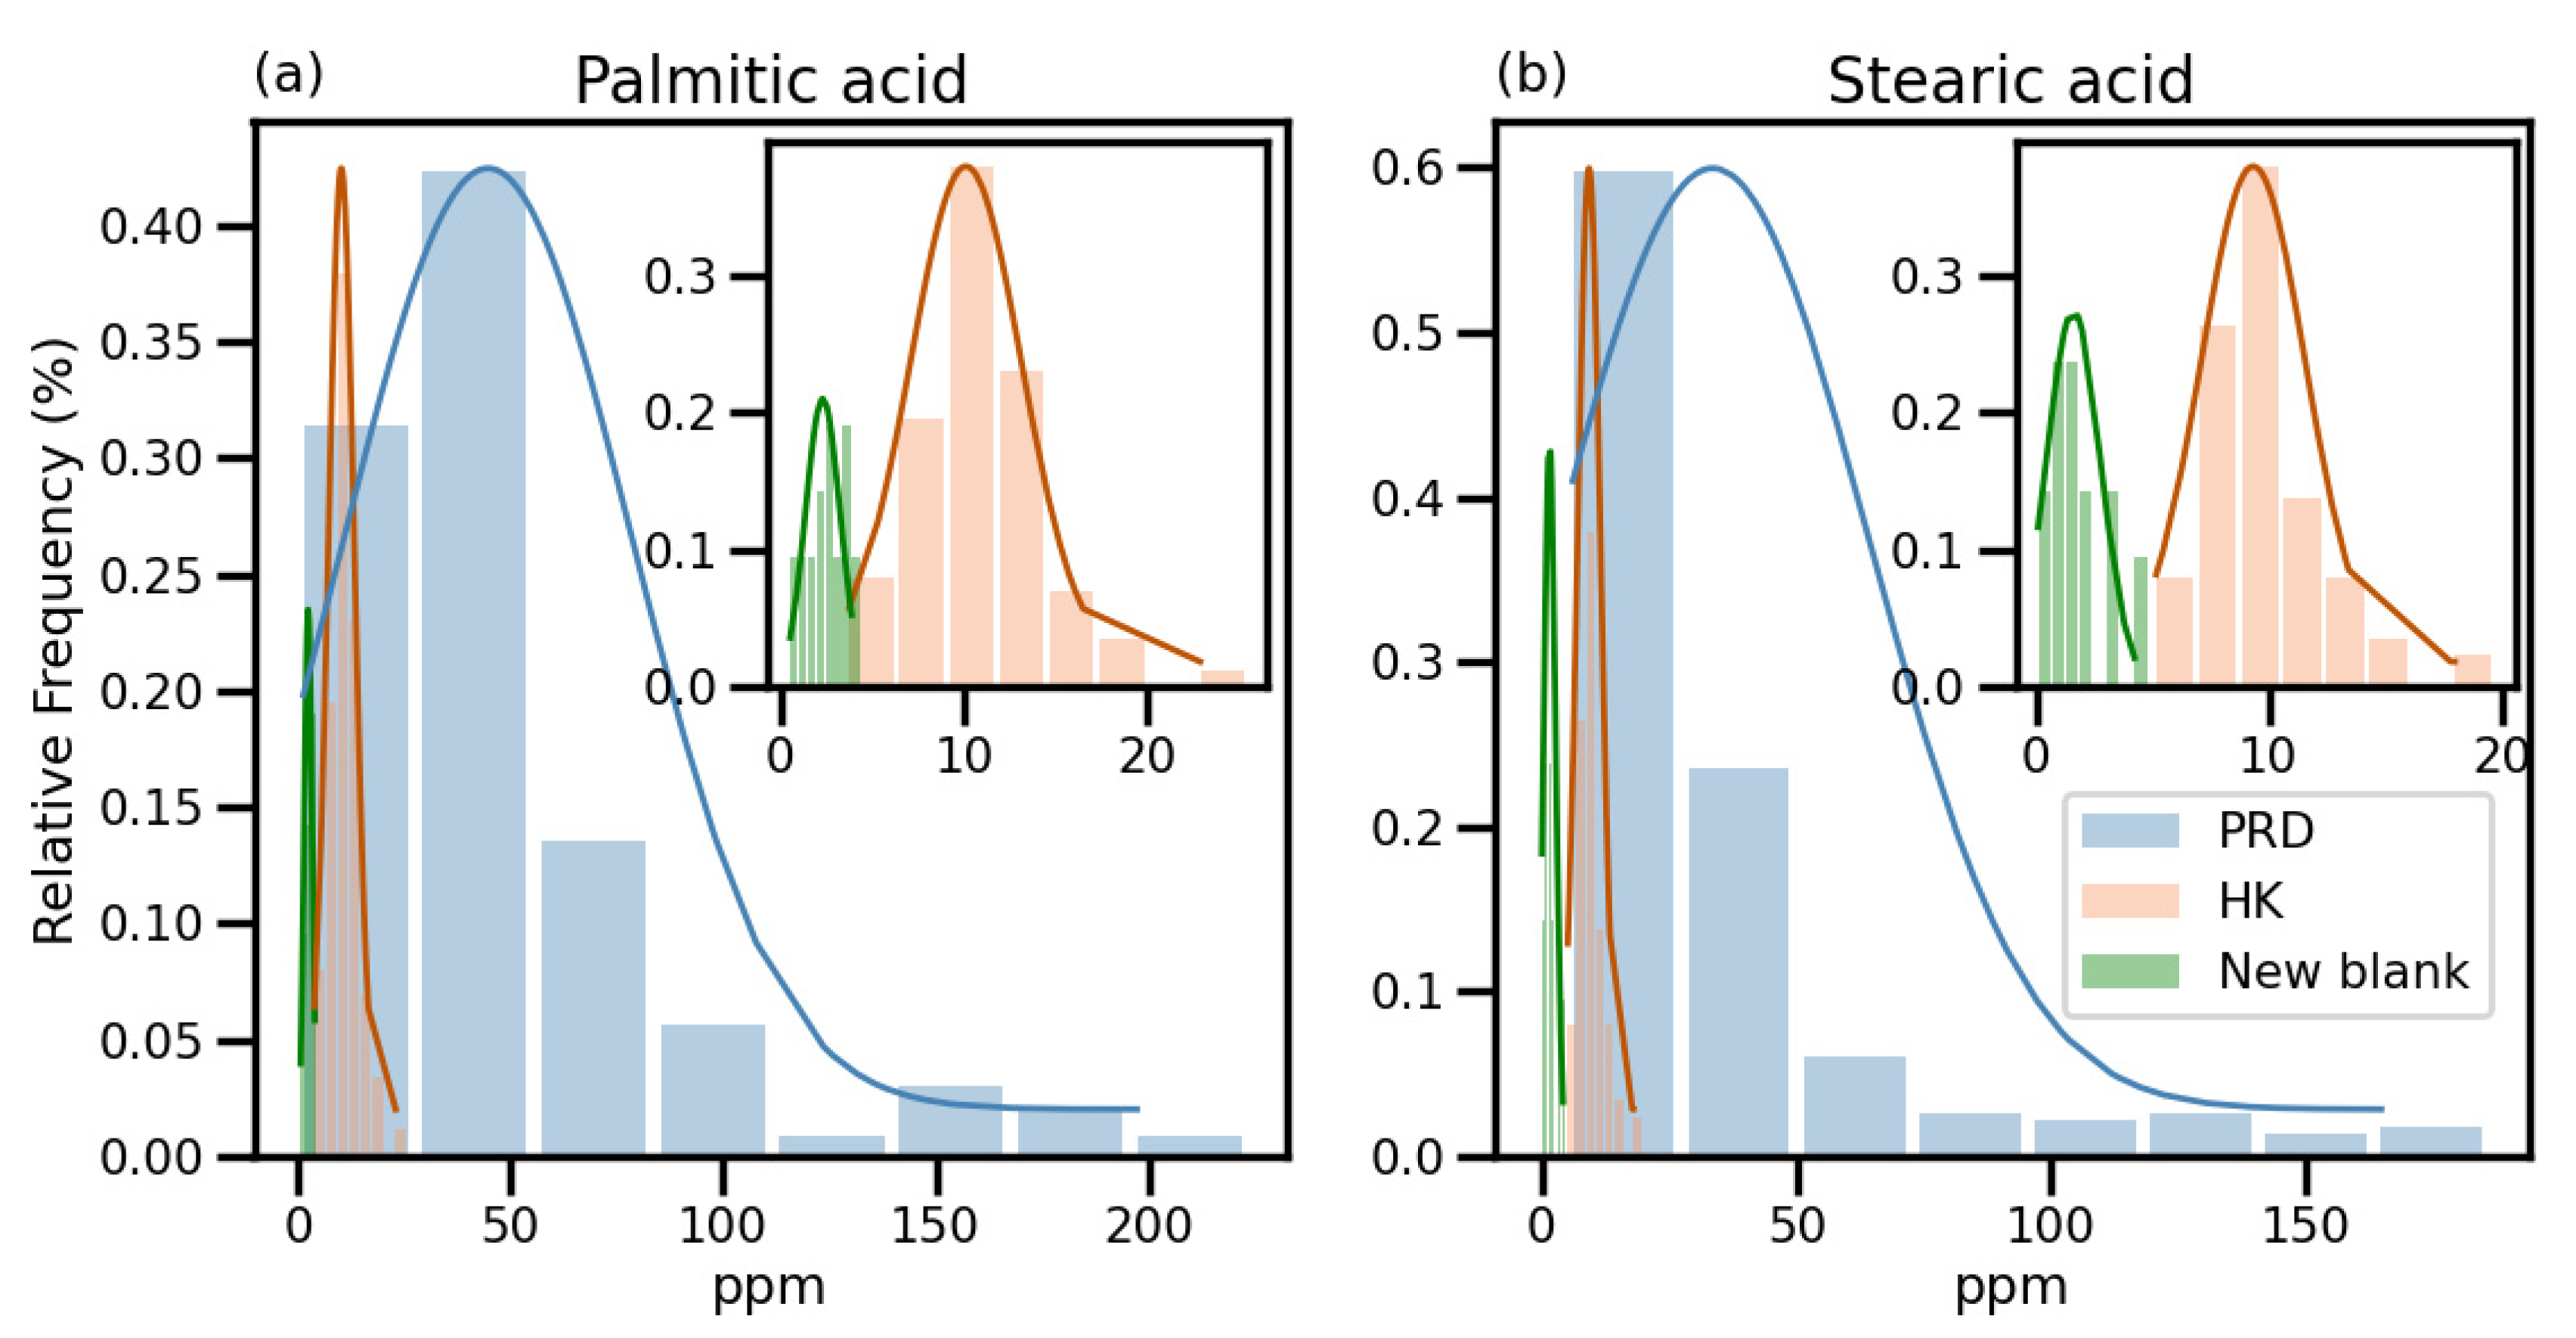
3.3.1. Contamination Levels

In the revised method, plastic labware was replaced with glassware as much as feasible (Figure 2). The contamination in the revised method was greatly reduced to 366 (±12%) ng/aliquot sample for palmitic acid (3.8 times lower than the original method) and 257 (±7%) ng/aliquot sample for stearic acid (seven times lower than the original method) (Figure 4). In terms of contamination expressed in concentration in solution, the blank contamination of fatty acids following the revised sample pretreatment has decreased by 2.9 times from 6.6 ppm (±1.2) to 2.3 ppm (±0.9) for palmitic acid and by 5.6 times from 8.9 ppm (±2.1) to 1.6 ppm (±1.2), ±in SD (ppm).
Figure 5 compares the concentration distribution of the method blanks by the revised sample method with the concentration distribution of samples from the PRD and HK. The mean difference between the new method blank and HK was 7.8 ppm as compared to the original 3.5 ppm for palmitic acid and 7.7 vs. 0.38 ppm for stearic acid. The contamination reduction has revealed the significant influence of plastics in interfering in the quantification, in particular stearic acid. The revised method will therefore allow information on lower palmitic acid and stearic acid concentrations to be retrieved.
Contamination in the revised method has not been entirely removed. The reason for that should be further investigated though it has achieved the lowest contamination level among the experiments mentioned in this study. Other than plastics, contamination sources of fatty acids might also be in our atmospheric environment, gloves, solvents or other apparatus that we were unaware of or did not assess.

3.3.2. Limit of Detection (LOD) and Recoveries

Table 1 compares the limit of detection (LOD) by the original and new methods, calculated to be 3 s/m, where “s” is the random error in the y-direction of the calibration data and “m” is the slope of the regression line (Miller and Miller, 2010). Effects of contamination reduction from the new method have led to a significantly reduced LOD in comparison with the original method. The LOD for palmitic acid was improved from 1.76 to 0.76 ppm and that for stearic acid from 3.17 to 1.39 ppm. However, we note that there was a general increase in LOD in other compound classes, especially for the more polar organic species that possess several active hydrogen atoms. The higher LOD might also be due to sample loss possibly from the glass syringe since the glass syringe was not gas tight, and therefore the volume of final filtrate could reduce.
Most of the compounds’ recoveries were within 80–120% (Table 1), however, citric acid, malic acid and tartaric acid recoveries were lower than 80%. The method recovery might be affected by the extraction efficiency, filtration hold-up volume as well as sample loss due to blow-drying, although some processes could be normalized by internal standard. Due to the polarity of concerned compounds, extraction efficiency might be the one of the reasons for the lower recovery.

3.3.3. Paired t-Tests

A set of 16 HK samples were randomly selected and analyzed using both the original and revised methods. With the original method, palmitic acid in three samples and stearic acid in six samples were indistinguishable from the blank level. In contrast, with the revised methods, these two fatty acids were detected above the blank level in all the 16 samples, clearly demonstrating the advantage of the revised method. Paired student t-tests were conducted on those sample pairs above the blank level to assess the comparability of the two methods for the two fatty acids. The results indicate that concentrations reported by the two methods were not statistically different.

3.4. Source Analysis Using PMF Model

As a demonstration of the utility of C16:0 and C18:0 fatty acids in facilitating identification and quantification of the cooking source, we next carry out PMF modeling using chemical composition information for 55 samples collected at two urban locations in HK.

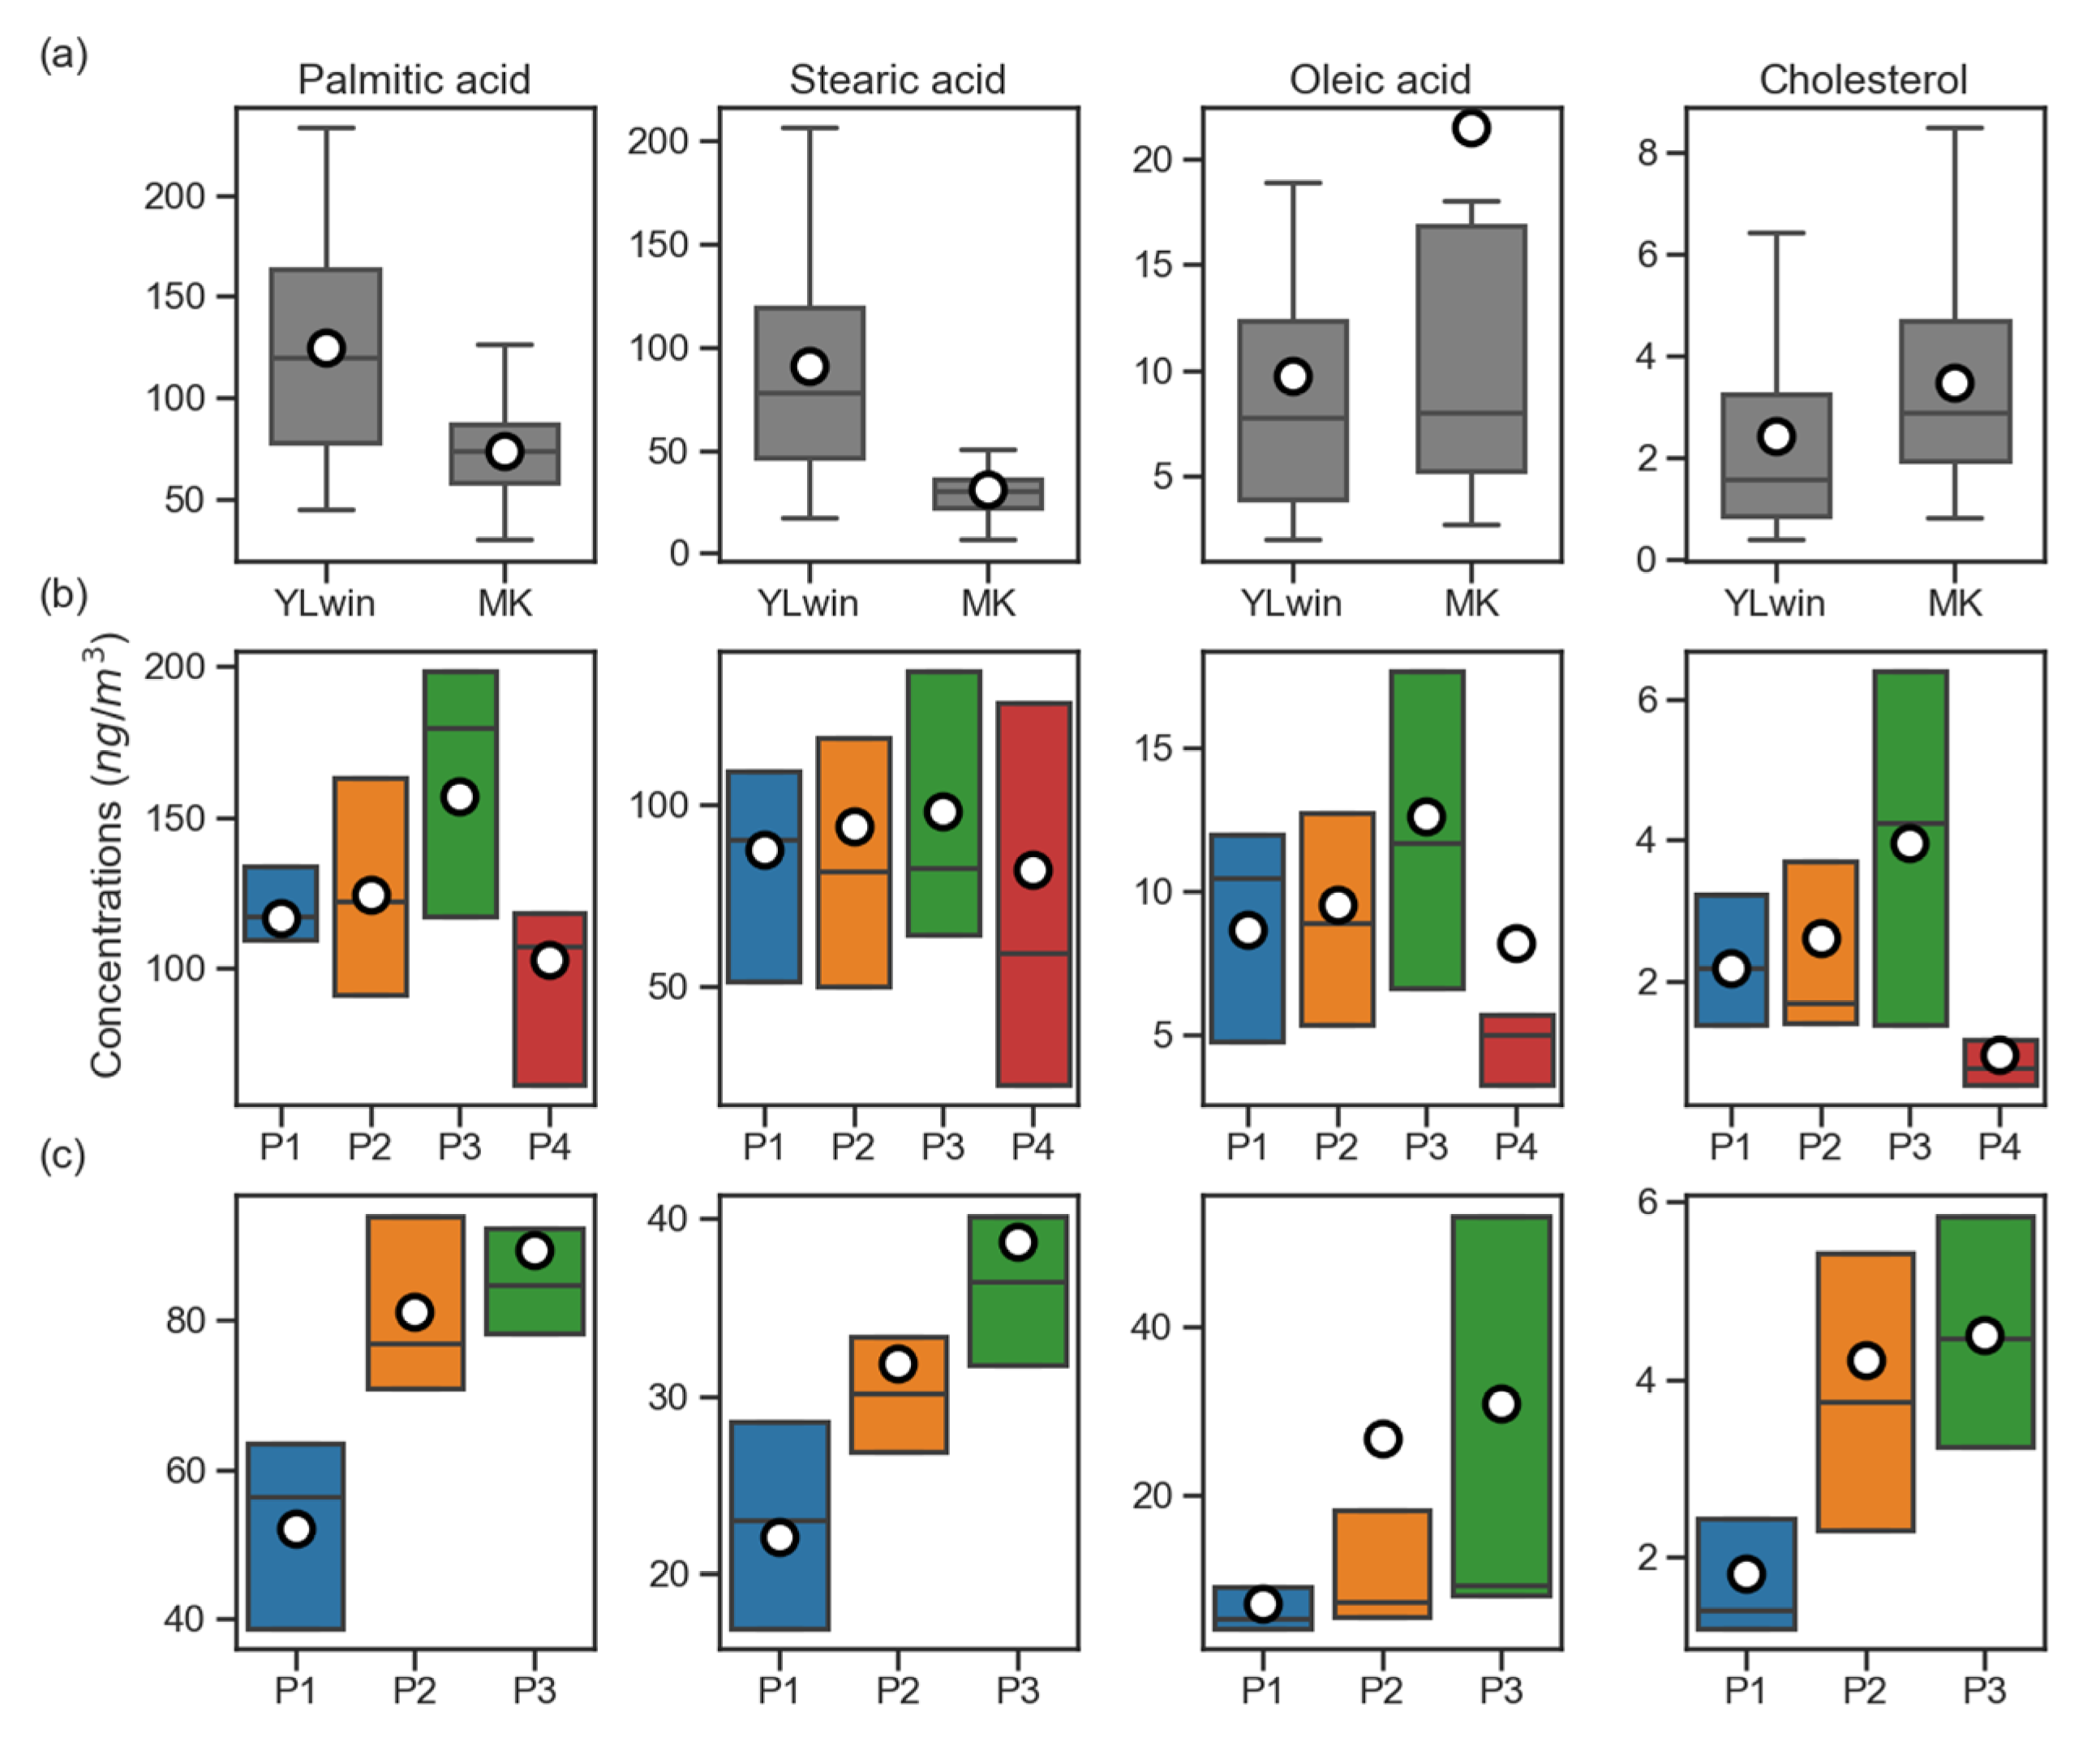
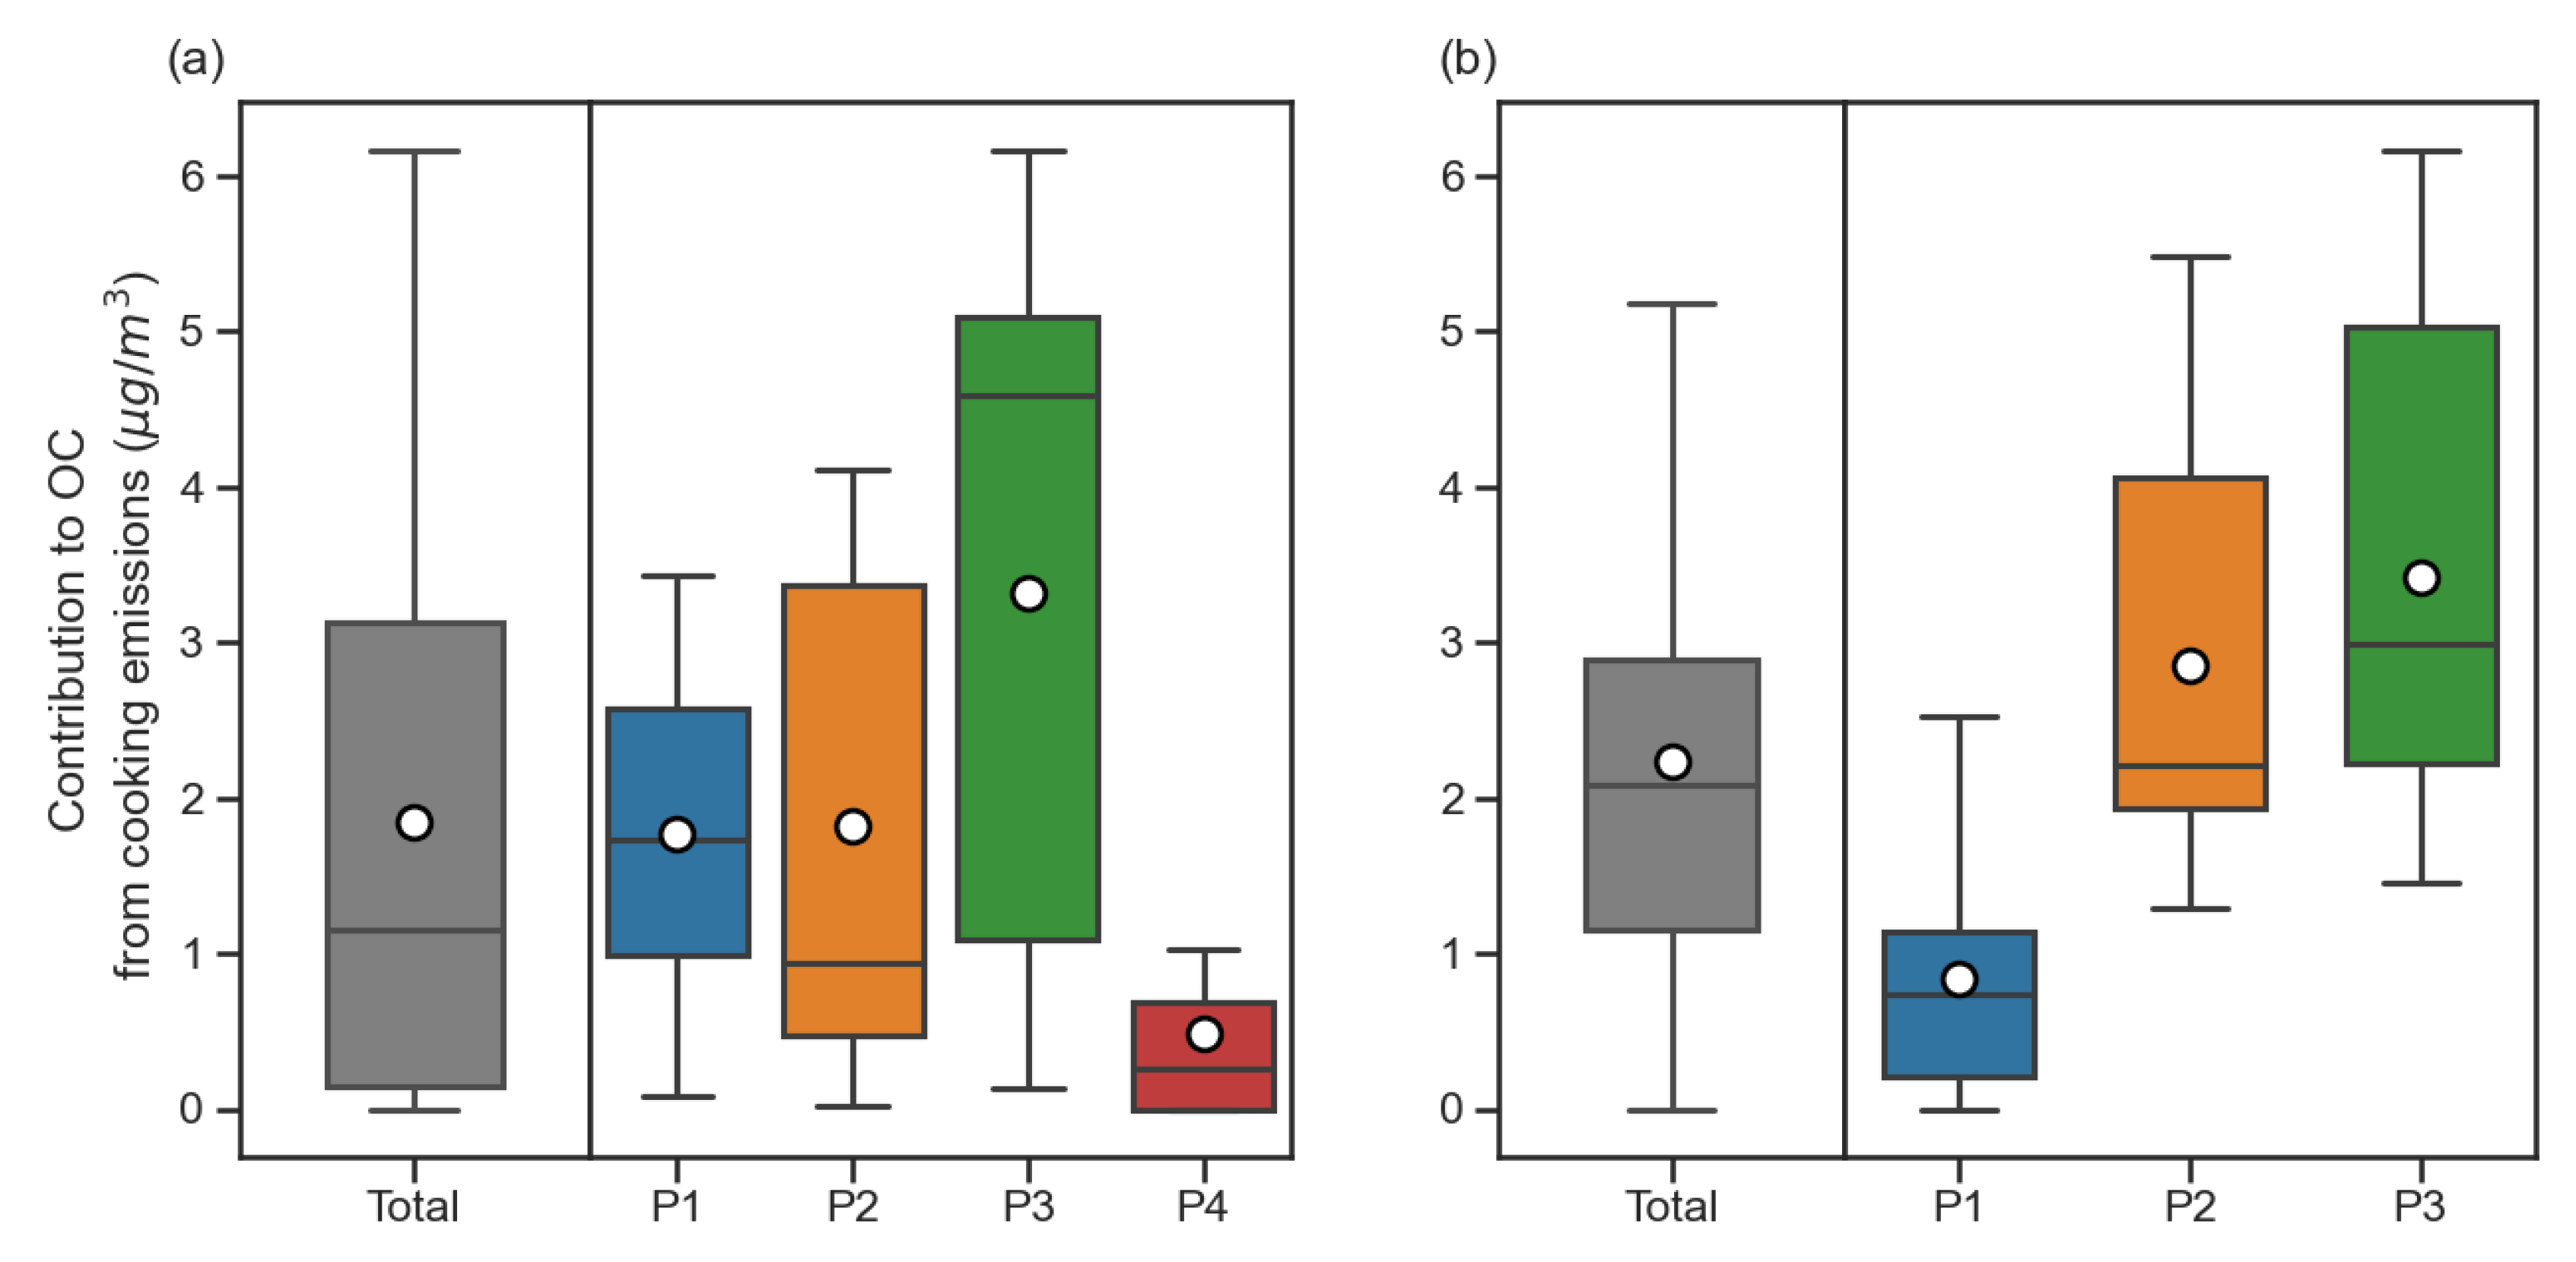
3.4.1. Abundances and Diurnal Variations of Cooking Related Tracers

Cooking is a known urban organic aerosol source. In addition to C16:0 and C18:0 fatty acids, oleic acid and cholesterol are also known to be emitted from cooking activities. Figure 6a shows the abundances of these organic compounds. The abundances of oleic acid (21 ± 33 ng/m3) and cholesterol (3.5 ± 2.2 ng/m3) at MK exceeded those at YL, with oleic acid at 9.7 ± 7.4 ng/m3 and cholesterol at 2.4 ± 2.0 ng/m3. Such a spatial difference was consistent with the facts of more dense population and commercial establishments at MK. Surprisingly, C16:0 and C18:0 fatty acids showed opposite spatial contrast in their ambient abundance, with C16:0 fatty acid at 125 ± 53 (YL) vs. (74 ± 30 ng/m3) (MK) and C18:0 fatty acid at 90 ± 60 (YL) vs. 31 ± 15 ng/m3 (MK). This seemingly unexpected observation could be explained when we consider C16:0 and C18:0 fatty acids have other airborne sources, such as coal combustion, biomass burning, etc. [34,35]. Coal combustion pollutants could be brought into HK under the prevailing northernly winds in winter, thus impacting the YL samples, which were collected in December. Figure 6b,c plot the diurnal variations of the same set of compounds, showing a consistent increase in concentration starting from P1 in the morning and peaking in the evening during P3. The peaking during P3 (16:00–21:00) could be explained by its coincidence with dinner hours shared by both sites.
The ratios of C18:1/C18:0 and C16:0/C18:0 provide diagnostic information for determining the degree of aerosol aging or possible sources. Figure 7 is a ratio–ratio plot of C18:1/C18:0 vs. C16:0/C18:0 including both the ambient sample data and source data for cooking and a range of non-cooking sources (i.e., vehicular emissions, burning of different biomass, and coal combustion). The two types of source data occupy distinct space in the plot, with the cooking source data clustering in the upper part and the non-cooking source data centering lower. Softwood and hardwood burning, falling in the cooking data cluster, were noted to be exceptional. Fortunately, these two types of biomass burning are rare in our subtropical study location, therefore they could be ignored in our consideration. Part of MK ambient samples fall in the same space occupied by the cooking source data, strongly suggesting cooking as the dominant source for these fatty acids at MK. The remaining MK data had lower C18:1/C18:0 while similar C16:0/C18:0 ratios compared with the cooking source data, consistent with the known faster degradation of C18:1 than C16:0 fatty acid due to the enhanced reactivity from the unsaturated carbon–carbon bond. The ambient C18:1/C18:0 could be two orders of magnitude lower than the cooking source ratio, indicating the high reactivity of C18:1 fatty acid.
The YL ambient data had significant lower C18:1/C18:0 ratios, as a combined result of lower C18:1 while higher C18:0 fatty acid than those at MK. The YL ambient data were notably lower than the cooking source ratios. There could be two reasons. First, Hong Kong in winter was often under the influence of long-range transported air masses from Northern inland China, bringing in pollutants from sources more prevalent in the North, such as coal combustion, which had a lower ratio of C18:1/C18:0 (0.06–0.6, [34]). As such, the ambient air at YL in winter was more enriched in the C18:0 fatty acid. This proposition was also supported by the moderate correlations of the C16:0 and C18:0 fatty acids with the two lumped PAH concentrations (Rp: 0.48–0.73) (Supplementary Materials, Figure S2b). Second, the YL site had less fresh cooking emissions in comparison with MK as YL has lower population density and the restaurants’ occupancy rate in YL is generally lower than that in MK.
In summary, the qualitative and semi-quantitative characteristics reveal that the ambient abundance variations of the four cooking tracers were broadly consistent with the local knowledge of cooking activities, providing the basis for their use in receptor modeling for identifying the cooking source.

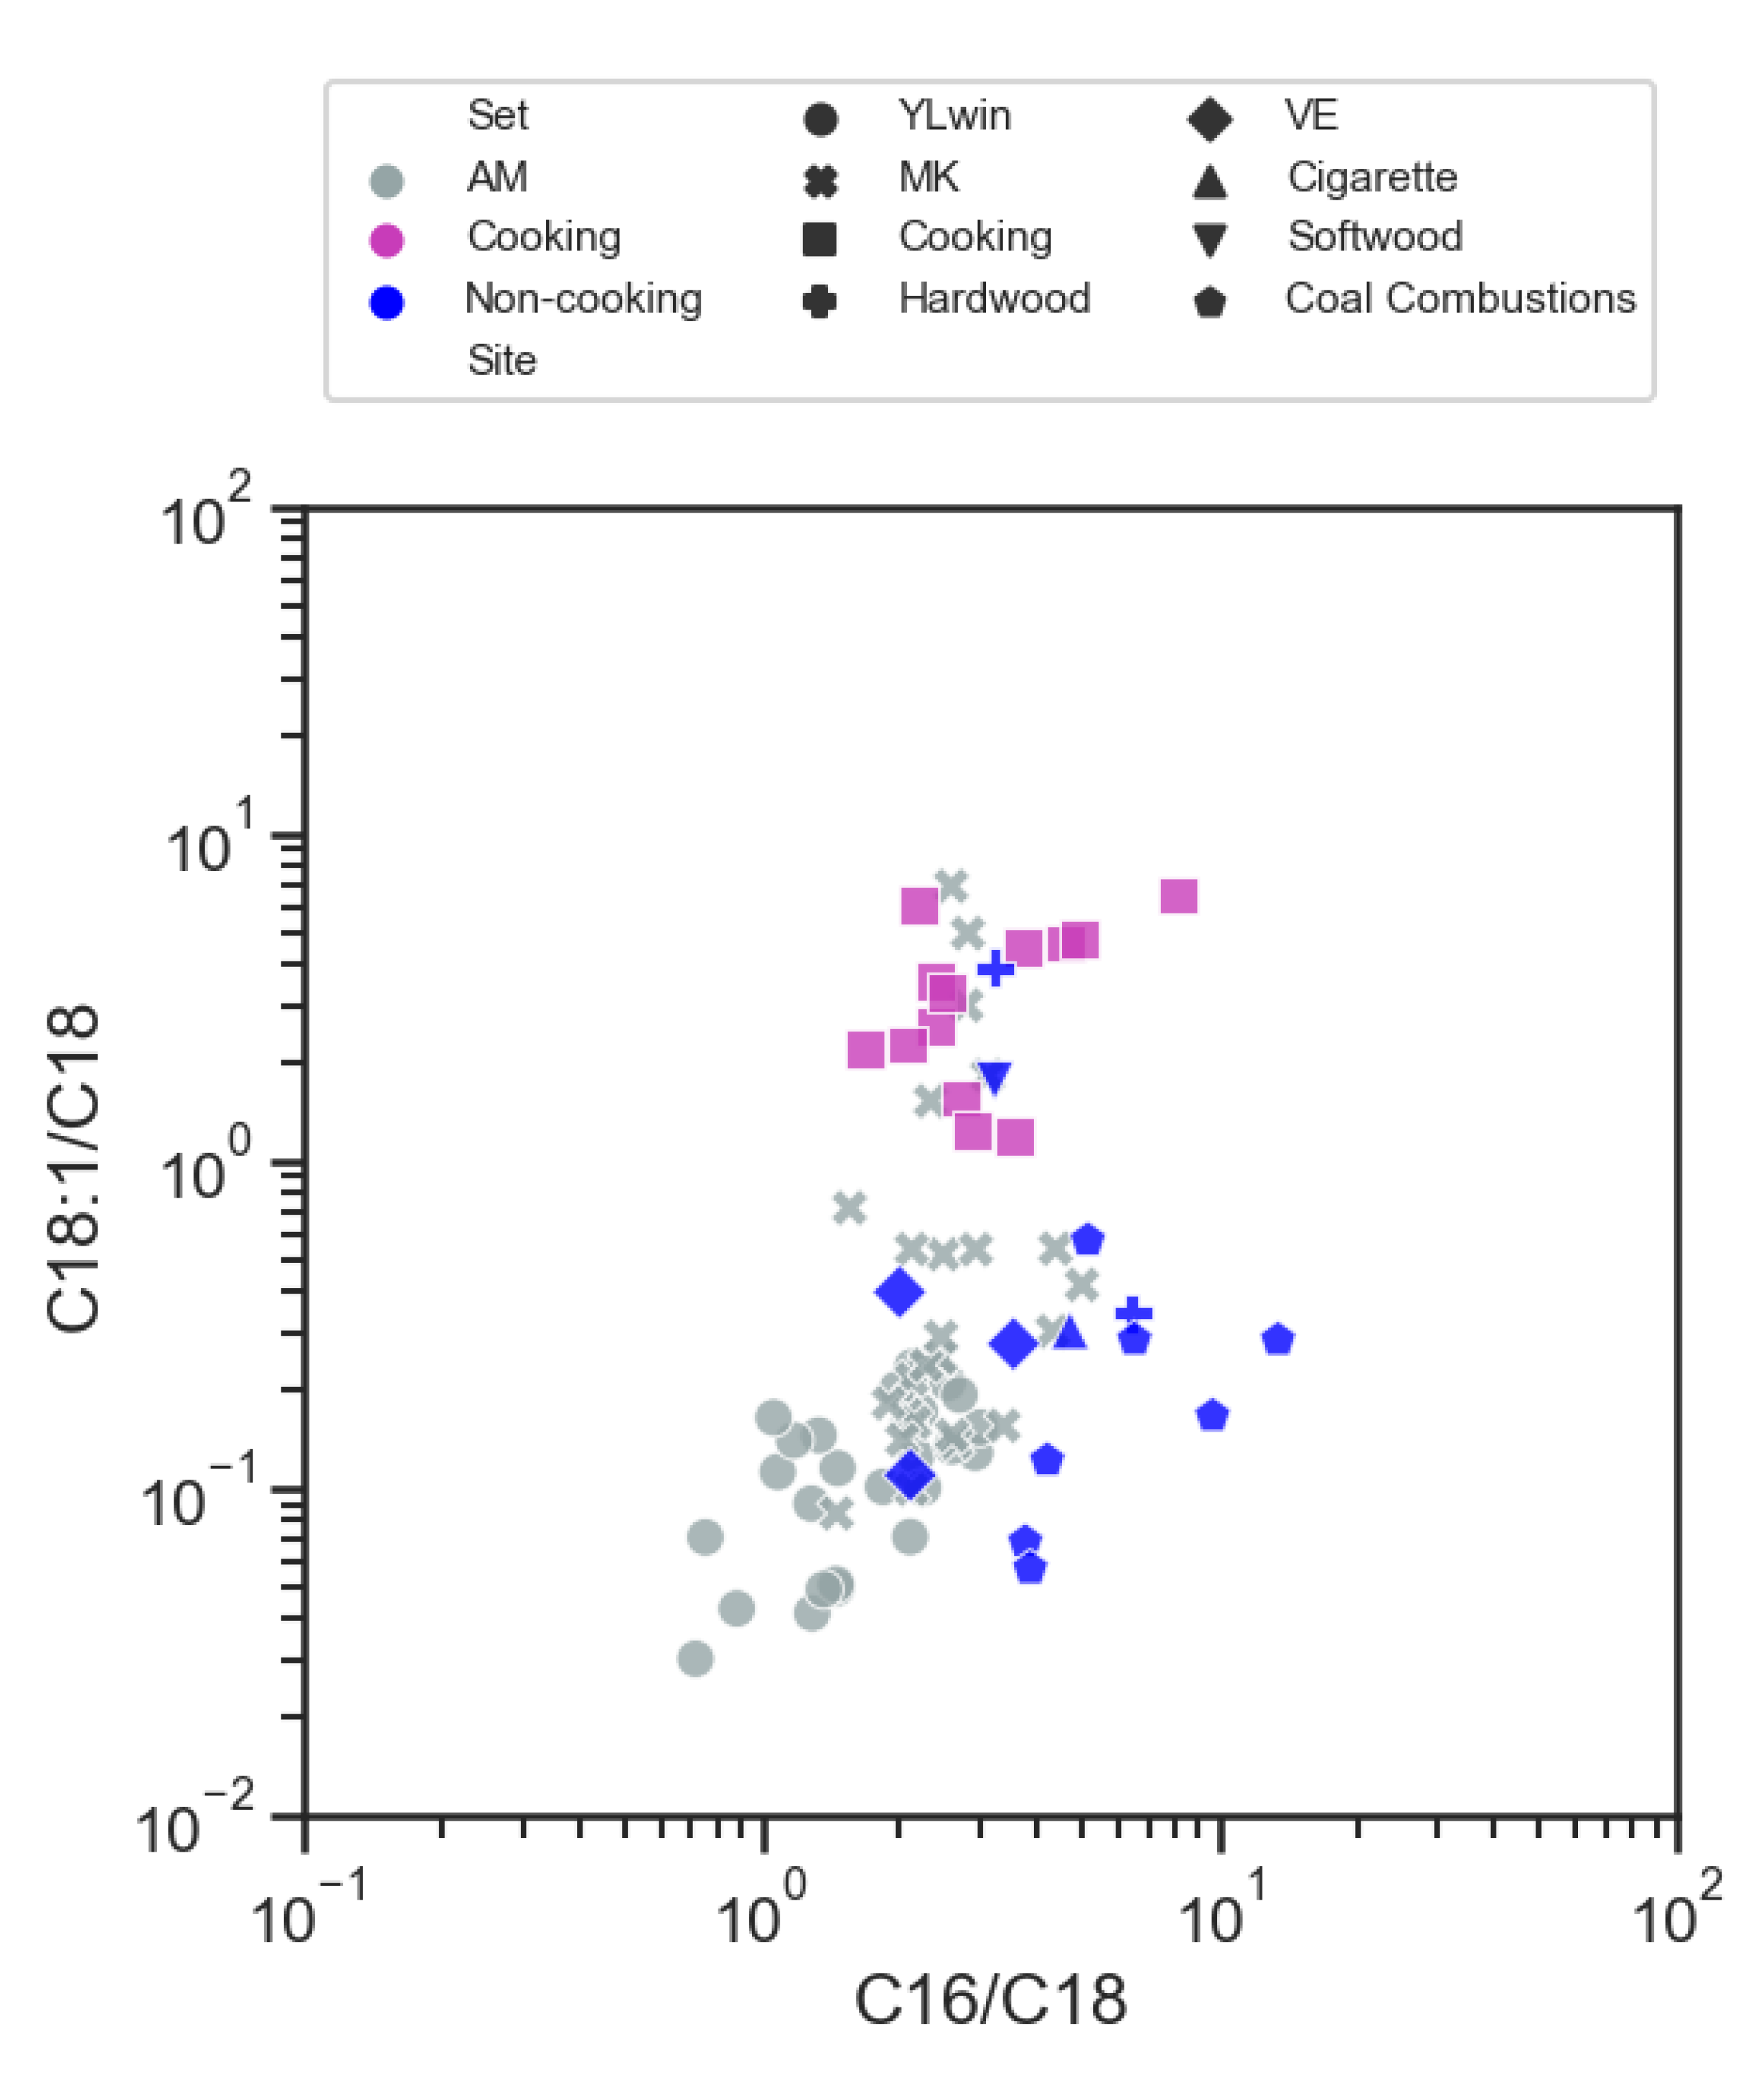
3.4.2. Selection of PMF Input Species

The input data for PMF analysis include organic carbon (OC), elemental carbon (EC), six water-soluble ions (i.e., sulfate (SO42−), nitrate (NO3), chloride (Cl), ammonium (NH4+), potassium ion (K+), and sodium ion (Na+)), and 15 individual organic compounds or lumped organic species. The full list of the input species is presented in Table S1. The 15 organic inputs were created from a total of 26 individual organic tracers (see Table S1) on the basis of their source or the indicative features of their formation processes. Within the 26 organic compounds, those with good correlations (R > 0.8) and indication of common sources were lumped into one input species to avoid collinearity [36,37]. Since there were no available elemental measurements at the MK site, they were excluded from PMF analysis. The chemical analysis of the input species was described in [31].
With respect to the selection of cooking related tracers in the model, stability and uniqueness to cooking emissions are of major importance. The more unique the tracer to a particular source, the more powerful it is to resolve a source factor. Among the potential cooking emission tracers, cholesterol and oleic acid are highly specific to cooking sources. Cholesterol, although present at a level more than one order of magnitude lower than those of C16:0 and C18:0 fatty acids, its data capture rate was 100%. Oleic acid was reliably quantified. However, this compound is unstable in the atmosphere and the extent degradation varies from sample to sample, as indicated in the ambient C18:1/C18:0 ratio spanning three orders of magnitude (Figure 7). Thus, oleic acid was excluded in the PMF analysis [38]. Palmitic acid and stearic acid are emitted abundantly in cooking and are relatively stable in the atmosphere. Although there are other emission sources such as coal combustion, biomass burning and vehicle related sources for these two compounds [35,39], cooking activities in urban area are ubiquitous and expected to be a significant contributing source. Taking all things into consideration, cholesterol, palmitic acid and stearic acid were selected as input species to the PMF model. To assess the ability of cholesterol and fatty acids in resolving the cooking source, PMF including both cholesterol and fatty acids (denoted as PMFCholC16C18) and PMF with either inputting cholesterol (denoted as PMFChol) or fatty acids alone (denoted as PMFC16C18) will be compared. PMF constrained runs without all the three cooking-related tracers (denoted as PMFwo) will also be compared with constrained PMFCholC16C18 to evaluate which factors might be biased due to the lack of tracers.

3.4.3. PMF Input of Uncertainties

The uncertainties of the ambient data were calculated to be analytical uncertainty + 1/3 × method detection limit (MDL) [40,41]. Samples with missing values were excluded from the calculation. Data below detection limit were not modified at the expense of uncertainty estimation and an uncertainty of 5/6 × MDL was assigned [42]. The uncertainties for the lumped species were calculated using the root sum of squares (RSS) method [36,37]. Analytical uncertainty for the major species was obtained by propagating the precisions of volumetric measurements of air sampled, chemical composition measurements and field blank variability.
The analytical uncertainties of the organics were assumed to be the concentration multiplied by an error fraction (EF). By default, a fixed EF was assigned to each species. However, with the intrinsic robust mode of PMF, occasional high concentration data might be treated as “outliers” (defined as scaled residue > 4) and “ignored” during the iteration process when a constant EF is applied [37]. This treatment will limit the ability for the model to reproduce the valid high concentration data. This situation occurred for cholesterol, which had noticeably higher concentrations in P3 period associated with enhanced emissions during dinner time, as shown in the concentration time series plot (Figure S1). It would be erroneous to let the model forgo this characteristic of cholesterol. To address this issue, Wang et al., [37] introduced a varying EF method and established the merit of this method. Specifically, Equation (4) is used to define a variable EF, which gives a higher priority to those high concentration data during iteration,
E F = E F 0 a x i j max { x i j } ,
where EF0 is the fixed error fraction set related to analytical measurement precision. EF0 was set as 0.3 for levoglucosan and non-polar organics (except PAHs), 0.4 for other polar organics and PAHs. ”a” is the variation magnitude applied between “outliers” and the bulk of the data. The larger a is, the higher adjustment is applied to EF0. “xij” represents each sampling data point. A non-zero a value was only applied to cholesterol. After trial and error, a = 0.1 was set for cholesterol to achieve the optimal model performance while insisting on the robust mode of PMF. For the other species, fixed EF, that is, EF = EF0, is applied.

3.4.4. PMFCholC16C18 Solution

Eight to ten factors were tested, and the nine-factor solution was determined to be the most suitable in terms of interpretation and robustness. To reduce rotational ambiguity and give a more reasonable profile, several constrained were set and listed in Table S1. The PMF base run without constrains was unable to clearly separate cooking and vehicular emissions (Figure S2), and the details describing the base run are provided in the Supplementary Materials. The source profiles of the constrained nine-factor solution are shown in Figure 8. Factor identification was based on the highest loading species, and their indicative sources are summarized in Table S1. Five primary sources were resolved, namely sea salt aerosol by Na+ and Cl, coal combustion by PAHs252 and PAHs276, biomass burning by levoglucosan, mannosan, and vanillic acid, vehicular emissions by hopanes and EC, and cooking emissions by cholesterol, palmitic acid, and stearic acid. Four secondary sources were resolved, including secondary sulfate process, secondary nitrate process [31], and two SOA factors. SOA-I factor is associated with high loadings of SOA tracers derived from volatile organic compound precursors including α-pinene, β-caryophyllene, mono-aromatic compounds, and naphthalene and derivatives. SOA-II is associated with SOA tracers derived from oxidation of isoprene. In the PMF-resolved source profiles, while cholesterol is mainly (77%) loaded in the cooking factor, palmitic acid and stearic acid are comparably distributed in coal combustion and cooking factors. These results are consistent with the qualitative source origin information reported in Section 3.4.1.
Error estimations for the PMF solution were performed via displacement of factor elements (DISP) and bootstrapping (BS). In DISP, no factor swap occurred and the percentage change in Q value (%dQ; i.e., the objective function indicating the overall fitness of the modelled data considering input uncertainty) was 0.02%, indicating the global minimum was achieved. All of the BS factors were also mapped with the base factors in BS at least 95 times (BS resampled for 100 times). Most factors achieved 100 times mapped except cooking emissions factor (96%) and biomass burning factor and secondary nitrate factor (99%).
The modelled OC compared well with the measurements with a correlation coefficient (R2) of 0.86 and a slope of 0.97 for OC (Figure S6). The modelled PM2.5 also compared well with the measurement (R2: 0.61, slope: 0.99). The application of the varying EF has notably improved the modeling performance of cholesterol. The extent of under-estimation of the high concentration data was significantly reduced with the adoption of the varying EF (Figure S1), resulting in a significantly enhanced agreement between the modelled and the measured cholesterol, with the correlation coefficient improved to 0.71 from 0.47 and the slope improved to 0.7 from 0.3 (Figure S6). The improved modeling of cholesterol also benefits the modeling of palmitic acid, with the correlation coefficient and slope increased from 0.60 to 0.77 and from 0.69 to 0.85, respectively.

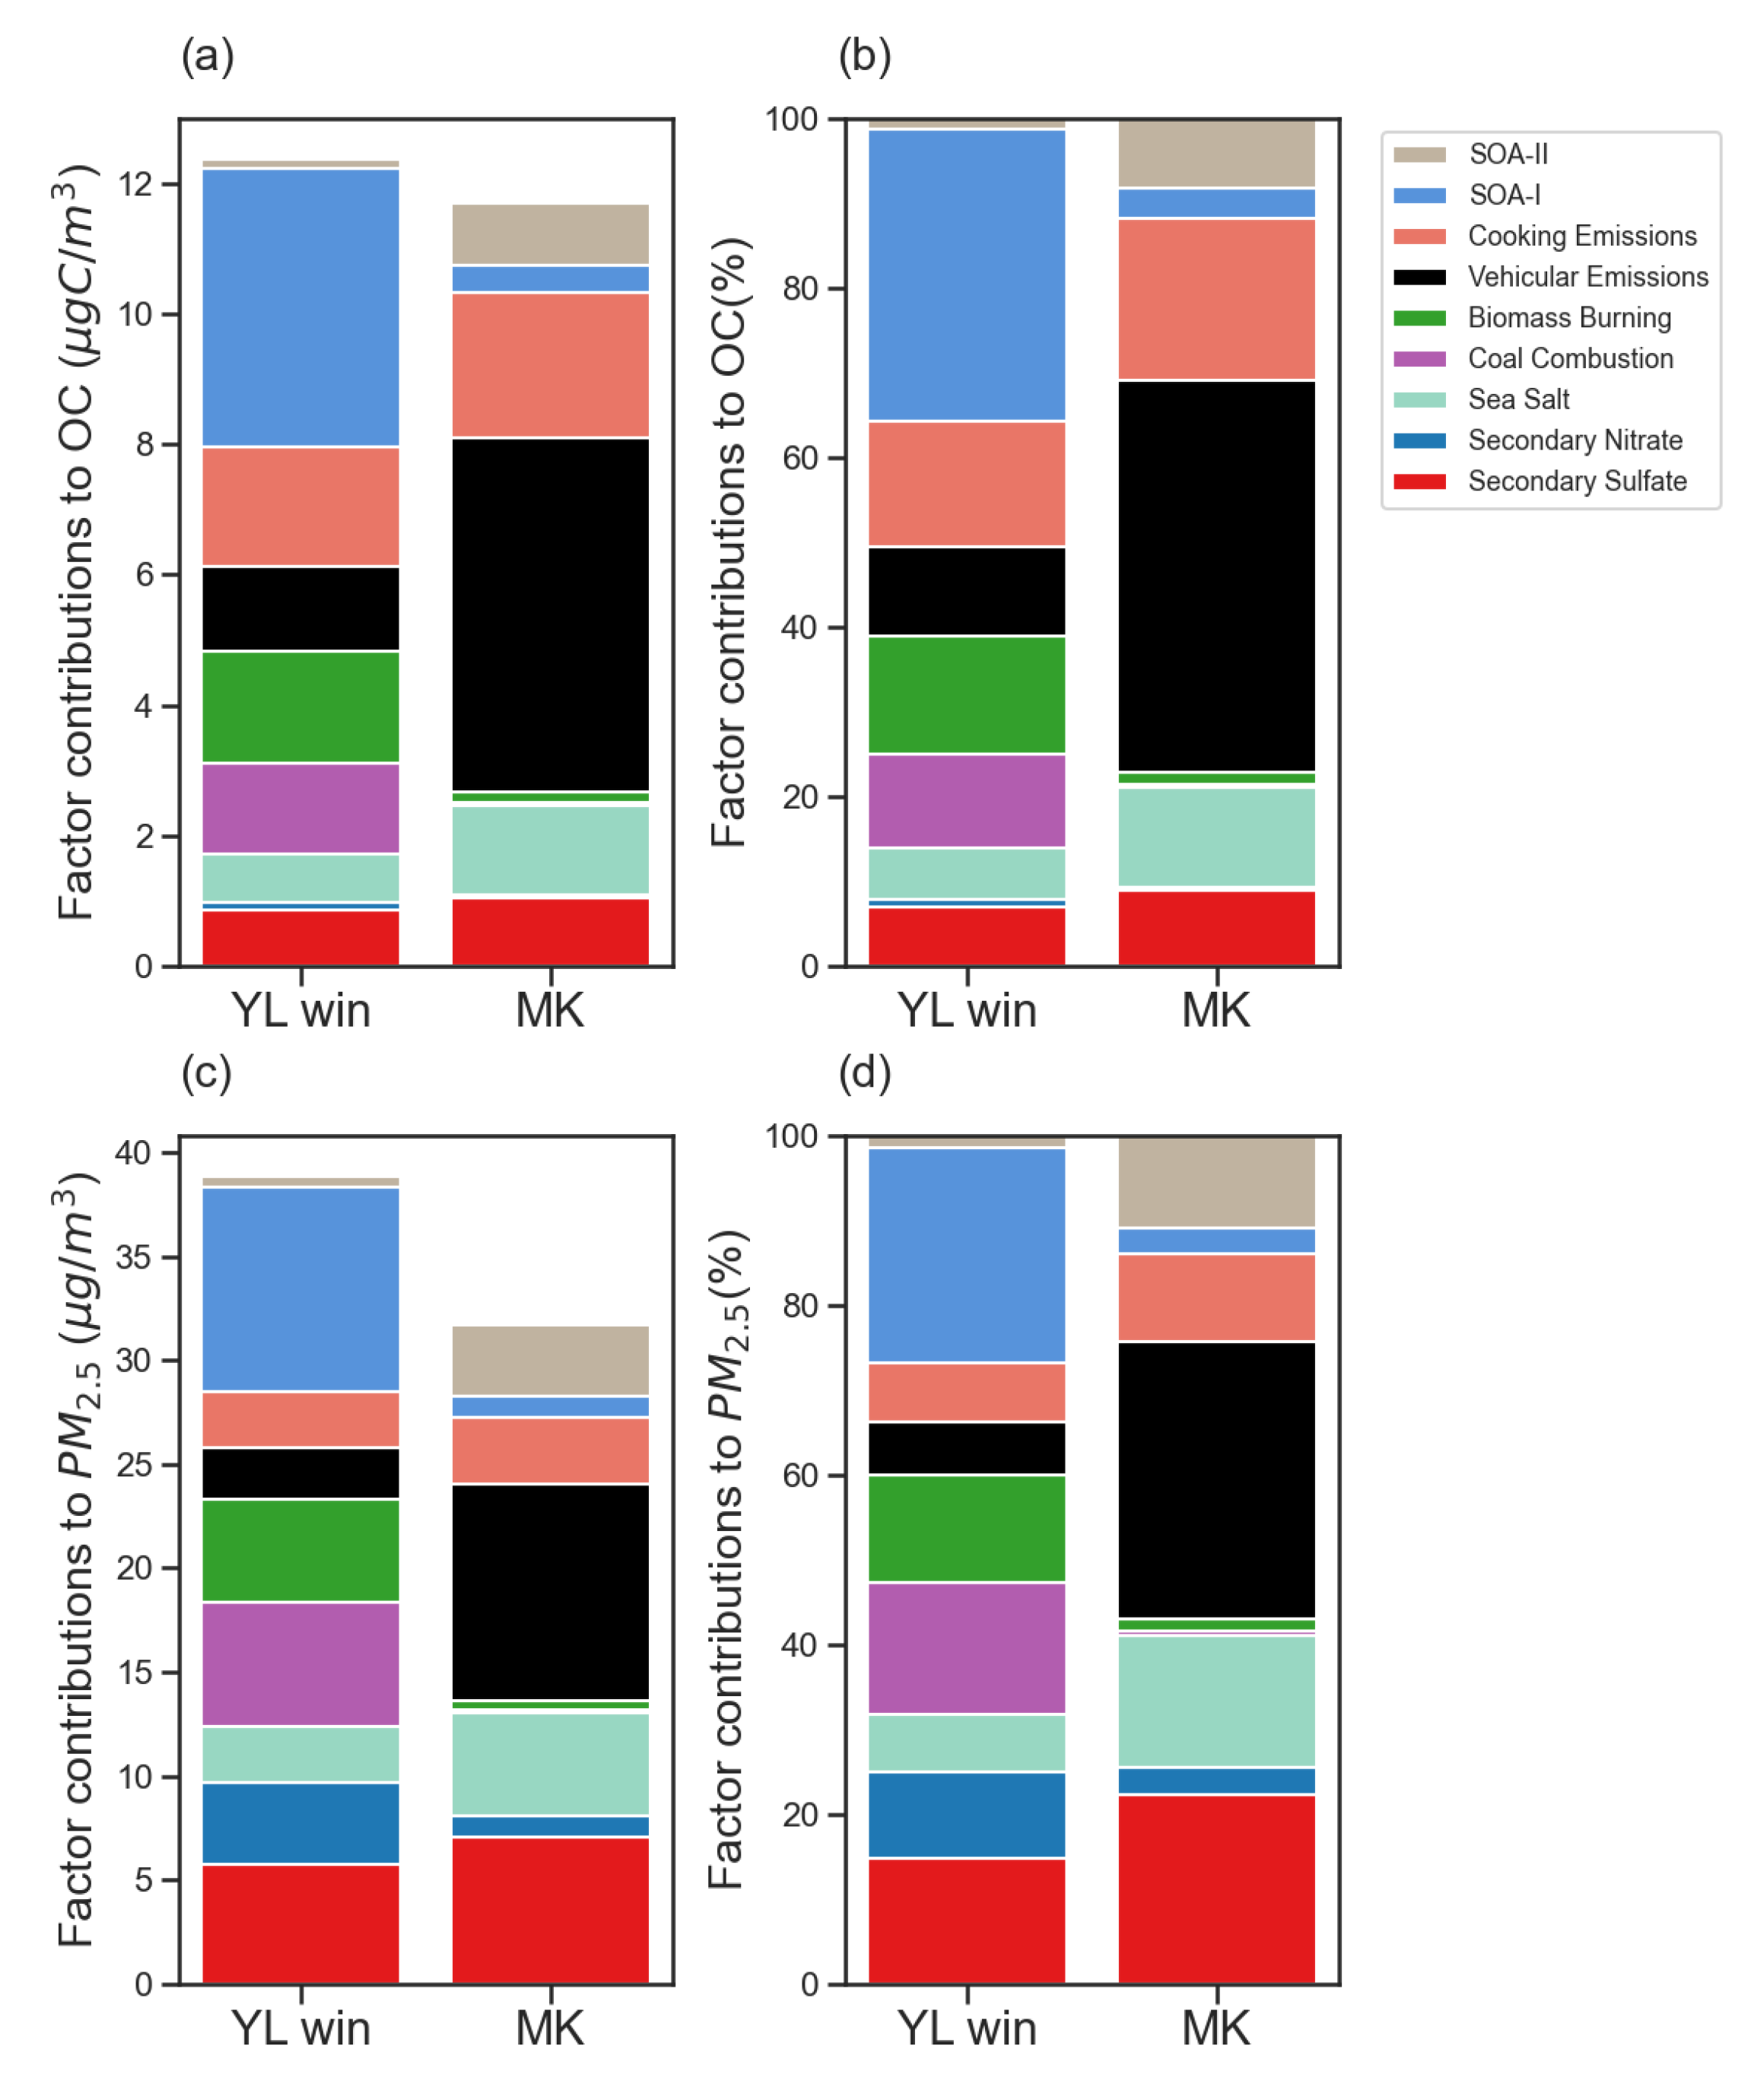
3.4.5. PM2.5 and OC Contribution from Cooking Emissions in PMFCholC16C18

Source contributions to PM2.5 were calculated by reconstructing the total mass from each profile using the following equation,
Reconstructed PM2.5 = [OM/OC] × [OC] + [EC] + [Na+] + [SO42−] + [NO3] + [NH4+] + [Cl] + [K+]
The organic matter to organic carbon (OM/OC) ratio was assumed to be 1.8, 1.2 and 1.4 for secondary sources, vehicular exhaust, and other primary source factors, respectively.
The resolved average factor contributions to PM2.5 and OC for each site are shown in Figure 9 in both mass contributions (Figure 9a,c) and in percent contributions (Figure 9b,d). We note that the two groups of samples were collected in different seasons, with the YL samples collected in winter 2016 and the MK samples collected in summer 2017, and the seasonal contrast is known to be prominent for Hong Kong, with regional/super regional sources dominant over local sources in wintertime [43,44,45]. This seasonal difference is clearly reflected in the significant higher contribution of coal combustion and biomass burning at YL than at MK (i.e., 1.39 vs. 0.04 and 1.72 vs. 0.16 µgC/m3, respectively). SOA-I, dominated by SOA resulting from precursors including toluene and other mono-aromatic compounds and naphthalene and derivatives, was significantly higher in winter YL than in summer HK (4.26 vs. 0.43 µgC/m3). SOA-II, dominated by isoprene SOA, showed the opposite result, lower in winter YL while higher in summer MK (0.15 vs. 0.95 µgC/m3). Such seemingly inconsistent results are actually consistent with the seasonality of pollution characteristics and isoprene emissions. The precursors of SOA-I were significantly enhanced due to contributions of regional/super-regional sources, therefore more SOA-I was in the winter YL samples. On the other hand, isoprene emissions are driven by temperature and known to be significantly higher in summer, and this explains the higher SOA-II in the summer MK samples.
As seasonality complicates a direct comparison of regional/super-regional sources and secondary sources, we next only focus on two major local sources, i.e., vehicular emissions and cooking emissions, both of which are expected to exhibit weak seasonality. In the summer MK samples, vehicular emissions contributed on average 5.4 µgC/m3 OC, making it the biggest contributor to OC with the percent contribution of 46%. This result is consistent with its roadside location nature. The second largest contributor was cooking, accounting for 2.2 µgC/m3 and 19% of OC at MK. In the winter YL samples, vehicular and cooking emissions contribute 1.3 µgC/m3 (10%) and 1.8 µgC/m3 (15%), respectively. In term of PM2.5 contributions, vehicular emissions contributed 6.5 µg/m3 (20%) at MK and 1.5 µg/m3 (3.8%) at YL while cooking emissions contributed 3.3 µg/m3 (10%) at MK and 2.7 µg/m3 (6.9%) at YL (Figure 9c,d). Cooking contributions at MK were also investigated and reported by Lee et al., (2015) [7]. According to their PMF result from HR-ToF-AMS measurement of PM1, 3.6 µg/m3 of organic aerosol was contributed to cooking organic aerosol (COA) in MK, comparable with our source estimation of cooking emissions. The source apportionment results unmistakably demonstrate that cooking is a significant local PM2.5 source at both MK and YL, broadly comparable to vehicular emissions in source contributions.
Examining the cooking contributions by time segments (Figure 10), we clearly see a diurnal variation, with the highest contributions occurring during P3 (16:00–21:00) at both sites in coincidence with main dinner hours. At MK site, contribution in P2 (11:00–16:00) covering the main lunchtime hours was also high. This result was consistent with the PMF result from AMS measurements [7]—that they observed peaks of cooking OA from 12 noon to 2 p.m. and from 7 p.m. to 9 p.m.. However, in YL winter, contribution from P2 was only comparable to P1 (06:00–11:00). At MK site, the restaurants nearby are mostly not open in the morning and the meals served at breakfast often require a less oily cooking style leading to generally lower emissions [7]. At YL site, there are restaurants that serve breakfast in the vicinity of the sampling site, explaining the comparable contribution between P1 and P2.
Additionally, we inspected source contributions in each time segment on individual days (Figure S7). In YL winter, there was an obvious increase in cooking contribution near New Year’s Eve (YL161230). From YL161222 to YL161230 (Figure S2), there were consistent high peaks of cholesterol during P3 but low in other periods. This result is consistent with increased barbecue activities near the YL site, which is a local tradition as a way of celebrating New Year’s Eve. Barbecue cooking gathering in the late afternoon/early evening is generally a common and popular activity in winter among local residents. During P3 segment, the cooking emissions contribution reached 4.6 µg/m3 (42%) on 22 December, 5.6 µg/m3 (23%) on 26 December, and 6.2 µg/m3 (35%) on 30 December, with the percentages inside the parentheses being the percent contributions to OC. Such quantitative contribution information highlights cooking as a substantial local source and calls for consideration of this source in setting control measures to curb PM pollution.

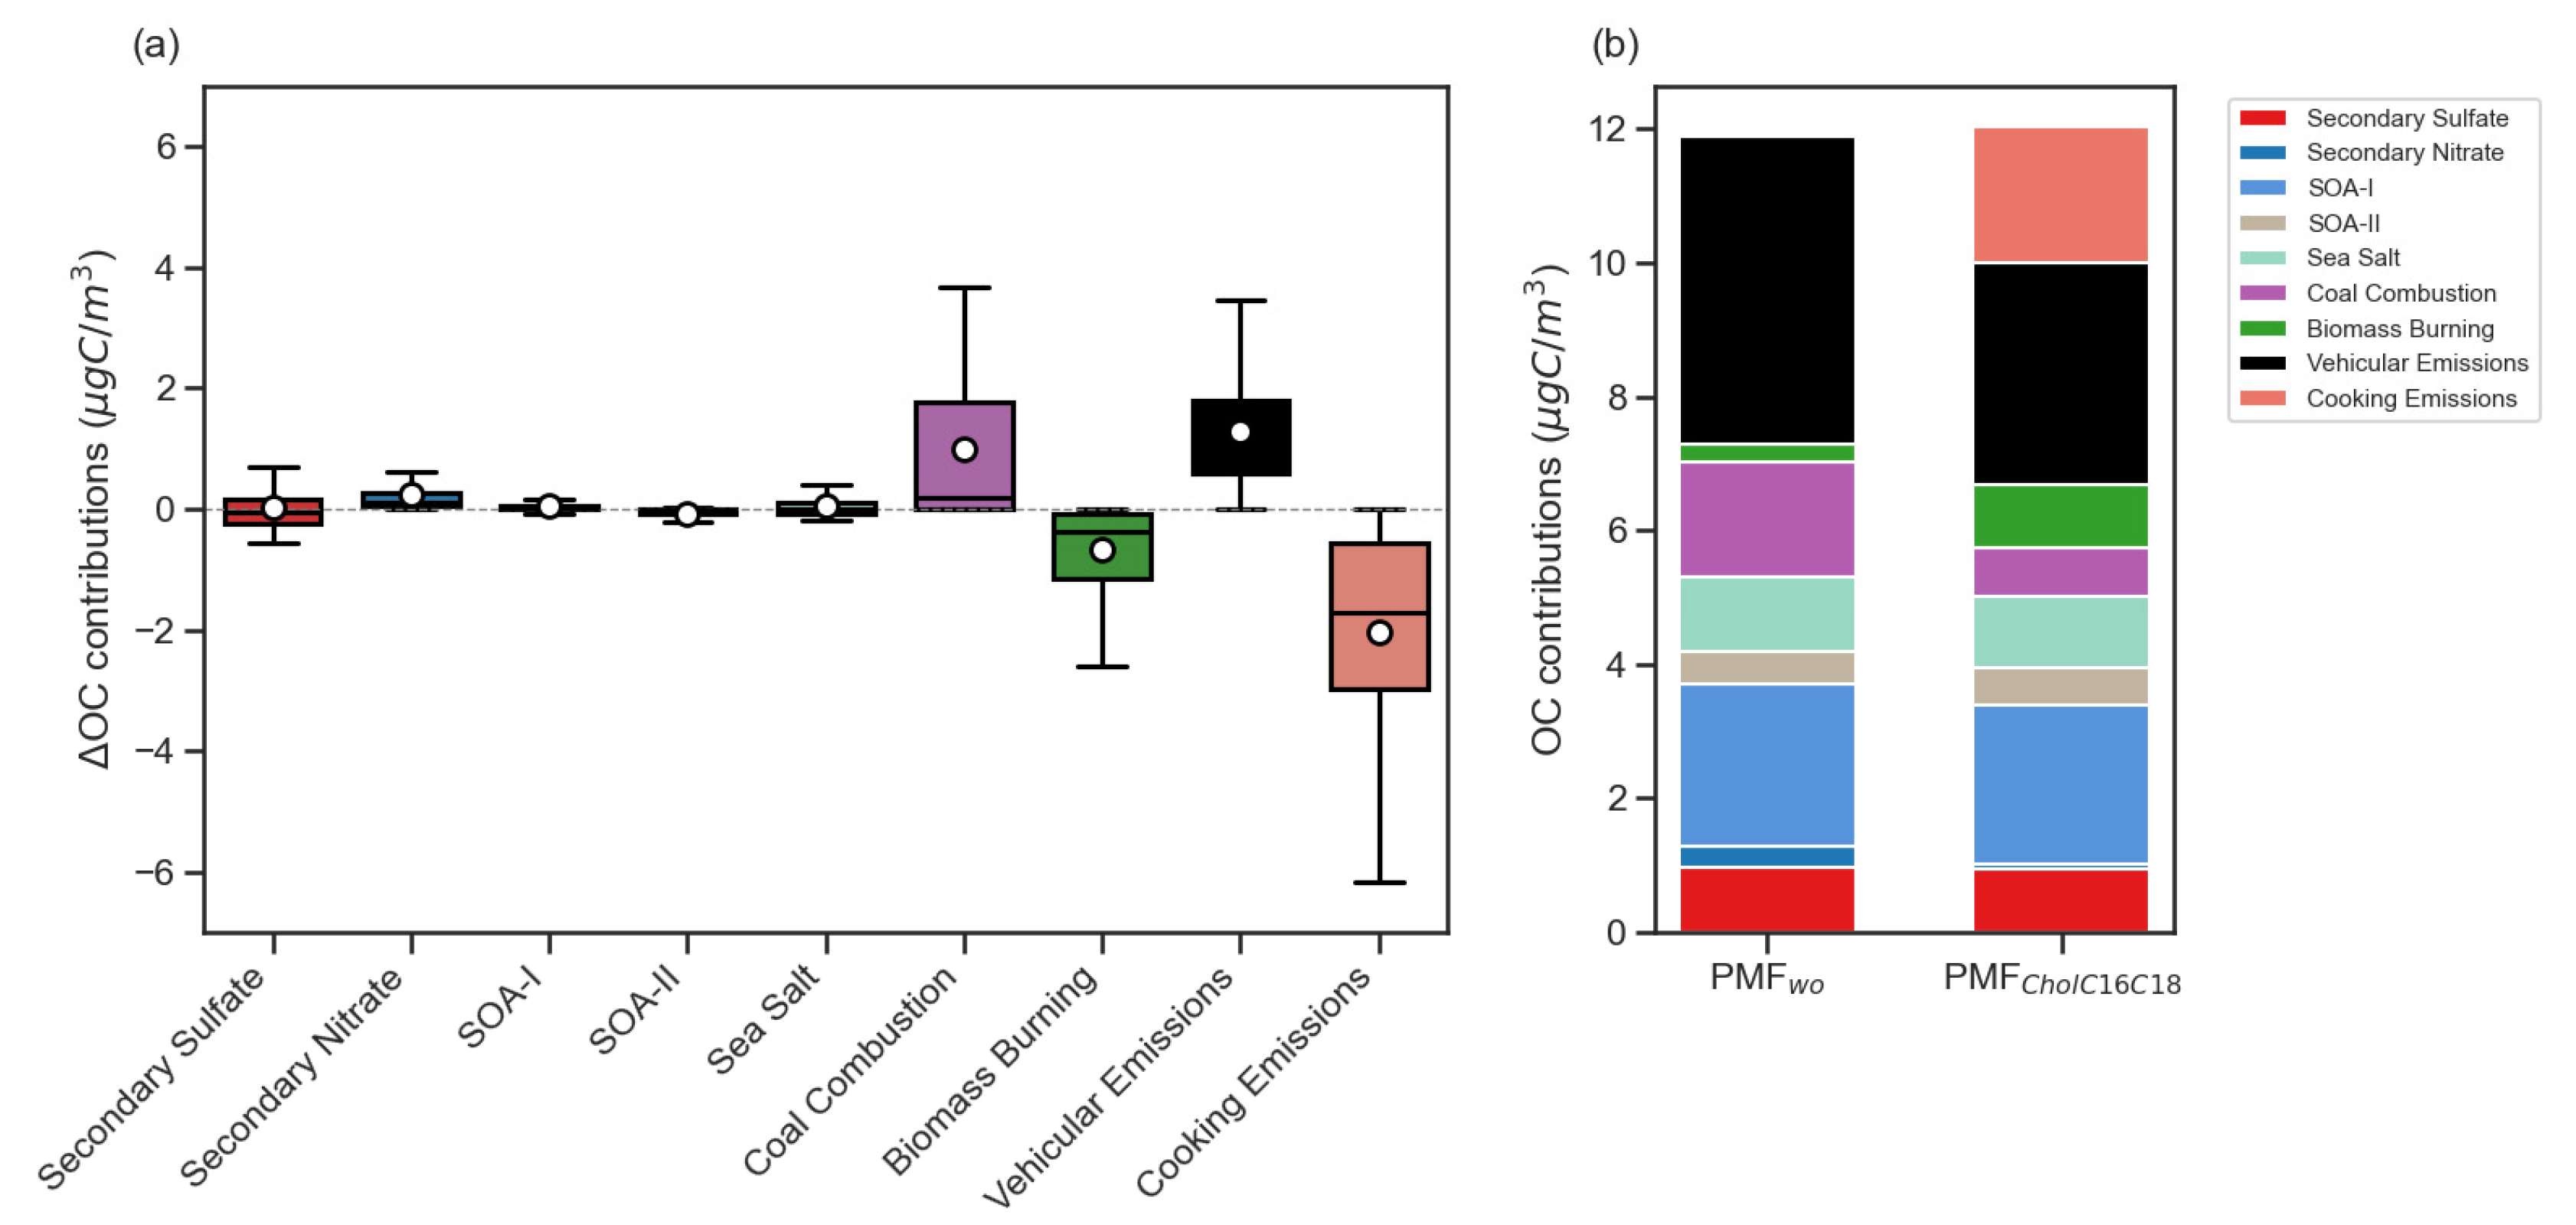
3.4.6. PMF Runs with Cholesterol or Fatty Acids Excluded

As one objective of this work is to evaluate the utility of fatty acids in source apportionment and multiple molecular tracers are available to indicate the cooking source, we also seek to answer if cholesterol or fatty acids alone could be sufficient to adequately apportion the cooking emission source contribution, i.e., to evaluate the strength of these molecules serving as source identifiers. Three types of PMF runs were carried out, with all input species the same except for the three cooking-related molecules. In PMFCholC16C18, all three molecules are included (discussed in the preceding sections), in PMFChol, cholesterol is included but C16:0 and C18:0 fatty acids are excluded, and lastly in PMFC16C18, cholesterol is excluded while the C16:0 and C18:0 fatty acids are included.
The source profiles resolved in the PMFCholC16C18 and PMFChol base runs are compared in Figure S4. While cholesterol alone permits resolving cooking emission as a separate source factor, the inclusion of fatty acids with cholesterol helps lower the mixing of cooking and vehicular emission sources. Figure S5 compares the source profiles resolved in the PMFcholC16C18 and PMFC16C18 base runs, showing that without cholesterol, identifying the source nature of the factor moderately loaded with fatty acids in PMFC16C18 becomes uncertain, as there lacks a clear indicator species, and the co-occurrence of fatty acid and hopanes in the factor further adds ambiguity. Apparently, cholesterol is a more specific tracer for cooking than the C16:0 and C18:0 fatty acids, and its inclusion in PMF is essential for the identification and apportionment of the cooking source. While the C16:0 and C18:0 fatty acids are less uniquely associated with cooking activities, especially during wintertime under influence of regional/super-regional influence, their inclusion in the PMF is still beneficial in affirming the identification of the cooking source and helps reduce source mixing with vehicular emissions.

3.4.7. Impact of Cooking Related Tracers in PMF

Another way to evaluate the utility of cooking tracers in source apportionment analysis is to compare the results between PMF runs with and without including cooking tracers. In PMFwo, all three cooking-related molecules are excluded, and the solution is compared with that by PMFCholC16C18. The constrains applied in PMFwo were identical to PMFCholC16C18. Without the cooking related tracers, PMFwo is unable to resolve a cooking emissions factor, thus producing only eight factors. Comparing PMFwo, and PMFCholC16C18, we note that the species source profiles in the eight commonly resolved factors are similar (Figure S8). The total OC modelled by PMFwo (11.9 µg/m3) is highly comparable with that by PMFCholC16C18 (12.0 µg/m3) (Figure 11b) and both sets of modelled OC compare well with those of the measured OC in individual samples (Figure S9). Figure 11a shows the difference in the apportioned OC contribution between the two PMF solutions for individual sources. The OC contributions by individual or combined secondary factors (i.e., secondary sulfate, secondary nitrate, SOA-I, SOA-II) show little changes, with the combined contribution at 3.9 µg/m3 by PMFwo and at 4.2 µg/m3 by PMFCholC16C18 (less than 6% change). The combined contributions by primary factors also exhibit only a difference less than 5%, with 8.1 µg/m3 by PMFwo and 7.7 µg/m3 by PMFCholC16C18. However, notable variations in the apportioned contributions are found for four of the five primary factors (i.e., coal combustion, biomass burning, vehicular emissions, and cooking emissions). The OC contribution by cooking emissions (~2 µg/m3) in PMFCholC16C18 is mostly redistributed to two primary factors: coal combustion (average OC difference: +1.0 µg/m3) and vehicular emissions (average OC difference: +1.3 µg/m3) factors in PMFwo. Some of the OC contribution from those two factors is also redistributed to biomass burning (average OC difference: −0.7 µg/m3) in PMFwo. All the four secondary factors plus sea salt factor are quite robust between the two runs, implying the independence of those sources to cooking emissions.
As mentioned in previous sections, palmitic acid and stearic acid abundance at the receptor site could be influenced by regional transport in winter associated with regional sources such as coal combustion and biomass burning. Without the inclusion of the two fatty acids, the contribution from those sources could be either underestimated (biomass burning) or overestimated (coal combustion). Due the co-emission of cooking and vehicles as local sources, vehicular emissions could be overestimated if the cooking tracers are excluded in PMF analysis. The results indicate the importance of including indicative source markers for major sources impacting a receptor site.

4. Conclusions

Plastics are widely used in laboratories. It is difficult to completely replace plastics due to its convenience, elastic properties and great sealing protection. If palmitic acid and stearic acid are target analytes, plastic labware should be avoided as much as possible to reduce blank contamination. We demonstrate in this work, a new method that reduces the contamination of palmitic acid and stearic acid and thereby enabling a more accurate quantification of these compounds in ambient PM2.5 samples. This improvement leads to successful retrieval of quantitative information for these two compounds in the majority of the field samples we have analyzed.
Source apportionment has been conducted utilizing three cooking related tracers, palmitic acid, stearic acid and cholesterol. It is shown that including all three cooking related tracers enables resolving cooking emissions in the PMF source analysis of a PM2.5 dataset collected at two urban sites in Hong Kong. The source apportionment results show that cooking emission was a significant local PM2.5 source, its contributions being broadly on par with those from vehicular emissions. Specifically, at MK (a roadside urban site) cooking emissions contributed an average of 2.2 µgC/m3 and 19% of OC at MK, comparing with vehicular emission contribution at 5.4 µgC/m3 and 46% of OC; at YL (a general urban site), cooking emissions accounted for 1.8 µgC/m3 and 15% of OC, in comparison with vehicular emissions at 1.3 µgC/m3 and 10% of OC. If the three cooking related tracers were excluded in the PMF, the OC contribution of two primary factors, coal combustion and vehicular emissions would be overestimated. The importance of cooking emissions will not be revealed. The findings demonstrate the utility of palmitic acid and stearic acid as useful source tracers and therefore the need for their reliable quantification.

Supplementary Materials

One table and seven figures reporting more details of PMF analysis are available online at https://www.mdpi.com/2073-4433/11/10/1120/s1. Table S1. Summary of input species in final PMF model. Figure S1. Time series of observed cholesterol and hopanes and modelled cholesterol from PMFChollinear and PMFCholC16C18, Figure S2. Correlation matrix of selected input species, Figure S3. PMFChollinear base factor profile, Figure S4. Comparison of source profiles resolved by base runs of PMFCholC16C18 and PMFChol, Figure S5. Comparison of source profiles resolved by base runs of PMFCholC16C18 and PMFC16C18, Figure S6. Scatter plots with correlation coefficients and linear regressions of modelled against observed data for PM2.5, OC, palmitic acid, stearic acid and cholesterol, Figure S7. Factor source contributions to OC (%) from PMFCholC16C18 for individual samples. Figure S8. Scatter plots of modelled data from PMFCholC16C18 and PMFwo against observed OC data. Figure S9. Scatter plots of modeled against observed OC data from PMFCholC16C18 and PMFwo. PMFCholC16C18 refers to the PMF run with all cooking tracers (cholesterol, palmitic acid and stearic acid) included. PMFwo refers to the PMF run without cooking tracers included. The solid line represents the regression equations generated by orthogonal distance regression and the dashed line is one-to-one line.

Author Contributions

Y.Y.C.: conceptualization, methodology, validation, formal analysis, investigation, data curation, writing—original draft preparation, and visualization. J.Z.Y.: conceptualization, methodology, validation, resources, writing—review and editing, supervision, project administration, funding acquisition. All authors have read and agreed to the published version of the manuscript.

Funding

This work was partially supported by the Natural Science Foundation of China (91543130 and 91843301) and Special Fund Project for Science and Technology Innovation Strategy of Guangdong Province (grant no. 2019B121205004).

Conflicts of Interest

The authors declare no conflict of interest. The funders had no role in the design of the study; in the collection, analyses, or interpretation of data; in the writing of the manuscript, or in the decision to publish the results.

References

  1. Nolte, C.G.; Schauer, J.J.; Cass, G.R.; Simoneit, B.R.T. Highly polar organic compounds present in meat smoke. Environ. Sci. Technol. 1999, 33, 3313–3316. [Google Scholar] [CrossRef]
  2. Rogge, W.F.; Cass, G.R.; Hlldemann, L.M.; Mazurek, M.A.; Slmoneit, B.R.T. Sources of Fine Organic Aerosol. 1. Charbroilers and Meat Cooking Operations. Environ. Sci. Technol. 1991. [Google Scholar] [CrossRef]
  3. Schauer, J.J.; Kleeman, M.J.; Cass, G.R.; Simoneit, B.R.T. Measurement of emissions from air pollution sources. 4. C1–C27 organic compounds from cooking with seed oils. Environ. Sci. Technol. 2002, 36, 567–575. [Google Scholar] [CrossRef] [PubMed]
  4. He, L.Y.; Hu, M.; Huang, X.F.; Yu, B.D.; Zhang, Y.H.; Liu, D.Q. Measurement of emissions of fine particulate organic matter from Chinese cooking. Atmos. Environ. 2004, 38, 6557–6564. [Google Scholar] [CrossRef]
  5. McDonald, J.D.; Zielinska, B.; Fujita, E.M.; Sagebiel, J.C.; Chow, J.C.; Watson, J.G. Emissions from charbroiling and grilling of chicken and beef. J. Air Waste Manag. Assoc. 2003, 53, 185–194. [Google Scholar] [CrossRef] [Green Version]
  6. Huang, X.F.; He, L.Y.; Hu, M.; Canagaratna, M.R.; Sun, Y.; Zhang, Q.; Zhu, T.; Xue, L.; Zeng, L.W.; Liu, X.G.; et al. Highly time-resolved chemical characterization of atmospheric submicron particles during 2008 Beijing Olympic games using an aerodyne high-resolution aerosol mass spectrometer. Atmos. Chem. Phys. 2010, 10, 8933–8945. [Google Scholar] [CrossRef] [Green Version]
  7. Lee, B.P.; Li, Y.J.; Yu, J.Z.; Louie, P.K.K.; Chan, C.K. Characteristics of submicron particulate matter at the Urban roadside in downtown Hong Kong-Overview of 4 months of continuous high-Resolution aerosol mass spectrometer measurements. J. Geophys. Res. 2015, 120, 7040–7058. [Google Scholar] [CrossRef]
  8. Sun, C.; Lee, B.P.; Huang, D.; Li, Y.J.; Schurman, M.I.; Louie, P.K.K.; Luk, C.; Chan, C.K. Continuous measurements at the urban roadside in an Asian megacity by Aerosol Chemical Speciation Monitor (ACSM): Particulate matter characteristics during fall and winter seasons in Hong Kong. Atmos. Chem. Phys. 2016, 16, 1713–1728. [Google Scholar] [CrossRef] [Green Version]
  9. Zhao, W.; Hopke, P.K.; Norris, G.; Williams, R.; Paatero, P. Source apportionment and analysis on ambient and personal exposure samples with a combined receptor model and an adaptive blank estimation strategy. Atmos. Environ. 2006, 40, 3788–3801. [Google Scholar] [CrossRef]
  10. Abdullahi, K.L.; Delgado-Saborit, J.M.; Harrison, R.M. Emissions and indoor concentrations of particulate matter and its specific chemical components from cooking: A review. Atmos. Environ. 2013, 71, 260–294. [Google Scholar] [CrossRef]
  11. Hou, X.; Zhuang, G.; Lin, Y.; Li, J.; Jiang, Y.; Fu, J.S. Emission of fine organic aerosol from traditional charcoal broiling in China. J. Atmos. Chem. 2008. [Google Scholar] [CrossRef]
  12. Schauer, J.J.; Kleeman, M.J.; Cass, G.R.; Simoneit, B.R.T. Measurement of emissions from air pollution sources. 1. C1 through C29 organic compounds from meat charbroiling. Environ. Sci. Technol. 1999. [Google Scholar] [CrossRef]
  13. Zhao, Y.; Hu, M.; Slanina, S.; Zhang, Y. Chemical compositions of fine particulate organic matter emitted from Chinese cooking. Environ. Sci. Technol. 2007. [Google Scholar] [CrossRef] [PubMed]
  14. Zheng, M.; Wan, T.S.M.; Fang, M.; Wang, F. Characterization of the non-volatile organic compounds in the aerosols of Hong Kong—Identification, abundance and origin. Atmos. Environ. 1997. [Google Scholar] [CrossRef]
  15. Fraser, M.P.; Yue, Z.W.; Buzcu, B. Source apportionment of fine particulate matter in Houston, TX, using organic molecular markers. Atmos. Environ. 2003. [Google Scholar] [CrossRef]
  16. Robinson, A.L.; Subramanian, R.; Donahue, N.M.; Bernardo-Bricker, A.; Rogge, W.F. Source apportionment of molecular markers and organic aerosol. 3. Food cooking emissions. Environ. Sci. Technol. 2006. [Google Scholar] [CrossRef]
  17. Schauer, J.J.; Cass, G.R. Source apportionment of wintertime gas-phase and particle-phase air pollutants using organic compounds as tracers. Environ. Sci. Technol. 2000. [Google Scholar] [CrossRef] [Green Version]
  18. Zheng, M.; Cass, G.R.; Schauer, J.J.; Edgerton, E.S. Source apportionment of PM2.5 in the southeastern United States using solvent-extractable organic compounds as tracers. Environ. Sci. Technol. 2002. [Google Scholar] [CrossRef]
  19. Ding, X.; Wang, X.M.; Zheng, M. The influence of temperature and aerosol acidity on biogenic secondary organic aerosol tracers: Observations at a rural site in the central Pearl River Delta region, South China. Atmos. Environ. 2011. [Google Scholar] [CrossRef]
  20. Sin, D.W.M.; Fung, W.H.; Choi, Y.Y.; Lam, C.H.; Louie, P.K.K.; Chow, J.C.; Watson, J.G. Seasonal and spatial variation of solvent extractable organic compounds in fine suspended particulate matter in Hong Kong. J. Air Waste Manag. Assoc. 2005. [Google Scholar] [CrossRef] [PubMed] [Green Version]
  21. Zheng, M.; Fang, M.; Wang, F.; To, K.L. Characterization of the solvent extractable organic compounds in PM2.5 aerosols in Hong Kong. Atmos. Environ. 2000. [Google Scholar] [CrossRef]
  22. Cavonius, L.R.; Albers, E.; Undeland, I. In vitro bioaccessibility of proteins and lipids of pH-shift processed Nannochloropsis oculata microalga. Food Funct. 2016. [Google Scholar] [CrossRef] [Green Version]
  23. Cavonius, L.R.; Carlsson, N. Fatty acid contaminations originating from commercially available solid phase-extraction columns. Chem. Sci. Rev. Lett. 2015, 4, 1206–1209. [Google Scholar]
  24. Notter, S.J.; Stuart, B.H.; Dent, B.B.; Keegan, J. Solid-phase extraction in combination with GC/MS for the quantification of free fatty acids in adipocere. Eur. J. Lipid Sci. Technol. 2008. [Google Scholar] [CrossRef]
  25. Prasad, M.R.; Jones, R.M.; Young, H.S.; Kaplinsky, L.B.; Das, D.K. Analysis of tissue free fatty acids isolated by aminopropyl bonded-phase columns. J. Chromatogr. B Biomed. Sci. Appl. 1988, 428, 221–228. [Google Scholar] [CrossRef]
  26. Gunash, J.; Henao, J.J.A.; Stark, K.D. Palmitic and Stearic Free Fatty Acids Are Consistently Found in Materials used for Dried Blood Spot Collection. FASEB J. 2017, 31, 955-13. [Google Scholar] [CrossRef]
  27. Liu, G.; Mühlhäusler, B.S.; Gibson, R.A. Evaluation of contamination associated with current blood spot technology for determining the fatty acid status of individuals. Eur. J. Lipid Sci. Technol. 2015. [Google Scholar] [CrossRef]
  28. Yao, C.H.; Liu, G.Y.; Yang, K.; Gross, R.W.; Patti, G.J. Inaccurate quantitation of palmitate in metabolomics and isotope tracer studies due to plastics. Metabolomics 2016. [Google Scholar] [CrossRef] [Green Version]
  29. He, X.; Huang, X.H.H.; Chow, K.S.; Wang, Q.; Zhang, T.; Wu, D.; Yu, J.Z. Abundance and Sources of Phthalic Acids, Benzene-Tricarboxylic Acids, and Phenolic Acids in PM2.5 at Urban and Suburban Sites in Southern China. ACS Earth Space Chem. 2018, 2, 147–158. [Google Scholar] [CrossRef]
  30. Wang, Q.; Huang, X.H.H.; Tam, F.C.V.; Zhang, X.; Liu, K.M.; Yeung, C.; Feng, Y.; Cheng, Y.Y.; Wong, Y.K.; Ng, W.M.; et al. Source apportionment of fine particulate matter in Macao, China with and without organic tracers: A comparative study using positive matrix factorization. Atmos. Environ. 2019, 198, 183–193. [Google Scholar] [CrossRef]
  31. Wong, Y.K.; Huang, X.H.H.; Cheng, Y.Y.; Louie, P.K.K.; Yu, A.L.C.; Tang, A.W.Y.; Chan, D.H.L.; Yu, J.Z. Estimating contributions of vehicular emissions to PM2.5 in a roadside environment: A multiple approach study. Sci. Total Environ. 2019, 672, 776–788. [Google Scholar] [CrossRef]
  32. Paatero, P.; Tapper, U. Positive matrix factorization: A non-negative factor model with optimal utilization of error estimates of data values. Environmetrics 1994, 5, 111–126. [Google Scholar] [CrossRef]
  33. Paatero, P. Least squares formulation of robust non-negative factor analysis. Chemom. Intell. Lab. Syst. 1997, 37, 23–35. [Google Scholar] [CrossRef]
  34. Zhang, Y.; Schauer, J.J.; Zhang, Y.; Zeng, L.; Wei, Y.; Liu, Y.; Shao, M. Characteristics of particulate carbon emissions from real-world Chinese coal combustion. Environ. Sci. Technol. 2008, 42, 5068–5073. [Google Scholar] [CrossRef] [PubMed]
  35. Schauer, J.J.; Kleeman, M.J.; Cass, G.R.; Simoneit, B.R.T. Measurement of emissions from air pollution sources. 3. C1–C29 organic compounds from fireplace combustion of wood. Environ. Sci. Technol. 2001, 35, 1716–1728. [Google Scholar] [CrossRef]
  36. Xie, M.; Hannigan, M.P.; Barsanti, K.C. Impact of gas/particle partitioning of semivolatile organic compounds on source apportionment with positive matrix factorization. Environ. Sci. Technol. 2014, 48, 9053–9060. [Google Scholar] [CrossRef]
  37. Wang, Q.; He, X.; Hilda Huang, X.H.; Griffith, S.M.; Feng, Y.; Zhang, T.; Zhang, Q.; Wu, D.; Yu, J.Z. Impact of secondary organic aerosol tracers on tracer-based source apportionment of organic carbon and PM2.5: A case study in the pearl river delta, China. ACS Earth Space Chem. 2017, 1, 562–571. [Google Scholar] [CrossRef]
  38. Kaltsonoudis, C.; Kostenidou, E.; Louvaris, E.; Psichoudaki, M.; Tsiligiannis, E.; Florou, K.; Liangou, A.; Pandis, S.N. Characterization of fresh and aged organic aerosol emissions from meat charbroiling. Atmos. Chem. Phys. 2017, 17, 7143–7155. [Google Scholar] [CrossRef] [Green Version]
  39. Schauer, J.J.; Kleeman, M.J.; Cass, G.R.; Simoneit, B.R.T. Measurement of emissions from air pollution sources. 5. C1–C32 organic compounds from gasoline-powered motor vehicles. Environ. Sci. Technol. 2002, 36, 1169–1180. [Google Scholar] [CrossRef]
  40. Polissar, A.V.; Hopke, P.K.; Paatero, P.; Malm, W.C.; Sisler, J.F. Atmospheric aerosol over Alaska 2. Elemental composition and sources. J. Geophys. Res. Atmos. 1998, 103, 19045–19057. [Google Scholar] [CrossRef]
  41. Reff, A.; Eberly, S.I.; Bhave, P.V. Receptor modeling of ambient particulate matter data using positive matrix factorization: Review of existing methods. J. Air Waste Manag. Assoc. 2007, 57, 146–154. [Google Scholar] [CrossRef] [Green Version]
  42. Brown, S.G.; Eberly, S.; Paatero, P.; Norris, G.A. Methods for estimating uncertainty in PMF solutions: Examples with ambient air and water quality data and guidance on reporting PMF results. Sci. Total Environ. 2015, 518–519, 626–635. [Google Scholar] [CrossRef] [Green Version]
  43. Huang, X.F.; Yu, J.Z.; Yuan, Z.; Lau, A.K.H.; Louie, P.K.K. Source analysis of high particulate matter days in Hong Kong. Atmos. Environ. 2009, 43, 1196–1203. [Google Scholar] [CrossRef]
  44. Louie, P.K.K.; Watson, J.G.; Chow, J.C.; Chen, A.; Sin, D.W.M.; Lau, A.K.H. Seasonal characteristics and regional transport of PM2.5 in Hong Kong. Atmos. Environ. 2005, 39, 1695–1710. [Google Scholar] [CrossRef]
  45. Li, Y.C.; Yu, J.Z.; Ho, S.S.H.; Schauer, J.J.; Yuan, Z.; Lau, A.K.H.; Louie, P.K.K. Chemical characteristics and source apportionment of fine particulate organic carbon in Hong Kong during high particulate matter episodes in winter 2003. Atmos. Res. 2013, 120–121, 88–98. [Google Scholar] [CrossRef]
Figure 1. Flowchart of sample pretreatment steps of the original method.
Atmosphere 11 01120 g001
Figure 2. Flowchart of sample pretreatment steps of the revised method.
Atmosphere 11 01120 g002
Figure 3. Contrast of concentrations of (a) palmitic acid and (b) stearic acid as measured by the original method and shown as relative frequency distribution histograms for field blanks (n = 39, marked in green color), ambient samples from Hong Kong (n = 87, marked in cantaloupe brown color) and the Pearl River Delta region (n = 175, marked in sky blue color). Insert plots are zoomed-in images of the histograms of field blanks and the Hong Kong (HK) samples. The solid lines denote the normal distributions of the corresponding data.
Atmosphere 11 01120 g003
Figure 4. Contamination levels for palmitic acid and stearic acid in ng/aliquot sample (20 cm2), with error bars in ±SD obtained from three repeat experiments. The abbreviations for different combinations of plastic/glass labware used in investigation are (1) PSF representing pipette, syringe and filter cassette (all plastic) used in the original method; (2) CSF representing a glass measuring cylinder, plastic syringe, and plastic filter cassette combination; (3) CGF representing a glass measuring cylinder and a glass syringe and plastic filter cassette combination; (4) WCGF: wash the CGF filtration set with 2 mL methanol 3 times; (5) XM: CGF combination but without aerosol filter matrix; and (6) NEW: revised method in which a glass measuring cylinder, a glass syringe and a stainless-steel syringe holder were used.
Atmosphere 11 01120 g004
Figure 5. Contrast of concentrations of (a) palmitic acid and (b) stearic acid as measured by the revised new method and shown as relative frequency distribution histograms for method blanks (n = 21, marked in green color) and the ambient samples. The ambient samples (the Pearl River Delta (PRD) samples in sky blue color and the HK samples in cantaloupe brown color) are the same as those displayed in Figure 3. Insert plots are zoomed-in images of the histograms of field blanks and the HK samples. The solid lines denote the normal distributions of the corresponding data.
Atmosphere 11 01120 g005
Figure 6. (a) Abundance of fatty acids and cholesterol in ng/m3 at Yuen Long (YL) and Mong Kok (MK) sites. (b) YL site: diurnal variations of fatty acids and cholesterol as seen through the time-segments of P1 to P4, namely 06:00–11:00 (P1), 11:00–16:00 (P2), 16:00–21:00 (P3) and 21:00–06:00 (P4). (c) MK site: diurnal variations of the same set of organic tracers as seen through the time-segments of P1 to P3 (no sampling during P4 at this site). The lower bound of the box denote the 25th percentile and the upper bound denote the 75th percentile. The solid lines represent the medians and the white dots with black edge represent the averages.
Atmosphere 11 01120 g006
Figure 7. Ratio–ratio plots of C18:1/C18:0 against C16:0/C18:0 color coded or marked by different settings. Ambient samples (AM) are marked in grey, cooking source data in pink, and non-cooking source data in blue. VE means vehicular emissions. Cigarette, hardwood and softwood mean the combustion emissions using them as fuel.
Atmosphere 11 01120 g007
Figure 8. Constrained factor profiles of 9-factor solutions applying data from YL winter and MK ambient particulate matter (PM2.5) filter samples (PMFCholC16C18). Varying error fraction (EF) was applied to cholesterol where a = 0.1.
Atmosphere 11 01120 g008
Figure 9. Modelled contributions from PMFCholC16C18. (a) Modelled organic carbon (OC) contribution in mass concentration. (b) Modelled OC contribution (%). (c) Modelled PM2.5 contribution in mass concentration. (d) Modelled PM2.5 contribution (%).
Atmosphere 11 01120 g009
Figure 10. Cooking emissions contribution to OC (µg/m3). (a) Total contribution and diurnal variation of contribution at YL site in winter. (b) Total contribution and diurnal variation of contribution at MK site.
Atmosphere 11 01120 g010
Figure 11. (a) Boxplot of modeled OC contribution differences (PMFwo–PMFCholC16C18) (µg/m3) for individual factors. (b) Modeled OC contributions (µg/m3) from PMFwo and PMFCholC16C18.
Atmosphere 11 01120 g011
Table 1. Limit of detection (LOD, ppm ± SD ppm) of target analytes by the original and the revised method and recovery (% ± SD%) by the revised method.
CompoundsOldNew
LODLODRecovery
Keto/hydroxy carboxylic acids
Glyceric acid0.51 ± 0.170.83 ± 0.2493.4 ± 21.9
Pinonic acid0.96 ± 0.210.90 ± 0.3287.7 ± 6.7
Dicarboxylic acids
Succinic acid1.22 ± 0.291.29 ± 0.50133.8 ± 26.9
Glutaric acid0.54 ± 0.251.12 ± 0.7073.9 ± 7.2
Adipic acid0.59 ± 0.340.74 ± 0.1690.1 ± 15.6
Pimelic acid0.78 ± 0.200.66 ± 0.1196.1 ± 13.1
Suberic acid0.48 ± 0.160.78 ± 0.2097.2 ± 13.3
Azelaic acid0.51 ± 0.231.01 ± 0.18101.8 ± 11.5
Phthalic acid0.68 ± 0.200.74 ± 0.19102.4 ± 14.3
Isophthalic acid0.43 ± 0.160.74 ± 0.15110.0 ± 14.9
Terephthalic acid1.02 ± 0.321.26 ± 0.33112.9 ± 17.6
Hydroxycarboxylic acids
Malic acid0.56 ± 0.161.15 ± 0.6061.6 ± 14.7
Tartaric acid0.75 ± 0.182.04 ± 0.5034.5 ± 18.2
Citramalic acid0.53 ± 0.151.31 ± 0.2780.1 ± 11.9
Citric acid1.04 ± 0.572.76 ± 0.6023.5 ± 10.9
Fatty acids
Palmitic acid1.36 ± 0.700.88 ± 0.4586.2 ± 41.2 1
Stearic acid2.42 ± 1.621.06 ± 0.17115.9 ± 45.1 1
Sterol
Cholesterol0.61 ± 0.500.98 ± 0.31109.5 ± 7.6
Hydroxybenzoic acids
3-hydroxybenzoic acid0.49 ± 0.280.70 ± 0.23118.5 ± 19.7
4-hydroxybenzoic acid0.43 ± 0.250.60 ± 0.15110.5 ± 30.3
Vanillic acid0.53 ± 0.030.58 ± 0.17114.0 ± 18.6
Syringic acid0.44 ± 0.170.82 ± 0.3294.7 ± 14.2
Benzene tricarboxylic acids
1,2,4-benzenetricarboxylic acid0.76 ± 0.341.18 ± 0.4180.8 ± 19.2
1,3,5-benzenetricarboxylic acid0.60 ± 0.260.64 ± 0.2697.5 ± 9.8
Saccharides
Galactosan0.55 ± 0.480.75 ± 0.25113.9 ± 31.0
Mannosan0.47 ± 0.150.62 ± 0.14106.3 ± 18.5
Levoglucosan0.45 ± 0.190.66 ± 0.15111.9 ± 19.3
Xylitol0.42 ± 0.140.99 ± 0.83117.8 ± 18.6
Arabitol0.40 ± 0.120.86 ± 0.57120.0 ± 20.2
Mannitol0.46 ± 0.280.75 ± 0.25110.5 ± 14.4
Sorbitol0.41 ± 0.240.72 ± 0.18111.8 ± 16.3
Glycerol0.50 ± 0.380.89 ± 0.16119.9 ± 25.9
Erythritol0.53 ± 0.111.13 ± 0.47120.6 ± 24.1
Fructose0.44 ± 0.151.02 ± 0.41132.4 ± 28.0
Xylose0.37 ± 0.271.0 ± 0.4108.6 ± 12.7
Mannose0.62 ± 0.121.43 ± 0.30115.5 ± 11.9
Glucose1.19 ± 0.651.88 ± 0.51104.9 ± 6.9
Maltose0.81 ± 0.591.23 ± 0.2494.5 ± 4.9
Sucrose0.56 ± 0.180.43 ± 0.32108.6 ± 2.2
Trehalose0.36 ± 0.110.47 ± 0.12115.3 ± 5.6
1 The recoveries for palmitic acid (C16:0) and stearic acid (C18:0) were calculated after subtracting blanks (n = 3).
Publisher’s Note: MDPI stays neutral with regard to jurisdictional claims in published maps and institutional affiliations.

