Bioactive Compounds and Antioxidant Capacity of Moringa Leaves Grown in Spain Versus 28 Leaves Commonly Consumed in Pre-Packaged Salads

 ,
,  , and
, and
Abstract
: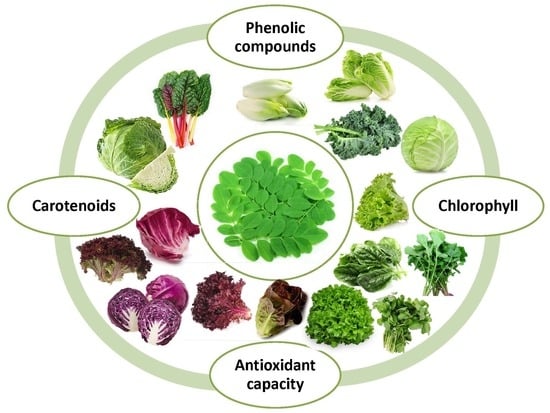
1. Introduction
2. Materials and Methods
2.1. Chemical
2.2. Vegetable Samples
2.3. Sample Preparation
2.4. Antioxidant Assays
2.5. Total Phenolic Content (TPC)
2.6. Total Carotenoid Content
2.7. Total Flavonoid Content (TFC)
2.8. Chlorophyll Pigments (a and b)
2.9. Statistical Analysis
3. Results
3.1. Total Antioxidant Capacity (TAC) in Methanol Extract (ME)
3.1.1. TEAC
3.1.2. DPPH
3.1.3. FRAP
3.1.4. ORAC
3.2. Total Phenolic Content (TPC) in Methanol Extract (ME)
3.3. Total Antioxidant Capacity (TAC) in Hydrophilic (HE) and Lipophilic Extracts (LE)
3.4. Total Phenolic Content (TPC) in Hydrophilic (HE) and Lipophilic Extracts (LE)
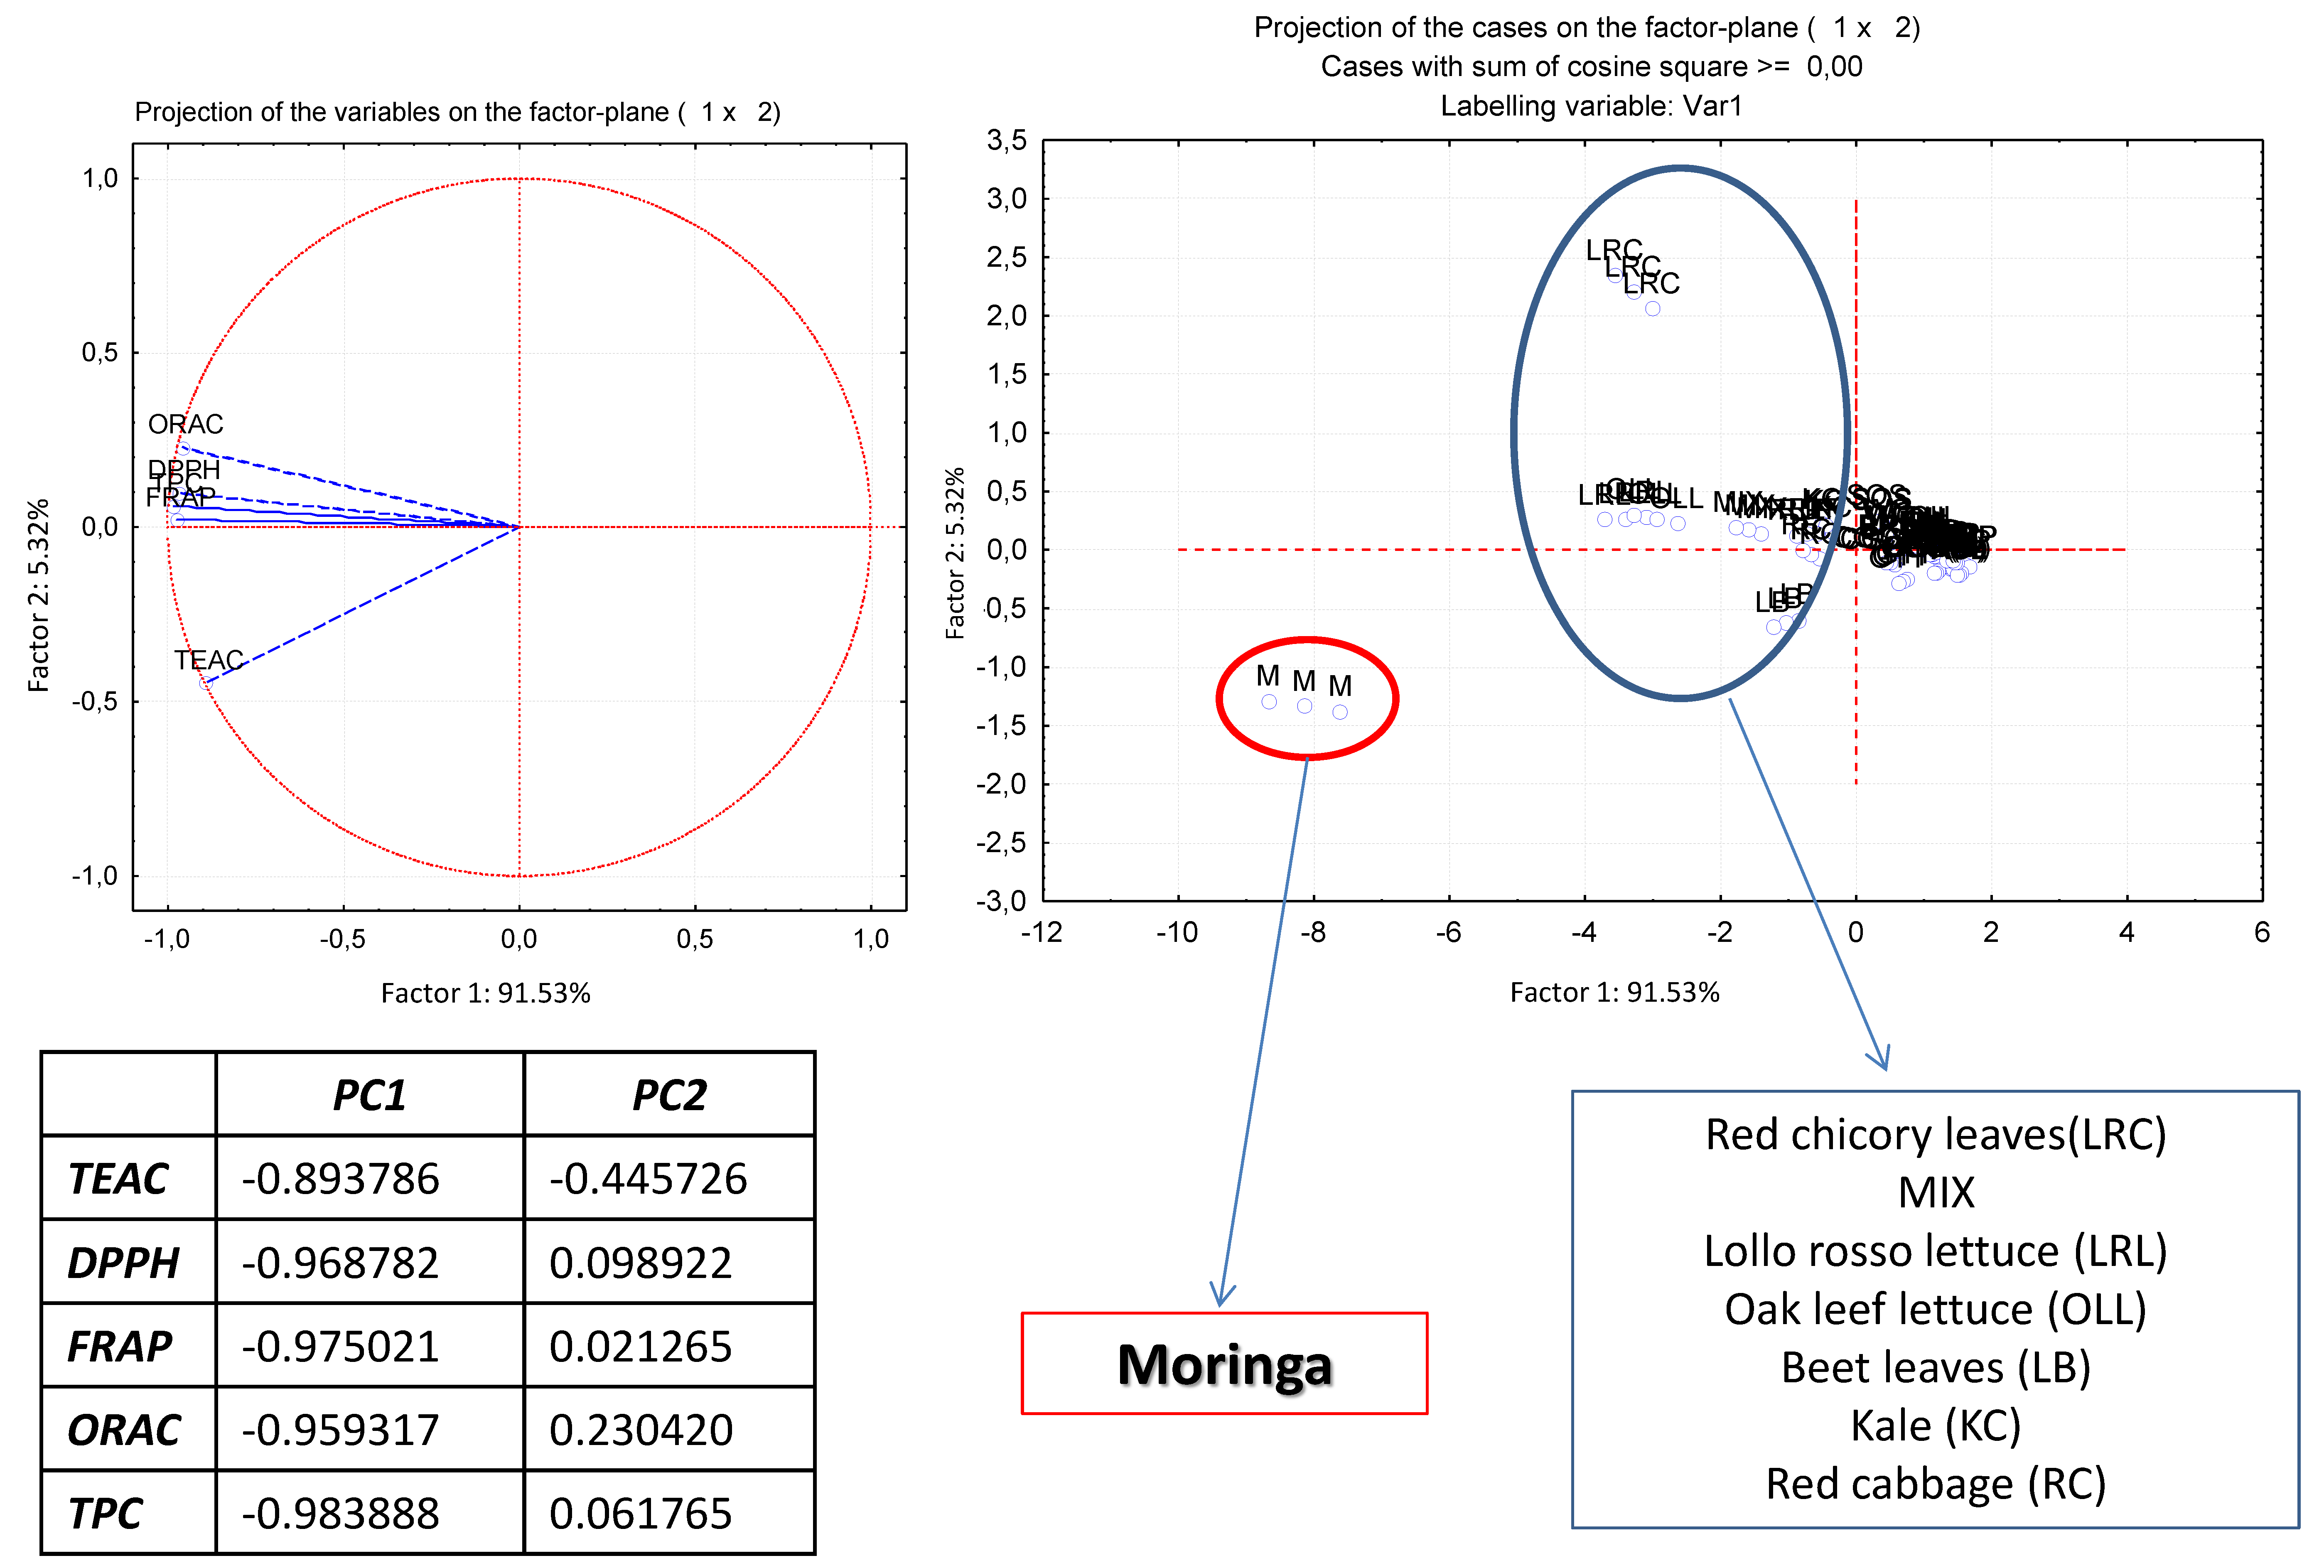
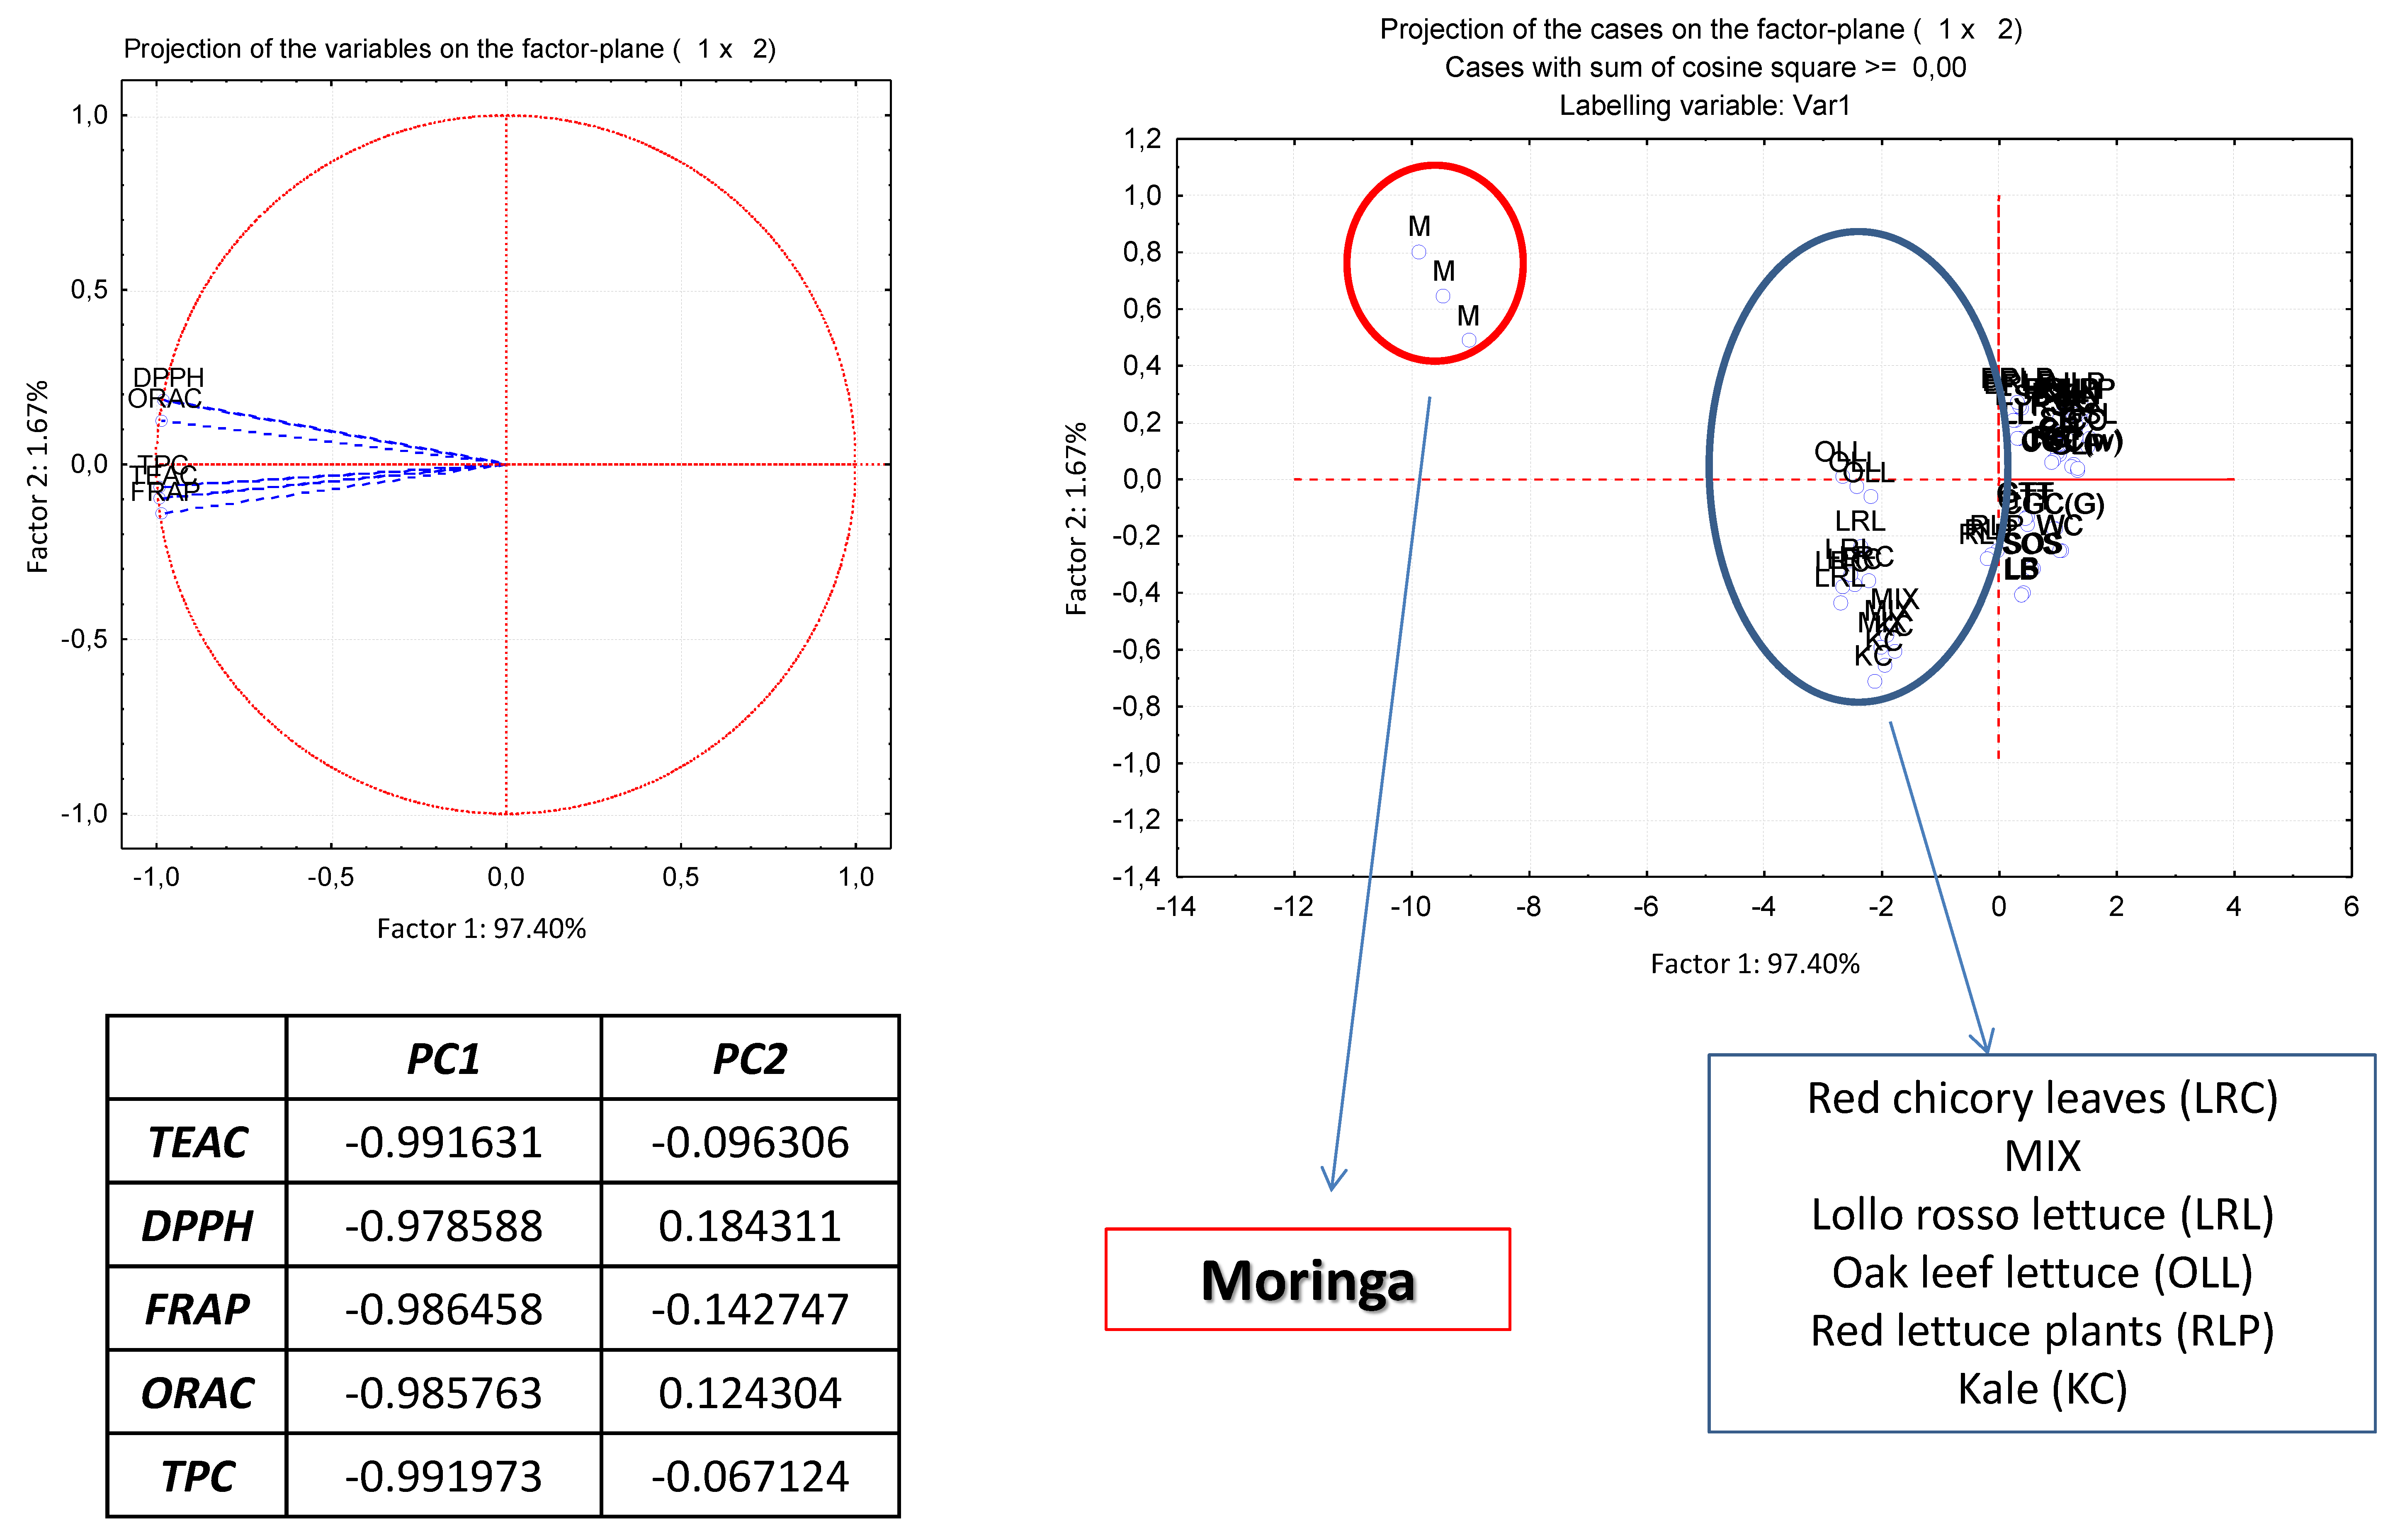
3.5. Correlations between the Methods and Principal Component Analysis
3.6. Carotenoid, Flavonoid and Chlorophyll Contents
3.6.1. Carotenoids
3.6.2. Flavonoids
3.6.3. Chlorophylls
4. Discussion
4.1. Total Antioxidant Capacity (TAC) and Total Phenolic Content (TPC)
4.2. Carotenoids, Flavonoids and Chlorophylls
4.2.1. Carotenoids
4.2.2. Flavonoids
4.2.3. Chlorophylls
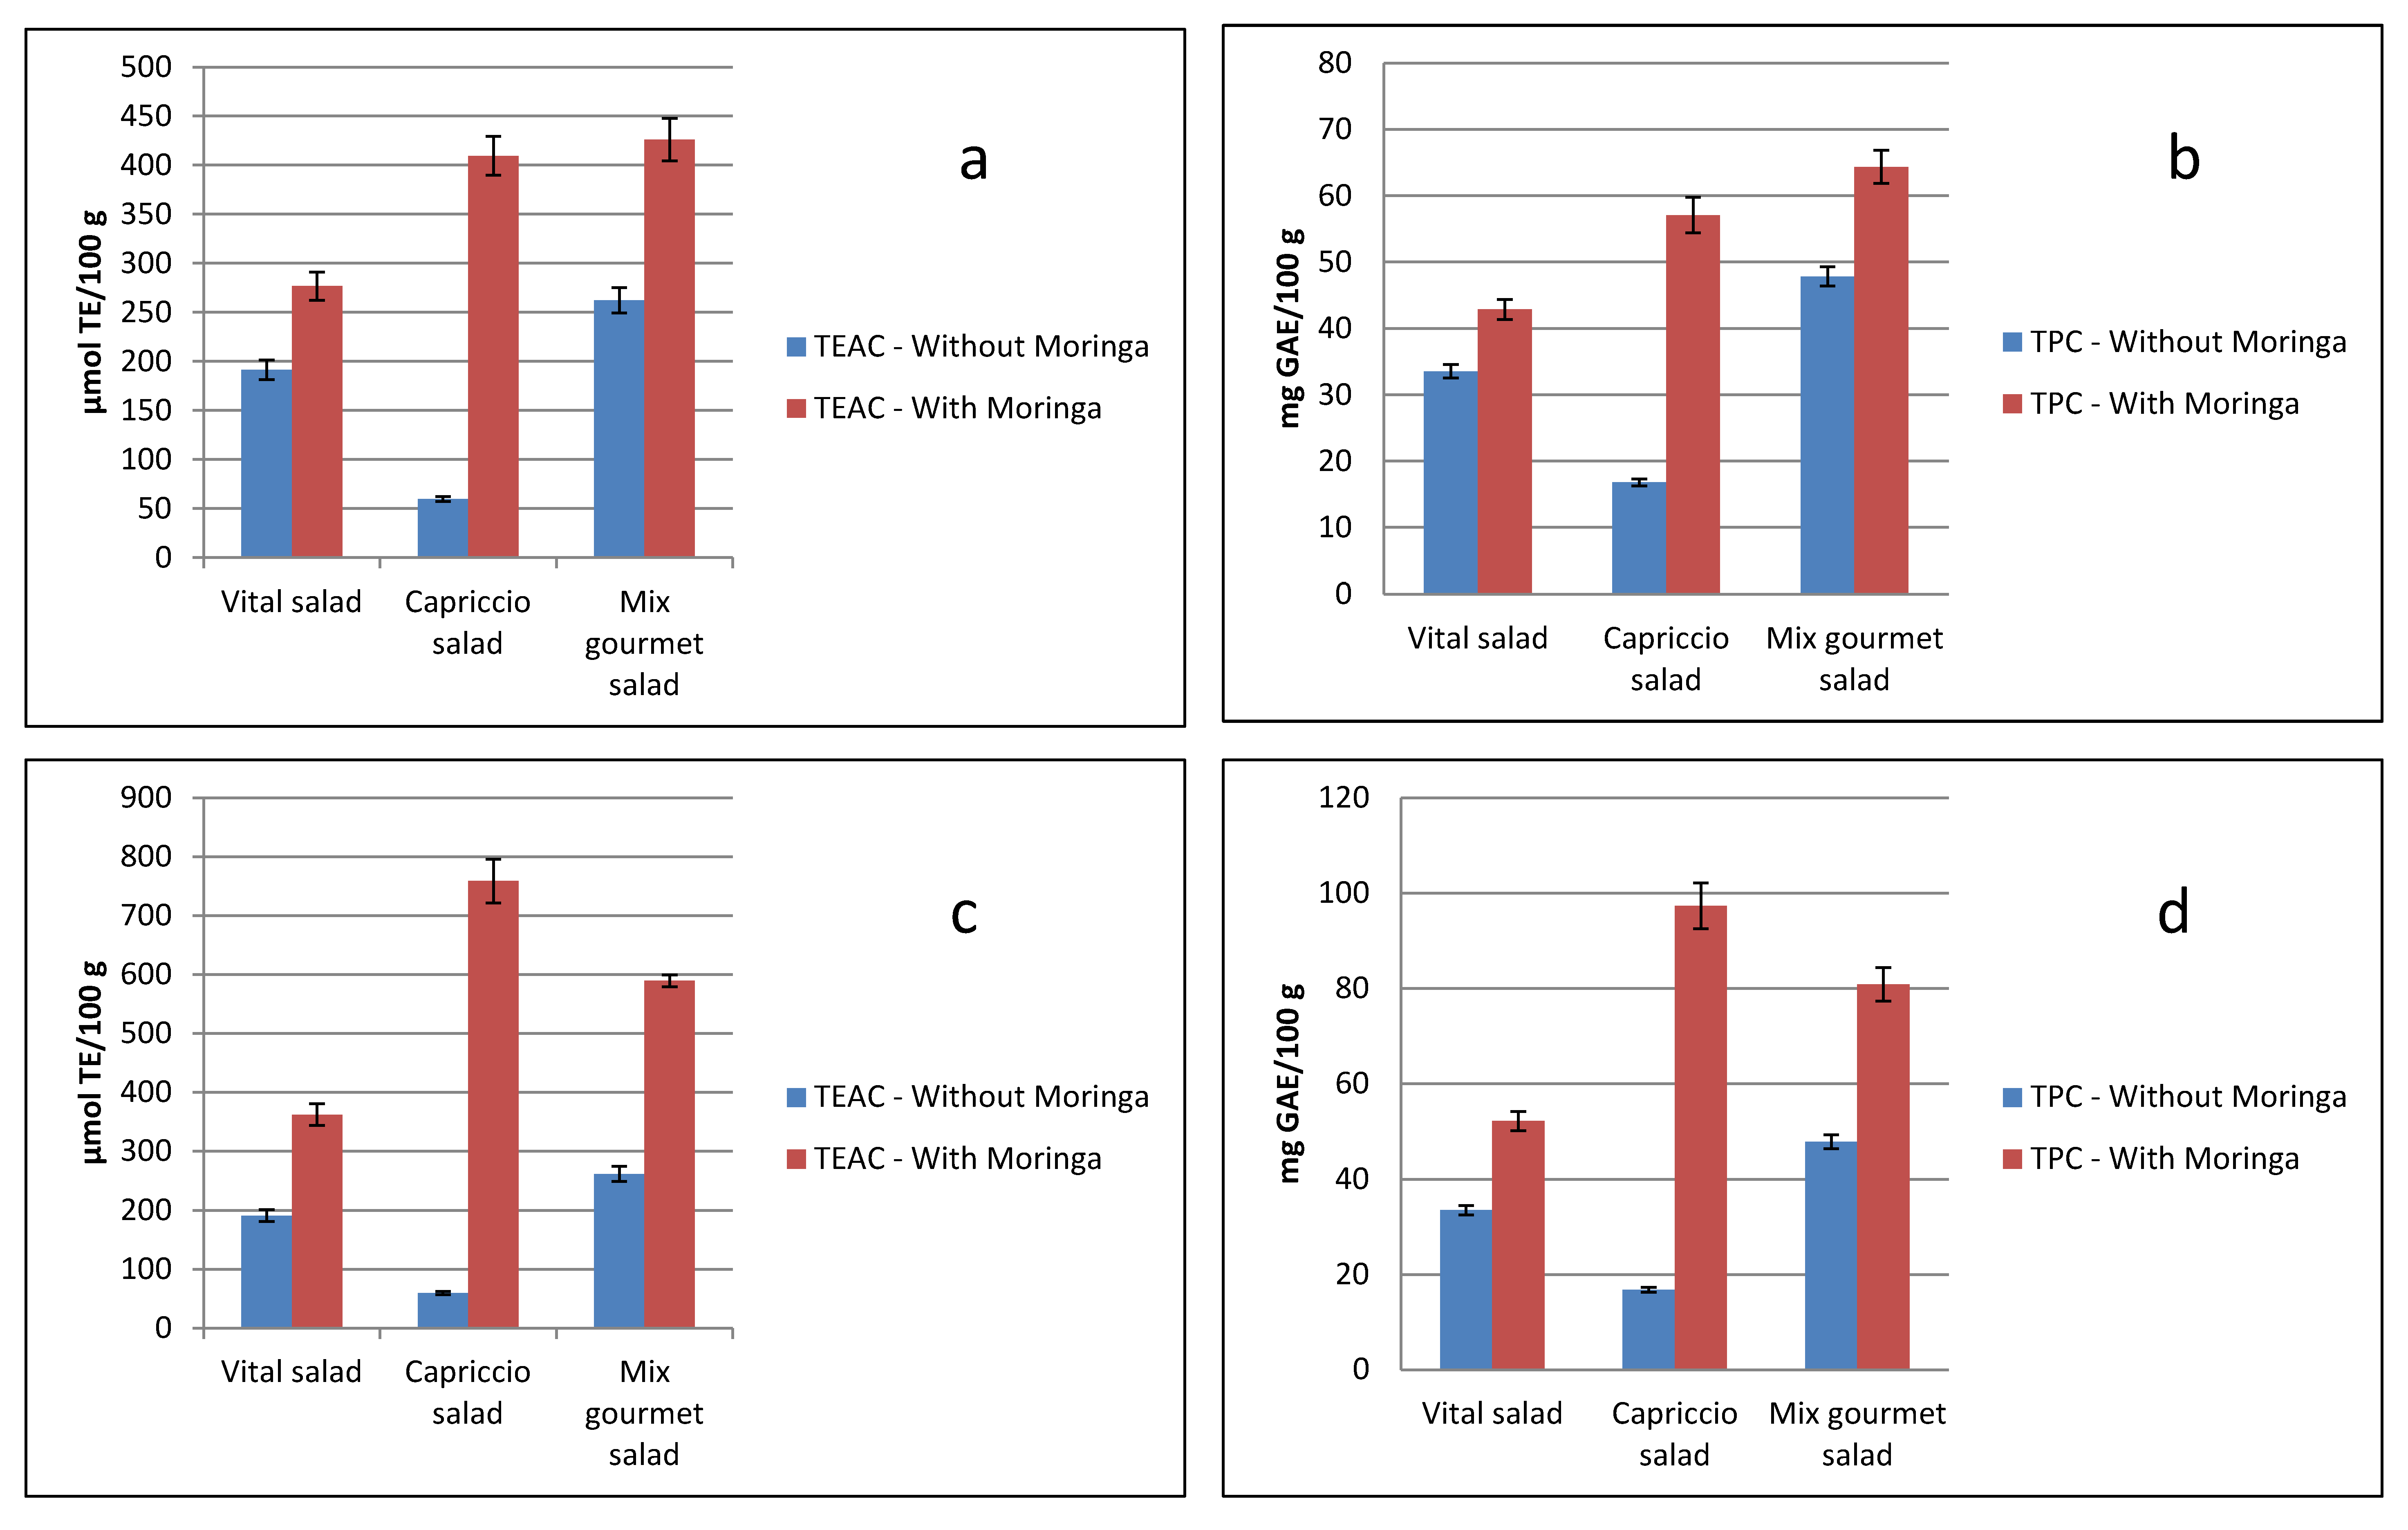
4.3. TAC and TPC Values for Fourth-Range Vegetable Packs, with or without, Moringa Leaves
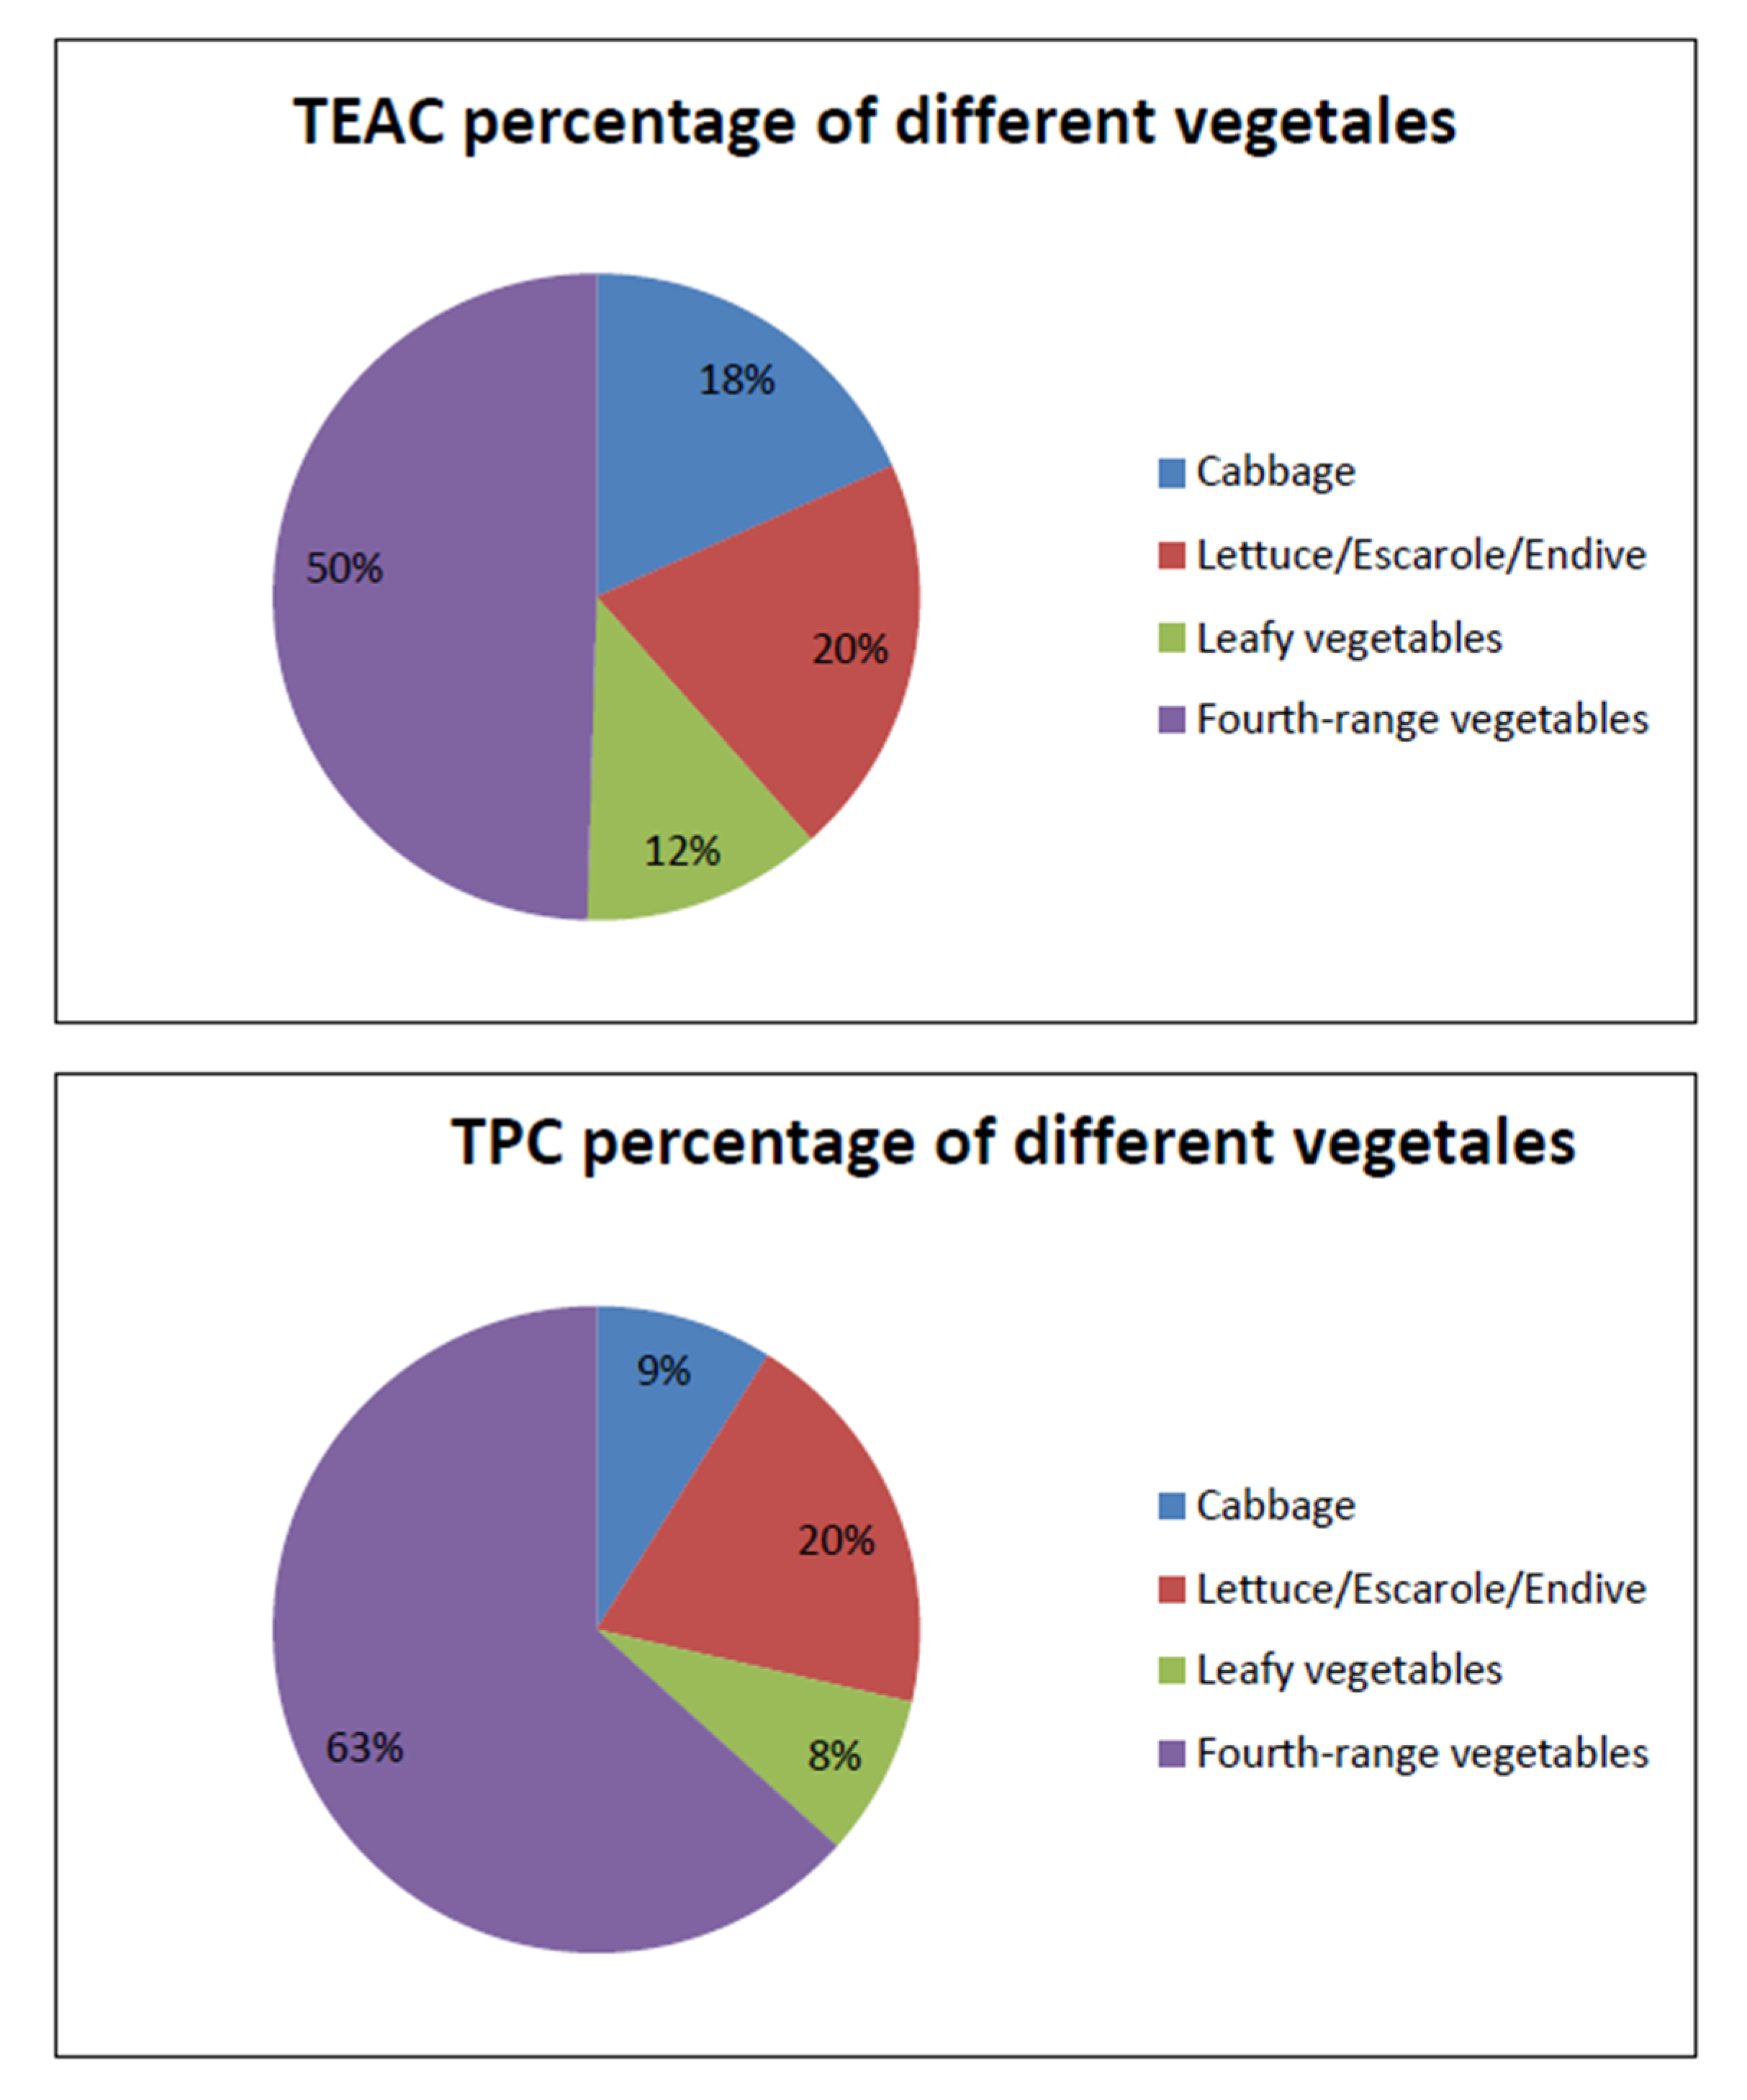
4.4. Antioxidant Capacity Provided by the Consumption of Vegetables, in the Spanish Diet
5. Conclusions
Author Contributions
Funding
Acknowledgments
Conflicts of Interest
References
- Agbogidi, O.M.; Ilondu, E.M. Moringa oleifera lam: Its potentials as a food security and rural medicinal item. J. Bio Innov. 2012, 1, 156–167. [Google Scholar]
- Rocchetti, G.; Blasi, F.; Montesano, D.; Ghisoni, S.; Marcotullio, M.C.; Sabatini, S.; Cossignani, L.; Lucini, L. Impact of conventional/non-conventional extraction methods on the untargeted phenolic profile of Moringa oleifera leaves. Food Res. Int. 2019, 115, 319–327. [Google Scholar] [CrossRef]
- Siddhuraju, P.; Becker, K. Antioxidant Properties of Various Solvent Extracts of Total Phenolic Constituents from Three Different Agroclimatic Origins of Drumstick Tree (Moringa oleifera Lam.) Leaves. J. Agric. Food Chem. 2003, 51, 2144–2155. [Google Scholar] [CrossRef]
- Iqbal, S.; Bhanger, M.I. Effect of season and production location on antioxidant activity of Moringa oleifera leaves grown in Pakistan. J. Food Compos. Anal. 2006, 19, 544–551. [Google Scholar] [CrossRef]
- Pakade, V.; Cukrowska, E.; Chimuka, L. Comparison of antioxidant activity of Moringa oleifera and selected vegetables in South Africa. S. Afr. J. Sci. 2013, 109, 1–5. [Google Scholar] [CrossRef]
- Yang, R.Y.; Chang, L.; Hsu, C.; Weng, B.; Palada, M.; Chadha, M.; Levasseur, V. Nutritional and functional properties of Moringa Leaves from germplasm, to plant, to food, to health Moringa and other highly nutritious plant resources: Strategies, standards and markets for a better impact on nutrition in Africa. In Moringa Leaves: Strategies, Standards and Markets for a Better Impact on Nutrition in Africa; Moringa news; American Chemical Society: Washington, DC, USA, 2006; pp. 1–9. [Google Scholar]
- Ames, B.N.; Shigenga, M.K.; Hagen, T.M. Oxidants, antioxidants and degenerative diseases of aging. Proc. Natl. Acad. Sci. USA 1993, 90, 7915–7922. [Google Scholar] [CrossRef] [Green Version]
- Park, E.J.; Pezzuto, J.M. Autoxidation and antioxidants. In Encyclopedia of Pharmaceuticals Technology, 2nd ed.; Swarbrick, J., Boylan, J.C., Eds.; Marcel Dekker Inc.: New York, NY, USA, 2002; Volume 1, pp. 97–113. [Google Scholar]
- Soong, Y.Y.; Barlow, P.J. Antioxidant activity and phenolic content of selected fruit seeds. Food Chem. 2004, 88, 411–417. [Google Scholar] [CrossRef]
- Pellegrini, N.; Serafini, M.; Colombi, B.; Del Rio, D.; Salvatore, S.; Bianchi, M.; Brighenti, F. Total Antioxidant Capacity of Plant Foods, Beverages and Oils Consumed in Italy Assessed by Three Different In Vitro Assays. J. Nutr. 2003, 133, 2812–2819. [Google Scholar] [CrossRef] [PubMed] [Green Version]
- Gökmen, V.; Serpena, A.; Fogliano, V. Direct measurement of the total antioxidant capacity of foods: The ‘QUENCHER’ approach. Trends Food Sci. Technol. 2009, 20, 278–288. [Google Scholar] [CrossRef]
- Morales-Soto, A.; García-Salas, P.; Rodríguez-Pérez, C.; Jiménez-Sánchez, C.; Cádiz-Gurrea, M.L.; Segura-Carretero, A.; Fernández-Gutiérrez, A. Antioxidant capacity of 44 cultivars of fruits and vegetables grown in Andalusia (Spain). Food Res. Int. 2014, 58, 35–46. [Google Scholar] [CrossRef]
- Association of Official Analytical Chemists (A.O.A.C.) (Ed.) Official Methods of Analysis of the AOAC, 15th ed.; Method 934.06; EEUU: Arlington, VA, USA, 1990. [Google Scholar]
- Prior, R.L.; Hoang, H.; Gu, L.; Wu, X.; Bacchiocca, M.; Howard, L.; Jacob, R. Assays for hydrophilic and lipophilic antioxidant capacity (oxygen radical absorbance capacity (ORACFL)) of plasma and other biological and food samples. J Agric. Food Chem. 2003, 51, 3273–3279. [Google Scholar] [CrossRef] [PubMed]
- Re, R.; Pellegrini, N.; Proteggente, A.; Pannala, A.; Yang, M.; Rice-Evans, C. Antioxidant activity applying an improved ABTS radical catión decolorization assay. Free Radic. Biol. Med. 1999, 26, 1231–1237. [Google Scholar] [CrossRef]
- Sharma, O.P.; Bhat, T.K. DPPH antioxidant assay revisited. Food Chem. 2009, 113, 1202–1205. [Google Scholar] [CrossRef]
- Benzie, I.F.F.; Strain, J. The Ferric Reducing Ability of Plasma (FRAP) as a Measure of “Antioxidant Power”: The FRAP Assay. Anal. Biochem. 1996, 239, 70–76. [Google Scholar] [CrossRef] [Green Version]
- Ou, B.; Hampsch-woodill, M.; Prior, R.L. Development and Validation of an Improved Oxygen Radical Absorbance Capacity Assay Using Fluorescein as the Fluorescent Probe. J. Agric. Food Chem. 2001, 49, 4619–4626. [Google Scholar] [CrossRef]
- Singleton, V.L.; Orthofer, R.; Lamuela-Raventos, R.M. Analysis of total phenols and other oxidation substrates and antioxidants by means of folin-ciocalteu reagent. Methods Enzymol. 1999, 299, 152–178. [Google Scholar]
- Lichtenthaler, H.K.; Wellburn, A.R. Determinations of total carotenoids and chlorophylls a and b of leaf extracts in different solvents. Biochem. Soc. Trans. 1983, 11, 591–592. [Google Scholar] [CrossRef] [Green Version]
- Tabart, J.; Kevers, C.; Pincemail, J.; Defraigne, J.; Dommes, J. Comparative antioxidant capacities of phenolic compounds measured by various tests. Food Chem. 2009, 113, 1226–1233. [Google Scholar] [CrossRef]
- Wang, X.; Li, C.; Liang, D.; Zou, Y.; Li, P.; Ma, F. Phenolic compounds and antioxidant activity in red-fleshed apples. J. Funct. Foods 2015, 18, 1086–1094. [Google Scholar] [CrossRef]
- Carlsen, M.H.; Halvorsen, B.L.; Holte, K.; Bohn, S.K.; Dragland, S.; Sampson, L.; Sanada, C. The total antioxidant content of more than 3100 foods, beverages, spices, herbs and supplements used worldwide. Nutr. J. 2010, 9, 1–11. [Google Scholar] [CrossRef] [PubMed]
- USDA (United States Department of Agriculture) Agricultural Research Service. Food Composition Databases. 2017. Available online: https://ndb.nal.usda.gov/ndb/ (accessed on 15 November 2019).
- Deng, G.F.; Lin, X.; Xu, X.R.; Gao, L.L.; Xie, J.F.; Li, H.B. Antioxidant capacities and total phenolic contents of 56 vegetables. J. Funct. Foods 2013, 5, 260–266. [Google Scholar] [CrossRef]
- Rodríguez-Pérez, C.; Quirantes-Piné, R.; Fernández-Gutiérrez, A. Optimization of extraction method to obtain a phenolic compounds-rich extract from Moringa oleifera Lam leaves. Ind. Crop. Prod. 2015, 66, 246–254. [Google Scholar] [CrossRef]
- Rodríguez-Pérez, C.; Gilbert, B.; Mendiola, J.; Quirantes-Piné, R.; Segura-Carretero, A.; Ibañez, E. Optimization of microwave-assisted extraction and pressurized liquid extraction of phenolic compounds from Moringa oleifera leaves by multi-response surface methodology. Electrophoresis 2016, 37, 1938–1946. [Google Scholar] [CrossRef] [PubMed]
- Saini, R.K.; Shetty, N.P.; Prakash, M.; Giridhar, P. Effect of dehydration methods on retention of carotenoids, tocopherols, ascorbic acid and antioxidant activity in Moringa oleifera leaves and preparation of a RTE product. J. Food Sci. Technol. 2014, 51, 2176–2182. [Google Scholar] [CrossRef] [Green Version]
- Palma, I.; Farran, P.; Cervera, P. Tablas de Composición de Alimentos Por Medidas Caseras de Consumo Habitual en España: CESNID, 4th ed.; McGraw Hill: Madrid, Spain, 2008. [Google Scholar]
- Mataix Verdú, J.; García Diaz, L.; Mañas Almendros, M.; Martínez de Vitoria, E.; Llopis González, J. Tablas de Composición de Alimentos, 5th ed.; Universidad de Granada: Granada, Spain, 2009. [Google Scholar]
- Castro-López, C.; Ventura-Sobrevilla, J.M.; González-Hernández, M.D.; Rojas, R.; Ascacio-Valdés, J.A.; Aguilar, C.N.; Martínez-Ávila, G.C.G. Impact of extraction techniques on antioxidant capacities and phytochemical composition of polyphenol-rich extracts. Food Chem. 2017, 237, 1139–1148. [Google Scholar] [CrossRef]
- Nobossé, P.; Fombang, E.N.; Mbofung, C.M.F. Effects of age and extraction solvent on phytochemical content and antioxidant activity of fresh Moringa oleifera L. leaves. J. Food Sci. Nutr. 2018, 6, 2188–2198. [Google Scholar] [CrossRef]
- Oyeyinka, A.T.; Oyeyinka, S.A. Moringa oleifera as a food fortificant: Recent trends and prospects. J. Saudi Soc. Agric. Sci. 2018, 17, 127–136. [Google Scholar] [CrossRef] [Green Version]
- Bholah, K.; Ramful-Baboolall, D.; Neergheen-Bhujun, V.S. Antioxidant activity of polyphenolic rich Moringa oleifera Lam. Extracts in food systems. J. Food Biochem. 2015, 39, 733–741. [Google Scholar] [CrossRef]
- Saucedo-Pompa, S.; Torres-Castillo, J.A.; Castro-López, C.; Rojas, R.; Sánchez-Alejo, E.J.; Ngangyo-Heya, M.; Martínez-Ávila, G.C.G. Moringa plants: Bioactive compounds and promising applications in food products. Food Res. Int. 2018, 111, 438–450. [Google Scholar] [CrossRef]
- Devisetti, R.; Sreerama, Y.N.; Bhattacharya, S. Processing effects on bioactive components and functional properties of moringa leaves: Development of a snack and quality evaluation. J. Food Sci. Technol. 2016, 53, 649–657. [Google Scholar] [CrossRef] [Green Version]
- MAPA. Ministerio de Pesca, Agricultura y Alimentación. 2018. Available online: https://www.mapa.gob.es/es/alimentacion/temas/consumo-y-comercializacion-y-distribucion-alimentaria/panel-de-consumo-alimentario/series-anuales/default.aspx./ (accessed on 10 October 2019).


| Vegetables | Scientific Name | Moisture (%) | TEAC μmol TE/100 g FW | DPPH μmol TE/100 g FW | FRAP μmol TE/100 g FW | ORAC μmol TE/100 g FW | TPC mg GAE/100 g FW | Tabart Index | |||||
|---|---|---|---|---|---|---|---|---|---|---|---|---|---|
| Values | Rank * | Values | Rank * | Values | Rank * | Values | Rank * | Values | Rank * | ||||
| Batavia green lettuce plants | Lactuca sativa | 94.4 | 200 ± 7 | 22 | 252 ± 7 | 12 | 101 ± 4 | 21 | 712 ± 23 | 23 | 36.8 ± 1.8 | 20 | 0.0102 |
| Batavia red lettuce plants | Lactuca sativa | 95.4 | 513 ± 1 | 11 | 536 ± 10 | 8 | 159 ± 0 | 18 | 1786 ± 15 | 15 | 70.2 ± 2.7 | 13 | 0.0228 |
| Beet leaves | Beta vulgaris L. | 89.8 | 1991 ± 146 | 4 | 529 ± 39 | 9 | 808 ± 40 | 9 | 3550 ± 311 | 8 | 201.3 ± 9.6 | 5 | 0.0528 |
| Chard | Beta vulgaris L. | 93.1 | 268 ± 6 | 15 | 104 ± 2 | 22 | 260 ± 21 | 16 | 2072 ± 97 | 13 | 44.5 ± 2.4 | 18 | 0.0145 |
| Chinese cabbage | Brassica rapa | 94.7 | 214 ± 11 | 18 | 62.1 ± 2.4 | 25 | 152 ± 12 | 19 | 729 ± 57 | 22 | 19.4 ± 1.5 | 25 | 0.0076 |
| Curly green cabbage (green leaves) | Brassica oleracea | 86.4 | 604 ± 34 | 10 | 235 ± 15 | 13 | 591 ± 13 | 11 | 1934 ± 142 | 14 | 75.8 ± 2.7 | 10 | 0.0242 |
| Curly green cabbage (white leaves) | Brassica oleracea | 90.1 | 342 ± 22 | 14 | 139 ± 10 | 21 | 247 ± 17 | 17 | 822 ± 48 | 20 | 34.4 ± 2.7 | 21 | 0.0119 |
| Endive | Cichorium intybus L. | 96.4 | 246 ± 12 | 16 | 234 ± 8 | 14 | 349 ± 19 | 13 | 1421 ± 52 | 16 | 49.0 ± 3.8 | 15 | 0.0156 |
| Escarole | Cichorium endivia | 94.9 | 111 ± 2 | 25 | 175 ± 6 | 17 | 79.2 ± 3.3 | 23 | 615 ± 16 | 24 | 23.6 ± 0.2 | 23 | 0.0072 |
| Green cabbage | Brassica oleracea | 93.4 | 70.4 ± 1.5 | 27 | 42.4 ± 2.1 | 29 | 42.8 ± 0.6 | 27 | 336 ± 12 | 28 | 13.1 ± 0.1 | 27 | 0.0031 |
| Green lettuce plants | Lactuca sativa | 95.7 | 205 ± 9 | 20 | 189 ± 15 | 16 | 266 ± 17 | 15 | 917 ± 18 | 19 | 48.4 ± 1.9 | 16 | 0.0118 |
| Green sprout lettuce | Lactuca sativa | 95.2 | 180 ± 11 | 23 | 81.3 ± 0.7 | 23 | 93.5 ± 6.0 | 22 | 541 ± 21 | 25 | 21.1 ± 1.5 | 24 | 0.0063 |
| Iceberg lettuce plants | Lactuca sativa | 97.0 | 43.8 ± 0.9 | 28 | 51.5 ± 1.7 | 26 | 22.9 ± 0.0 | 29 | 192 ± 7 | 29 | 8.40 ± 0.25 | 29 | 0.0023 |
| Kale | Brassica oleracea | 88.0 | 829 ± 12 | 7 | 308 ± 25 | 10 | 1206 ± 78 | 8 | 4448 ± 357 | 5 | 121 ± 10 | 7 | 0.0434 |
| Lamb’s lettuce | Valerianella locusta L. | 93.8 | 207 ± 12 | 19 | 294 ± 12 | 11 | 104 ± 4 | 20 | 1393 ± 22 | 17 | 54.5 ± 1.8 | 14 | 0.0132 |
| Lollo rosso lettuce | Lactuca sativa | 91.0 | 2253 ± 203 | 2 | 1393 ± 74 | 4 | 2060 ± 97 | 3 | 7848 ± 621 | 3 | 296 ± 8 | 3 | 0.0996 |
| Mix of rocket salad. watercress. lamb’s lettuce and lollo rosso lettuce | - | 92.2 | 1302 ± 64 | 5 | 1080 ± 87 | 5 | 1374 ± 76 | 7 | 4275 ± 251 | 6 | 206 ± 5 | 4 | 0.0638 |
| Moringa | Moringa oleifera | 72.2 | 6208 ± 206 | 1 | 3055 ± 140.0 | 1 | 3962 ± 297 | 1 | 10,805 ± 690 | 1 | 504 ± 28 | 1 | 0.2058 |
| Oak leaf lettuce | Lactuca sativa | 92.5 | 2080 ± 146 | 3 | 1400 ± 110 | 3 | 2133 ± 111 | 2 | 7671 ± 610 | 4 | 197 ± 11 | 6 | 0.0981 |
| Red cabbage | Brassica oleracea | 90.5 | 1081 ± 22 | 6 | 540 ± 39 | 7 | 1435 ± 105 | 6 | 3585 ± 237 | 7 | 105 ± 3 | 9 | 0.0503 |
| Red chicory leaves | Cichorium intybus | 89.7 | - | - | 2009 ± 75 | 2 | 1917 ± 130 | 4 | 9081 ± 633 | 2 | 319 ± 14 | 2 | 0.1162 |
| Red lettuce plants | Lactuca sativa | 94.8 | 812 ± 52 | 8 | 665 ± 53 | 6 | 1701 ± 129 | 5 | 3086 ± 30 | 10 | 114 ± 8 | 8 | 0.0511 |
| Red lettuce sprouts | Lactuca sativa | 95.0 | 201 ± 17 | 21 | 71.8 ± 5.5 | 24 | 73.6 ± 5.3 | 24 | 404 ± 32 | 27 | 11.4 ± 0.9 | 28 | 0.0057 |
| Rocket salad | Eruca vesicaria cav. | 93.7 | 215 ± 2 | 17 | 42.8 ± 1.4 | 28 | 54.2 ± 1.9 | 25 | 1058 ± 39 | 18 | 37.2 ± 1.1 | 19 | 0.0072 |
| Roman lettuce plants | Lactuca sativa | 95.1 | 97.6 ± 2.6 | 26 | 150 ± 1 | 20 | 49.3 ± 1.7 | 26 | 417 ± 12 | 26 | 19.0 ± 0.3 | 26 | 0.0057 |
| Spinach | Spinacia oleracea | 93.2 | 156 ± 1 | 24 | 45.9 ± 1.0 | 27 | 26.7 ± 1.1 | 28 | 810 ± 22 | 21 | 29.0 ± 0.9 | 22 | 0.0055 |
| Spinach sprouts | Spinacia oleracea | 89.9 | 405 ± 14 | 13 | 156 ± 12 | 18 | 685 ± 28 | 10 | 3280 ± 194 | 9 | 72.3 ± 4.0 | 11 | 0.0259 |
| Turnip greens (turnip tops) | Brassica napus | 93.6 | 791 ± 49 | 9 | 206 ± 10 | 15 | 308 ± 19 | 14 | 2174 ± 61 | 12 | 44.6 ± 2.8 | 17 | 0.0232 |
| Watercress | Nasturtium officinale | 90.7 | 467 ± 6 | 12 | 153 ± 11 | 19 | 583 ± 19 | 12 | 2830 ± 160 | 11 | 70.3 ± 1.6 | 12 | 0.0239 |
| Vegetables | TEAC μmol TE/100 g FW | DPPH μmol TE/100 g FW | FRAP μmol TE/100 g FW | ORAC μmol TE/100 g FW | TPC mg GAE/100 g FW | Tabart Index | |||||
|---|---|---|---|---|---|---|---|---|---|---|---|
| Values | Rank * | Values | Rank * | Values | Rank * | Values | Rank * | Values | Rank * | ||
| Batavia green lettuce plants | 41.1 ± 0.1 | 12 | 64.6 ± 1.3 | 11 | 66.7 ± 3.3 | 13 | 212 ± 10 | 18 | 11.4 ± 0.3 | 14 | 0.0133 |
| Batavia red lettuce plants | 143 ± 3 | 8 | 117 ± 4 | 8 | 176 ± 1 | 9 | 839 ± 18 | 7 | 20.4 ± 0.7 | 9 | 0.0353 |
| Beet leaves | 20.9 ± 0.2 | 20 | 28.6 ± 2.2 | 18 | 50.7 ± 4.0 | 18 | 149 ± 2 | 23 | 16.7 ± 0.6 | 11 | 0.0079 |
| Chard | 17.1 ± 0.2 | 21 | 20.9 ± 0.1 | 24 | 31.1 ± 1.9 | 23 | 416 ± 32 | 15 | 9.70 ± 0.50 | 20 | 0.0088 |
| Chinese cabbage | 4.20 ± 0.30 | 27 | 6.30 ± 0.36 | 28 | 22.5 ± 1.2 | 25 | 35.9 ± 0.6 | 28 | 2.50 ± 0.20 | 28 | 0.0024 |
| Curly green cabbage (green leaves) | 12.1 ± 0.2 | 25 | 15.2 ± 1.2 | 25 | 21.1 ± 1.7 | 26 | 40.0 ± 2.6 | 26 | 10.0 ± 0.3 | 19 | 0.0035 |
| Curly green cabbage (white leaves) | 24.3 ± 1.9 | 19 | 23.9 ± 1.4 | 20 | 49.6 ± 3.3 | 19 | 105 ± 6 | 24 | 10.8 ± 0.5 | 17 | 0.0071 |
| Endive | 15.9 ± 0.4 | 23 | 28.4 ± 2.0 | 19 | 31.8 ± 2.2 | 22 | 186 ± 4 | 20 | 6.40 ± 0.50 | 24 | 0.0069 |
| Escarole | 129 ± 4 | 9 | 141 ± 1 | 7 | 178 ± 1 | 8 | 581 ± 8 | 10 | 33.2 ± 0.1 | 7 | 0.0340 |
| Green cabbage | 27.0 ± 0.3 | 17 | 35.6 ± 1.0 | 17 | 62.0 ± 0.0 | 14 | 201 ± 7 | 19 | 6.27 ± 0.14 | 25 | 0.0099 |
| Green lettuce plants | 9.30 ± 0.61 | 26 | 11.8 ± 1.0 | 26 | 18.6 ± 0.4 | 27 | 42.4 ± 3.1 | 25 | 6.60 ± 0.37 | 23 | 0.0029 |
| Green sprout lettuce | 2.80 ± 0.19 | 28 | 6.40 ± 0.50 | 27 | 4.30 ± 0.30 | 29 | 12.7 ± 1.0 | 29 | 1.70 ± 0.09 | 29 | 0.0010 |
| Iceberg lettuce plants | 15.1 ± 0.3 | 24 | 22.9 ± 0.3 | 21 | 26.1 ± 0.3 | 24 | 162 ± 1 | 22 | 5.36 ± 0.14 | 26 | 0.0058 |
| Kale | 621 ± 48 | 5 | 155 ± 8 | 6 | 409 ± 23 | 4 | 2025 ± 83 | 4 | 62.7 ± 3.2 | 5 | 0.0864 |
| Lamb’s lettuce | 87.7 ± 0.1 | 10 | 92.9 ± 0.8 | 10 | 125 ± 3 | 10 | 593 ± 8 | 9 | 30.3 ± 0.0 | 8 | 0.0253 |
| Lollo rosso lettuce | 675 ± 55 | 3 | 251 ± 3 | 4 | 463 ± 26 | 3 | 2348 ± 37 | 2 | 85.5 ± 4.0 | 2 | 0.1033 |
| Mix of rocket salad. watercress. lamb’s lettuce and lollo rosso lettuce | 538 ± 7 | 6 | 224 ± 4 | 5 | 320 ± 17 | 6 | 1312 ± 38 | 6 | 60.3 ± 4.6 | 6 | 0.0753 |
| Moringa | 1426 ± 72 | 1 | 854 ± 68 | 1 | 635 ± 22 | 1 | 6683 ± 204 | 1 | 145 ± 6 | 1 | 0.2423 |
| Oak leaf lettuce | 625 ± 55 | 4 | 311 ± 20 | 2 | 341 ± 6 | 5 | 2277 ± 180 | 3 | 67.9 ± 5.6 | 4 | 0.0978 |
| Red cabbage | 80.4 ± 3.7 | 11 | 64.0 ± 1.3 | 12 | 124 ± 2 | 11 | 230 ± 18 | 16 | 11.1 ± 0.9 | 16 | 0.0186 |
| Red chicory leaves | 691 ± 49 | 2 | 307 ± 17 | 3 | 495 ± 10 | 2 | 1782 ± 91 | 5 | 82.5 ± 5.8 | 3 | 0.1042 |
| Red lettuce plants | 209 ± 17 | 7 | 102 ± 7 | 9 | 195 ± 16 | 7 | 641 ± 49 | 8 | 26.4 ± 1.6 | 9 | 0.0361 |
| Red lettuce sprouts | 37.8 ± 2.9 | 15 | 48.3 ± 0.7 | 13 | 54.5 ± 4.2 | 16 | 430 ± 32 | 13 | 10.6 ± 0.6 | 18 | 0.0135 |
| Rocket salad | 37.9 ± 0.3 | 14 | 40.7 ± 1.7 | 15 | 57.8 ± 0.2 | 15 | 454 ± 11 | 12 | 16.7 ± 0.7 | 12 | 0.0133 |
| Roman lettuce plants | 16.9 ± 0.3 | 22 | 35.7 ± 0.2 | 16 | 40.6 ± 1.1 | 21 | 182 ± 6 | 21 | 7.26 ± 0.08 | 22 | 0.0080 |
| Spinach | 39.3 ± 0.5 | 13 | 22.9 ± 0.3 | 22 | 44.0 ± 0.4 | 20 | 429 ± 13 | 14 | 16.4 ± 0.3 | 13 | 0.0109 |
| Spinach sprouts | 25.0 ± 0.7 | 18 | 22.6 ± 1.8 | 23 | 54.3 ± 4.2 | 17 | 229.5 ± 16.3 | 17 | 8.50 ± 0.65 | 21 | 0.0086 |
| Turnip greens (turnip tops) | 36.6 ± 0.8 | 16 | 44.7 ± 2.5 | 14 | 77.2 ± 4.9 | 12 | 544 ± 17 | 11 | 11.3 ± 0.9 | 15 | 0.0157 |
| Watercress | 2.60 ± 0.25 | 29 | 6.10 ± 0.42 | 29 | 15.6 ± 0.9 | 28 | 39.2 ± 2.7 | 27 | 3.10 ± 0.18 | 27 | 0.0020 |
| Vegetables | TEAC μmol TE/100 g FW | DPPH μmol TE/100 g FW | FRAP μmol TE/100 g FW | ORAC μmol TE/100 g FW | TPC mg GAE/100 g FW | Tabart Index | |||||
|---|---|---|---|---|---|---|---|---|---|---|---|
| Values | Rank * | Values | Rank * | Values | Rank * | Values | Rank * | Values | Rank * | ||
| Batavia green lettuce plants | 19.5 ± 0.2 | 22 | 10.5 ± 0.5 | 10 | 14.1 ± 0.6 | 23 | 11.4 ± 0.3 | 24 | 3.50 ± 0.02 | 20 | 0.0140 |
| Batavia red lettuce plants | 21.0 ± 0.7 | 20 | 7.60 ± 0.01 | 14 | 7.80 ± 0.14 | 26 | 9.50 ± 0.30 | 25 | 3.10 ± 0.03 | 21 | 0.0111 |
| Beet leaves | 154 ± 12 | 2 | 27.2 ± 0.5 | 2 | 180 ± 8 | 4 | 53.6 ± 3.4 | 6 | 27.9 ± 1.2 | 2 | 0.0712 |
| Chard | 59.6 ± 3.8 | 11 | 8.30 ± 0.60 | 12 | 62.8 ± 1.9 | 12 | 37.3 ± 2.5 | 9 | 8.50 ± 0.65 | 13 | 0.0293 |
| Chinese cabbage | 15.6 ± 0.5 | 23 | <ld | 14.7 ± 0.5 | 20 | 35.0 ± 1.2 | 11 | 2.90 ± 0.23 | 23 | 0.0161 | |
| Curly green cabbage (green leaves) | 97.5 ± 3.9 | 9 | 13.0 ± 0.5 | 9 | 113 ± 5 | 8 | 61.7 ± 3.6 | 5 | 15.1 ± 0.9 | 8 | 0.0488 |
| Curly green cabbage (white leaves) | 36.4 ± 0.2 | 17 | <ld | 20.6 ± 1.6 | 17 | 12.0 ± 0.6 | 23 | 3.00 ± 0.22 | 22 | 0.0132 | |
| Endive | 11.7 ± 0.9 | 26 | <ld | 8.60 ± 0.74 | 25 | 6.90 ± 0.27 | 29 | 1.10 ± 0.08 | 27 | 0.0055 | |
| Escarole | 15.4 ± 0.6 | 24 | 7.40 ± 0.29 | 16 | 4.90 ± 0.89 | 28 | 16.4 ± 0.1 | 19 | 2.90 ± 0.11 | 24 | 0.0116 |
| Green cabbage | <ld | <ld | 9.80 ± 0.23 | 24 | 15.5 ± 0.5 | 20 | 0.20 ± 0.01 | 29 | 0.0096 | ||
| Green lettuce plants | 34.7 ± 2.0 | 18 | <ld | 38.8 ± 1.8 | 14 | 30.8 ± 1.8 | 12 | 6.80 ± 0.28 | 14 | 0.0215 | |
| Green sprout lettuce | 15.3 ± 1.1 | 25 | <ld | 16.6 ± 1.1 | 19 | 23.5 ± 1.2 | 16 | 4.00 ± 0.10 | 18 | 0.0126 | |
| Iceberg lettuce plants | <ld | 5.50 ± 0.02 | 17 | 1.30 ± 0.03 | 29 | 14.7 ± 0.3 | 21 | 0.50 ± 0.02 | 28 | 0.0099 | |
| Kale | 103 ± 8 | 7 | <ld | 100 ± 4 | 9 | 83.0 ± 3.4 | 2 | 11.7 ± 0.9 | 10 | 0.0592 | |
| Lamb’s lettuce | 41.8 ± 0.8 | 15 | 23.1 ± 1.5 | 5 | 29.5 ± 0.2 | 16 | 26.1 ± 0.2 | 15 | 11.6 ± 0.4 | 11 | 0.0308 |
| Lollo rosso lettuce | 54.7 ± 4.3 | 13 | 10.3 ± 0.8 | 11 | 62.1 ± 4.8 | 13 | 28.5 ± 1.8 | 14 | 6.30 ± 0.24 | 16 | 0.0278 |
| Mix of rocket salad. watercress. lamb’s lettuce and lollo rosso lettuce | 141 ± 1 | 3 | 25.9 ± 1.8 | 4 | 201 ± 16 | 2 | 65.1 ± 4.8 | 4 | 15.3 ± 1.3 | 7 | 0.0736 |
| Moringa | 341 ± 16 | 1 | 125 ± 10 | 1 | 580 ± 50 | 1 | 201 ± 11 | 1 | 63.5 ± 4.9 | 1 | 0.2416 |
| Oak leaf lettuce | 107 ± 7 | 6 | <ld | 117 ± 3 | 7 | 30.1 ± 1.7 | 13 | 18.6 ± 1.4 | 4 | 0.0452 | |
| Red cabbage | 45.6 ± 2.7 | 14 | 7.50 ± 0.28 | 15 | 14.3 ± 1.0 | 22 | 7.80 ± 0.58 | 29 | 2.20 ± 0.18 | 25 | 0.0145 |
| Red chicory leaves | 57.6 ± 1.3 | 12 | <ld | 36.3 ± 2.7 | 15 | 41.3 ± 1.6 | 8 | 6.40 ± 0.50 | 15 | 0.0285 | |
| Red lettuce plants | 93.0 ± 7.5 | 10 | 14.0 ± 1.1 | 8 | 99.5 ± 8.7 | 10 | 18.1 ± 1.1 | 18 | 14.0 ± 1.1 | 9 | 0.0369 |
| Red lettuce sprouts | 28.5 ± 1.6 | 19 | <ld | 20.4 ± 1.6 | 18 | 22.1 ± 1.3 | 17 | 4.70 ± 0.34 | 17 | 0.0150 | |
| Rocket salad | 20.4 ± 0.6 | 21 | 26.5 ± 4.2 | 3 | 63.0 ± 0.5 | 11 | 13.7 ± 5.8 | 22 | 3.80 ± 0.03 | 19 | 0.0310 |
| Roman lettuce plants | 10.2 ± 0.2 | 27 | 5.30 ± 0.12 | 18 | 7.50 ± 0.05 | 27 | 8.40 ± 0.38 | 27 | 1.80 ± 0.04 | 26 | 0.0078 |
| Spinach | 37.1 ± 1.2 | 16 | 8.10 ± 0.40 | 13 | 14.3 ± 1.2 | 21 | 8.50 ± 0.10 | 26 | 8.60 ± 0.12 | 12 | 0.0140 |
| Spinach sprouts | 136 ± 2 | 4 | 22.5 ± 1.6 | 6 | 185 ± 9 | 3 | 75.0 ± 3.7 | 3 | 18.7 ± 0.9 | 3 | 0.0712 |
| Turnip greens (turnip tops) | 101 ± 6 | 8 | 16.5 ± 1.3 | 7 | 155 ± 9 | 5 | 36.6 ± 1.5 | 10 | 15.6 ± 1.2 | 6 | 0.0500 |
| Watercress | 113 ± 6 | 5 | <ld | 131 ± 8 | 6 | 45.5 ± 3.1 | 7 | 15.8 ± 0.9 | 5 | 0.0532 | |
| Extract | Method | r | r without MO |
|---|---|---|---|
| ME versus HE | TEAC | 0.495 ** | 0.437 *** |
| DPPH | 0.714 * | 0.682 * | |
| FRAP | 0.519 ** | 0.465 *** | |
| ORAC | 0.610 * | 0.567 ** | |
| TPC | 0.679 * | 0.643 * | |
| ME versus HE + LE | TEAC | 0.822* | 0.802 * |
| DPPH | 0.731 * | 0.701 * | |
| FRAP | 0.769 * | 0.743 * | |
| ORAC | 0.647 * | 0.608 * | |
| TPC | 0.801 * | 0.779 * | |
| HE versus LE | TEAC | 0.335 | 0.255 |
| DPPH | 0.175 | 0.020 | |
| FRAP | 0.232 | 0.146 | |
| ORAC | 0.174 | 0.083 | |
| TPC | 0.412 *** | 0.347 | |
| HE versus HE + LE | TEAC | 0.790 * | 0.766 * |
| DPPH | 0.971 * | 0.968 * | |
| FRAP | 0.825 * | 0.806 * | |
| ORAC | 0.994 * | 0.993 * | |
| TPC | 0.892 * | 0.880 * |
| Extract | ||||||
|---|---|---|---|---|---|---|
| ME | HE | LE | ||||
| Method | ||||||
| r | r without MO | r | r without MO | r | r without MO | |
| TEAC versus DPPH | 0.802 * | 0.780 * | 0.951 * | 0.948 * | 0.696 ** | 0.635 ** |
| TEAC versus FRAP | 0.934 * | 0.926 * | 0.975 * | 0.973 * | 0.902 * | 0.890 * |
| TEAC versus ORAC | 0.940 * | 0.933 * | 0.949 * | 0.943 * | 0.777 * | 0.750 * |
| TEAC versus TPC | 0.923 * | 0.914 * | 0.934 * | 0.926 * | 0.903 * | 0.892 * |
| DPPH versus FRAP | 0.857 * | 0.841 * | 0.964 * | 0.960 * | 0.864 * | 0.839 * |
| DPPH versus ORAC | 0.810 * | 0.789 * | 0.911 * | 0.901 * | 0.688 ** | 0.630 ** |
| DPPH versus TPC | 0.882 * | 0.869 * | 0.896 * | 0.884 * | 0.843 * | 0.814 * |
| FRAP versus ORAC | 0.922 * | 0.914 * | 0.929 * | 0.921 * | 0.816 * | 0.796 * |
| FRAP versus TPC | 0.929 * | 0.921 * | 0.904 * | 0.893 * | 0.909 * | 0.899 * |
| ORAC versus TPC | 0.953 * | 0.948 * | 0.894 * | 0.883 * | 0.771 * | 0.745 * |
| Vegetable | β-Carotene (1) | β-Carotene (2) | Cat (+) (1) | Chlorophyll a (2) | Chlorophyll b (2) |
|---|---|---|---|---|---|
| Beet leaves | 368.5 ± 8.3 (1) | 13.9 ± 0.8 (4) | 92.9 ± 6.6 (6) | 185.2 ± 5.9 (6) | 63.6 ± 1.7 (5) |
| Chard | 62.1 ± 4.8 (12) | 5.0 ± 0.4 (11) | 12.6 ± 0.5 (15) | 127.8 ± 10.3 (9) | 34.0 ± 1.7 (9) |
| Chinese cabbage | 9.8 ± 0.9 (19) | 0.2 ± 0.0 (19) | 3.8 ± 1.2 (20) | 3.3 ± 0.9 (17) | 1.1 ± 0.4 (17) |
| Curly green cabbage (green leaves) | 133.3 ± 3.5 (6) | 8.6 ± 0.5 (9) | 9.4 ± 1.7 (17) | 62.3 ± 3.1 (11) | 17.4 ± 5.2 (11) |
| Curly green cabbage (white leaves) | 32.8 ± 0.3 (15) | 0.3 ± 0.1 (17) | 5.6 ± 0.3 (18) | 2.2 ± 0.5 (19) | 0.7 ± 0.2 (20) |
| Endive | 8.7 ± 1.5 (20) | 0.1 ± 0.0 (20) | 42.4 ± 2.7 (8) | 2.1 ± 0.2 (20) | 1.0 ± 0.4 (18) |
| Green lettuce plants | 48.2 ± 5.9 (14) | 2.9 ± 0.0 (12) | 25.0 ± 5.3 (11) | 83.0 ± 0.0 (10) | 34.8 ± 0.0 (8) |
| Green lettuce sprouts | 15.0 ± 0.4 (18) | 0.5 ± 0.0 (16) | 9.9 ± 0.4 (16) | 8.4 ± 2.0 (15) | 3.9 ± 0.0 (15) |
| Kale | 173.3 ± 13.6 (4) | 7.4 ± 0.3 (10) | 30.2 ± 0.3 (9) | 43.1 ± 0.2 (12) | 13.2 ± 0.6 (13) |
| Lollo rosso lettuce | 87.5 ± 11.0 (9) | 2.7 ± 0.1 (13) | 175.9 ± 12.0 (3) | 33.2 ± 6.1 (13) | 9.5 ± 2.2 (14) |
| Mix of rocket, watercress, lamb’s lettuce and lollo rosso lettuce | 133.9 ± 7.5 (5) | 16.1 ± 3.0 (3) | 115.2 ± 23.9 (5) | 334.6 ± 66.6 (1) | 110.3 ± 26.4 (2) |
| Moringa | 353.9 ± 17.1 (2) | 35.1 ± 0.9 (1) | 327.2 ± 13.8 (1) | 210.4 ± 3.9 (5) | 33.8 ± 1.0 (10) |
| Oak leaf lettuce | 121.7 ± 5.8 (8) | 9.6 ± 0.6 (7) | 172.9 ± 12.3 (4) | 183.8 ± 9.7 (7) | 60.5 ± 0.5 (6) |
| Red cabbage | 23.2 ± 1.8 (16) | 0.3 ± 0.0 (18) | 27.8 ± 1.8 (10) | 2.6 ± 0.3 (18) | 0.9 ± 0.2 (19) |
| Red chicory leaves | 61.3 ± 6.3 (13) | 0.6 ± 0.0 (15) | 191.2 ± 14.8 (2) | 4.1 ± 0.1 (16) | 1.3 ± 0.1 (16) |
| Red lettuce plants | 69.5 ± 6.7 (11) | 8.7 ± 0.2 (8) | 70.0 ± 18.2 (7) | 218.3 ± 33.6 (4) | 79.7 ± 12.1 (3) |
| Red lettuce sprouts | 22.3 ± 0.2 (17) | 1.5 ± 0.1 (14) | 5.4 ± 1.3 (19) | 24.0 ± 0.8 (14) | 14.6 ± 2.5 (12) |
| Spinach | 174.6 ± 8.9 (3) | 18.2 ± 0.9 (2) | 16.1 ± 4.8 (13) | 269.5 ± 38.5 (3) | 72.2 ± 18.4 (4) |
| Turnip greens | 85.5 ± 9.2 (10) | 13.4 ± 1.8 (5) | 13.8 ± 4.8 (14) | 330.5 ± 85.3 (2) | 116.7 ± 30.9 (1) |
| Watercress | 129.7 ± 4.5 (7) | 10.1 ± 0.6 (6) | 19.0 ± 1.5 (12) | 135.6 ± 2.9 (8) | 45.0 ± 8.2 (7) |
Publisher’s Note: MDPI stays neutral with regard to jurisdictional claims in published maps and institutional affiliations. |
© 2020 by the authors. Licensee MDPI, Basel, Switzerland. This article is an open access article distributed under the terms and conditions of the Creative Commons Attribution (CC BY) license (http://creativecommons.org/licenses/by/4.0/).
Share and Cite
González-Romero, J.; Arranz-Arranz, S.; Verardo, V.; García-Villanova, B.; Guerra-Hernández, E.J. Bioactive Compounds and Antioxidant Capacity of Moringa Leaves Grown in Spain Versus 28 Leaves Commonly Consumed in Pre-Packaged Salads. Processes 2020, 8, 1297. https://doi.org/10.3390/pr8101297
González-Romero J, Arranz-Arranz S, Verardo V, García-Villanova B, Guerra-Hernández EJ. Bioactive Compounds and Antioxidant Capacity of Moringa Leaves Grown in Spain Versus 28 Leaves Commonly Consumed in Pre-Packaged Salads. Processes. 2020; 8(10):1297. https://doi.org/10.3390/pr8101297
Chicago/Turabian StyleGonzález-Romero, Jaime, Sandra Arranz-Arranz, Vito Verardo, Belén García-Villanova, and Eduardo J. Guerra-Hernández. 2020. "Bioactive Compounds and Antioxidant Capacity of Moringa Leaves Grown in Spain Versus 28 Leaves Commonly Consumed in Pre-Packaged Salads" Processes 8, no. 10: 1297. https://doi.org/10.3390/pr8101297