Water Salinity as Potential Aid for Improving the Carbon Dioxide Replacement Process’ Effectiveness in Natural Gas Hydrate Reservoirs


Abstract
:
1. Introduction
2. Materials and Methods
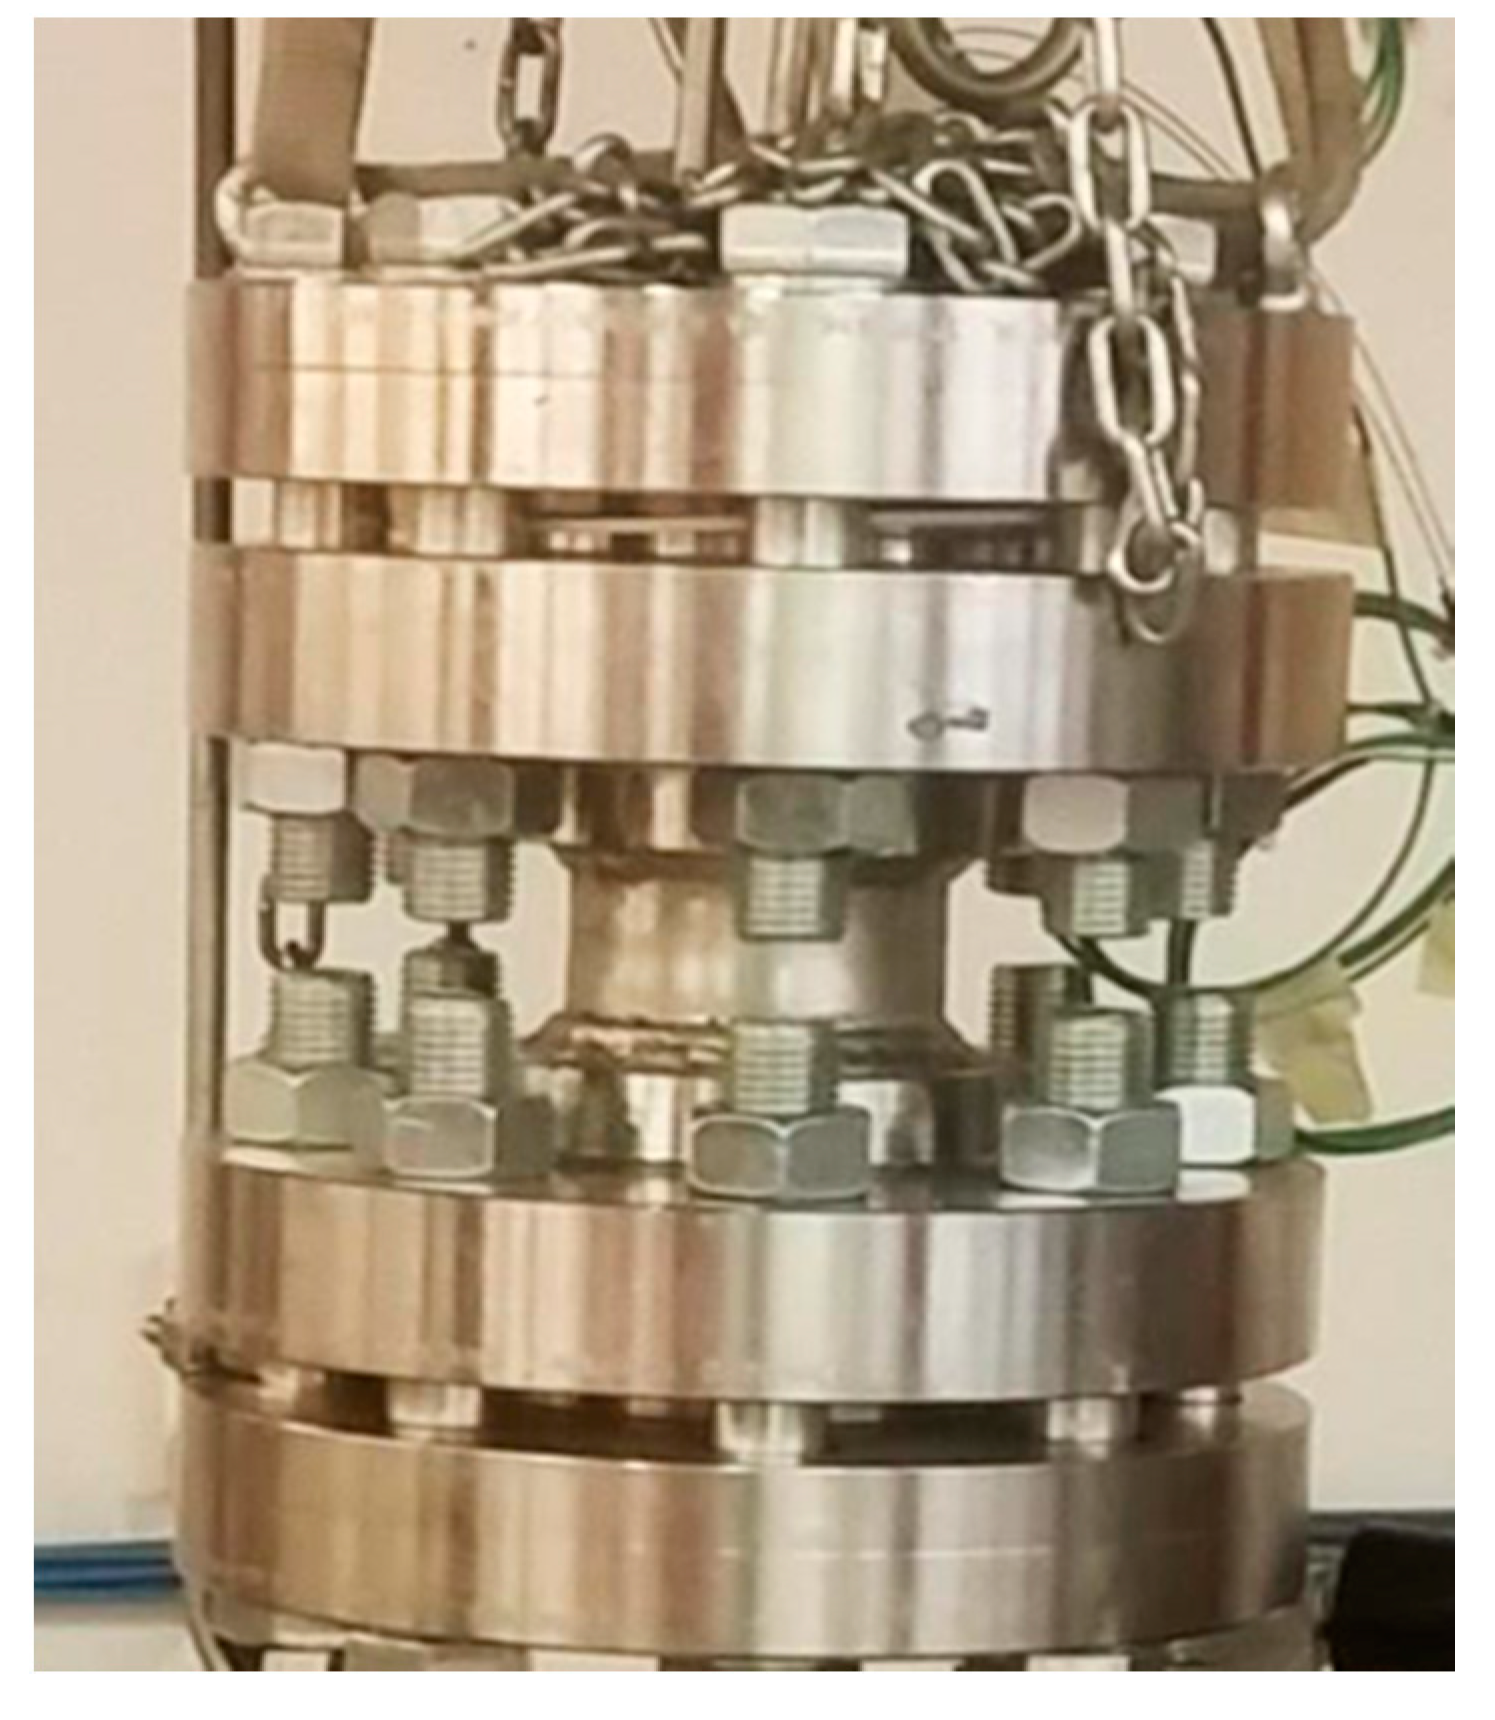
2.1. Experimental Apparatus
2.2. Materials
2.3. Experimental Procedure
3. Results and Discussion
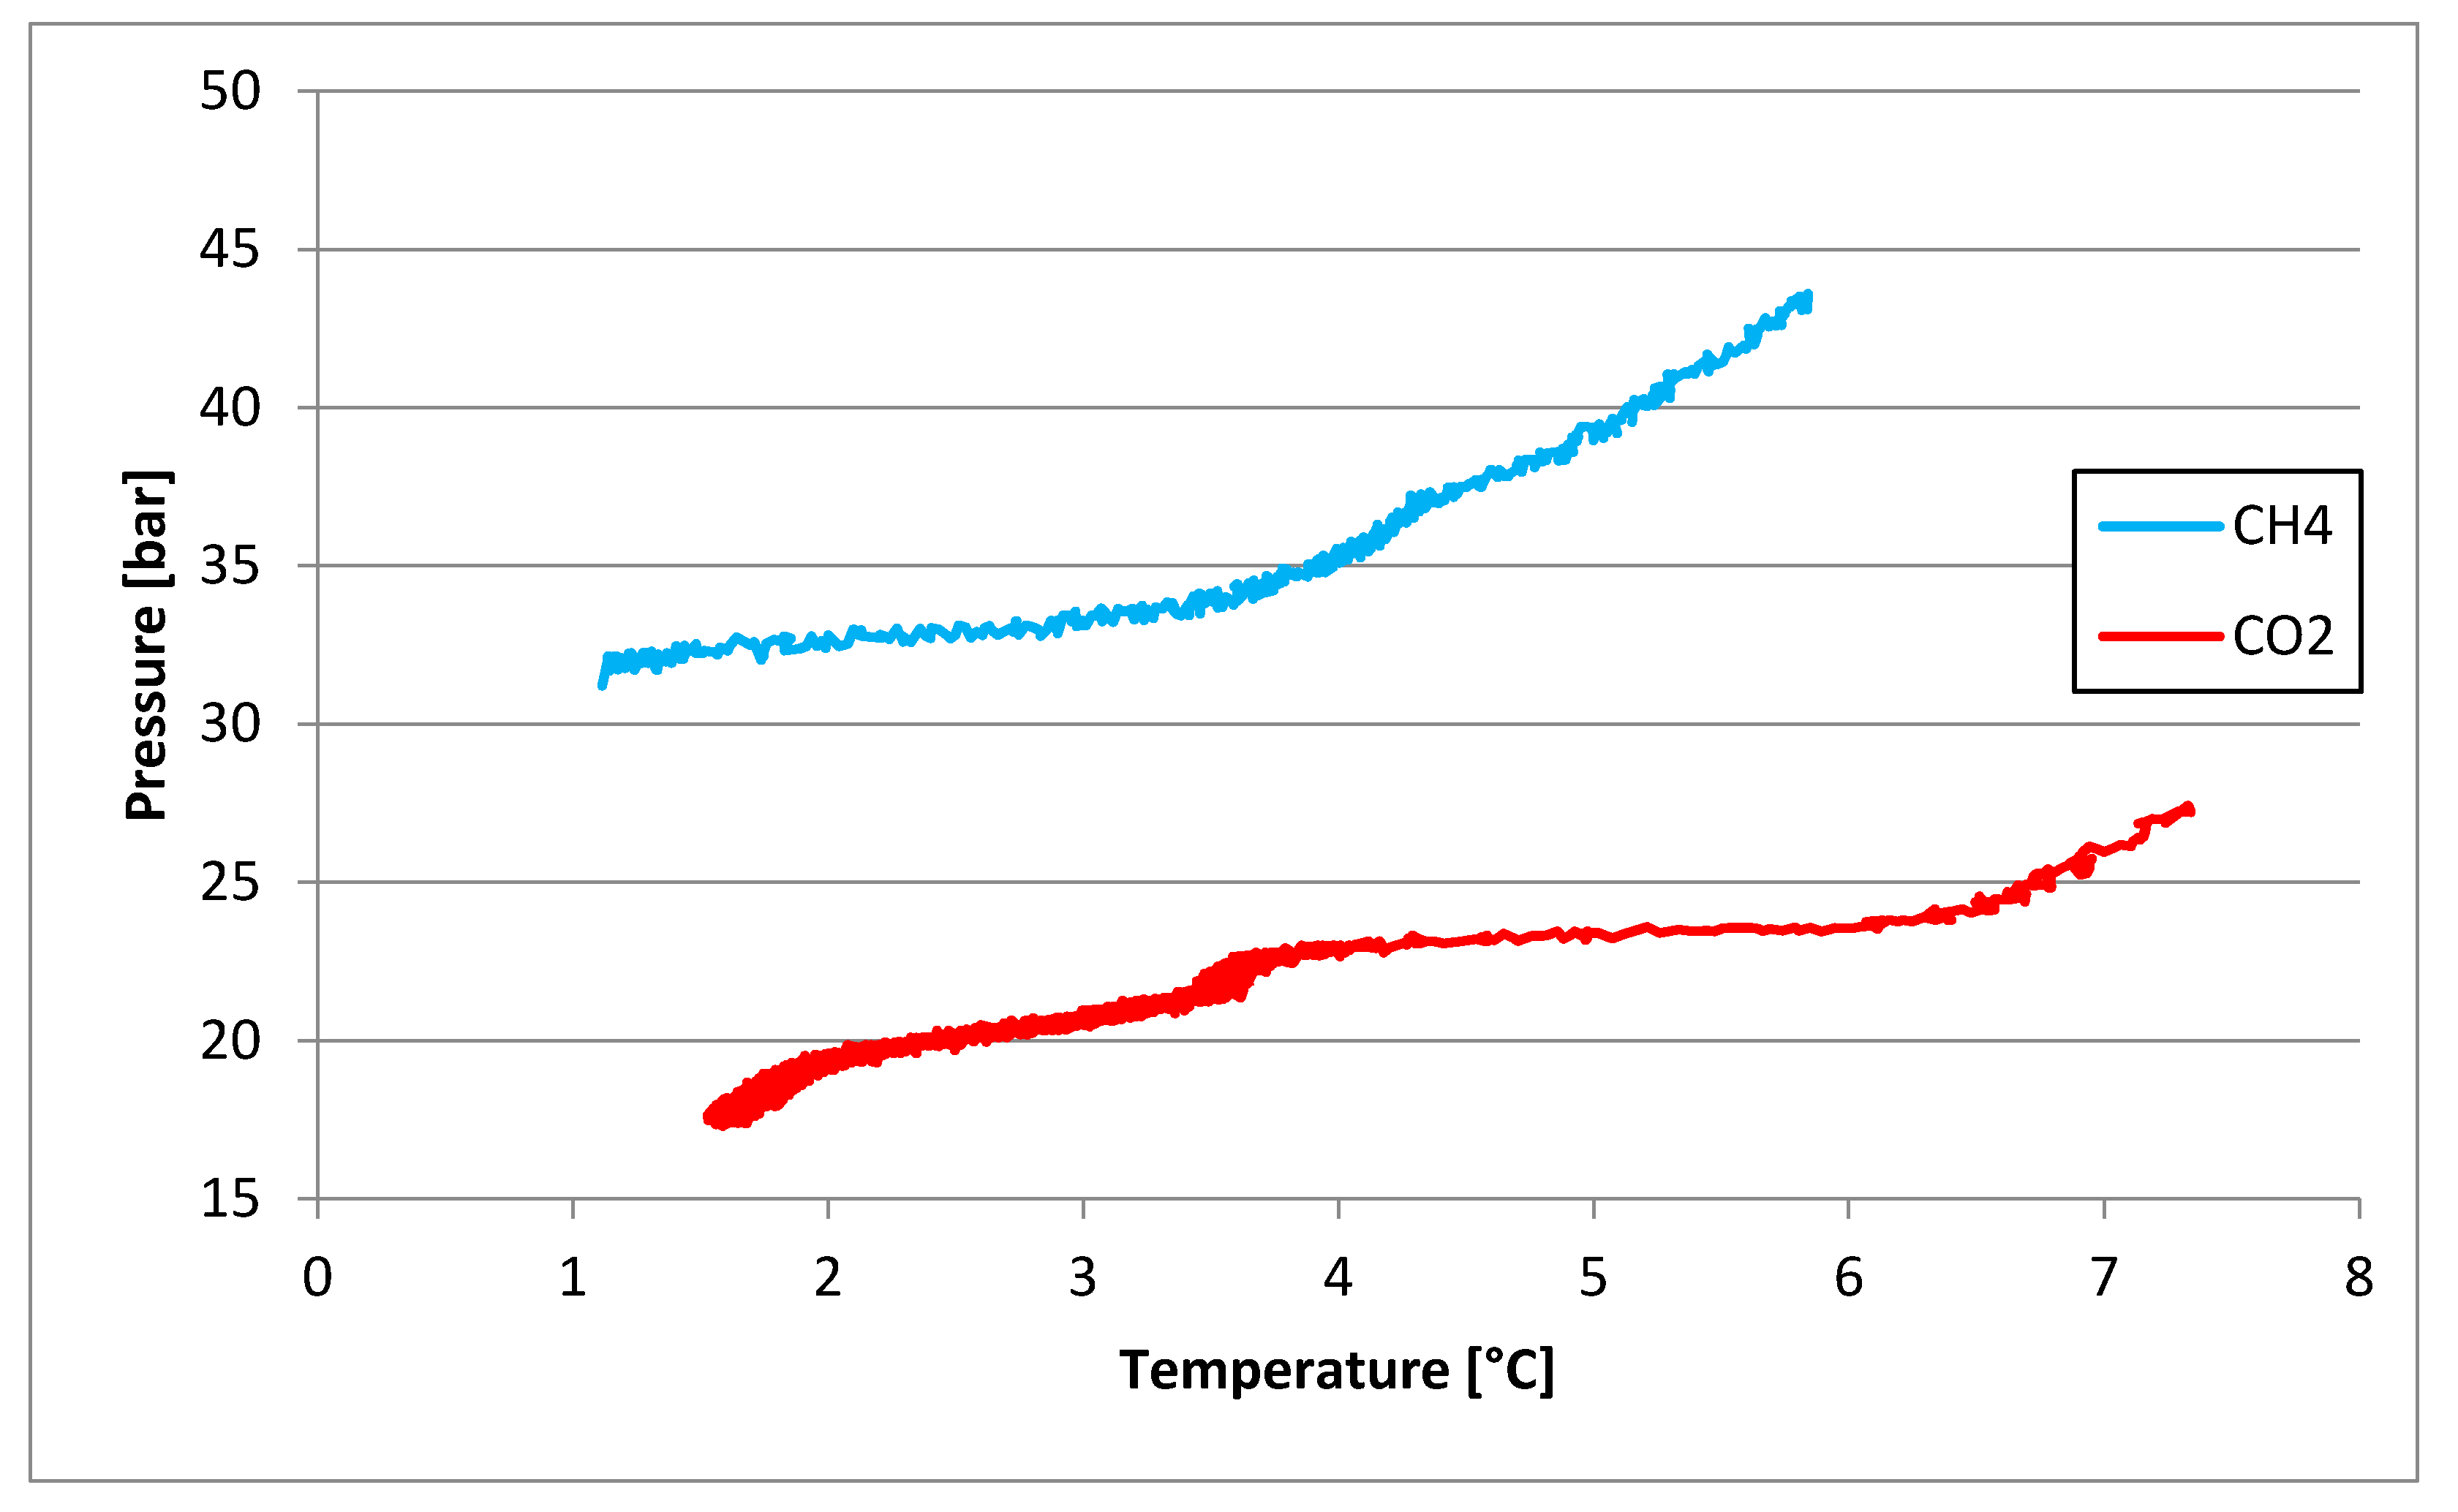
3.1. Tests Carried Out in Pure Demineralized Water
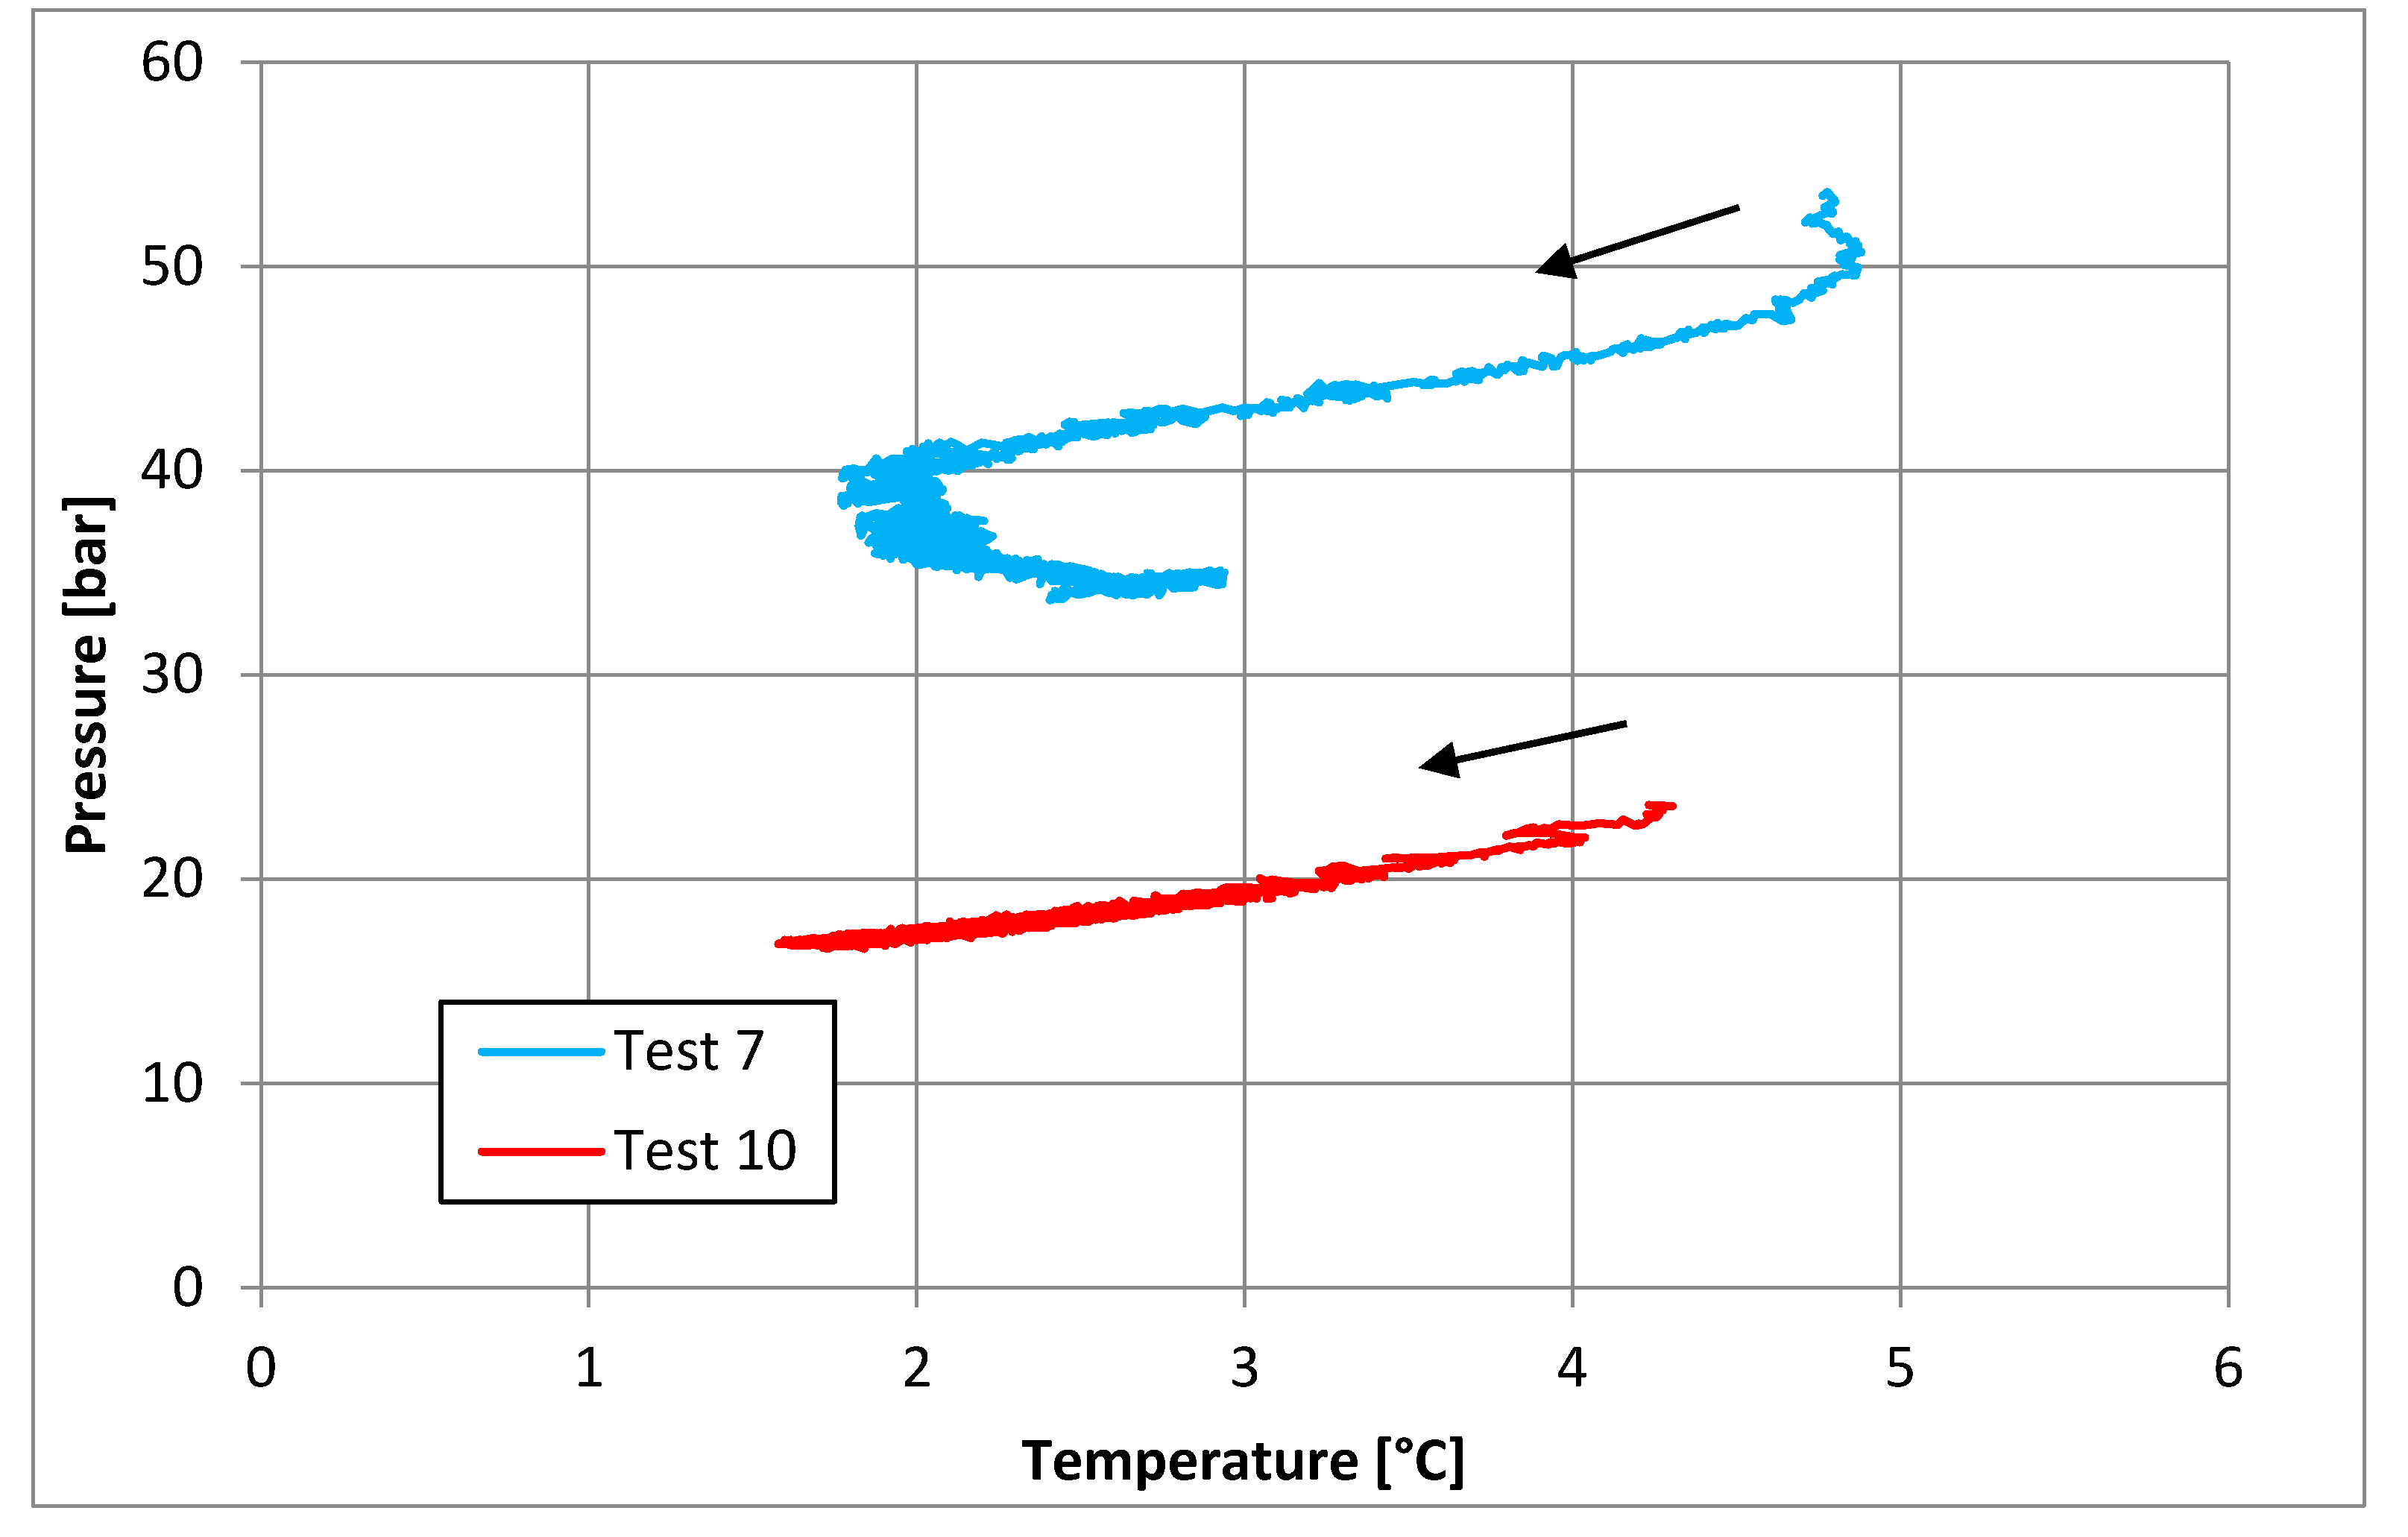
3.2. Tests Carried Out in Presence of Salt, with a Concentration of 30 g/L
3.3. Tests Carried out in Presence of Salt, with a Concentration of 37 g/L
3.4. Evaluation of Dimensions of the Area Useful for CH4/CO2 Replacement Strategies in Function of Salinity
3.5. A Brief Comparison with Data Present in the Literature
4. Conclusions
Author Contributions
Funding
Acknowledgments
Conflicts of Interest
References
- Sloan, E.D.; Koh, C.A. Clathrate Hydrates of Natural Gases, 3rd ed.; CRC Press: Boca Raton, FL, USA, 2008. [Google Scholar]
- Makogon, Y.F. Natural gas hydrates—A promising source of energy. J. Nat. Gas Sci. Eng. 2010, 2, 49–59. [Google Scholar] [CrossRef]
- Makogon, Y.F.; Holditch, S.A.; Makogon, T.Y. Natural gas-hydrates—A potential energy source for the 21st Century. J. Pet. Sci. Eng. 2007, 56, 14–31. [Google Scholar] [CrossRef]
- Makogon, Y.F.; Holste, J.C.; Holditch, S.A. Natural gas hydrates and global change. In Proceedings of the Eighth International Offshore and Polar Engineering Conference, Montreal, QC, Canada, 24–29 May 1998; Volume 1, pp. 73–74. [Google Scholar]
- Ma, R.; Zhong, H.; Liu, J.; Zhong, J.; Yan, Y.; Zhang, J.; Xu, J. Molecular Insights into Cage Occupancy of Hydrogen Hydrate: A Computational Study. Processes 2019, 7, 699. [Google Scholar] [CrossRef] [Green Version]
- Englezos, P. Clathrate hydrates. Ind. Eng. Chem. Res. 1993, 32, 1251–1274. [Google Scholar] [CrossRef]
- Stolper, D.A.; Lawson, M.; Davis, C.L.; Ferreira, A.A.; Neto, E.V.S.; Ellis, G.S.; Lewan, M.D.; Martini, A.M.; Tang, Y.; Sessions, A.L.; et al. Formation temperatures of thermogenic and biogenic methane. Science 2014, 344, 1500–1503. [Google Scholar] [CrossRef]
- Gray, N.D.; Sherry, A.; Larter, S.R.; Erdmann, M.; Leyris, J.; Liengen, T.; Beeder, J.; Head, I.M. Biogenic methane production in formation waters from a large gas field in the North Sea. Extremophiles 2009, 13, 511–519. [Google Scholar] [CrossRef]
- Martini, A.M.; Walter, L.M.; Budai, J.M.; Ku, T.C.W.; Kaiser, C.J.; Schoell, M. Genetic and temporal relations between formation waters and biogenic methane: UpperDevonian Antrim Shale, Michigan Basin, USA. Geochim. Cosmochim. Acta 1998, 62, 1699–1720. [Google Scholar] [CrossRef]
- Whiticar, M.J.; Faber, E.; Schoell, M. Biogenic methane formation in marine and fresh-water environments—CO2 reduction vs acetate fermentation isotope evidence. Geochim. Cosmochim. Acta 1986, 50, 693–709. [Google Scholar] [CrossRef]
- Max, M.D. (Ed.) Natural Gas Hydrate in Oceanic and Permafrost Environments; Kluwer Academic Publ.: Dordrecht, The Netherlands, 2000. [Google Scholar]
- Paull, C.; Reeburgh, W.S.; Dallimore, S.R.; Enciso, G.; Green, S.; Koh, C.A.; Kvenvolden, K.A.; Mankin, C.; Riedel, M. Realizing the Energy Potential of Methane Hydrate for the United States; National Research Council of the National Academies: Washington, DC, USA, 2010. [Google Scholar]
- Liua, L.; Ryu, B.J.; Sunb, Z.; Wu, N.; Cao, H.; Geng, W.; Zhang, X.; Jia, Y.; Xu, C.; Guo, L.; et al. Monitoring and research on environmental impacts related to marine natural gas hydrates: Review and future perspective. J. Nat. Gas Sci. Eng. 2019, 65, 82–107. [Google Scholar] [CrossRef]
- Ruppel, C.D.; Kessler, J.D. The interaction of climate change and methane hydrates. Rev. Geophys. 2017, 55, 126–168. [Google Scholar] [CrossRef]
- Boswell, R.; Collett, T.S. Current perspectives on gas hydrate resources. Energy Environ. Sci. 2011, 4, 1206–1215. [Google Scholar] [CrossRef]
- Kurihara, M.; Narita, H. Gas production from methane hydrate reservoirs. In Proceedings of the 7th International Conference on Gas Hydrates (ICGH 2011), Edingburgh, Scotland, UK, 17–21 July 2011. [Google Scholar]
- Yamamoto, K. Overview and Introduction: Pressure core-sampling and analyses in the 2012–2013 MH21 offshore test of gas production from methane hydrates in the eastern Nankai Trough. Mar. Pet. Geol. 2015, 66, 296–309. [Google Scholar] [CrossRef]
- Pandey, J.S.; Daas, Y.J.; Solms, N.V. Insights into Kinetics of Methane Hydrate Formation in the Presence of Surfactants. Processes 2019, 7, 598. [Google Scholar] [CrossRef] [Green Version]
- Florusse, L.J.; Peters, C.J.; Schoonman, J.; Hester, K.C.; Koh, C.A.; Dec, S.F.; Marsh, K.N.; Sloan, E.D. Stable low-pressure hydrogen clusters stored in a binary clathrate hydrate. Science 2004, 306, 469–471. [Google Scholar] [CrossRef] [PubMed]
- Cao, J.; Zhu, S.; Li, C.; Han, B. Integrating Support Vector Regression with Genetic Algorithm for Hydrate Formation Condition Prediction. Processes 2020, 8, 519. [Google Scholar] [CrossRef]
- Gudmundsson, J.S. Method for Production of Gas Hydrate for Transportation and Storage. U.S. Patent 5536893, 16 July 1996. [Google Scholar]
- Hashimoto, S.; Makino, T.; Inoue, Y.; Ohgaki, K. Three-phase equilibrium relations and hydrate dissociation enthalpies for hydrofluorocarbon hydrate systems: HFC-134a, -125, and -143a hydrates. J. Chem. Eng. Data 2010, 55, 4951–4955. [Google Scholar] [CrossRef]
- Gambelli, A.M.; Castellani, B.; Nicolini, A.; Rossi, F. Gas hydrate formation as a strategy for CH4/CO2 separation: Experimental study on gaseous mixtures produced via Sabatier reaction. J. Nat. Gas Sci. Eng. 2019, 71, 102985. [Google Scholar] [CrossRef]
- Aliev, A.; Yusifov, R.; Tairov, A.; Sarydzhanov, A.; Mirzoeva, R.; Yusifov, Y. Mathematical modelling of seawater desalination by the gas hydrate method. Theor. Found. Chem. Eng. 2011, 45, 185–189. [Google Scholar] [CrossRef]
- Rossi, F.; Gambelli, A.M.; Sharma, D.K.; Castellani, B.; Nicolini, A.; Castaldi, M.J. Simulation of methane hydrates formation in seabed deposit and gas recovery adopting carbon dioxide replacement strategies. Appl. Therm. Eng. 2019, 148, 371–381. [Google Scholar] [CrossRef]
- Collett, T.S.; Ginsburg, G.D. Gas hydrates in the Messoyakha gas field of the west Siberian basin—A re-examination of the geologic evidence. Int. Offshore Polar Eng. 1997, 8, 96–103. [Google Scholar]
- Collett, T.S.; Kuuskraa, V.A. Hydrates contain vast store of world gas resources. Oil Gas J. 1998, 96, 90–95. [Google Scholar]
- Feng, J.C.; Li, X.S.; Li, G.; Li, B.; Chen, Z.Y.; Wang, Y. Numerical investigation of hydrate dissociation performance in the South China Sea with different horizontal well configurations. Energies 2014, 7, 4813–4834. [Google Scholar] [CrossRef] [Green Version]
- Li, B.; Li, G.; Li, X.S.; Chen, Z.Y.; Zhang, Y. The use of heat-assisted antigravity drainage method in the two horizontal wells in gas production from the Qilian Mountain permafrost hydrate deposits. J. Pet. Sci. Eng. 2014, 120, 141–153. [Google Scholar] [CrossRef]
- Afzal, W.; Mohammadi, A.H.; Richon, D. Experimental measurements and predictions of dissociation conditions for methane, ethane, propane, and carbon dioxide simple hydrates in the presence of diethylene glycol aqueous solutions. J. Chem. Eng. Data 2008, 53, 663–666. [Google Scholar] [CrossRef]
- Dong, F.; Zang, X.; Li, D.; Fan, S.; Liang, D. Experimental investigation on propane hydrate dissociation by high concentration methanol and ethylene glycol solution injection. Energy Fuels 2009, 23, 1563–1567. [Google Scholar] [CrossRef]
- Sloan, E.D. Clathrate Hydrates of Natural Gases; Taylor & Francis: Washington, DC, USA, 2007. [Google Scholar]
- Gambelli, A.M.; Rossi, F. The use of sodium chloride as strategy for improving CO2/CH4 replacement in natural gas hydrates promoted with depressurization methods. Arab. J. Geosci. 2020, 13, 898. [Google Scholar] [CrossRef]
- Castellani, B.; Gambelli, A.M.; Nicolini, A.; Rossi, F. Energy and Environmental Analysis of Membrane-Based CH4-CO2 Replacement Processes in Natural Gas Hydrates. Energies 2019, 12, 850. [Google Scholar] [CrossRef] [Green Version]
- Sabil, K.M.; Duarte, A.R.C.; Zevenbergen, C.; Ahmad, M.M.; Yusup, S.; Omar, A.A.; Peters, C.J. Kinetic of formation for single carbon dioxide and mixed carbon dioxide and tetrahydrofuran hydrates in water and sodium chloride aqueous solution. Int. J. Greenh. Gas Control 2010, 4, 798–805. [Google Scholar] [CrossRef]
- Gambelli, A.M.; Filipponi, M.; Nicolini, A.; Rossi, F. Chemical inhibitors as potential allied for CO2 replacement in gas hydrates reservoirs: Sodium chloride case study. In Proceedings of the International Multidisciplinary GeoConference: SGEM, Sofia, Bulgaria, 30 June–6 July 2019; Surveying Geology & Mining Ecology Managment (SGEM): Sofia, Bulgaria, 2019; Volume 19, pp. 333–343. [Google Scholar] [CrossRef]
- Kharrat, M.; Dalmazzone, D. Experimental determination of stability conditions of methane hydrate in aqueous calcium chloride solutions using high pressure differential scanning calorimetry. J. Chem. Thermodyn. 2003, 35, 1489–1505. [Google Scholar] [CrossRef]
- Cha, M.J.; Hu, Y.; Sum, A.K. Methane hydrate phase equilibria for systems containing NaCl, KCl, and NH4Cl. Fluid Phase Equilibria 2016, 413, 2–9. [Google Scholar] [CrossRef]
- Hu, Y.; Makogon, T.Y.; Karanjkar, P.; Lee, K.H.; Lee, B.R.; Sum, A.K. Gas hydrates phase equilibria and formation from high concentration NaCl brines up to 200 MPa. J. Chem. Eng. Data 2017, 62, 1910–1918. [Google Scholar] [CrossRef]
- Javanmardi, J.; Moshfeghian, M.; Maddox, R.N. Simple method for predicting gas-hydrate-forming conditions in aqueous mixed-electrolyte solutions. Energy Fuels 1998, 12, 219–222. [Google Scholar] [CrossRef]
- Long, Z.; Du, J.W.; Li, D.L.; Liang, D.Q. Phase equilibria of ethane hydrate in MgCl2 aqueous solutions. J. Chem. Eng. Data 2010, 55, 2938–2941. [Google Scholar] [CrossRef]
- Englezos, P.; Ngan, Y.T. Incipient equilibrium data for propane hydrate formation in aqueous solutions of NaCl, KCl and CaCl2. J. Chem. Eng. Data 1993, 38, 250–253. [Google Scholar] [CrossRef]
- Uchida, T.; Ikeda, I.Y.; Takeya, S.; Ebinuma, T.; Nagao, J.; Narita, H. CO2 hydrate film formation at the boundary between CO2 and water: Effects of temperature, pressure and additives on the formation rate. J. Cryst. Growth 2002, 237–239, 383–387. [Google Scholar] [CrossRef]
- Bradshaw, R.W.; Greathouse, J.A.; Cygan, R.T.; Simmons, B.A.; Dedrick, D.E.; Majzoub, E.H. Desalination Utilizing Clathrate Hydrates; LDRD Final Report; Sandia report SAND2007-6565; Sandia National Laboratories: Albuquerque, NM, USA, 2008. [Google Scholar]
- Tromp, R.H.; Neilson, G.W.; Soper, A.K. Water structure in concentrated lithium chloride solutions. J. Chem. Phys. 1992, 96, 8460–8469. [Google Scholar] [CrossRef]
- Lu, H.; Matsumoto, R.; Tsuji, Y.; Oda, H. Anion plays a more important role than cation in affecting gas hydrate stability in electrolyte solution?—A recognition from experimental results. Fluid Phase Equilibria 2001, 178, 225–232. [Google Scholar] [CrossRef]
- Gambelli, A.M.; Rossi, F. Natural gas hydrates: Comparison between two different applications of thermal stimulation for performing CO2 replacement. Energy 2019, 172, 423–434. [Google Scholar] [CrossRef]
- Gambelli, A.M.; Rossi, F. Investigation on effects produced by sodium chloride presence on the CO2 hydrate formation process. In Proceedings of the 2nd Conference of the Arabian Journal of Geosciences, Sousse, Tunisia, 25–28 November 2019. [Google Scholar]
- Ng, H.J.; Robinson, D.B. New Developments in the Measurement and Prediction of Hydrate Formation for Processing Needs. Ann. N. Y. Acad. Sci. 1994, 715, 450–462. [Google Scholar] [CrossRef]
- Javanmardi, J.; Ayatollahi, S.; Motealleh, R.; Moshfeghian, M. Experimental measurement and modelling of R22 (CHClF2) hydrates in mixtures of acetone + water. J. Chem. Eng. Data 2004, 49, 886–889. [Google Scholar] [CrossRef]
- Maekawa, T. Equilibrium conditions for clathrate hydrates formed from carbon dioxide or ethane in the presence of aqueous solutions of 1,4-dioxane and 1,3-dioxolane. Fluid Phase Equilibria 2014, 384, 95–99. [Google Scholar] [CrossRef]
- De Deugd, R.M.; Jager, M.D.; de Swaan Arons, J. Mixed Hydrates of Methane and Water-Soluble Hydrocarbons Modeling of Empirical Results. AIChE J. 2001, 47, 693–704. [Google Scholar] [CrossRef]
- Jager, M.D.; de Deugd, R.M.; Peters, C.J.; Arons, J.S.; Sloan, E.D. Experimental determination and modelling of structure II hydrates in mixtures of methane + water + 1,4-dioxane. Fluid Phase Equilibria 1999, 165, 209–223. [Google Scholar] [CrossRef]
- Maekawa, T. Equilibrium conditions of clathrate hydrates formed from carbon dioxide and aqueous acetone solutions. Fluid Phase Equilibria 2011, 303, 76–79. [Google Scholar] [CrossRef]
- Sun, Z.G.; Fan, S.S.; Guo, K.H.; Shi, L.; Wang, R.Z. Equilibrium hydrate formation conditions for methylcyclohexane with methane and a ternary gas mixture. Fluid Phase Equilibria 2002, 198, 293–298. [Google Scholar] [CrossRef]
- Maekawa, T. Equilibrium conditions for clathrate hydrates formed from methane and aqueous propanol solutions. Fluid Phase Equilibria 2008, 267, 1–5. [Google Scholar] [CrossRef]
- Ostergaard, K.K.; Tohidi, B.; Anderson, R.; Todd, A.C.; Danesh, A. Can 2-propanol form clathrate hydrates? Ind. Eng. Chem. Res. 2002, 41, 2064–2068. [Google Scholar] [CrossRef]
- Ohmura, R.; Takeya, S.; Uchida, T.; Ebinuma, T. Clathrate hydrate formed with methane and 2-propanol: Confirmation of structure II hydrate formation. Ind. Eng. Chem. Res. 2004, 43, 4964–4966. [Google Scholar] [CrossRef]
- Palhavanzadeh, H.; Pourranjbar, M.; Mahani, A.A.Z.; Mohammadi, A.H. Hydrate Phase Equilibria of Methane + Mixed (TBAB + THF) in the Presence and Absence of NaCl and/or MgCl2 Aquaous Solutions. J. Chem. Eng. Data 2019, 65, 217–221. [Google Scholar] [CrossRef]
- Sangwai, J.S.; Oellrich, L. Phase equilibrium of semiclathrate hydrates of methane in aqueous solutions of tetra-n-butyl ammonium bromide (TBAB) and TBAB-NaCl. Fluid Phase Equilibria 2014, 367, 95–102. [Google Scholar] [CrossRef]
- Veluswanry, H.P.; Kumar, A.; Kumar, R.; Linga, P. Investigation of the kinetics of mixed methane hydrate formation kinetics in saline and seawater. Appl. Energy 2019, 253, 11315. [Google Scholar]
- Maeda, N. Nucleation curves of methane hydrate from constant cooling ramps methods. Fuel 2018, 223, 286–293. [Google Scholar] [CrossRef]
- Shagapov, V.S.; Khasanov, M.K.; Musakaev, N.G.; Duong, N.H. Theoretical research of the gas hydrate deposits development using the injection of carbon dioxide. Int. J. Heat Mass Transf. 2017, 107, 347–357. [Google Scholar] [CrossRef]
- Gambelli, A.M.; Castellani, B.; Nicolini, A.; Rossi, F. Experimental study on natural gas hydrate exploitation: Optimization of methane recovery, carbon dioxide storage and deposit structure preservation. J. Pet. Sci. Eng. 2019, 177, 594–601. [Google Scholar] [CrossRef]
- Du, J.; Wang, X.; Liu, H.; Guo, P.; Wang, Z.; Fan, S. Experiments and prediction of phase equilibrium conditions for methane hydrate formation in the NaCl, CaCl2, MgCl2 electrolyte solutions. Fluid Phase Equilibria 2019, 479, 1–8. [Google Scholar] [CrossRef]
- Mohammadi, A.H.; Azfal, W.; Richon, D. Gas hydrates of methane, ethane, propane, and carbon dioxide in the presence of single NaCl, KCl, and CaCl2 aqueous solutions: Experimental measurement and predictions of dissociation conditions. J. Chem. Thermodyn. 2008, 40, 1693–1697. [Google Scholar] [CrossRef]
- Sun, S.C.; Kong, Y.Y.; Zhang, Y.; Liu, C.L. Phase equilibrium of methane hydrate in silica sand containing chloride salt solution. J. Chem. Thermodyn. 2015, 90, 116–121. [Google Scholar] [CrossRef]
- Shicai, S.; Yong, Z.; Changling, L.; Yufeng, L. Preliminary study on measurement technology for hydrate phase equilibrium. Fluid Phase Equilibria 2015, 403, 60–69. [Google Scholar] [CrossRef]
- Sun, S.C.; Liu, C.L.; Ye, Y.G. Phase equilibrium condition of marine carbon dioxide hydrate. J. Chem. Thermodyn. 2013, 57, 256–260. [Google Scholar] [CrossRef]


| Parameters | Test 1 | Test 4 | Measure Units |
|---|---|---|---|
| Pi | 44.21 | 25.82 | bar |
| Ti | 5.84 | 5.99 | °C |
| Pf | 31.22 | 17.09 | bar |
| Tf | 1.12 | 2.86 | °C |
| Zi | 0.87 | 0.83 | - |
| Zf | 0.90 | 0.89 | - |
| molINJ | 0.556 | 0.435 | mol |
| molHYD | 0.189 | 0.122 | mol |
| molDISS | - | 0.004 | mol |
| η | 0.915 | 0.909 | - |
| Parameters | Test 2 | Test 5 | Measure Units |
|---|---|---|---|
| Pi | 48.44 | 27.43 | bar |
| Ti | 5.51 | 6.96 | °C |
| Pf | 34.94 | 17.71 | bar |
| Tf | 0.20 | 2.39 | °C |
| Zi | 0.86 | 0.83 | - |
| Zf | 0.89 | 0.89 | - |
| molINJ | 0.618 | 0.359 | mol |
| molHYD | 0.204 | 0.136 | mol |
| molDISS | - | 0.004 | mol |
| η | 0.987 | 0.878 | - |
| Parameters | Test 3 | Test 6 | Measure Units |
|---|---|---|---|
| Pi | 48.06 | 26.88 | bar |
| Ti | 4.84 | 7.24 | °C |
| Pf | 28.86 | 17.62 | bar |
| Tf | 1.58 | 1.62 | °C |
| Zi | 0.86 | 0.83 | - |
| Zf | 0.91 | 0.89 | - |
| molINJ | 0.615 | 0.35 | mol |
| molHYD | 0.275 | 0.129 | mol |
| molDISS | - | 0.004 | mol |
| η | 0.989 | 0.789 | - |
| Parameters | Test 7 | Test 10 | Measure Units |
|---|---|---|---|
| Pi | 53.47 | 23.63 | bar |
| Ti | 4.76 | 4.23 | °C |
| Pf | 33.09 | 16.73 | bar |
| Tf | 2.39 | 1.80 | °C |
| Zi | 0.85 | 0.89 | - |
| Zf | 0.90 | 0.93 | - |
| molINJ | 0.666 | 0.217 | mol |
| molHYD | 0.299 | 0.084 | mol |
| molDISS | - | 0.005 | mol |
| η | 0.948 | 0.929 | - |
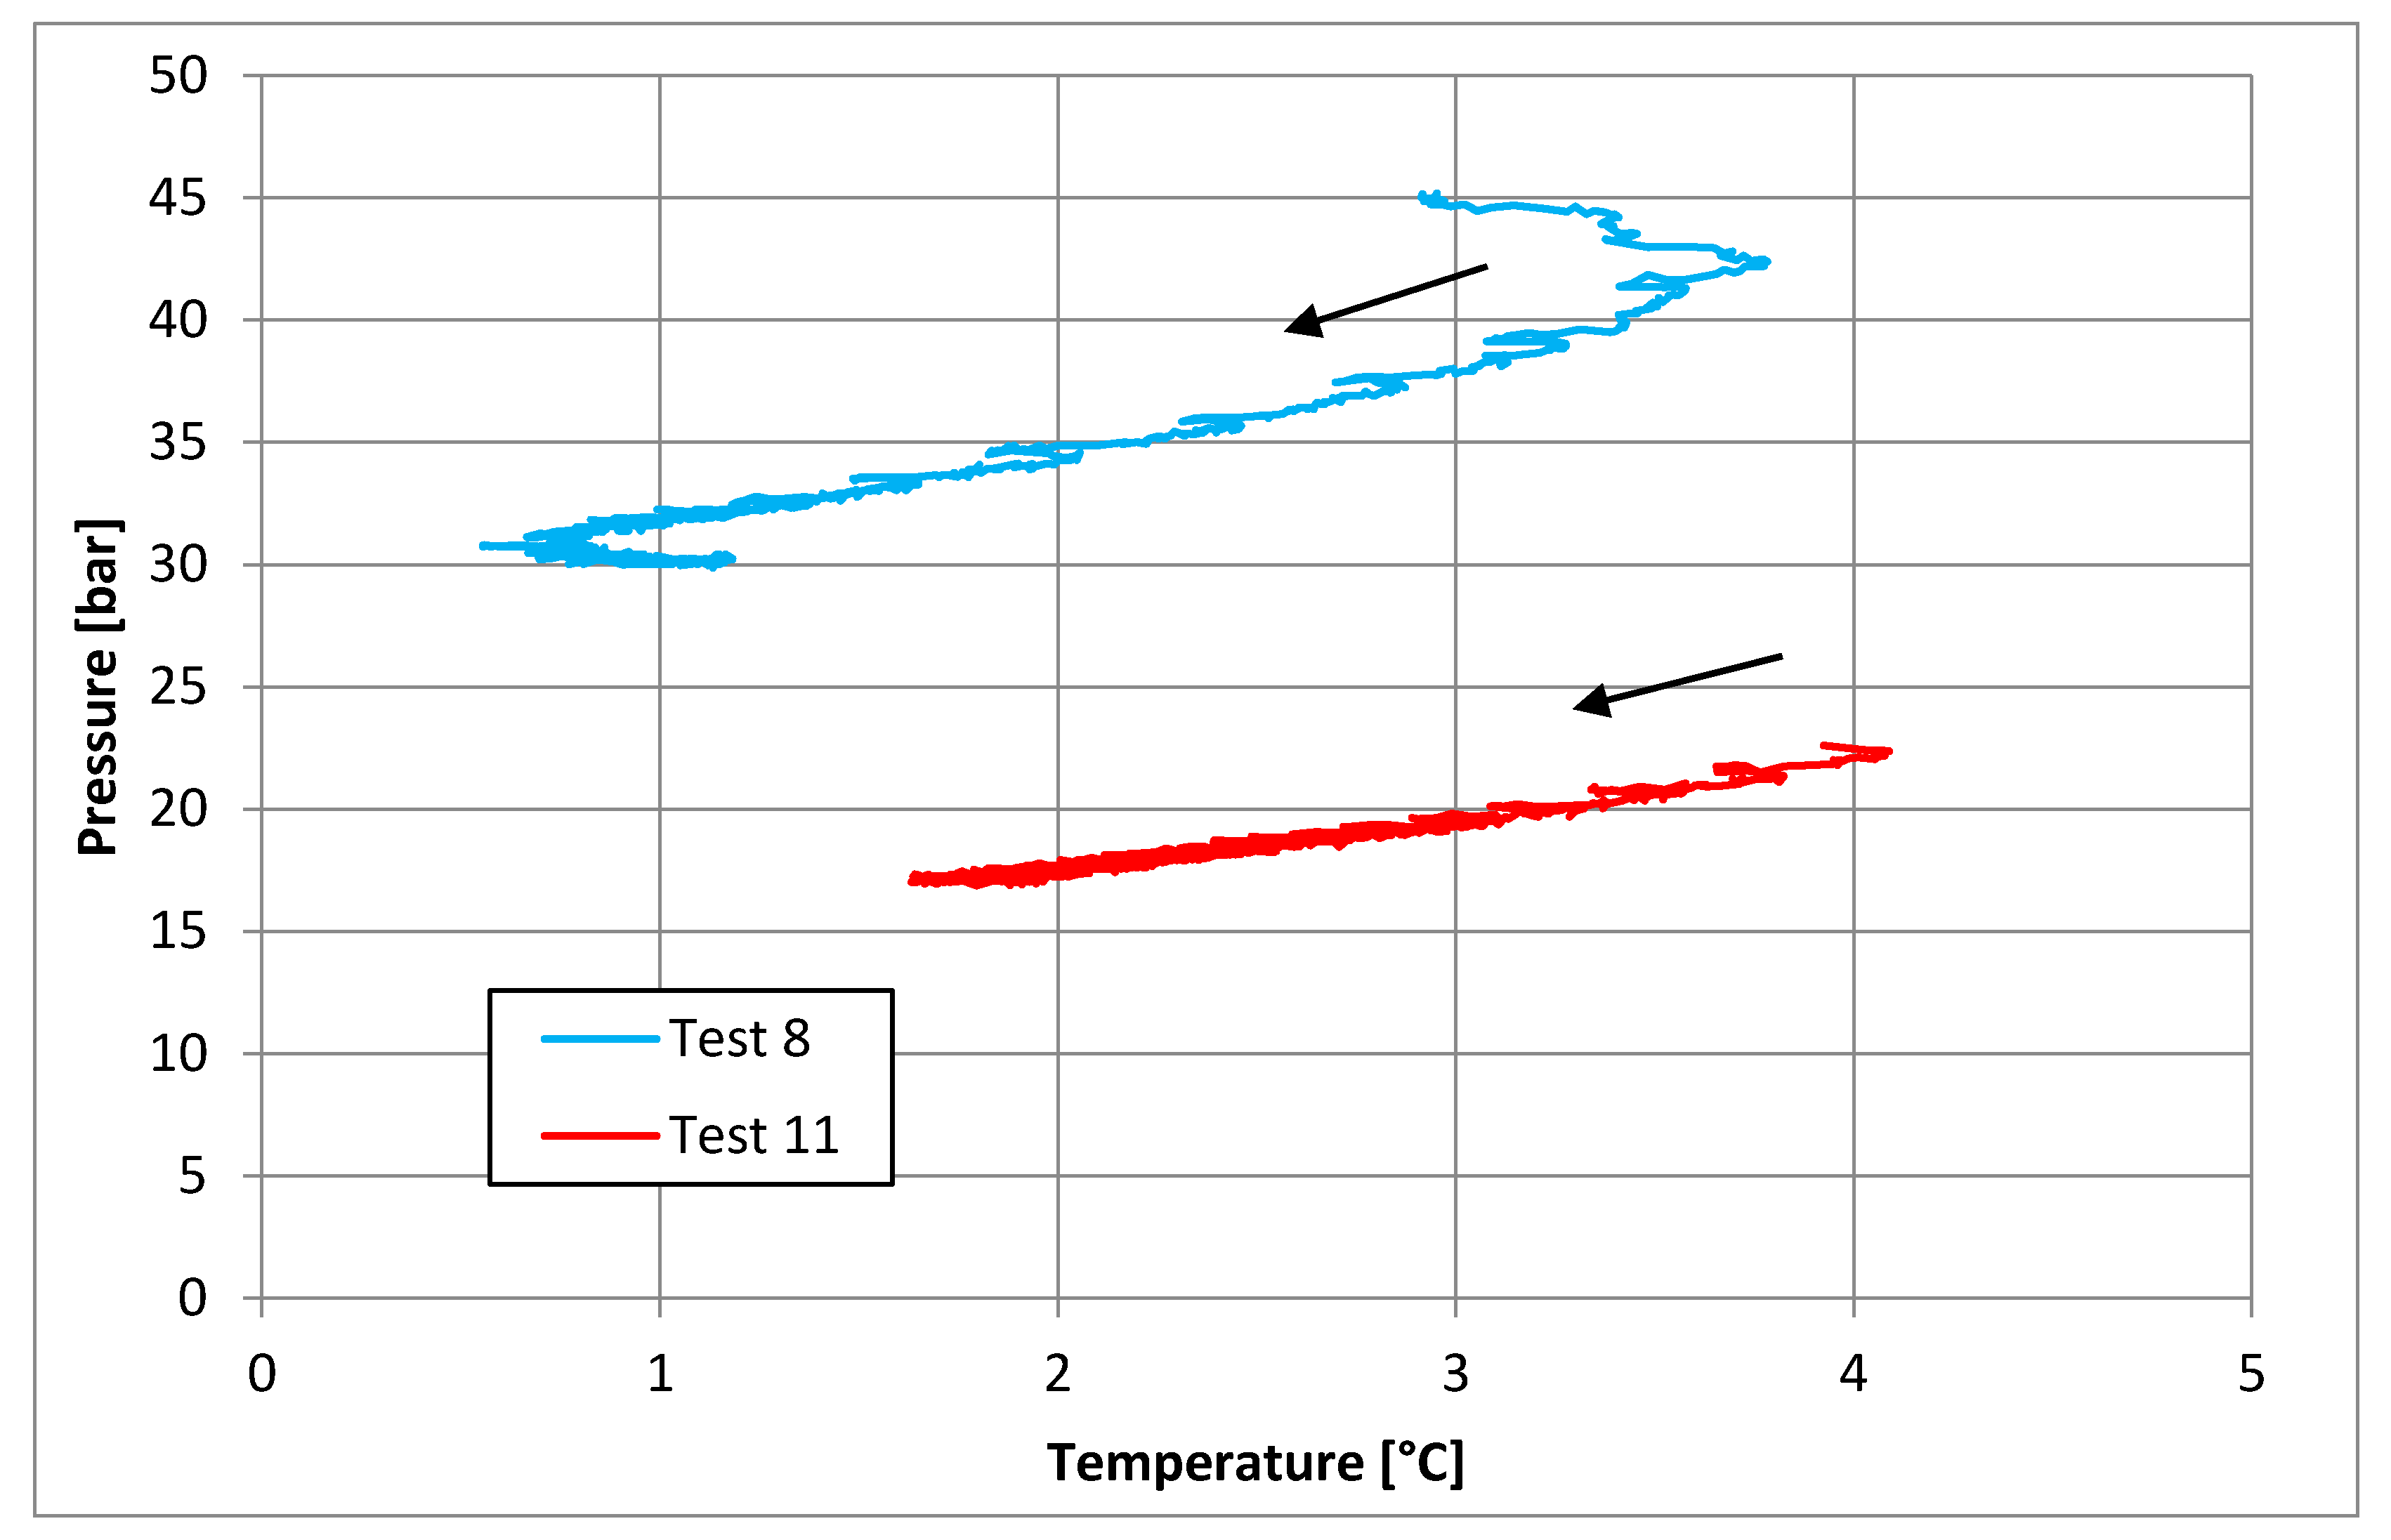
| Parameters | Test 8 | Test 11 | Measure Units |
|---|---|---|---|
| Pi | 45.17 | 22.60 | bar |
| Ti | 2.95 | 3.92 | °C |
| Pf | 30.12 | 17.24 | bar |
| Tf | 0.93 | 1.93 | °C |
| Zi | 0.95 | 0.89 | - |
| Zf | 0.91 | 0.93 | - |
| molINJ | 0.535 | 0.217 | mol |
| molHYD | 0.215 | 0.082 | mol |
| molDISS | - | 0.005 | mol |
| η | 0.948 | 0.901 | - |
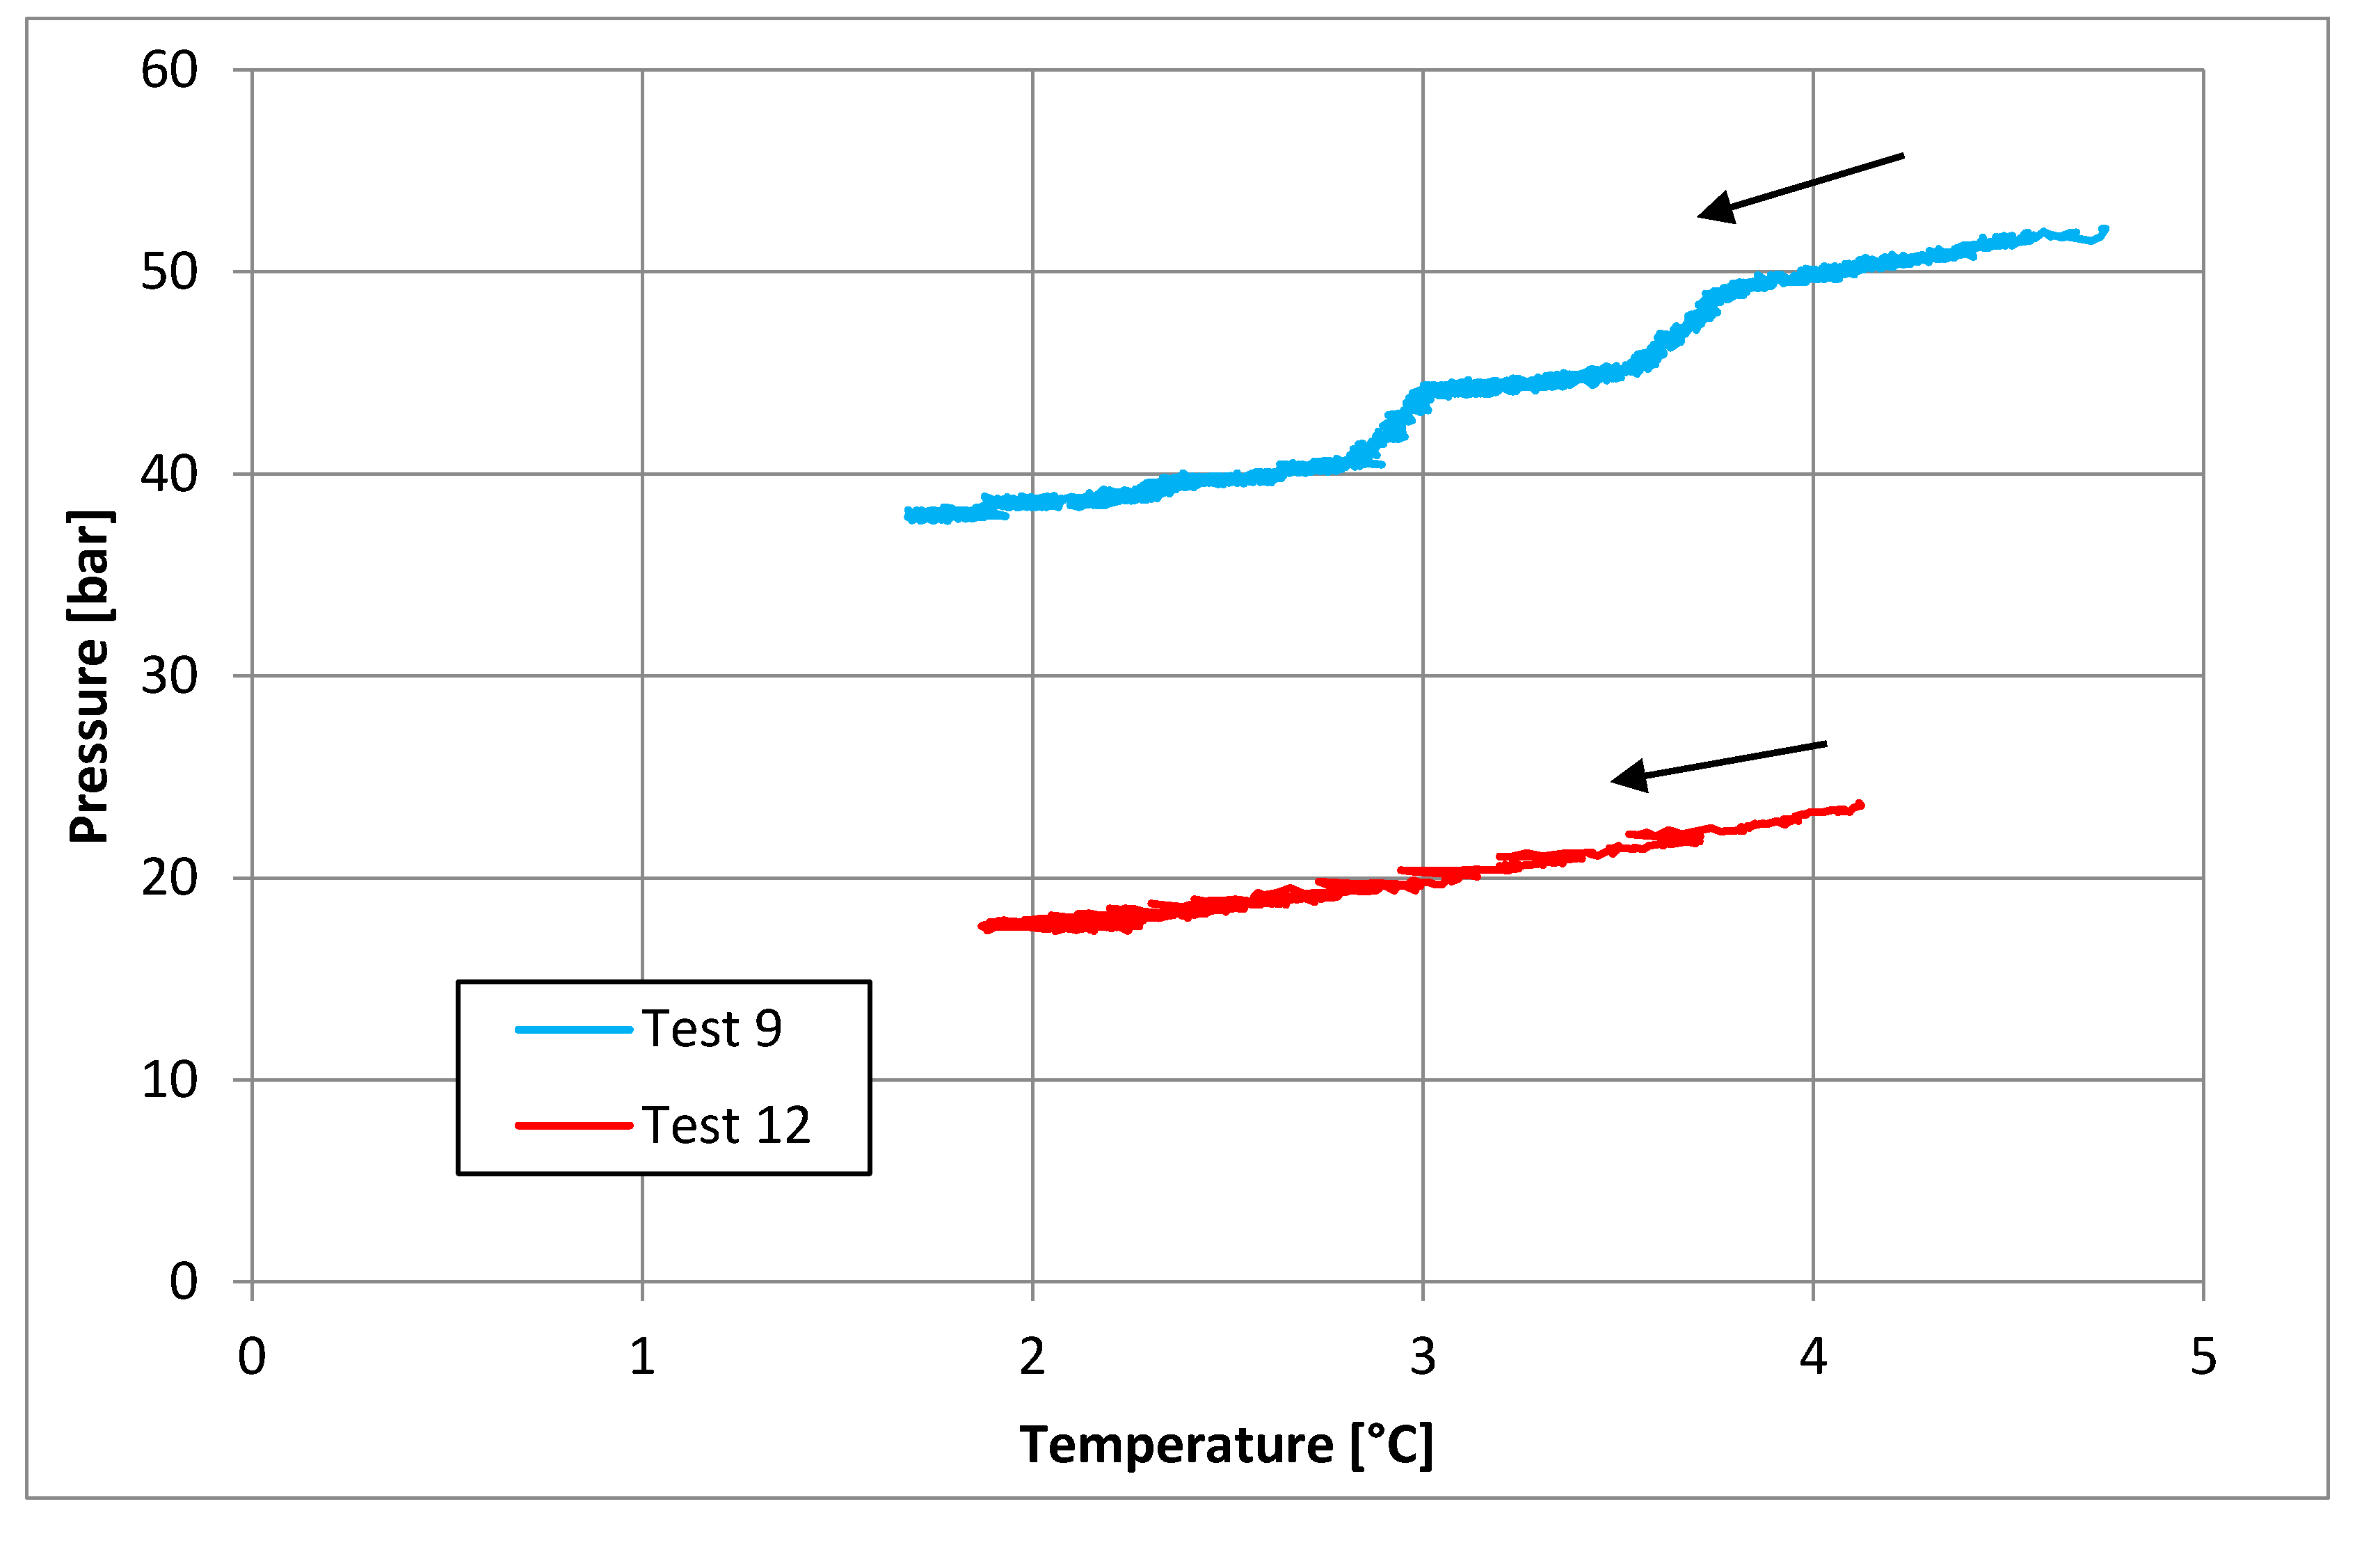
| Parameters | Test 9 | Test 12 | Measure Units |
|---|---|---|---|
| Pi | 52.14 | 24.38 | bar |
| Ti | 3.48 | 2.89 | °C |
| Pf | 38.21 | 17.62 | bar |
| Tf | 0.86 | 2.26 | °C |
| Zi | 0.84 | 0.88 | - |
| Zf | 0.88 | 0.92 | - |
| molINJ | 0.682 | 0.243 | mol |
| molHYD | 0.221 | 0.089 | mol |
| molDISS | - | 0.005 | mol |
| η | 0.747 | 0.882 | - |
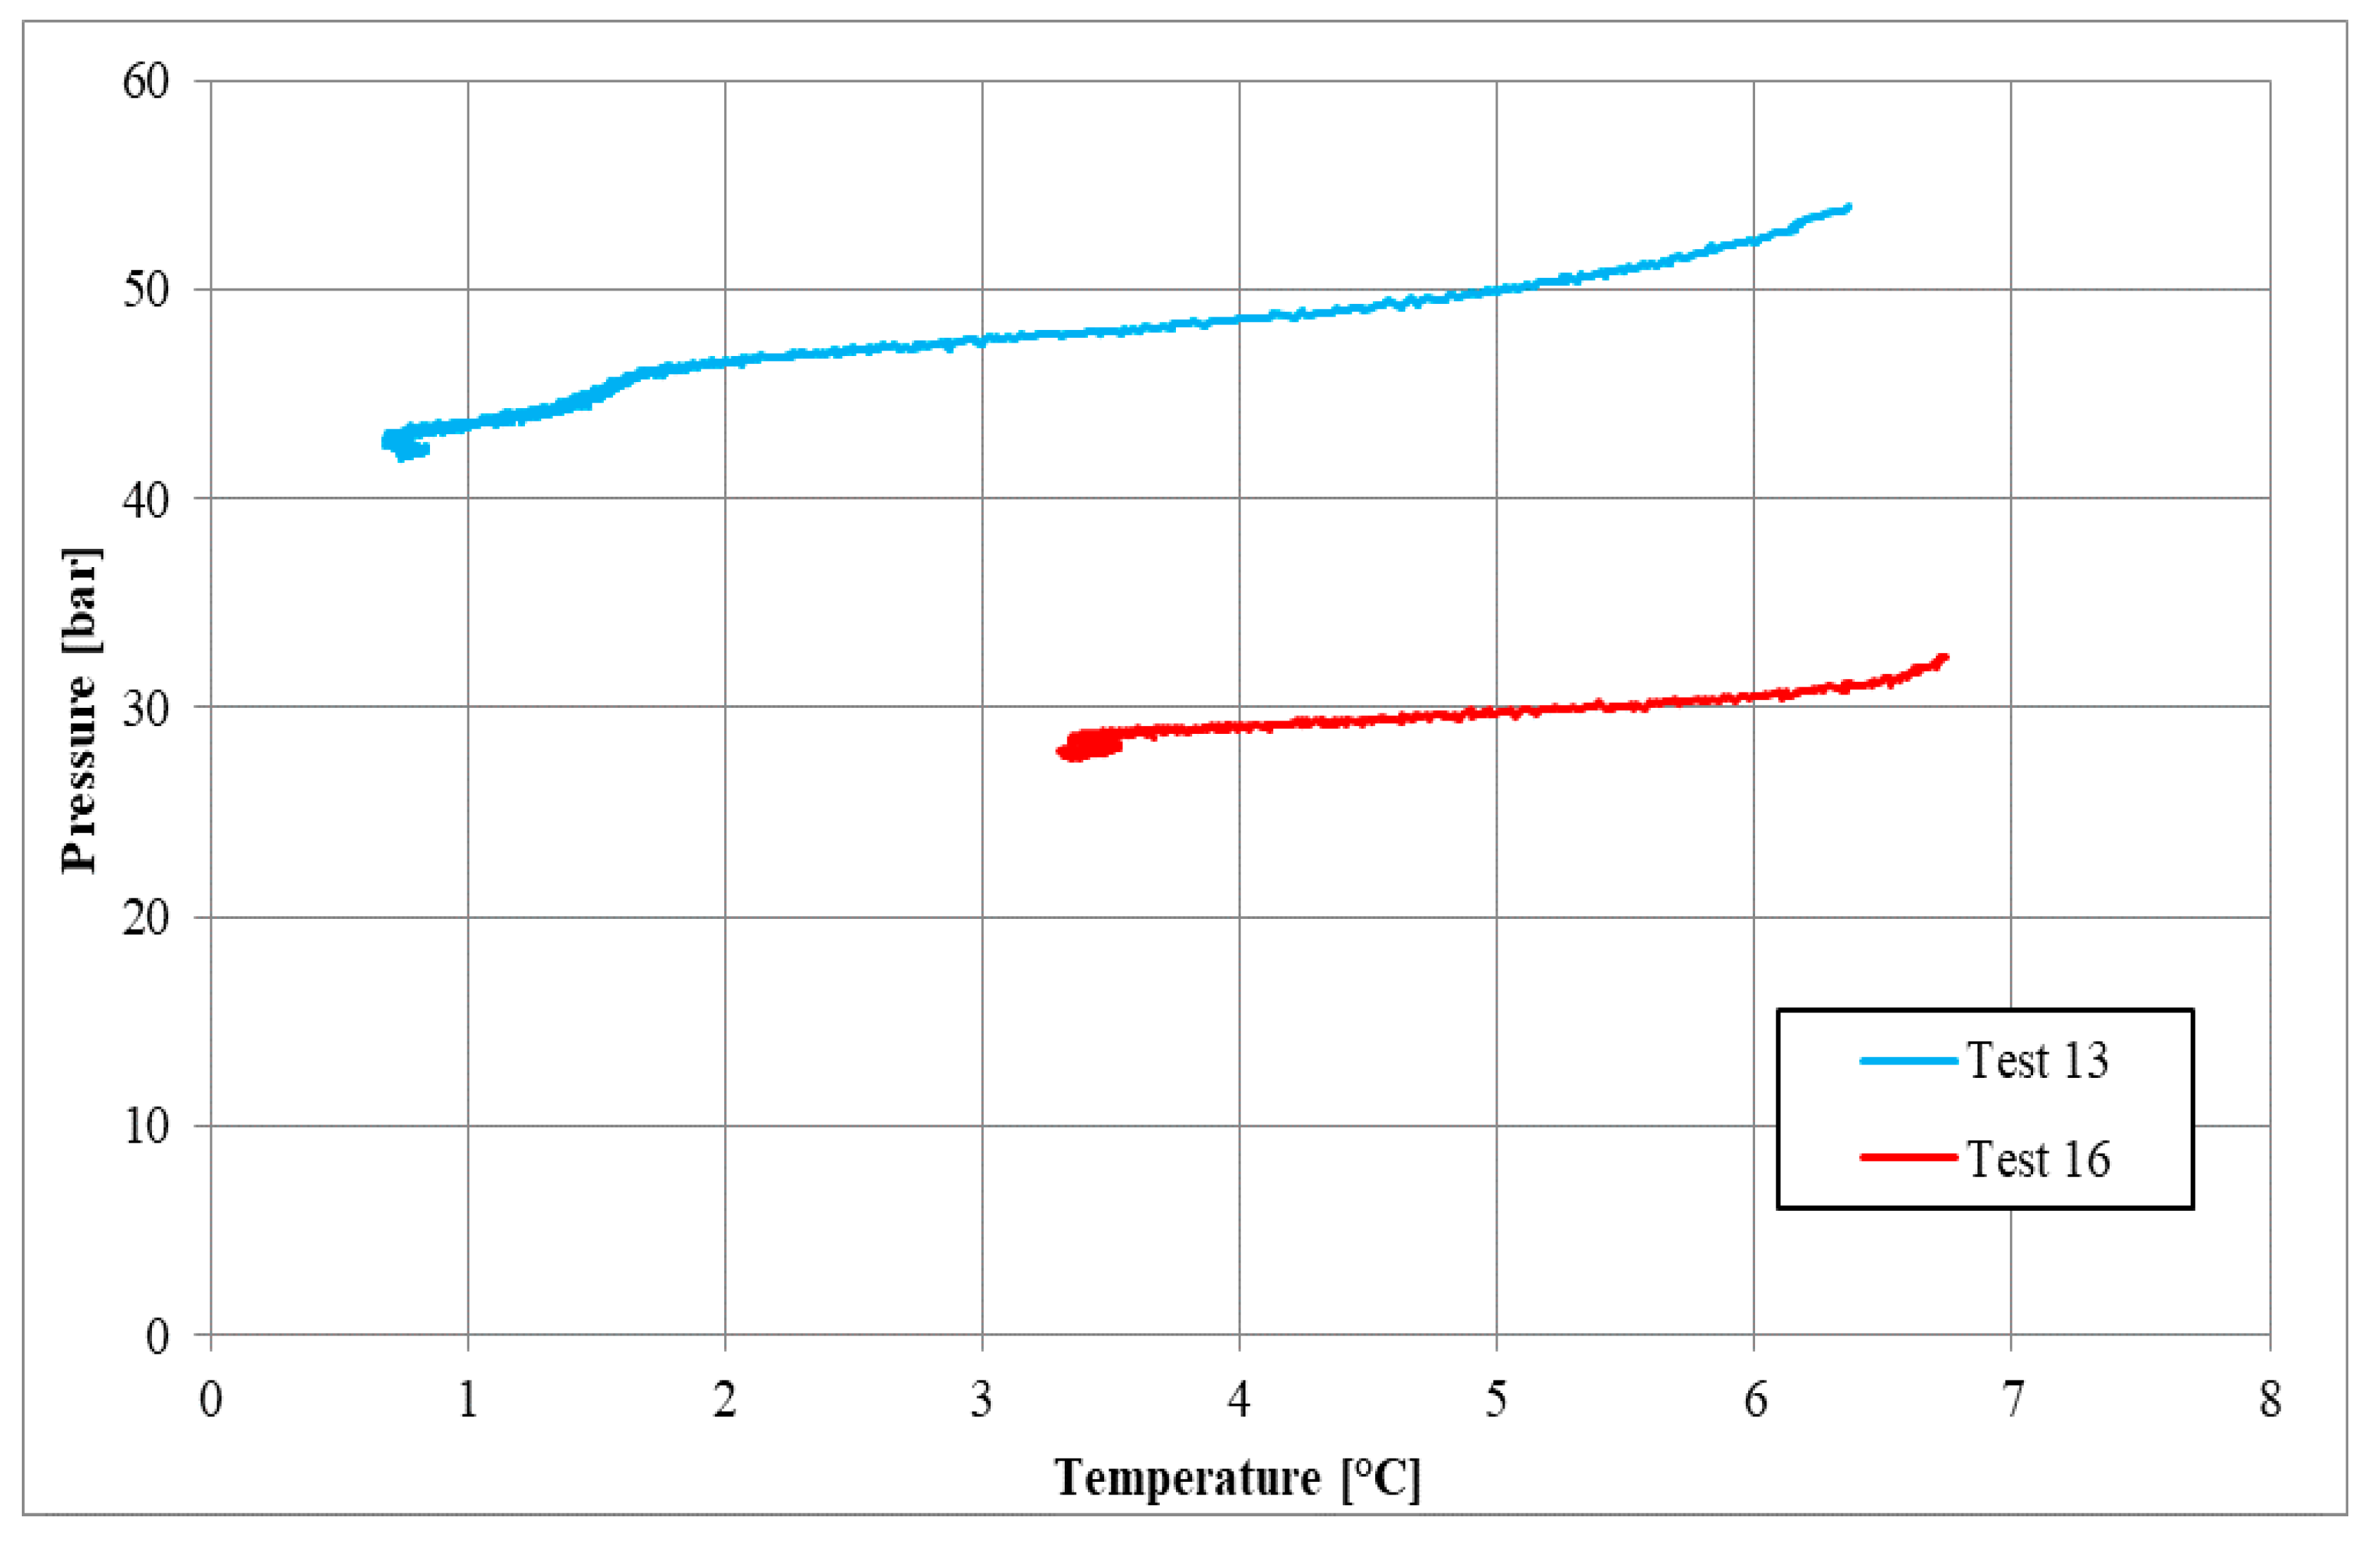
| Parameters | Test 13 | Test 16 | Measure Units |
|---|---|---|---|
| Pi | 54.00 | 32.46 | bar |
| Ti | 6.37 | 6.74 | °C |
| Pf | 42.00 | 27.87 | bar |
| Tf | 0.76 | 3.32 | °C |
| Zi | 0.84 | 0.79 | - |
| Zf | 0.87 | 0.82 | - |
| molINJ | 0.699 | 0.444 | mol |
| molHYD | 0.191 | 0.075 | mol |
| molDISS | - | 0.005 | mol |
| η | 0.696 | 0.624 | - |
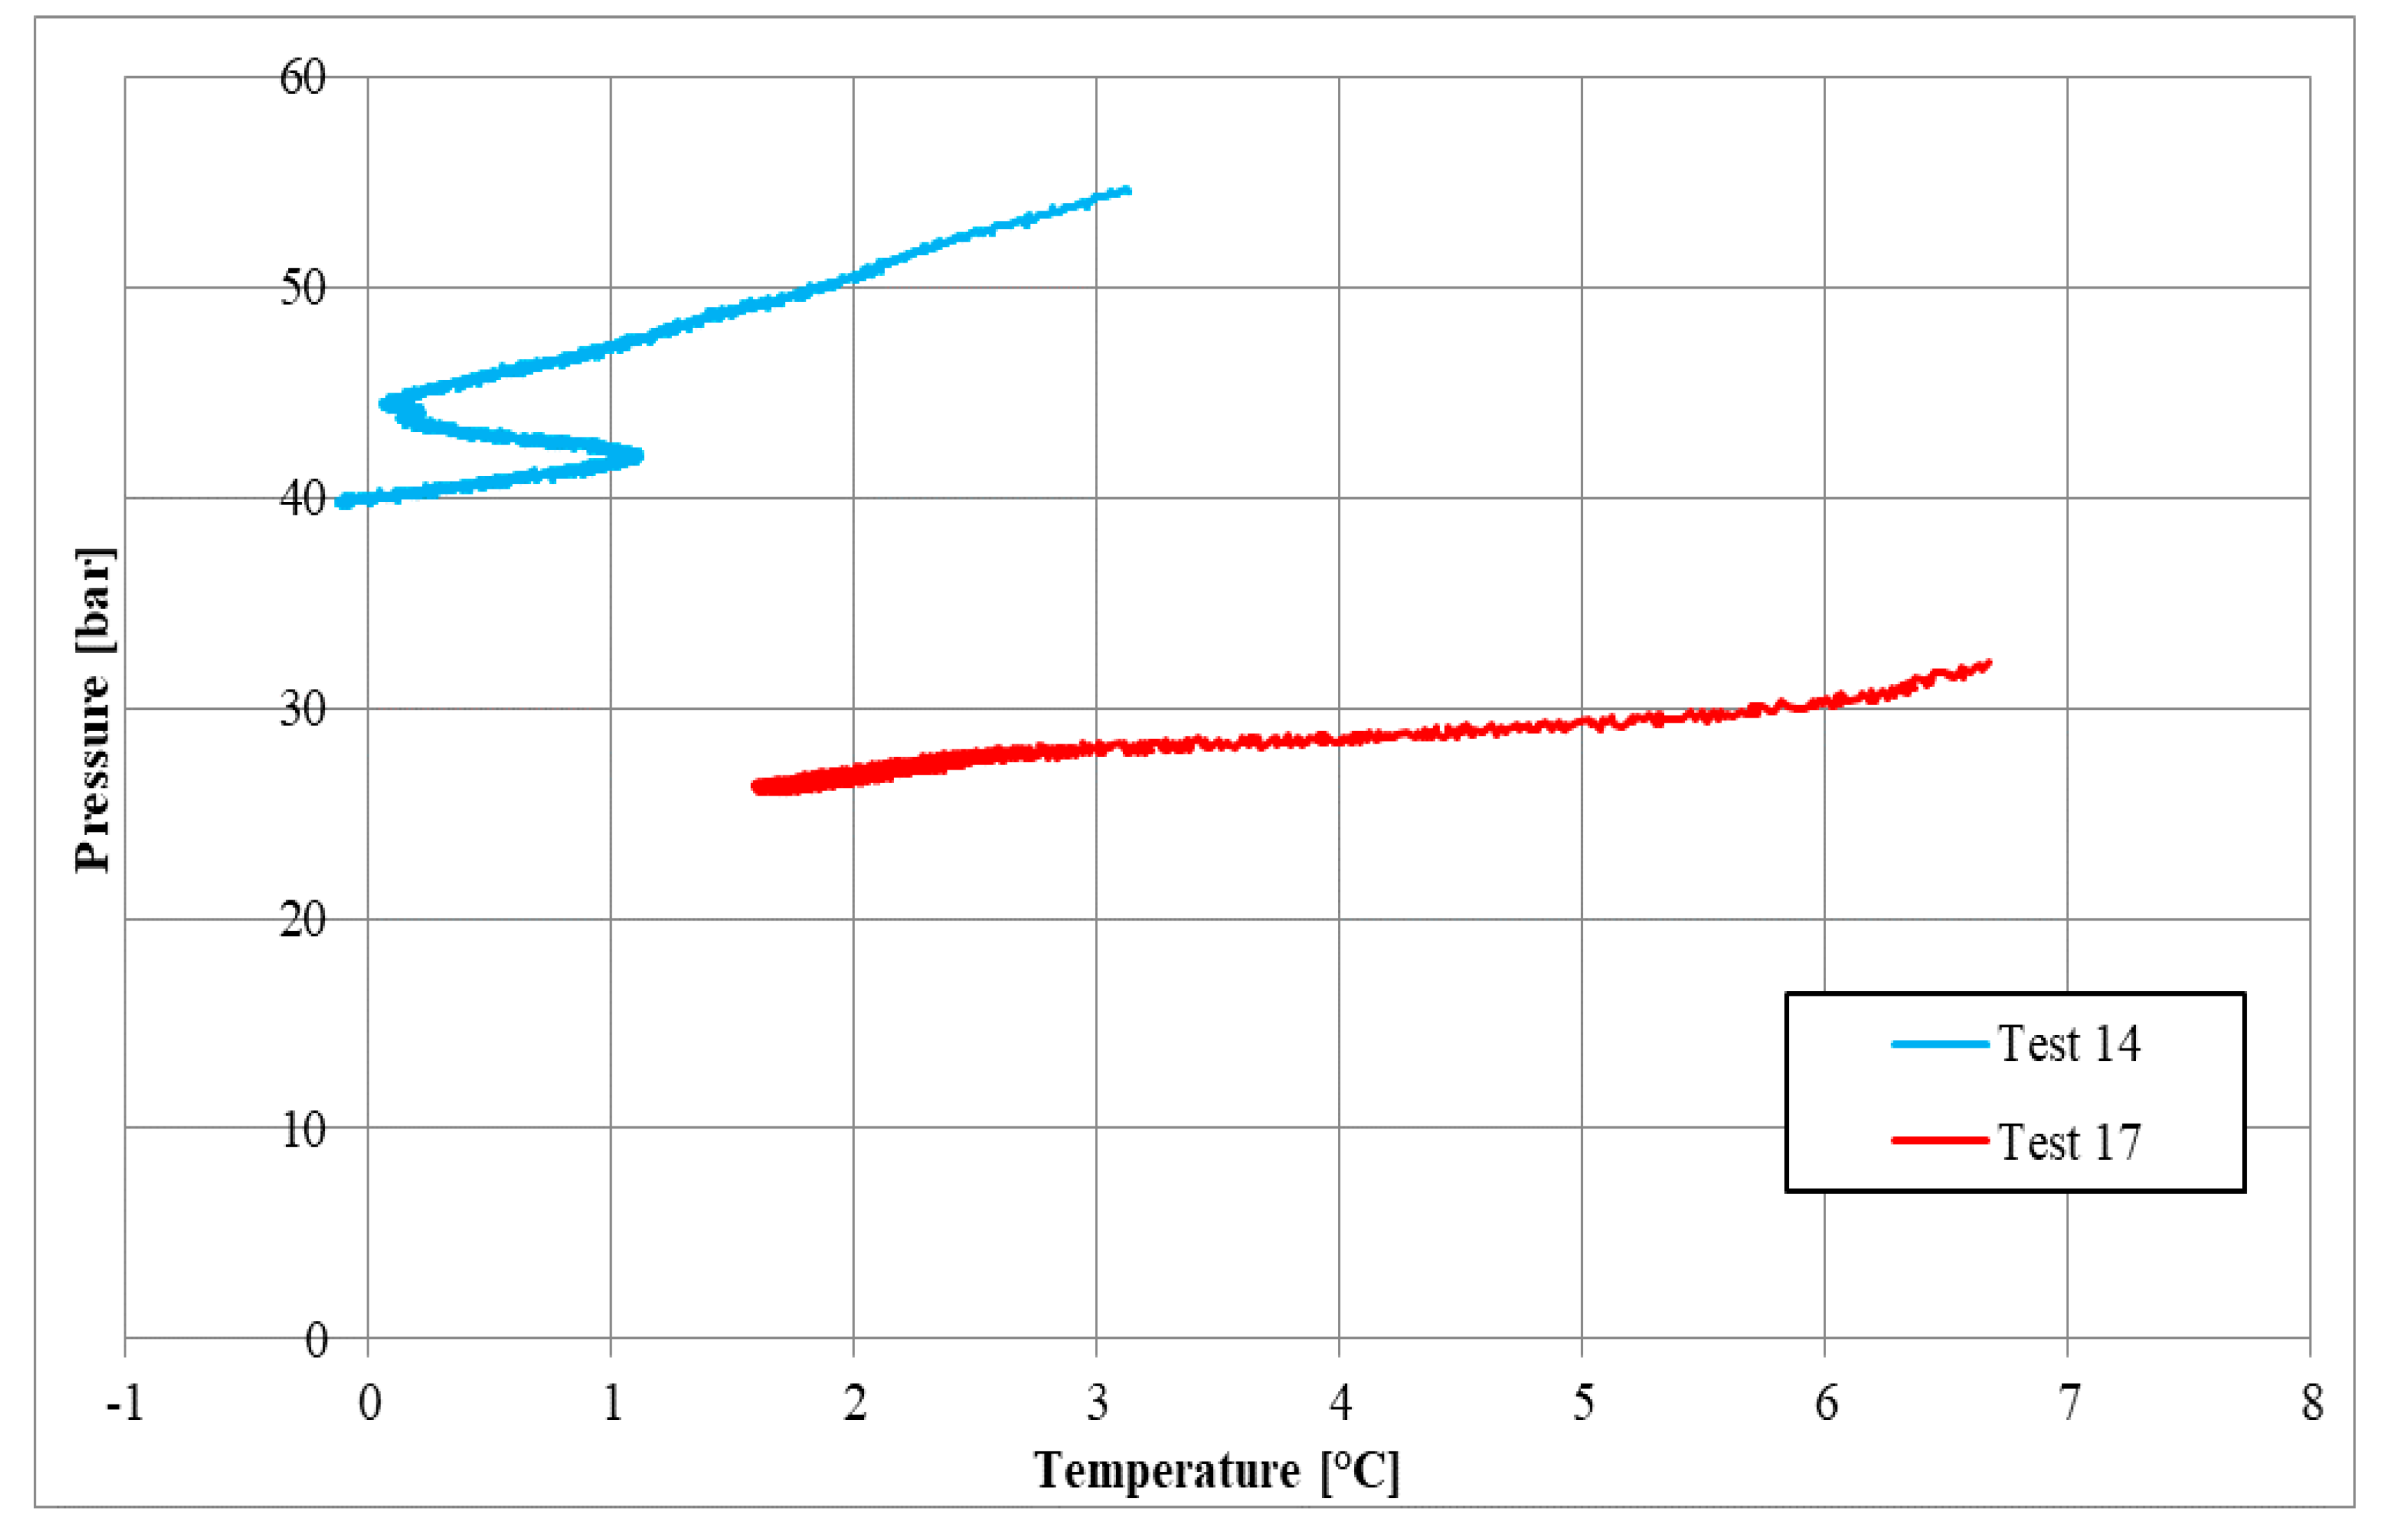
| Parameters | Test 14 | Test 17 | Measure Units |
|---|---|---|---|
| Pi | 54.48 | 32.01 | bar |
| Ti | 5.43 | 6.66 | °C |
| Pf | 39.12 | 26.34 | bar |
| Tf | 1.63 | 1.68 | °C |
| Zi | 0.84 | 0.80 | - |
| Zf | 0.88 | 0.83 | - |
| molINJ | 0.710 | 0.437 | mol |
| molHYD | 0.242 | 0.089 | mol |
| molDISS | - | 0.005 | mol |
| η | 0.730 | 0.528 | - |
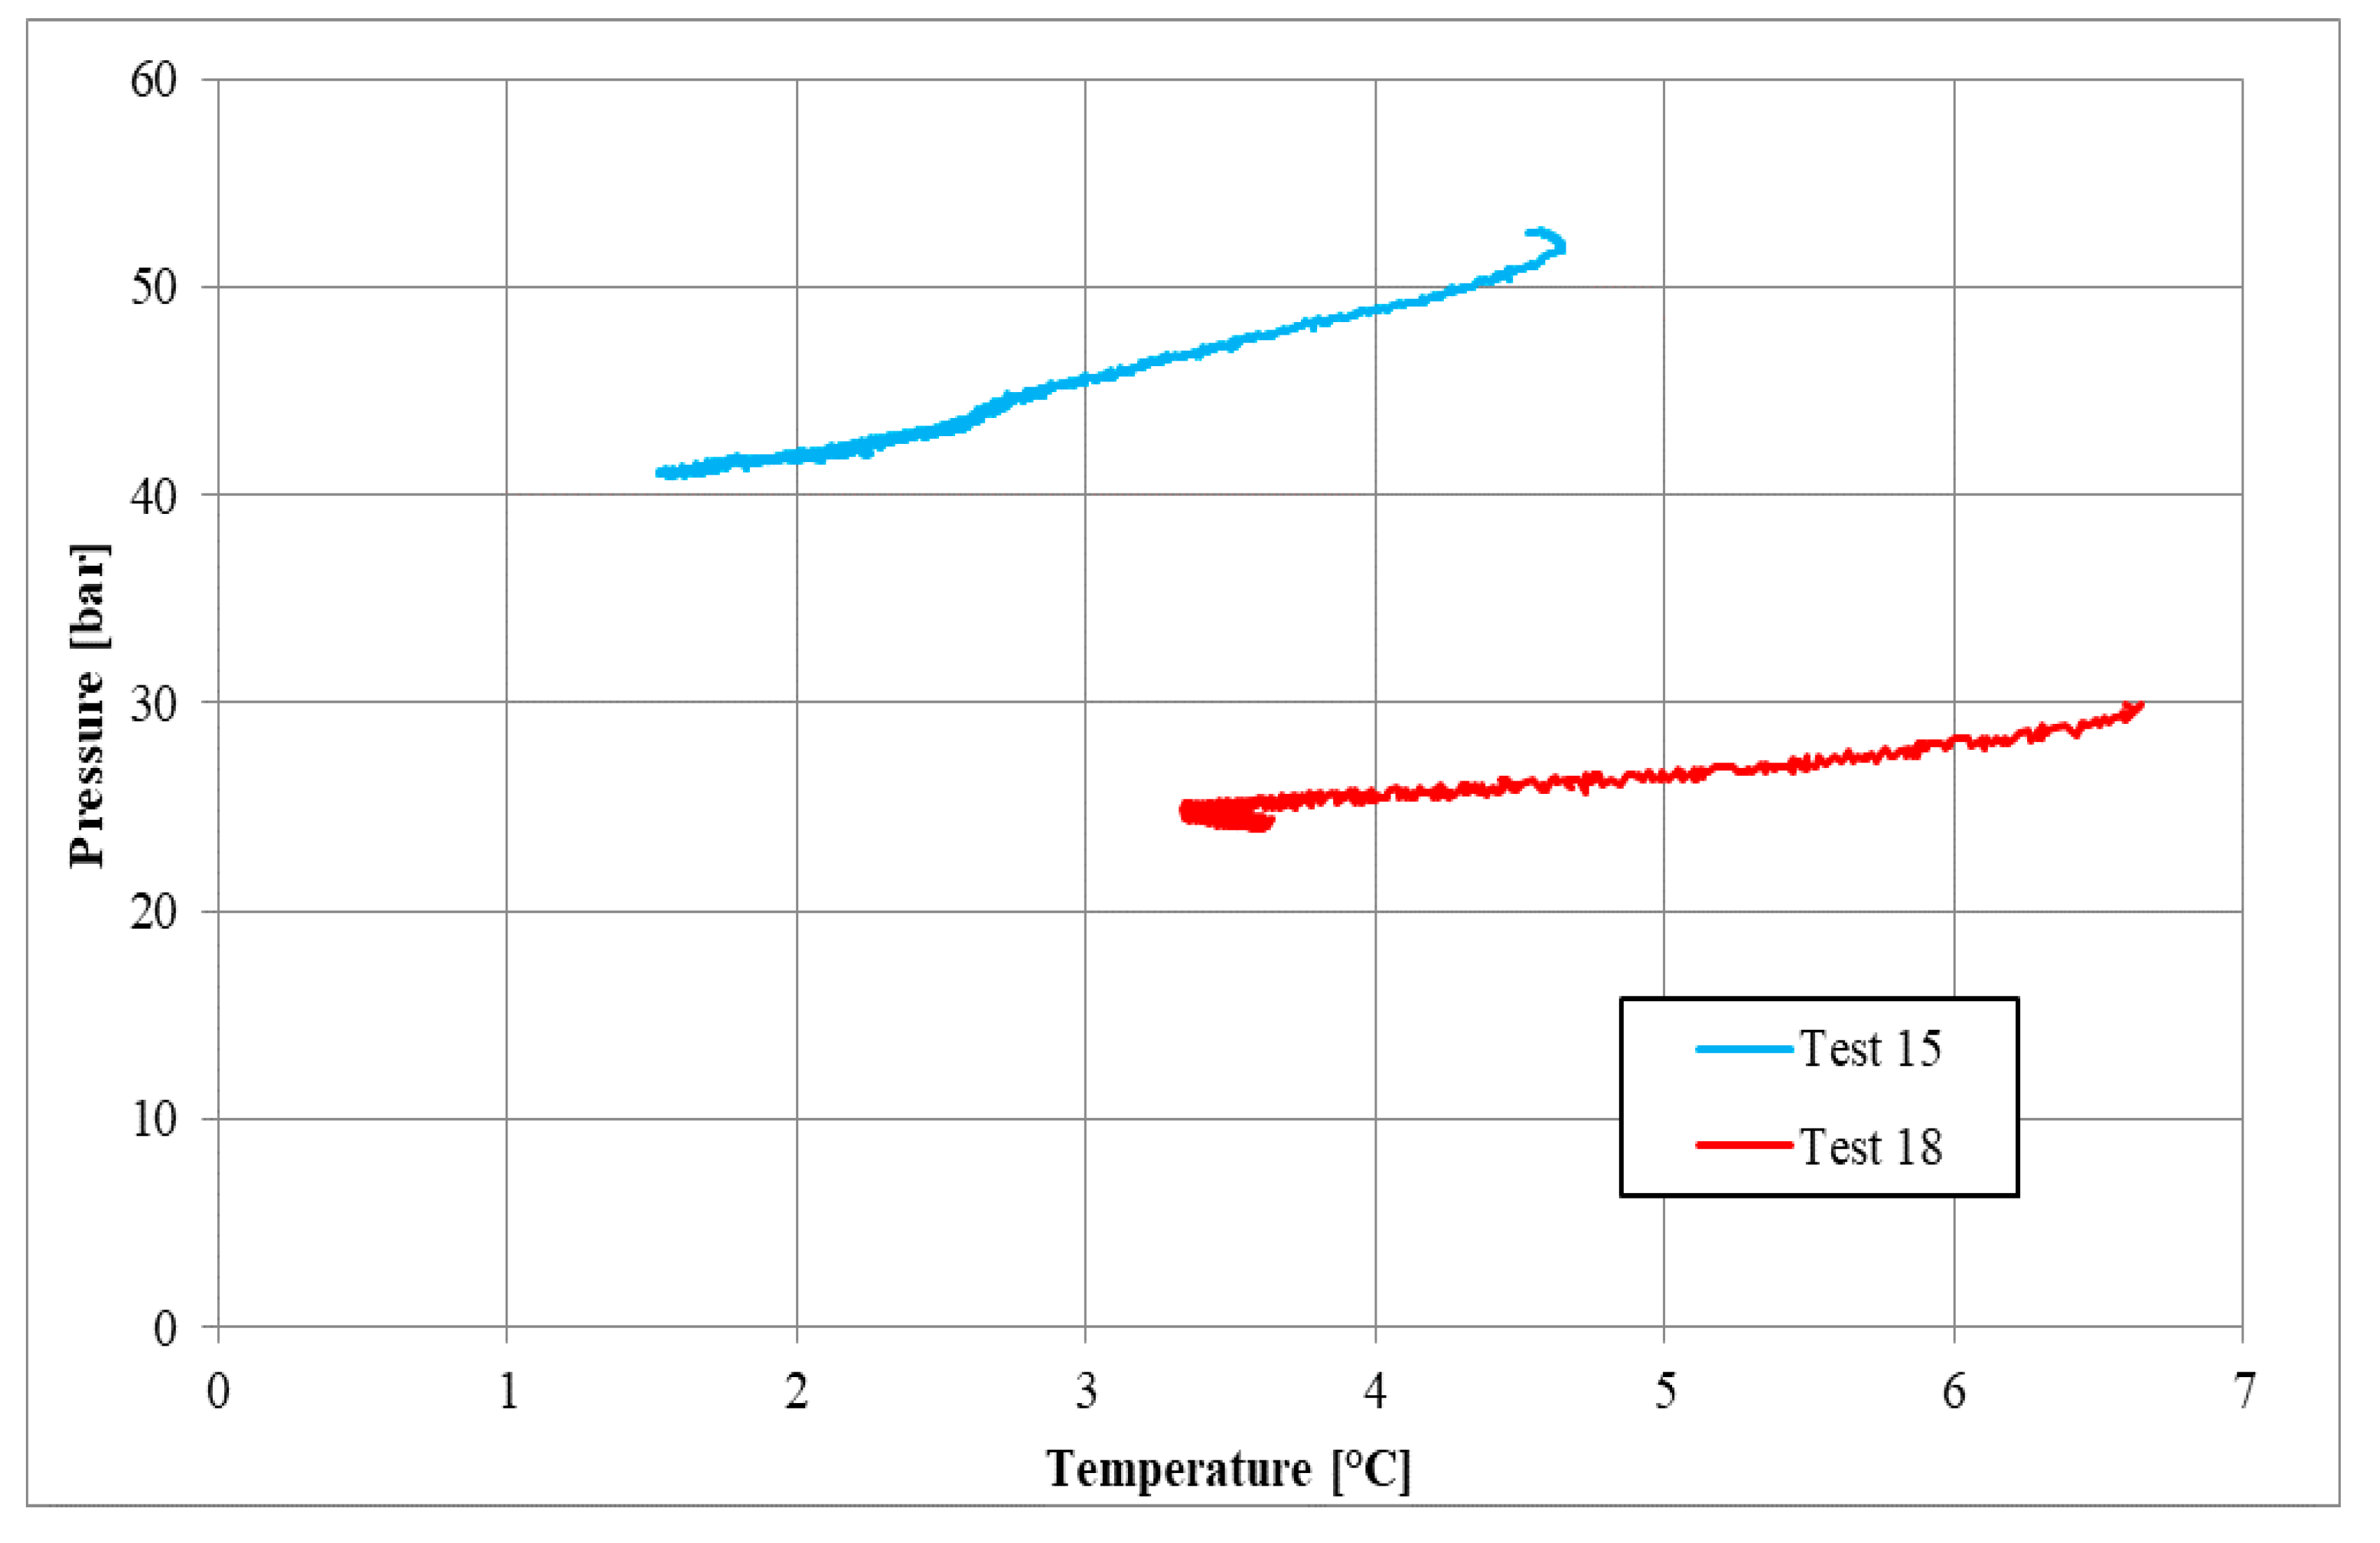
| Parameters | Test 15 | Test 18 | Measure Units |
|---|---|---|---|
| Pi | 52.63 | 29.94 | bar |
| Ti | 4.53 | 6.69 | °C |
| Pf | 41.14 | 24.26 | bar |
| Tf | 1.52 | 3.59 | °C |
| Zi | 0.84 | 0.81 | - |
| Zf | 0.87 | 0.85 | - |
| molINJ | 0.684 | 0.401 | mol |
| molHYD | 0.186 | 0.088 | mol |
| molDISS | - | 0.005 | mol |
| η | 0.694 | 0.716 | - |
| Test no | Pi [bar] | Pf [bar] | η |
|---|---|---|---|
| 1 | 45.52 | 34.72 | 0.967 |
| 2 | 44.60 | 31.65 | 0.911 |
| 3 | 43.19 | 30.03 | 0.989 |
| 4 | 65.81 | 46.36 | 0.840 |
| 5 | 54.59 | 39.55 | 0.730 |
| 6 | 59.12 | 51.17 | 0.663 |
| 7 | 68.70 | 62.71 | 0.500 |
| 8 | 67.77 | 58.16 | 0.507 |
| 9 | 70.08 | 60.65 | 0.540 |
| Tests without Salt | Tests with 32 g/L of Salt | Tests with 37 g/L of Salt | |||||||
|---|---|---|---|---|---|---|---|---|---|
| T (°C) | PCH4 (bar) | PCO2 (bar) | ΔP (bar) | PCH4 (bar) | PCO2 (bar) | ΔP (bar) | PCH4 (bar) | PCO2 (bar) | ΔP (bar) |
| 3.8 | 34.90 | 22.69 | 12.21 | 42.52 | 22.36 | 20.16 | 48.34 | 28.67 | 19.67 |
| 3.6 | 34.43 | 22.22 | 12.21 | 41.83 | 22.07 | 19.76 | 47.66 | 28.49 | 19.17 |
| 3.4 | 33.77 | 21.36 | 12.41 | 39.54 | 21.26 | 18.28 | 47.01 | 28.37 | 18.64 |
| 3.2 | 33.31 | 20.97 | 12.34 | 38.66 | 20.39 | 18.27 | 46.36 | 28.15 | 18.21 |
| 3.0 | 31.88 | 20.95 | 10.93 | 37.79 | 20.35 | 17.44 | 45.67 | 28.02 | 17.65 |
| 2.8 | 30.89 | 20.63 | 10.26 | 36.89 | 19.26 | 17.63 | 44.85 | 27.88 | 16.97 |
| 2.6 | 30.57 | 20.31 | 10.26 | 36.42 | 18.85 | 17.57 | 43.54 | 27.87 | 15.67 |
| 2.4 | 30.01 | 19.87 | 10.14 | 35.79 | 18.46 | 17.33 | 42.86 | 27.79 | 15.07 |
| 2.2 | 29.13 | 19.73 | 9.40 | 35.01 | 18.14 | 16.87 | 42.36 | 26.96 | 15.40 |
| 2.0 | 28.86 | 19.31 | 9.55 | 34.88 | 17.92 | 16.96 | 41.95 | 26.55 | 15.40 |
| Temperature (°C) | Pressure (bar) | NaCl (wt%) | Reference |
|---|---|---|---|
| 0.2 | 3.2 | 5 | [65] |
| 0.7 | 3.31 | 5 | [65] |
| 1.1 | 3.58 | 5 | [66] |
| 1.2 | 3.22 | 10 | [66] |
| 2.1 | 3.73 | 3.35 | [67] |
| 3.3 | 3.94 | 3 | [65] |
| 4.4 | 5 | 10 | [66] |
| 5.3 | 4.85 | 3 | [65] |
| 5.9 | 6.03 | 10 | [66] |
| 6.6 | 9.13 | 10.47 | [67] |
| 6.9 | 6.31 | 5 | [65] |
| 8.1 | 10.59 | 10.47 | [67] |
| 10.6 | 12.73 | 10.47 | [67] |
| Temperature (°C) | Pressure (bar) | NaCl conc. | Reference |
|---|---|---|---|
| 1.3 | 1.37 | 5 wt% | [66] |
| 1.3 | 1.83 | 5 wt% | [66] |
| 1.4 | 1.74 | 0.009 mf | [68] |
| 1.4 | 1.69 | 0.5 mol/L | [69] |
| 2.3 | 1.88 | 0.009 mf | [68] |
| 3 | 3.19 | 2 mol/L | [69] |
| 3.7 | 3.53 | 2 mol/L | [69] |
| 4 | 2.12 | 0.009 mf | [68] |
| 4.2 | 2.74 | 1 mol/L | [69] |
| 4.8 | 2.15 | 0.009 mf | [68] |
| 5.5 | 2.21 | 0.009 mf | [68] |
| 6.2 | 3.38 | 1 mol/L | [69] |
| 7.1 | 3.73 | 5 wt% | [66] |
Publisher’s Note: MDPI stays neutral with regard to jurisdictional claims in published maps and institutional affiliations. |
© 2020 by the authors. Licensee MDPI, Basel, Switzerland. This article is an open access article distributed under the terms and conditions of the Creative Commons Attribution (CC BY) license (http://creativecommons.org/licenses/by/4.0/).
Share and Cite
Gambelli, A.M.; Castellani, B.; Nicolini, A.; Rossi, F. Water Salinity as Potential Aid for Improving the Carbon Dioxide Replacement Process’ Effectiveness in Natural Gas Hydrate Reservoirs. Processes 2020, 8, 1298. https://doi.org/10.3390/pr8101298
Gambelli AM, Castellani B, Nicolini A, Rossi F. Water Salinity as Potential Aid for Improving the Carbon Dioxide Replacement Process’ Effectiveness in Natural Gas Hydrate Reservoirs. Processes. 2020; 8(10):1298. https://doi.org/10.3390/pr8101298
Chicago/Turabian StyleGambelli, Alberto Maria, Beatrice Castellani, Andrea Nicolini, and Federico Rossi. 2020. "Water Salinity as Potential Aid for Improving the Carbon Dioxide Replacement Process’ Effectiveness in Natural Gas Hydrate Reservoirs" Processes 8, no. 10: 1298. https://doi.org/10.3390/pr8101298