A Method of Bending Shrinkage Groove on Vortex Suppression and Energy Improvement for a Hydrofoil with Tip Gap


1
State Key Laboratory of Hydroscience and Engineering, Department of Energy and Power Engineering, Tsinghua University, Beijing 100084, China
2
College of Marine Power Engineering, Naval University of Engineering, Wuhan 430033, China
*
Author to whom correspondence should be addressed.
Processes 2020, 8(10), 1299; https://doi.org/10.3390/pr8101299
Submission received: 16 September 2020
/
Revised: 9 October 2020
/
Accepted: 13 October 2020
/
Published: 16 October 2020
(This article belongs to the Section Energy Systems)
Abstract
:Hydro energy is a kind of typical renewable energy, which can be converted by hydraulic machinery. However, tip leakage vortex (TLV) has a significant negative influence on the flow pattern and energy performance of hydraulic machinery. In this paper, a bending shrinkage groove (BSG) is proposed to suppress the TLV and improve the energy performance of a hydrofoil first, and then a parametric optimization design method is briefly introduced and applied to determine the optimal configuration of the groove. The main geometric parameters of the groove are selected as optimized variables and three different groove configurations are selected from the optimization result. Finally, the performance improvement of the hydrofoil with groove, the sensitivity analysis of the optimization variables, and the groove impacts on the TLV and flow patterns are investigated. The results demonstrate that the preferred groove reduces the non-dimensional Q criterion vortex isosurfaces area (Qarea = 2 × 107) by 5.13% and increases the lift drag ratio by 17.02%, comparing to the origin hydrofoil. Groove depth d and groove width w are proved to have more significant impacts on the hydrofoil energy performance. The TLV and flow patterns are greatly affected by the different BSG configurations, and the wider BSG contributed to reducing the area of TLV, at the cost of energy performance deterioration.
1. Introduction
Hydraulic machinery with the blade tip gap is widely applied in power generation [1,2], farmland irrigation [3], waterlogging drainage, sewage treatment [4], and other similar activities [5]. However, the tip leakage vortex (TLV) caused by tip clearance may seriously affect the primary stream flow in hydraulic machinery, resulting in the enhancement of pressure fluctuation [6], cavitation performance deterioration [7], and energy performance degradation [8,9]. Therefore, it is necessary to explore an efficient strategy to suppress the TLV.
Much research has been carried out in the aspects of the blade tip gap effects on energy performance and TLV for hydraulic machinery. For the aspect of energy performance, Bing et al. [10] found that the external characteristics of a mixed-flow pump decreased with the tip clearance increase by the experimental method. Similarly, Bing et al. [11] conducted the hydraulic performance test of a mixed-flow pump with different blade tip clearances and various blade angle errors and proved that the efficiency, the head, and the shaft power of the mixed-flow pump all decrease with the increase of the blade tip clearance under any flow rate. The same phenomenon was also found in impulse turbine [12], Wells turbine [1], and axial flow waterjet [13]. These studies indicated that the effects of tip clearance on energy performance should not be neglected.
The gap between the blade tip and casing results in a leakage flow crossing the tip and then develops into the TLV. This is the main reason for the performance drop in hydro machinery. For the aspect of TLV, Inoue et al. [14] carried out performance testing and detailed flow measurement in an axial compressor rotor with various tip clearances and found that the tip leakage vortex rolled up more intensely with the tip clearance growth, resulting in efficiency and input power drop. Besides, some simplified theoretical models are developed to simulate the tip leakage flow, e.g., the compound vortex model [15]. Miorini et al. [16] explored the internal structure of the tip leakage vortex in an axial waterjet pump and the results showed that the TLV was incepted near the blade tip around 0.2–0.3 times chord. The same conclusion was also proved by You et al. [17,18]. Considering the inception location of the TLV, some local optimization methods were proposed to suppress the TLV. Two hydrofoils with round and sharp tip edges under variable incidence angle and tip clearance were studied by Guo et al. [19] and found that the sharp foil tip reduced the isosurfaces area of TLV remarkably. Although there are some related research studies on TLV suppression of hydrofoil, they are not sufficient. A more powerful control method needs to be proposed.
Some advance control strategies were studied in other fluid machinery. Young Cheol et al. [20] studied the groove blade tip effects on the performance of a gas turbine. The results revealed that the groove blade tip held the best performance, comparing to the flat, squealer, dimpled, and chamfered blade tip. A similar method, straight groove, also proved to be helpful in performance improvement [21]. Young-Jin et al. [22,23] investigated the influence of recessed blade tips on the performance of a centrifugal compressor and a transonic axial compressor and found that it could effectively suppress the leakage vortex. Reference [21,24] carried out more comprehensive research of the recessed tip method on an axial fan. Results indicated that the recessed tip could reduce the TLV, but failed to remarkably improve the energy performance. Inspired by the above researches, a bending shrinkage groove (BSG) method is proposed for a hydrofoil, aimed at improving energy performance and suppressing the TLV.
The lift drag ratio and Q criterion vortex are applied to quantify the energy performance and TLV intensity respectively, considering that they are widely adopted and the Q criterion is convenient to illustrate the shape of the vortex [25,26].
In this study, a parametric BSG method is put forward first, then a parametric optimization design method is briefly introduced and applied to optimize the BSG. The minimum TLV area quantified by the area of Q criterion isosurfaces and the maximum energy performance quantified by the lift drag ratio are selected as optimization targets, while the control parameters of the BSG are optimization variables. The reliability of computational fluid dynamics (CFD) simulation is verified by the experiment results [27]. Moreover, the variable sensitivity of the control parameters is studied. Finally, three configurations of BSG are selected to form the optimization result and their effects on TLV and flow patterns are systematically investigated.
2. Research Object
2.1. Basic Physical Model of NACA0009 Hydrofoil
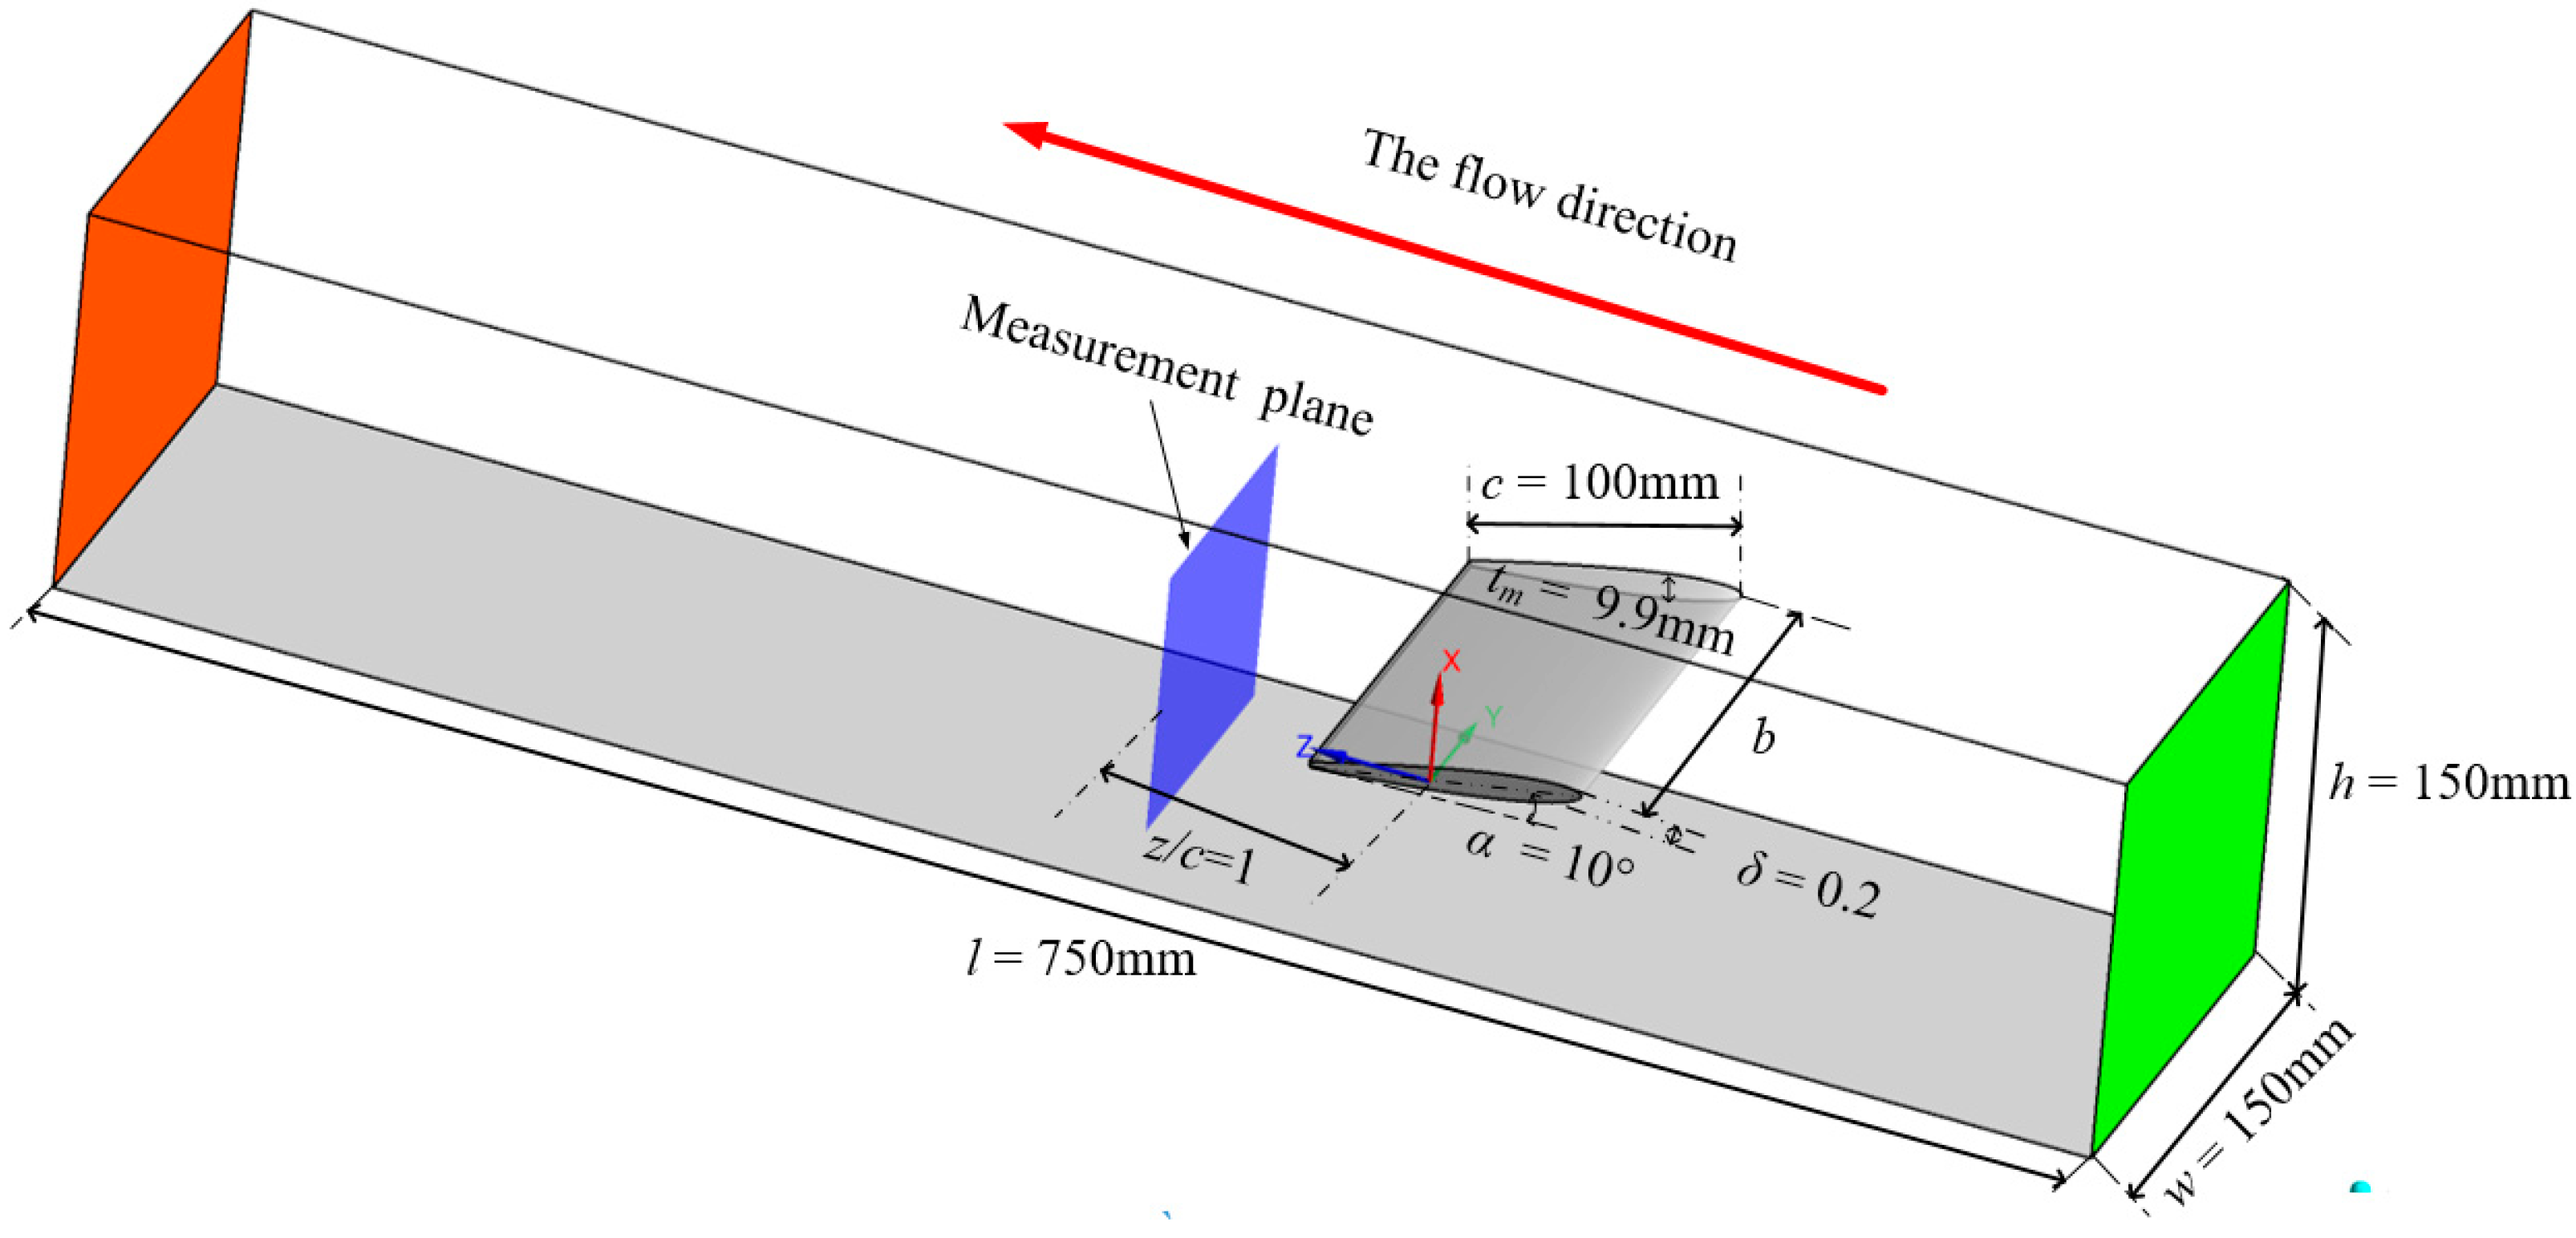
According to [27], a NACA0009 was tested in a straight water tunnel with a 0.15 m wide cross-section and 0.75 m length. In this project, the same model is applied to numerical simulation work. As shown in Figure 1, the incidence angle of the foil is α = 10°. The normalized tip clearance size is δ = 0.2, which is defined by the formula δ = δ0/tm, where tm is the maximum foil thickness. Additionally, the other parameters are enumerated in Figure 1.
2.2. Parametric BSG
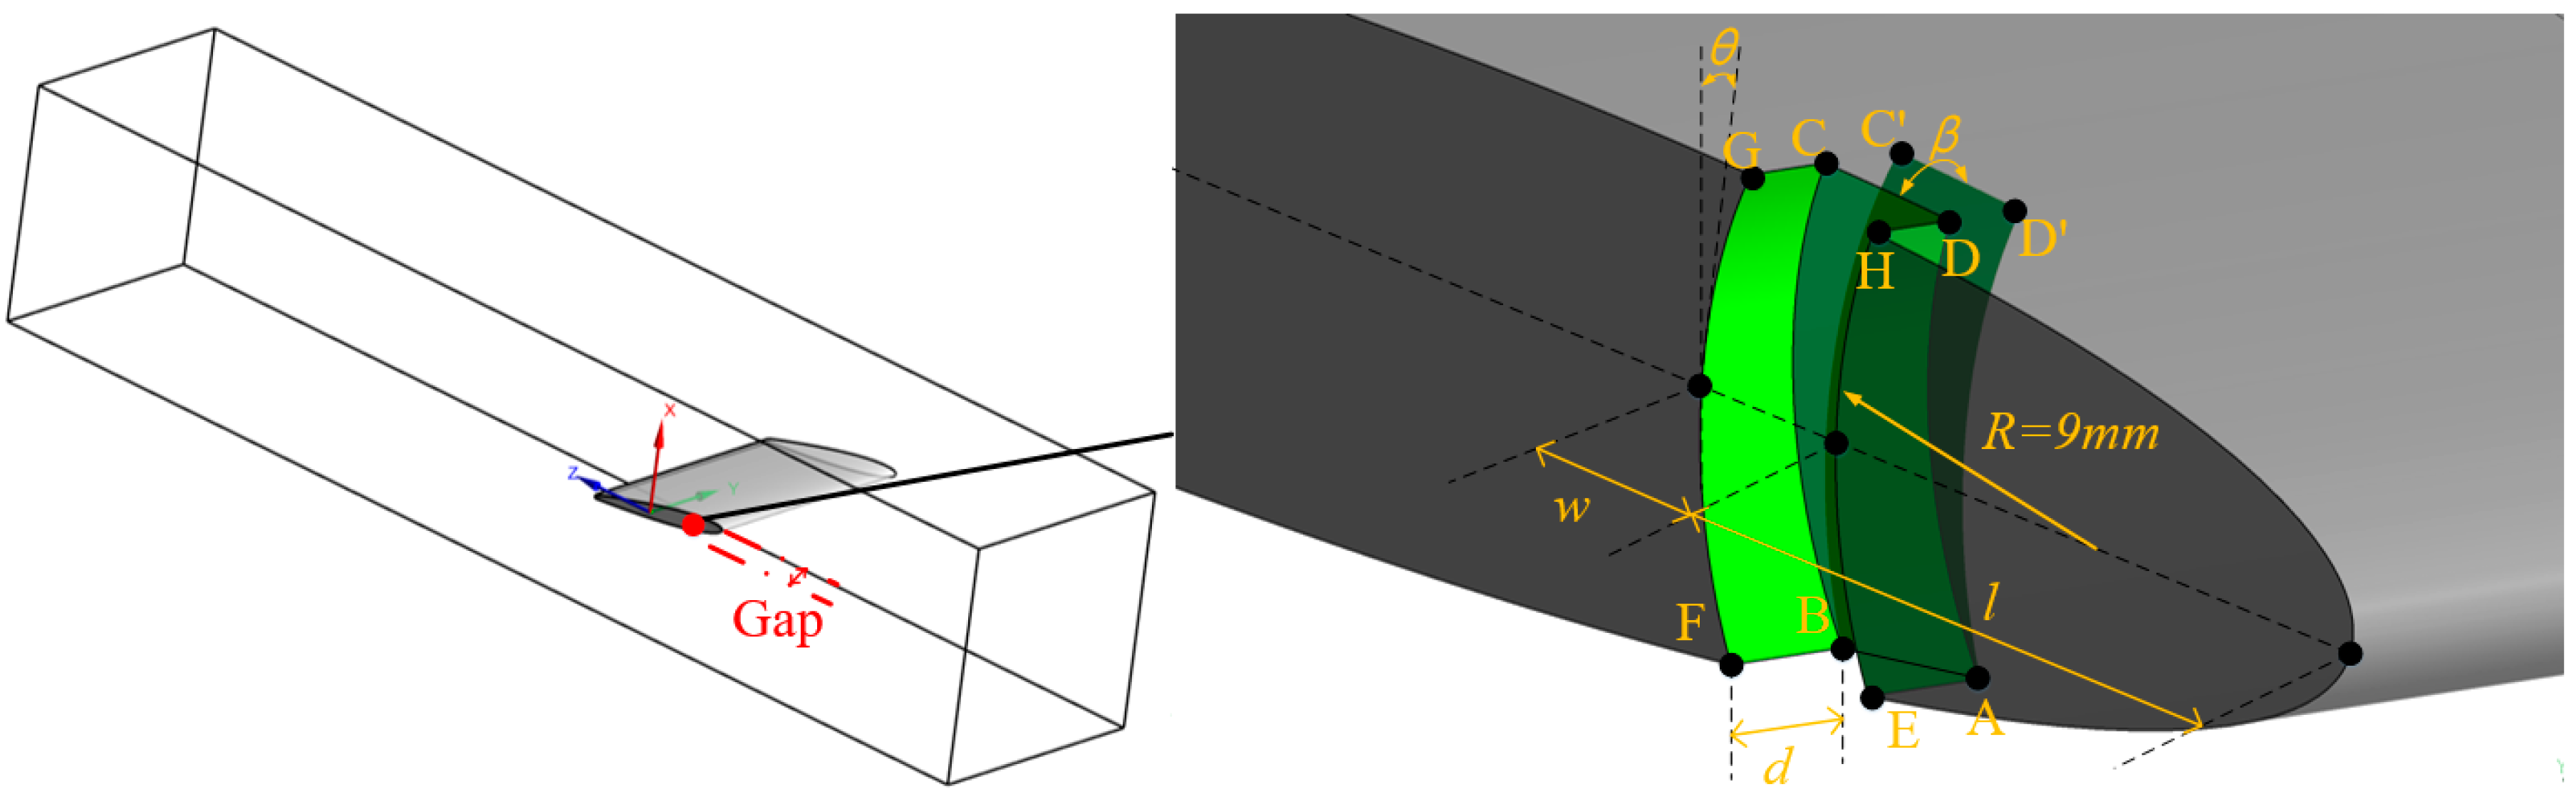
The parametric BSG is shown in Figure 2. Parameters l, w, d control the position, width, and depth of the groove, respectively. Parameter θ is the rotation angle of curve FG around its middle point. Besides, the groove depth along the foil thickness direction is controlled by parameter β, and it is the rotation angle of face ABCD around curve AB.
3. Optimization Design
3.1. Numerical Method
The commercial CFD code CFX 15.0 is employed to fluid simulation, and the SST k-ω turbulence model is adopted for its advantage to capture the flow separation [28,29]. Referring to the experiment [27], velocity inlet with low turbulence intensity ( = 10 m/s) and static pressure outlet (p = 0 pa) are selected as boundary condition of inlet and outlet. Besides, the no-slip wall is applied to the boundary condition of the wall. The high-resolution scheme is used for the turbulence numeric and advection scheme. The time scale factor is set to 1, and the residual target is selected as 10−6.
3.2. Grids Independence
A hexahedral structured grid is obtained by Ansys ICEM 15.0, as its advantages are less time-consuming and accuracy in simulation. The mesh independence test of the present model was already implemented by Guo et al. [19] with the grid convergence index (GCI) method [30]. On the basis of Guo’s work, a more detailed grid independence test is adopted with three different gird sizes applied to the initial foil first, and then for the foil with BSG. For the initial foil, the total mesh nodes of Mesh 1, 2, and 3 are 3890724, 4911942, and 5824564, respectively. Besides, the node number in the tip clearance along the foil span direction is 15, 20, 25 from Mesh 1 to Mesh 3. The grid independence of the initial foil is shown in Table 1. CL and CD are the lift and drag coefficient separately, and they are defined as:
where L is the lift force, normal to the inflow, D is the drag force, parallel to the inflow, ρ is the density of the fluid, is the velocity of the inflow, SL and SD are the reference area of the foil, and they are equal to the chord length c times foil span b, in this project.
As shown in Table 1, the lift coefficient relative difference is 0.32% between Mesh 2 and Mesh 1, 0.40% between Meah2 and Mesh3, while the drag coefficient relative difference is 0.43% for Mesh 2 and Mesh 1, 0.44% for Mesh 2 and Mesh 3. In other words, the relative difference is small between the three grids. Considering the calculation resource consumption and calculation accuracy, Mesh 2 is selected as the base of the groove mesh.
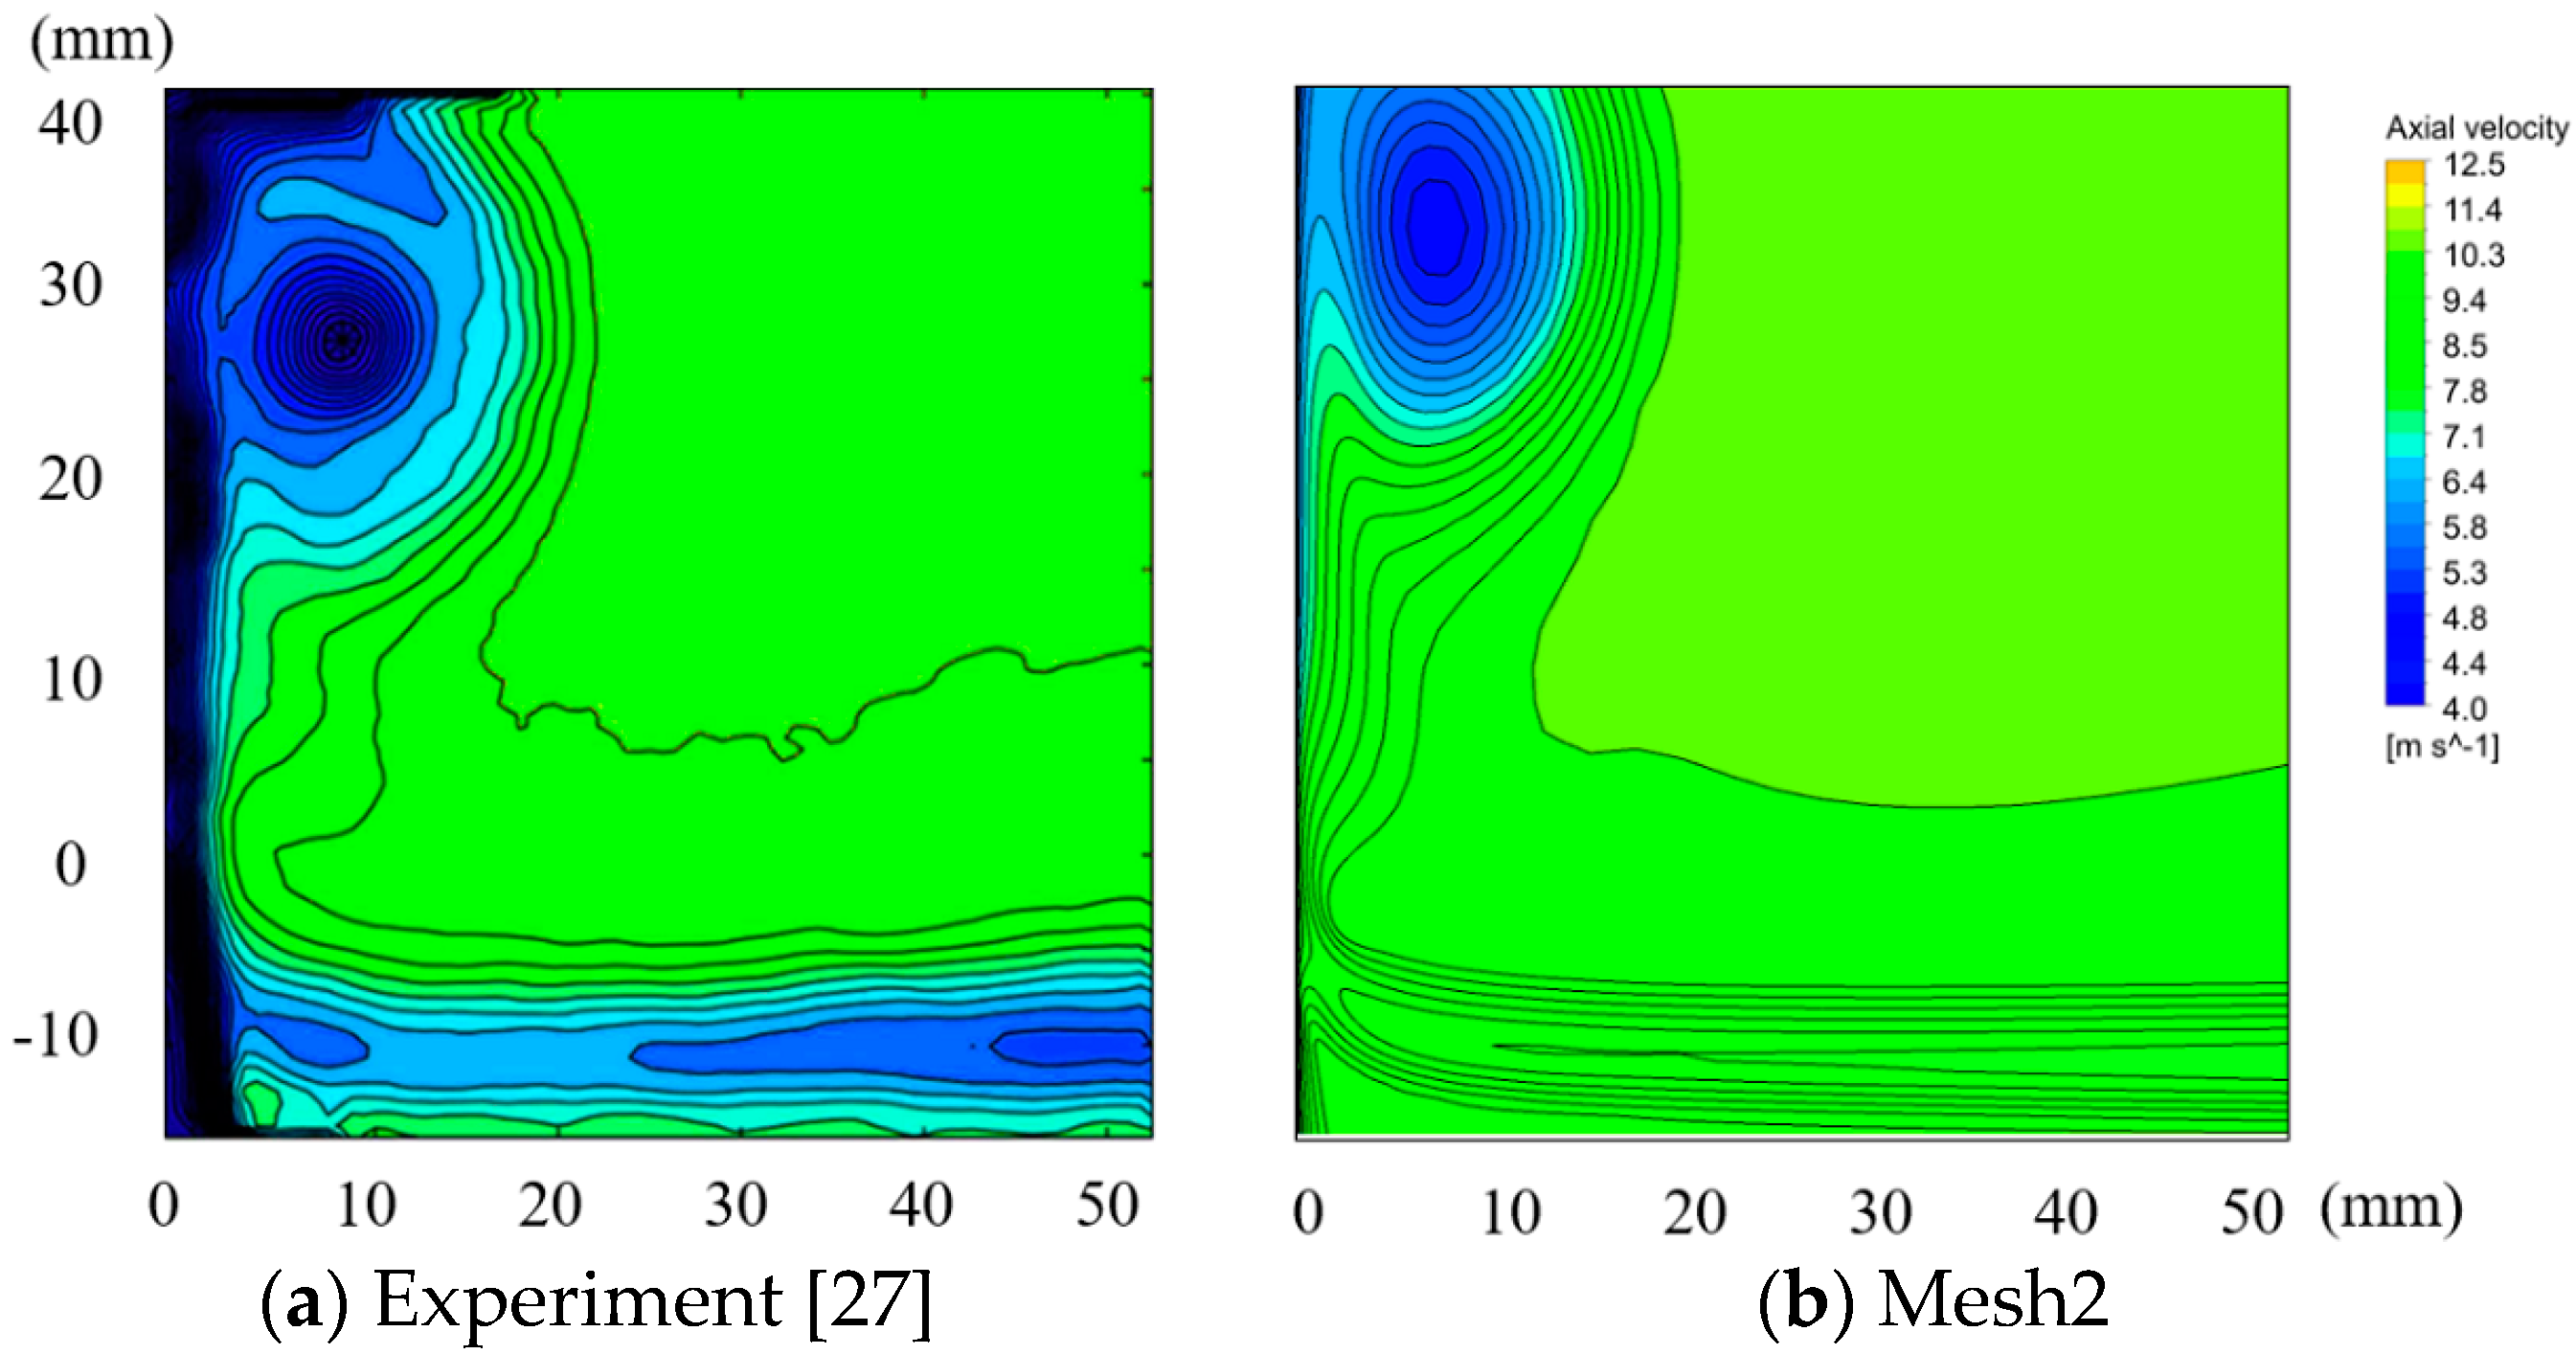
Figure 3 is the axis velocity contour of Experiment [27] and numerical simulation at cut-plane of z/c = 1, under = 10 m/s. It is demonstrated that there is some difference between the experiment result and simulation result, especially for the location of the TLV core. This may be caused by the surface roughness and the tip round in the experiment process. Despite the tiny difference, the numerical simulations agree well with the experimental measurements. Therefore, the mesh and numerical method adopted in the present research are reasonable.
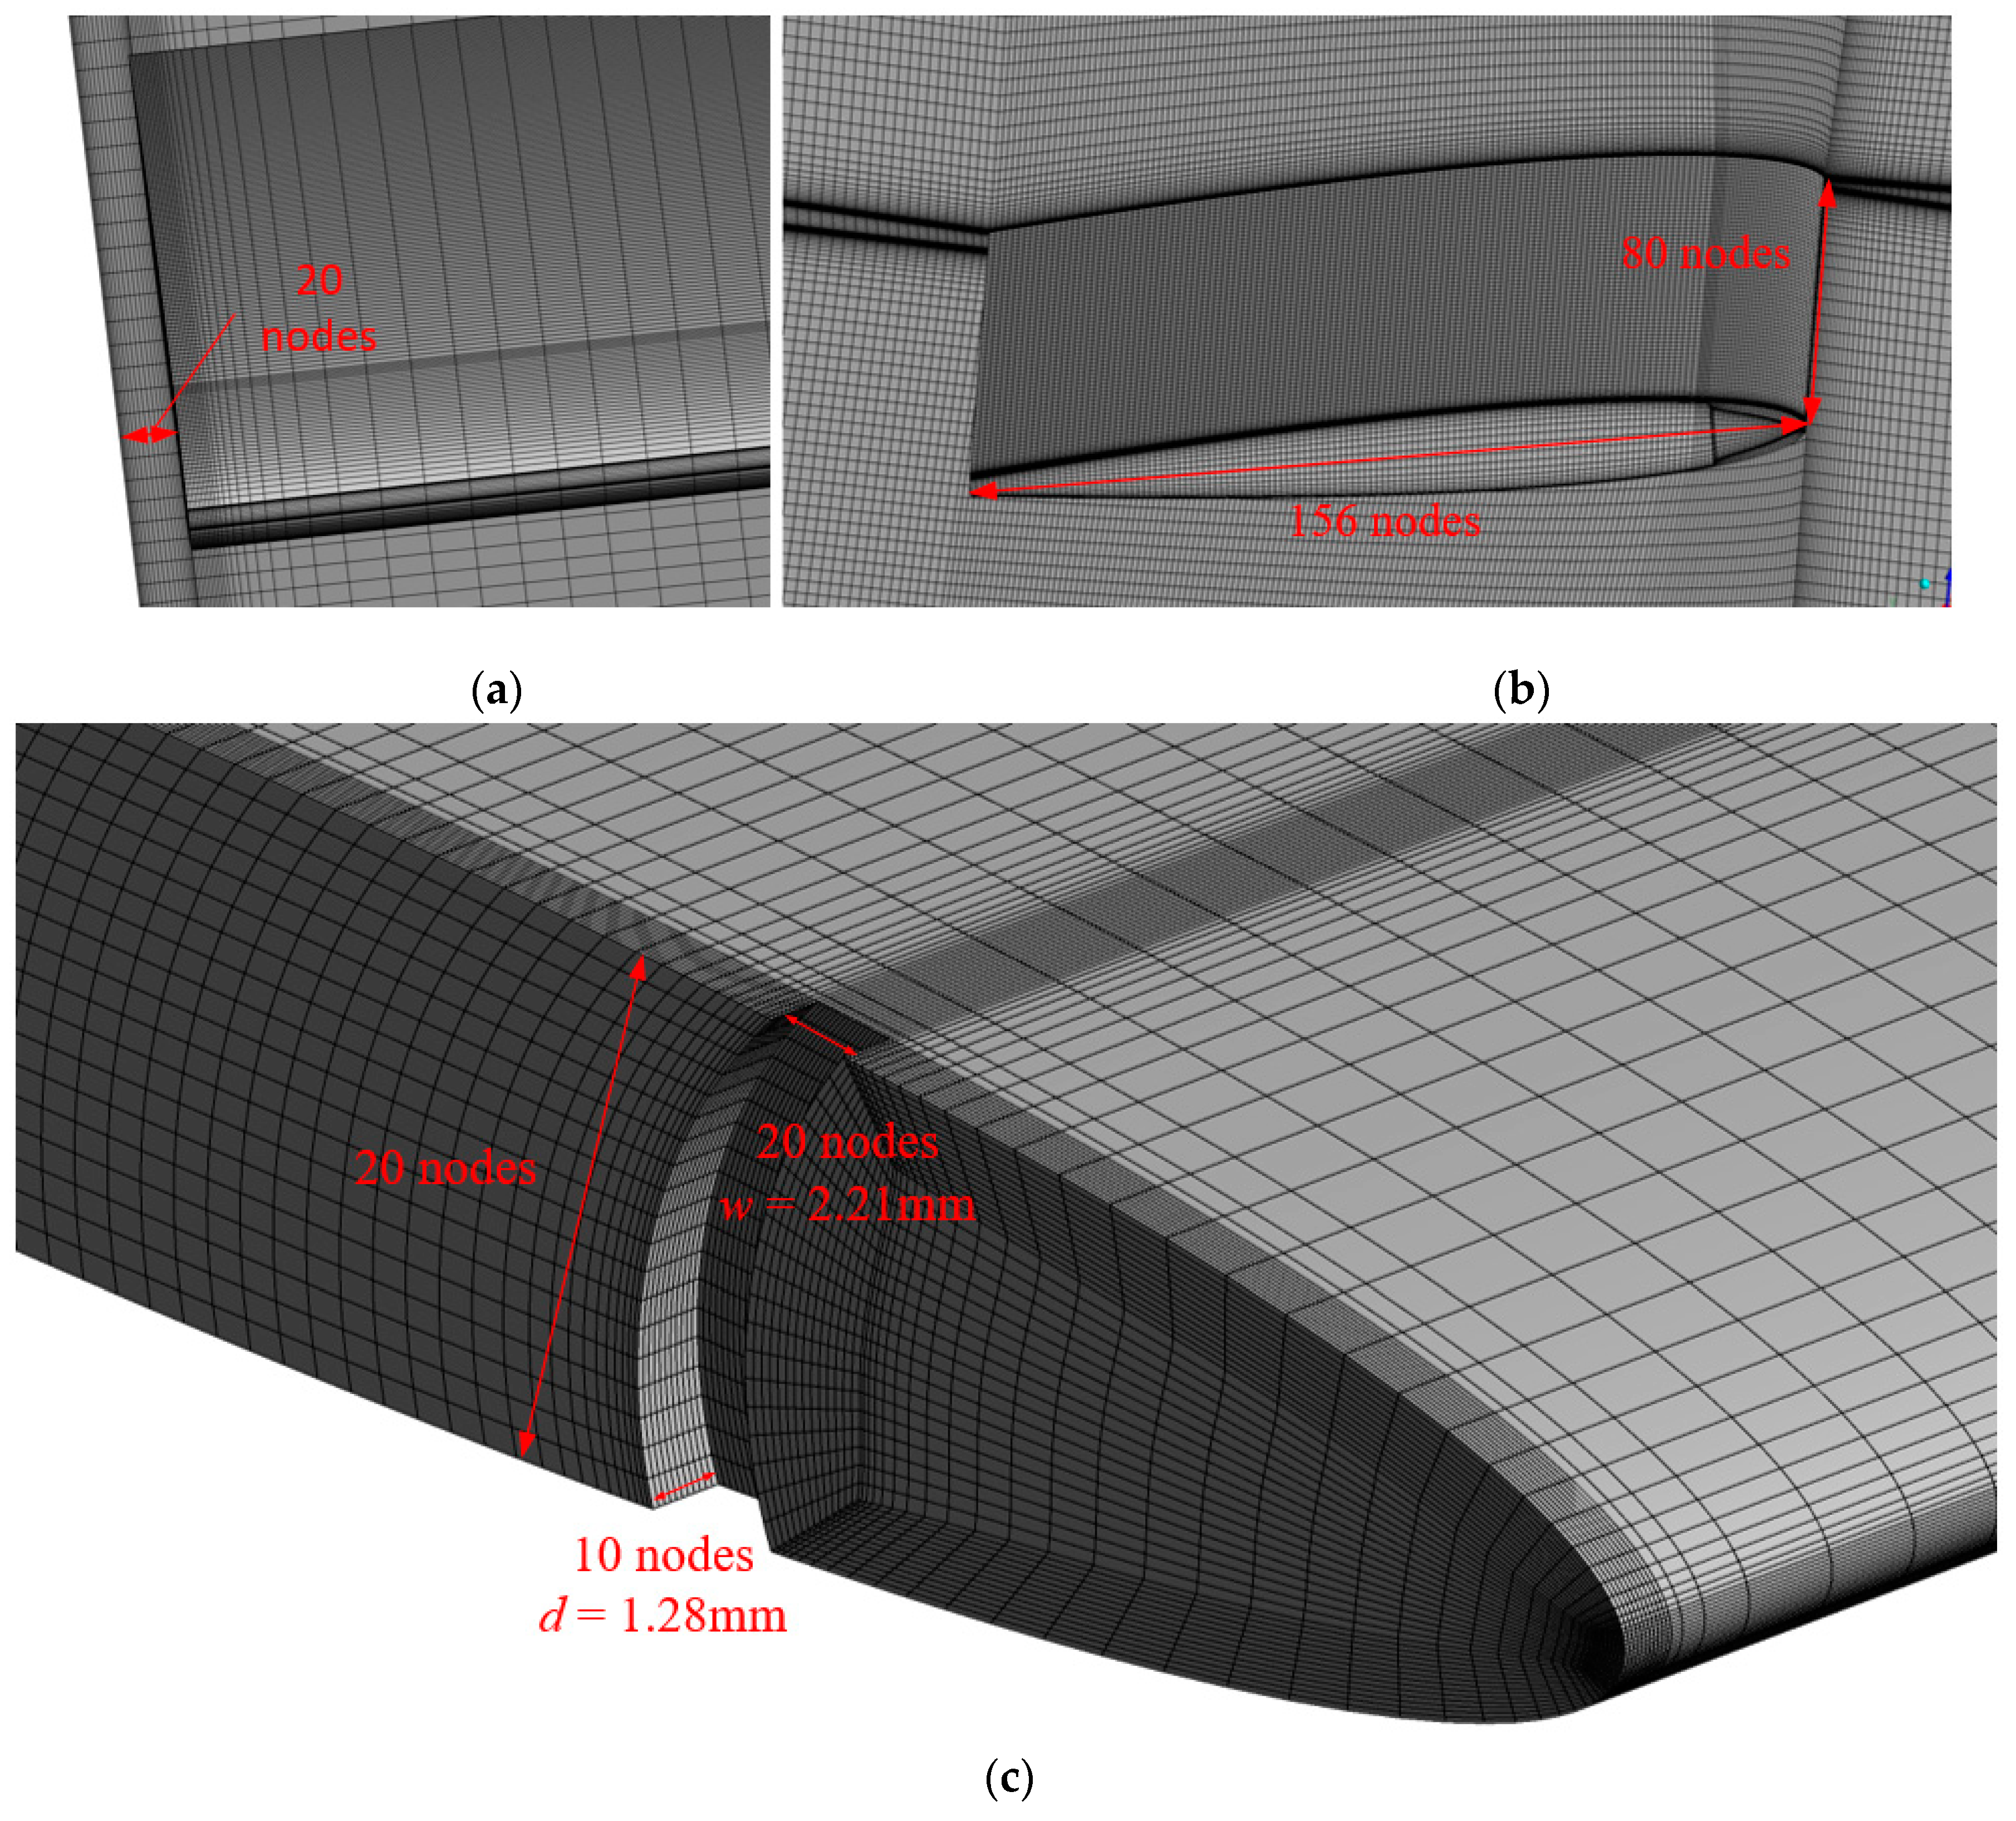
Based on Mesh2, G-mesh1, G-mesh2, and G-mesh3 are generated for the BSG grid independence test. The width of the BSG in the test is 2.21 mm with 15, 20, 25 grid nodes from G-mesh 1 to G-mesh 3, while the depth is 1.28 mm with 7, 10, 13 grid nodes, respectively.
Table 2 shows the grid independence of the BSG. The maximum relative difference of the lift coefficient is 0.03%, while the drag coefficient is the same. To save the computing resource consumption and get more detail of the groove channel flow, G-mesh2 with an average cell dimension 0.11 mm along the width direction and 0.13 mm along the depth direction is selected as the baseline for the following different BSG case. The grid nodes in the width and depth direction of dynamic linear adjusting along with the width and the depth dimension of the groove in the parametric design process, keep the average cell dimension the same with G-mesh 2.
Figure 4 shows the detailed arrangement of Mesh 2 and G-Mesh 2. The first layer around the foil tip is set at 0.04 mm, and the layer increasing ratio is set at 1.2. There are 20 nodes in the tip clearance, 80 nodes along the foil span direction, and 156 nodes along the inflow direction.
3.3. Optimization Design Method
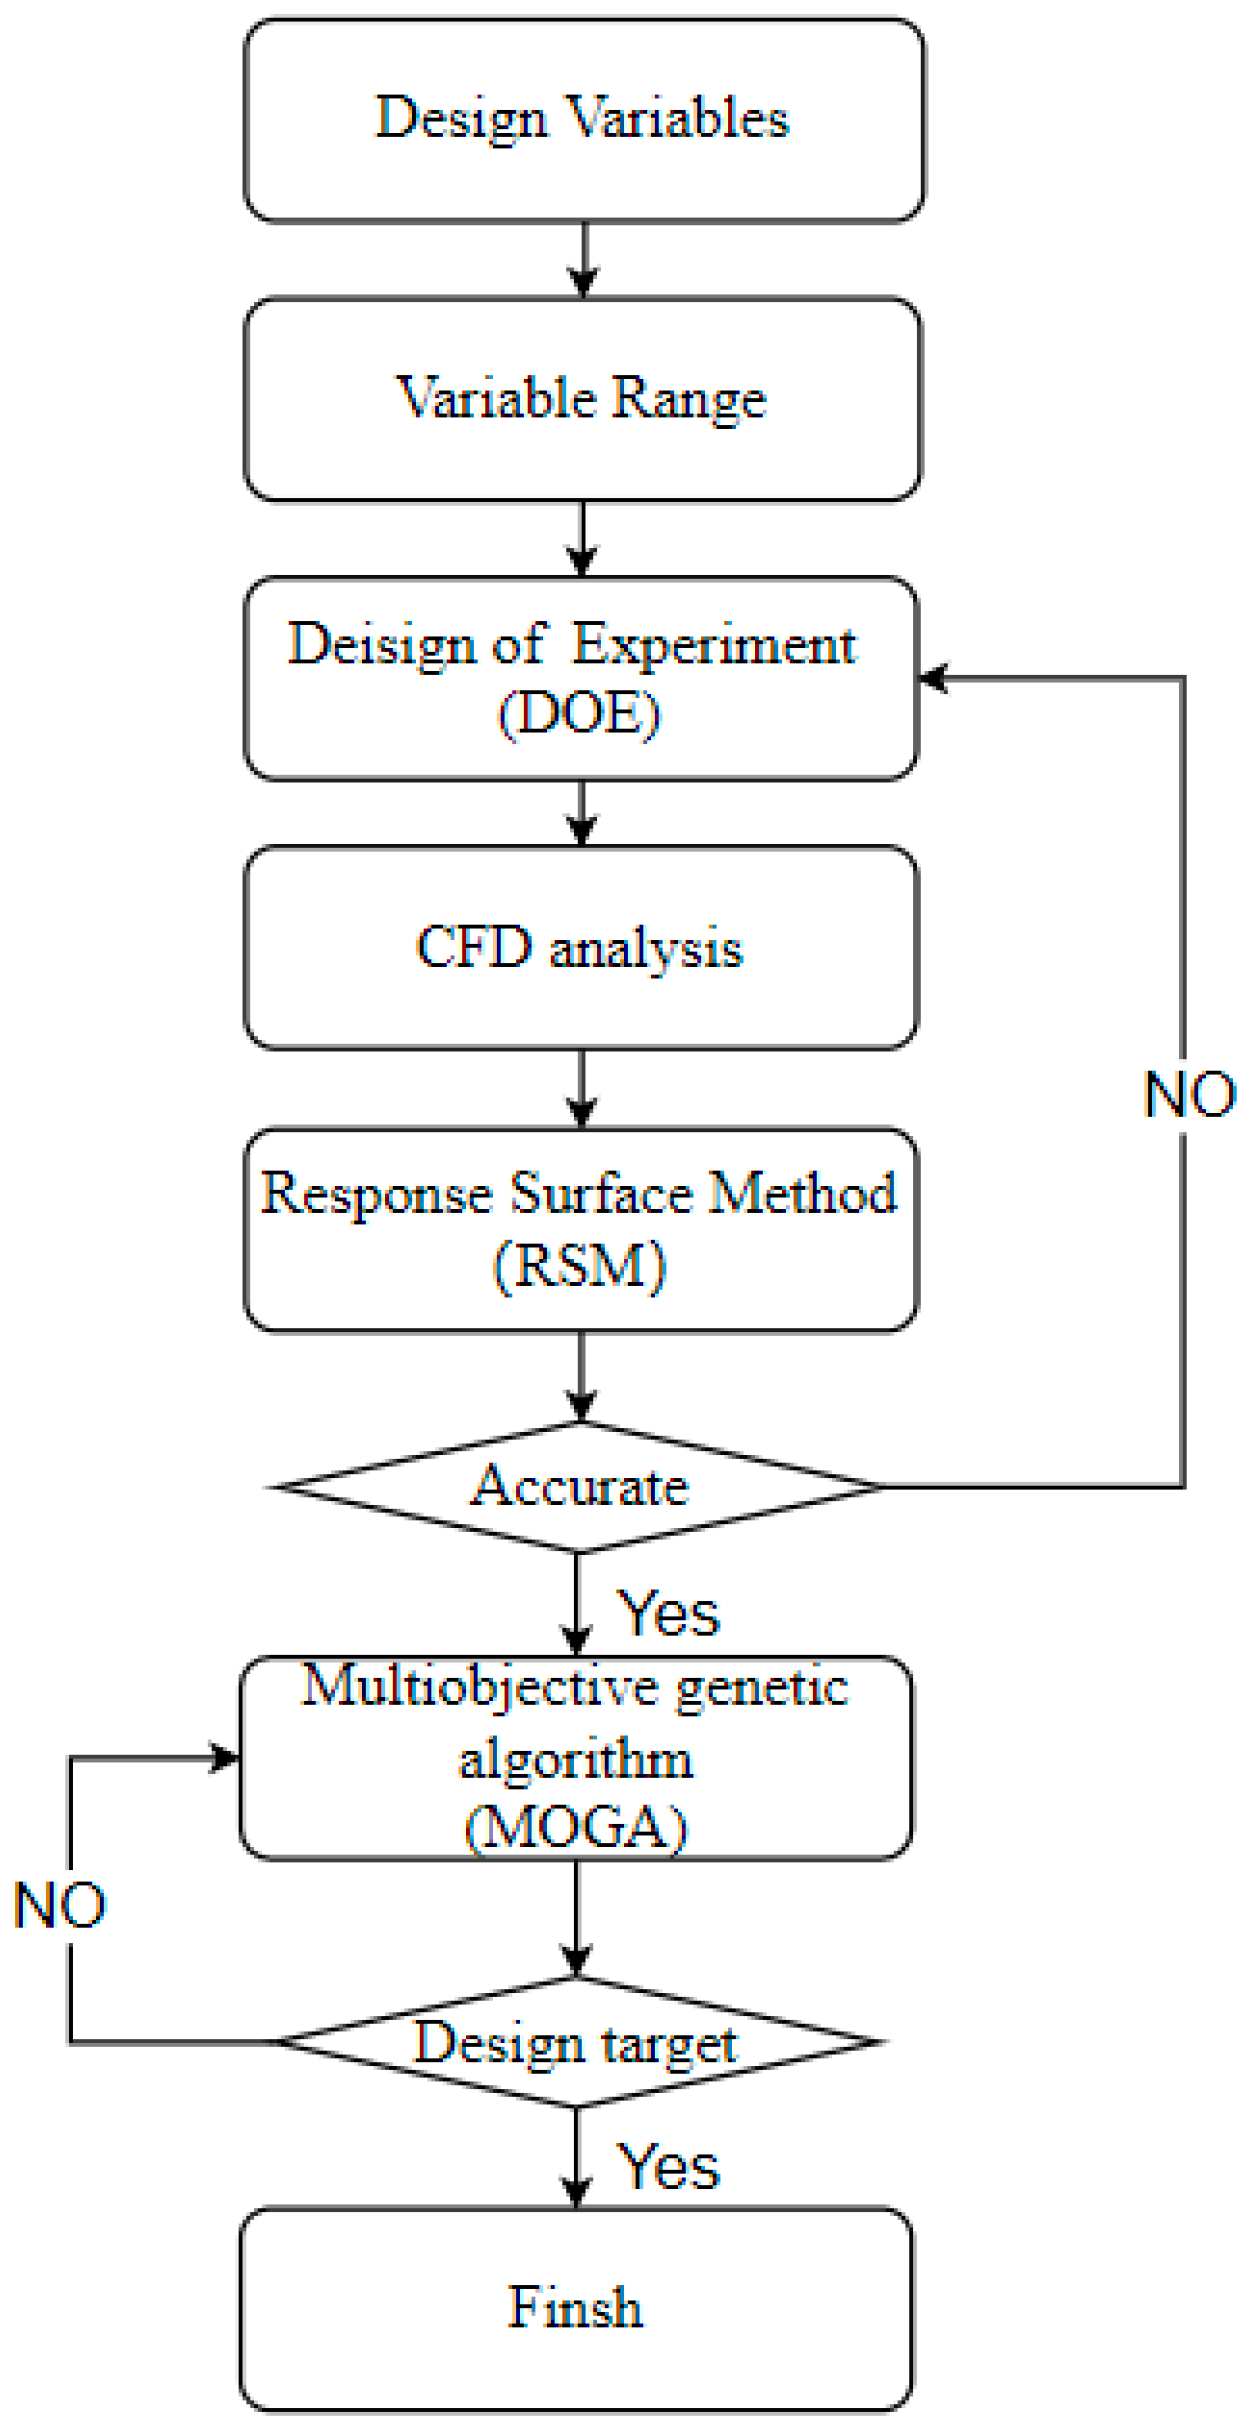
A parametric design method is employed to determine the optimal shape and position of the BSG. The design strategy, which combines the design of experiment (DOE), CFD, response surface method (RSM), and multiobjective genetic algorithm (MOGA), is shown in Figure 5. DOE is to obtain sample hydrofoil configurations, CFD is to estimate the design targets, RSM is to model the design variables and the design targets, and MOGA is to search the trade-off design based on the RSM [28,31].
Five parameters, show in Figure 2, were selected to design variables and their ranges were listed in Table 3. Thirty sample points were obtained with the DOE method, wherein the sample points are equiprobable, random, and orthogonally distributed in the design space [31].
The response surface method (RSM) was applied to describe the mathematic relationship between the optimization variables and the targets. The second-order polynomial function was used in this study:
where and are the design variables, n is the number of design variables, and re the polynomial coefficients, and is the target, which represents the area of Q criterion vortex isosurfaces (Q = 2 × 10⁷ s−2) Qarea or the lift drag ratio R. The Q criterion vortex and the lift drag ratio were expressed as:
where the u, v, w is the velocity component in the x, y, z direction.
To further investigate the parameter effects, the above two objects function are transformed into non-dimensional form by , where , are the minimal and maximal value of the corresponding target value among the 30 sample points, respectively.
The modified non-dominated sorting genetic algorithm (NSGA-Ⅱ) [31] is selected to implement the multiobjective optimization after the RSM model between the optimization targets and design variables were established, the minimal area of Q criterion vortex isosurfaces (Q = 2 × 10⁷ s−2) and the maximal lift drag ratio are set as optimization targets. There should be attention so that the area size relationship of the vortex between the sample case and the initial case is consistent, under different Q criterion values. To better illustrate the shape of the vortex, Q = 2 × 10⁷ s−2 is adopted in this paper.
4. Result and Discussion
4.1. Optimization Results
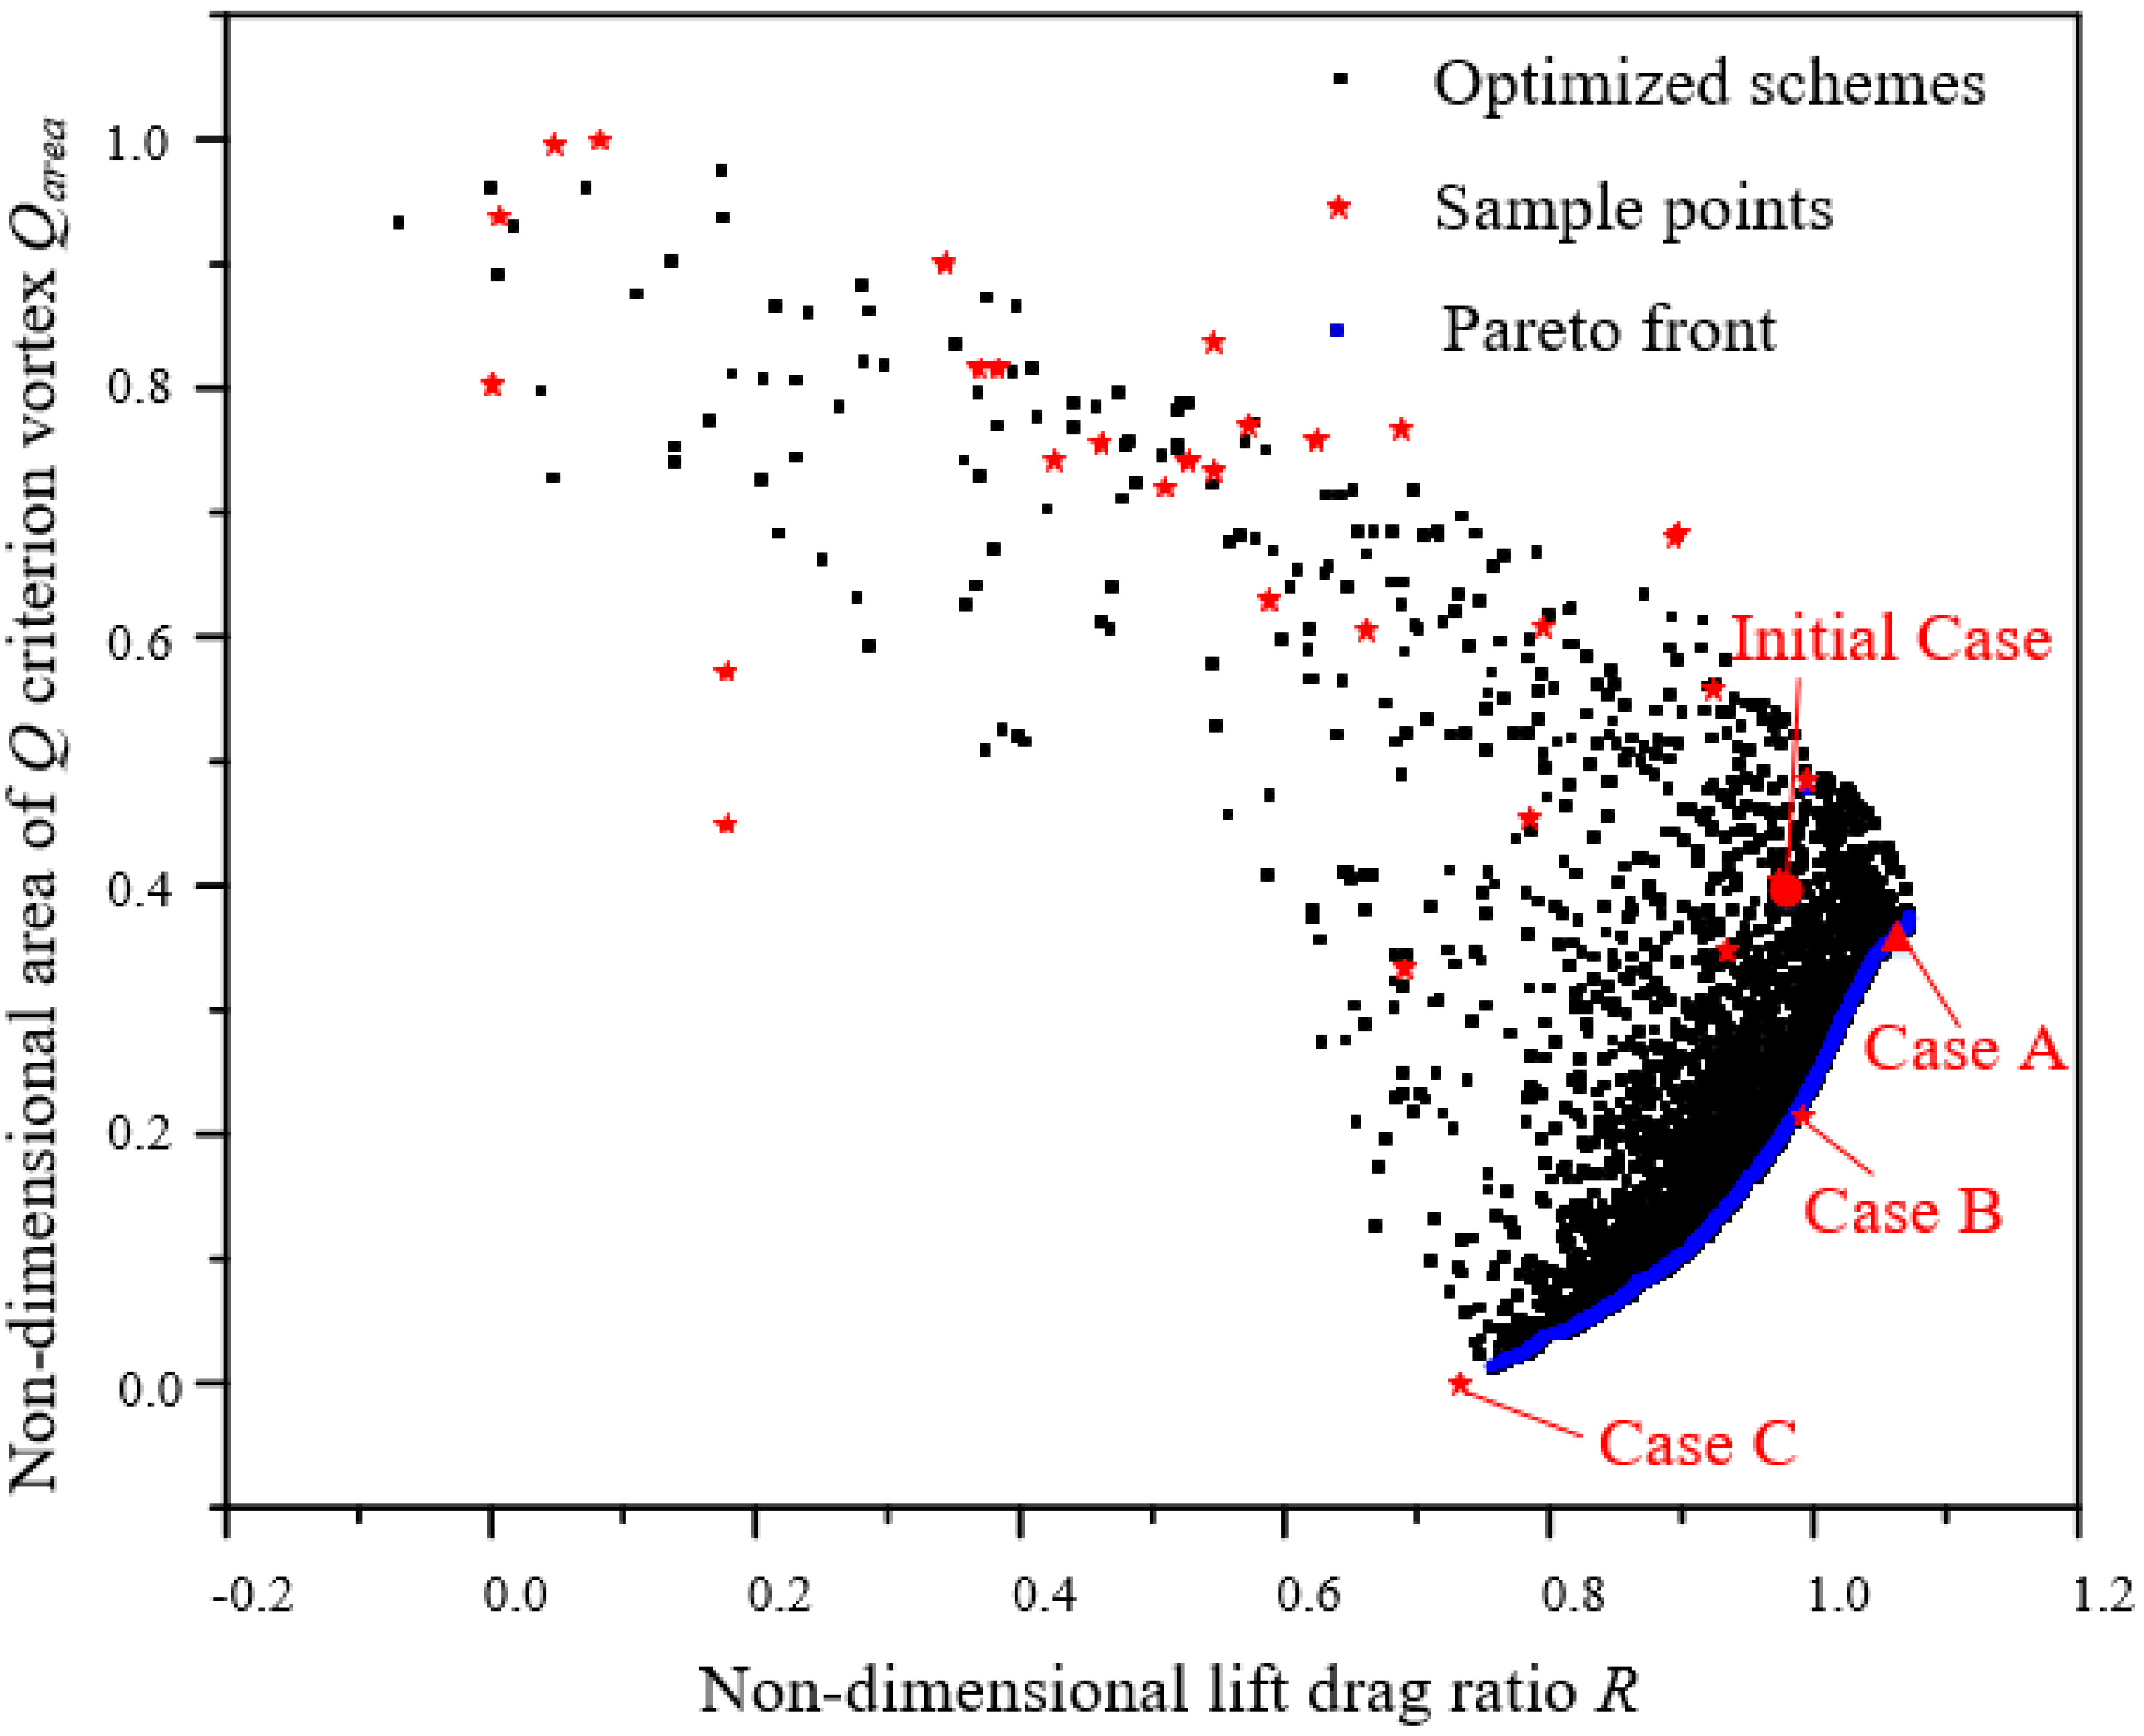
Figure 6 shows the optimization results. Five thousand optimized schemes are generated by the NSGA-Ⅱ and estimated based on the RSM model. The sample points and the initial case are also reported. The Pareto front, which consists of blue points, is the best trade-off solution of the optimization results, and it indicates that the two optimization targets conflict with each other, increasing the ratio R will lead the area of Q vortex isosurfaces to increase also. Moreover, the result indicates that most of the present BSG configuration would deteriorate the energy performance and increase the vortex area. Therefore, the present method should be adopted with caution.
For more comprehensive analyses of the optimized results, three schemes, marked as Case A, Case B, and Case C, which represent lift drag ratio priority solution, compromise solution, and Qarea priority solution, respectively, are selected from the different regions of the Pareto front. It should be noteworthy that Case B and C are the sample points which just locate at the Pareto front.
Table 4 shows the foil performance comparisons estimated by the RSM and calculated by CFD. The CFD results of Case A are obtained from the redesigned foil with the optimized design parameters. It should be noted that there are some differences between estimation by RSM and prediction by CFD. Therefore, when the present optimization procedure is adopted, the reliability of the RSM should be inspected carefully and increasing the number of sample points is an effective way when necessary. Despite the differences between the RSM and CFD results, the optimized scheme with the lower area of Q vortex isosurfaces and a higher lift drag ratio estimated by the RSM model also has better characteristics of TLV suppression and energy performance. Therefore, the optimization results have great reference significance for selecting the better foil with groove.
Case A is recommended as a preferred scheme, through the comprehensive consideration of the two optimization targets. Compared to the initial case, it reduces the non-dimensional isosurfaces (Qarea = 2 × 10⁷) area by 5.13% and increases the lift drag ratio by 17.02%. The results prove that the present parametric design method is reliable.
4.2. Sensitivity Analysis of Variables
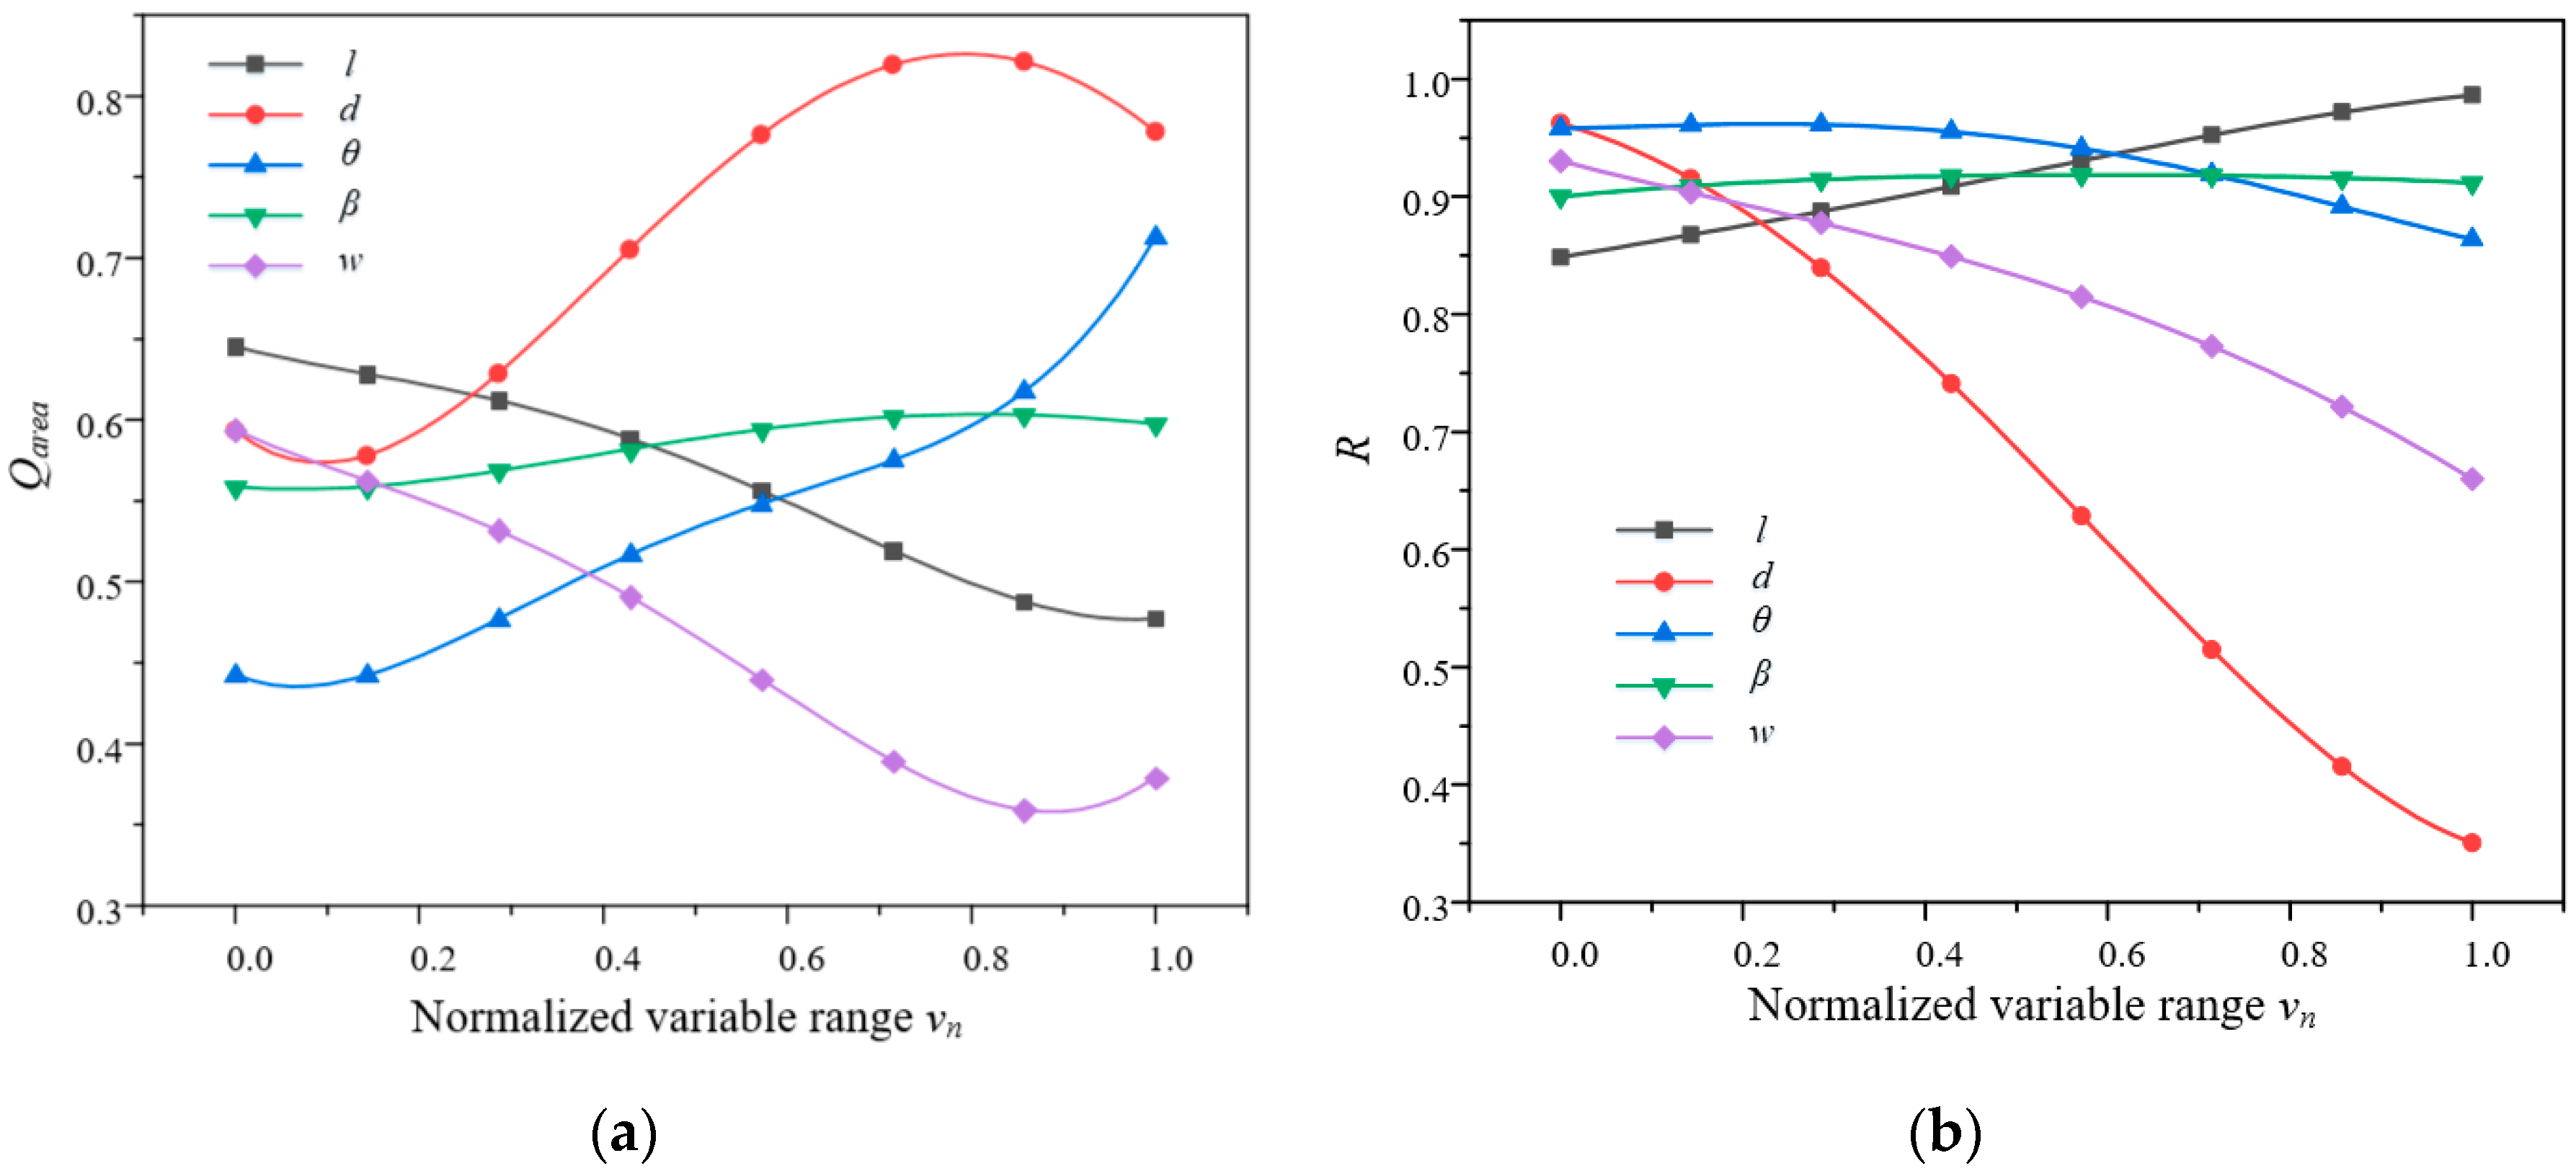
Figure 7 shows the effects of design parameters on foil performance, and it was obtained by the equation , where yi is from Equation (1), xi is the corresponding design parameter. To better investigate the effects of the parameters, all the design parameters are scaled to the range 0–1.
As shown in Figure 7a, parameters d, θ, and w have much more effect on Qarea. With increases of d, the Qarea decreases firstly then increases slowly and decreases again. For the parameter θ, when the normalized parameter θ blows 0.1, the Qarea almost invariable, increases slowly between 0.1~0.8, increases dramatically up to 0.8. As for parameter w, its increases will lead to Qarea decreases firstly, then increases slightly and the turning point is about w = 0.83. From Figure 7b, parameters d and w, particularly parameter d, have a significant impact on the lift drag ratio, and their increases will lead the lift drag ratio to sharply decrease. Parameters l and β have a relatively smaller effect on both two targets and larger parameter l helps improve the foil performance. The above analyses indicate that the smaller parameters d, θ, and larger parameter l are recommended to increase the lift drag ratio and suppress the Q vortex area.
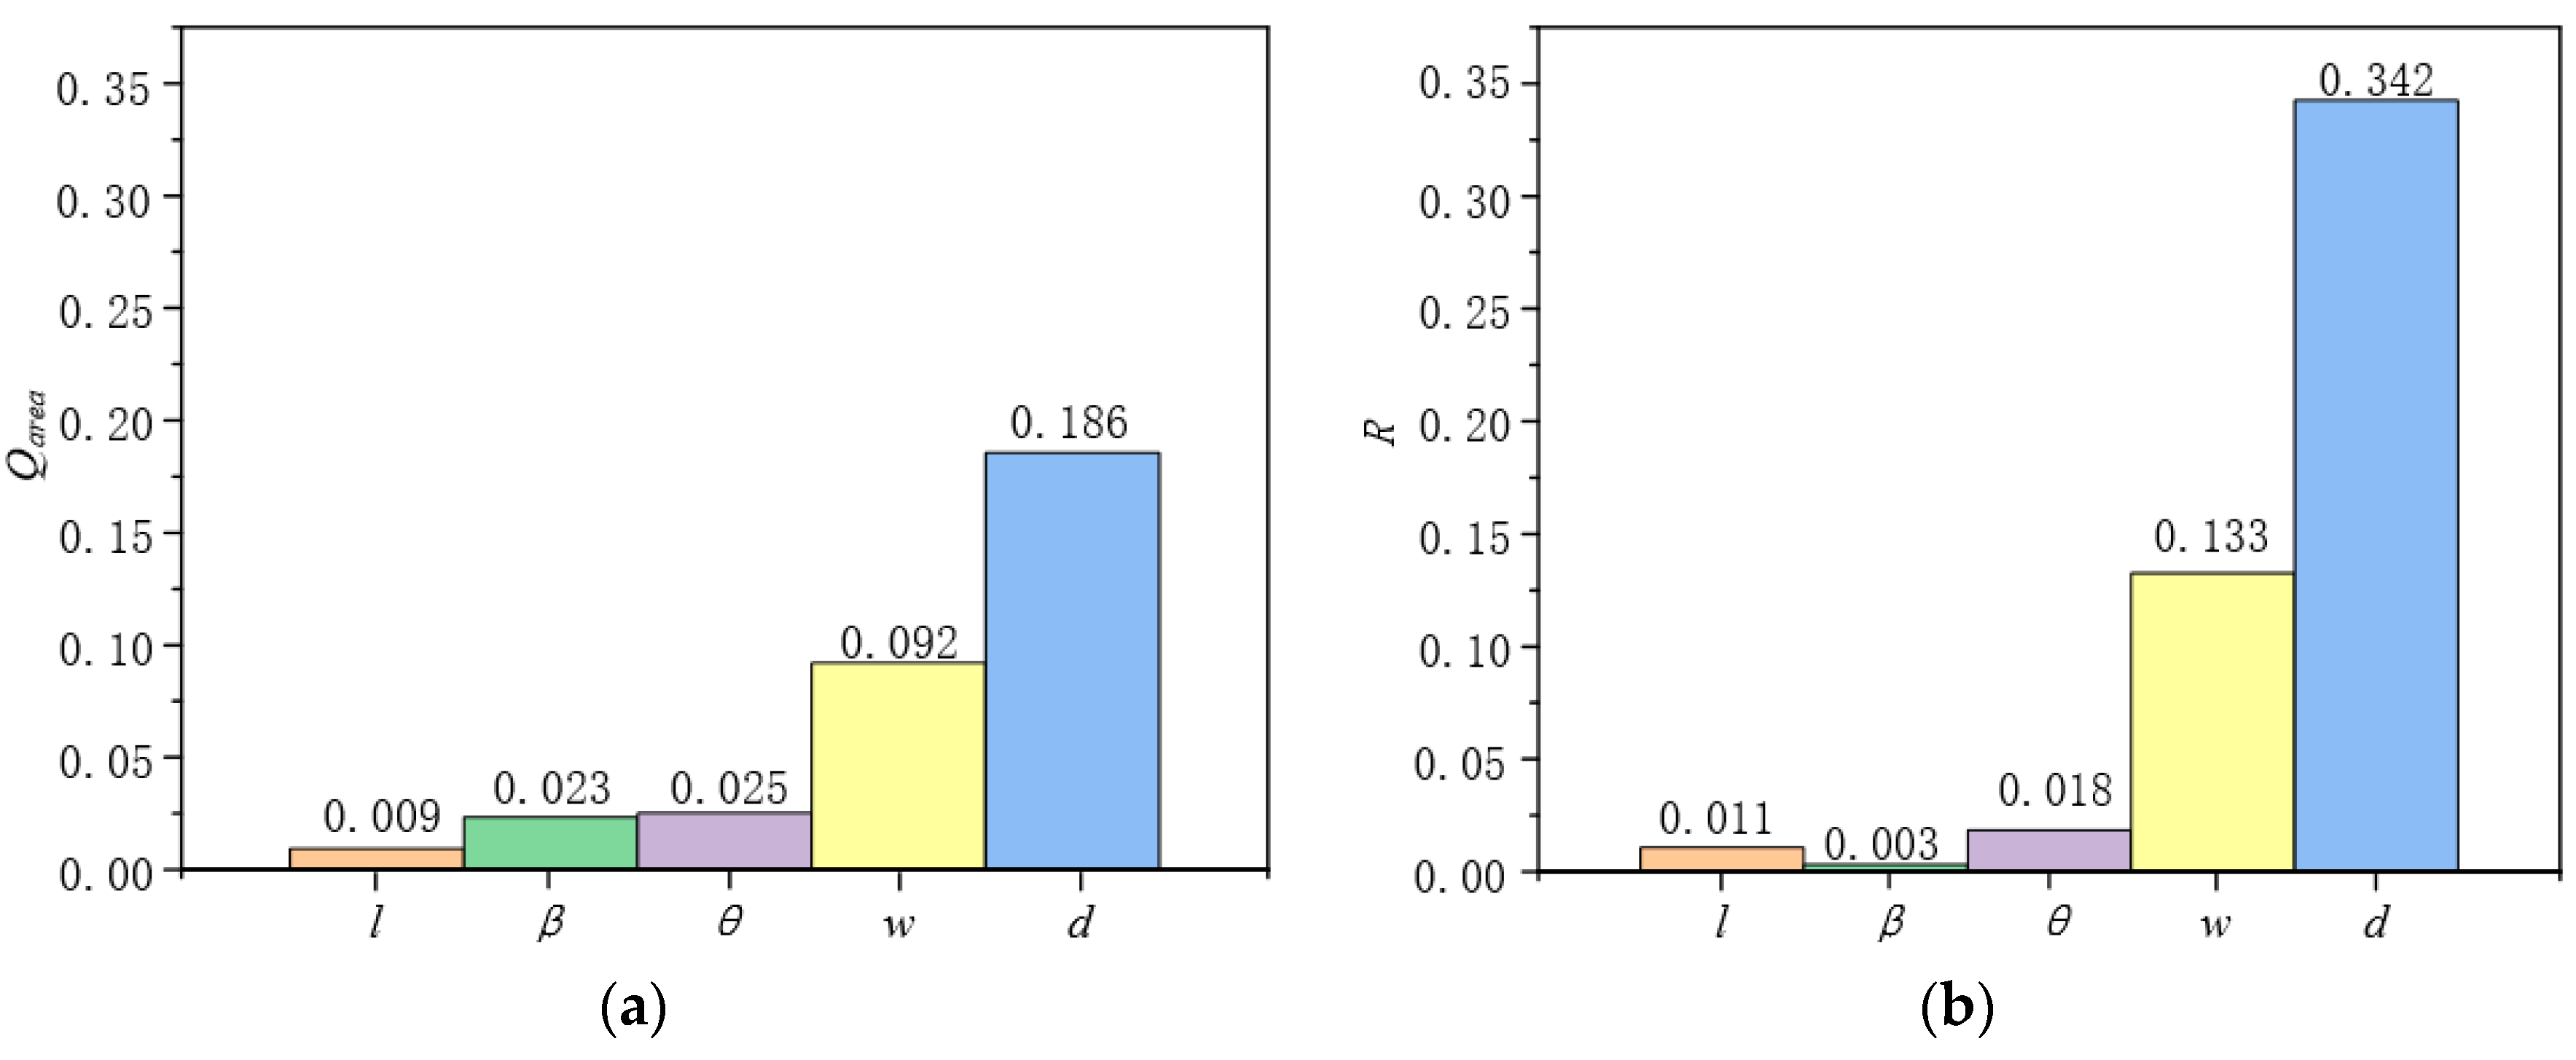
Figure 8 is the global effects of the design parameters which were obtained by the equation , where L and U are the lower bound and upper bound of the variable, respectively. Global effects comprehensively estimate the effects of the parameters on the targets. It is obvious that parameters l, β, and θ slightly affect the targets, while the parameters w, d have an appreciable effect. Therefore, the parameter w, d should pay more attention when the BSG method is applied to engineer practice.
4.3. Groove Suppress on TLV
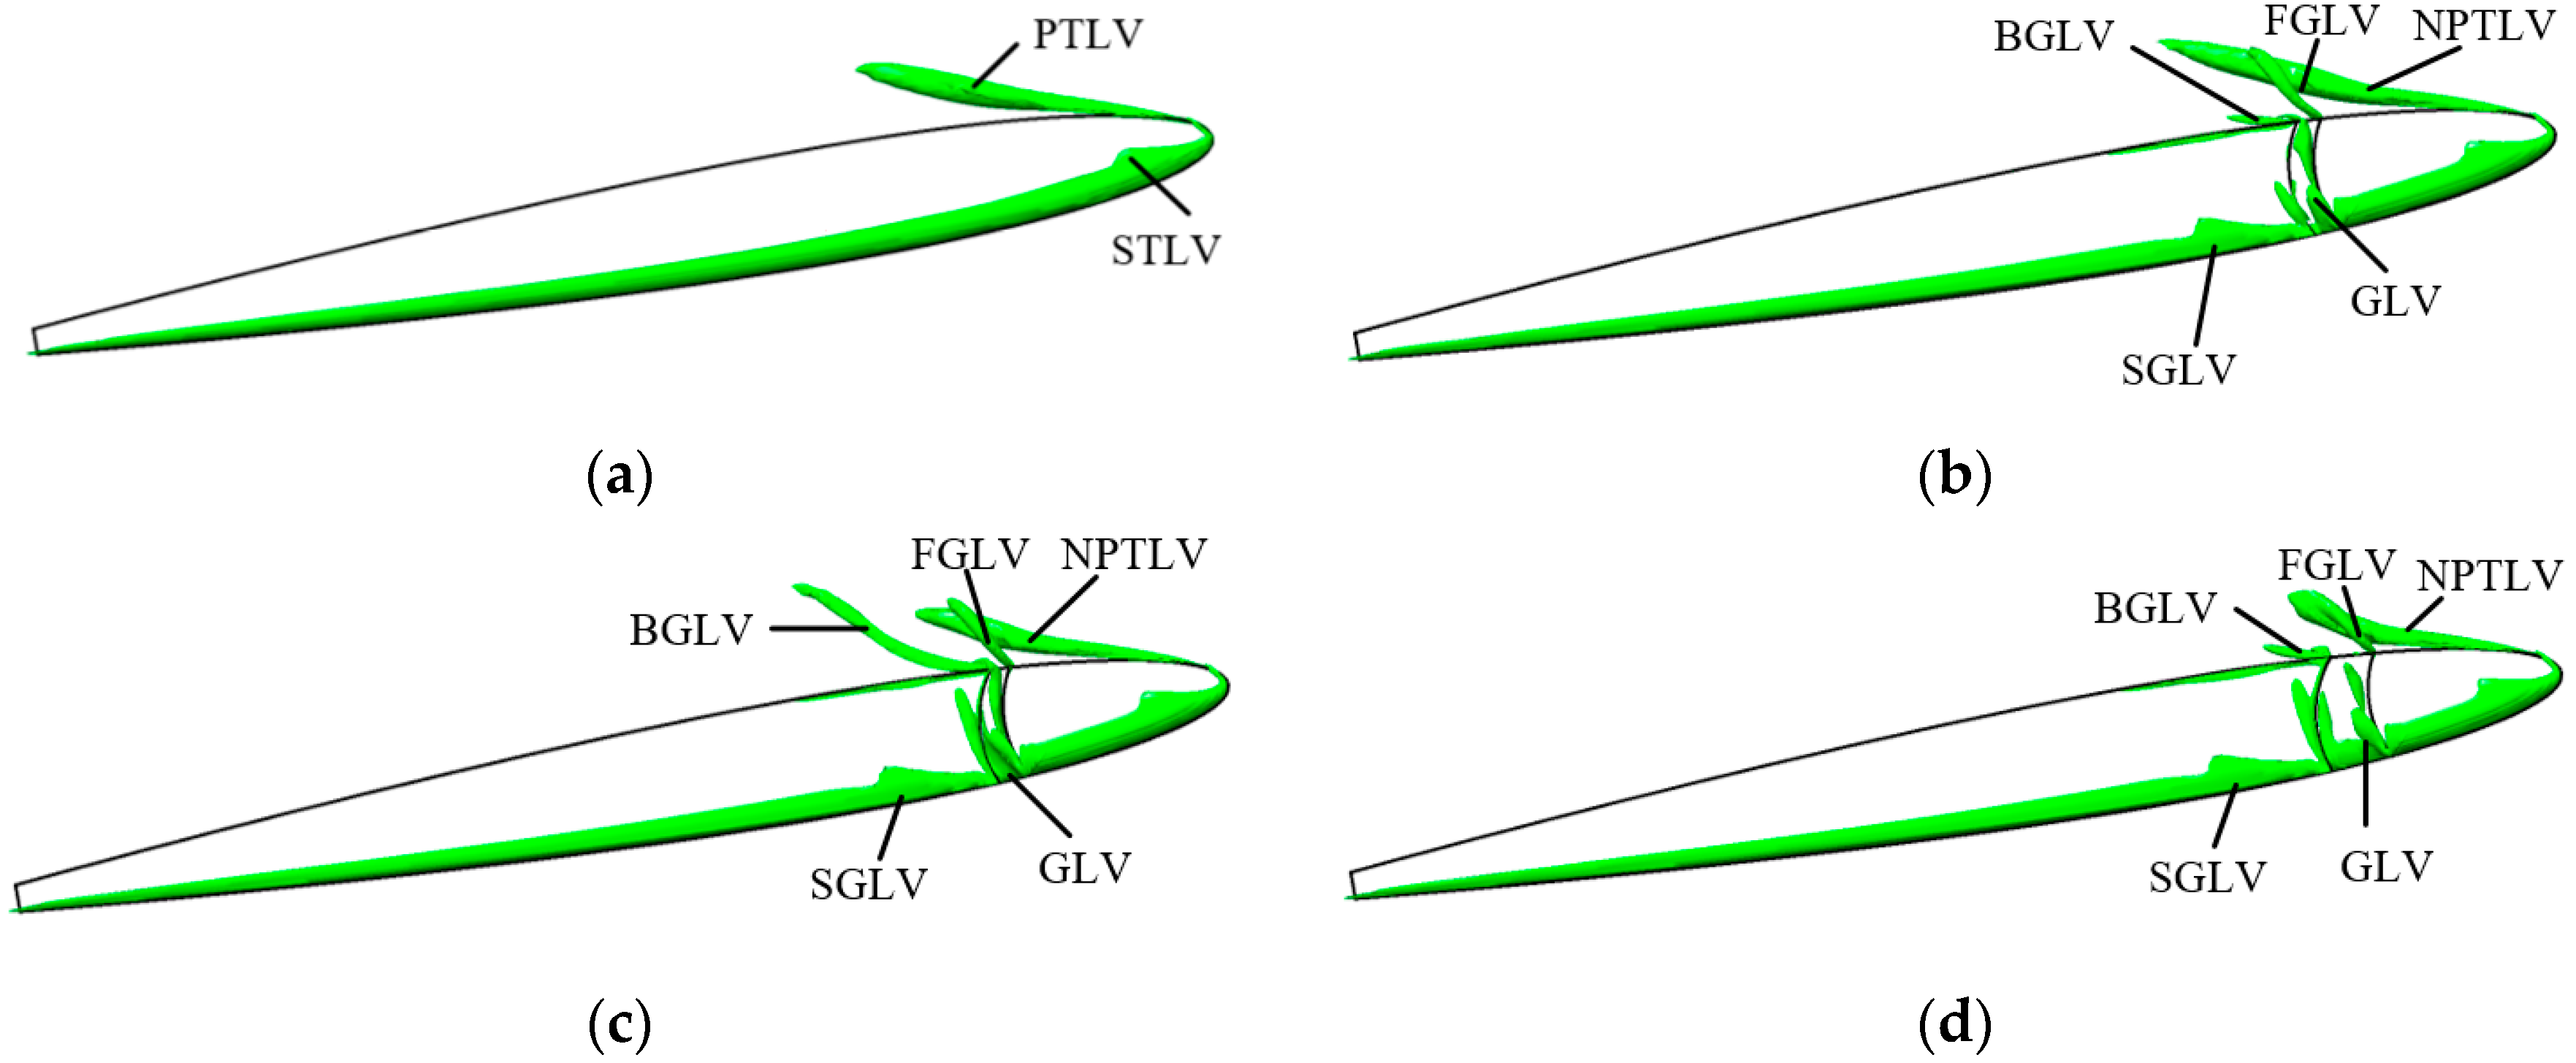
TLV suppression is one of the main purposes of the present method. The BSG impacts in the TLV are studied in this section. Figure 9 shows the vortex around the optimized BSG foil and the origin foil. As shown in Figure 9a, the vortex structure can be classified into two types: primary tip leakage vortex (PTLV) and secondary tip leakage vortex (STLV). The BSG changed its around vortex structure, and the new vortex structures, secondary groove leakage vortex (SGLV), and groove leakage vortex (GLV) are generated. Besides, the GLV rolls up and interacts with PTLV, forming the new primary tip leakage vortex (NPTLV). As a result, the length and diameter of the NPTLV vortex structure become longer and smaller.
The vortex structure of the three optimized grooves is a little different. The GLV will further induce the back groove leakage vortex (BGLV) and front groove leakage vortex (FGLV). Besides, BGLV, FGLV, and NPTLV are sensitive to the BSG shape. For Case A, the BGLV is not obvious, and FGLV and NPTV are independent of each other, GLV has a tiny impact on NPTV. The GBLV of Case B is clear, and the FGLV and NPLV are still independent of each other, but the NPLV dramatically decreases. The FGLV and NPLV of Case C interact with each other and become a whole vortex structure further. As a result, the area of Q vortex remarkably reduces.
According to the control parameters of the BSG as shown in Table 4 and the shape of the TLV as shown in Figure 9, it can be concluded that the position of the trailing edge FG of the BSG as illustrated in Figure 2 is almost the same. Besides, the wider BSG contributes more to reducing the area of the vortex.
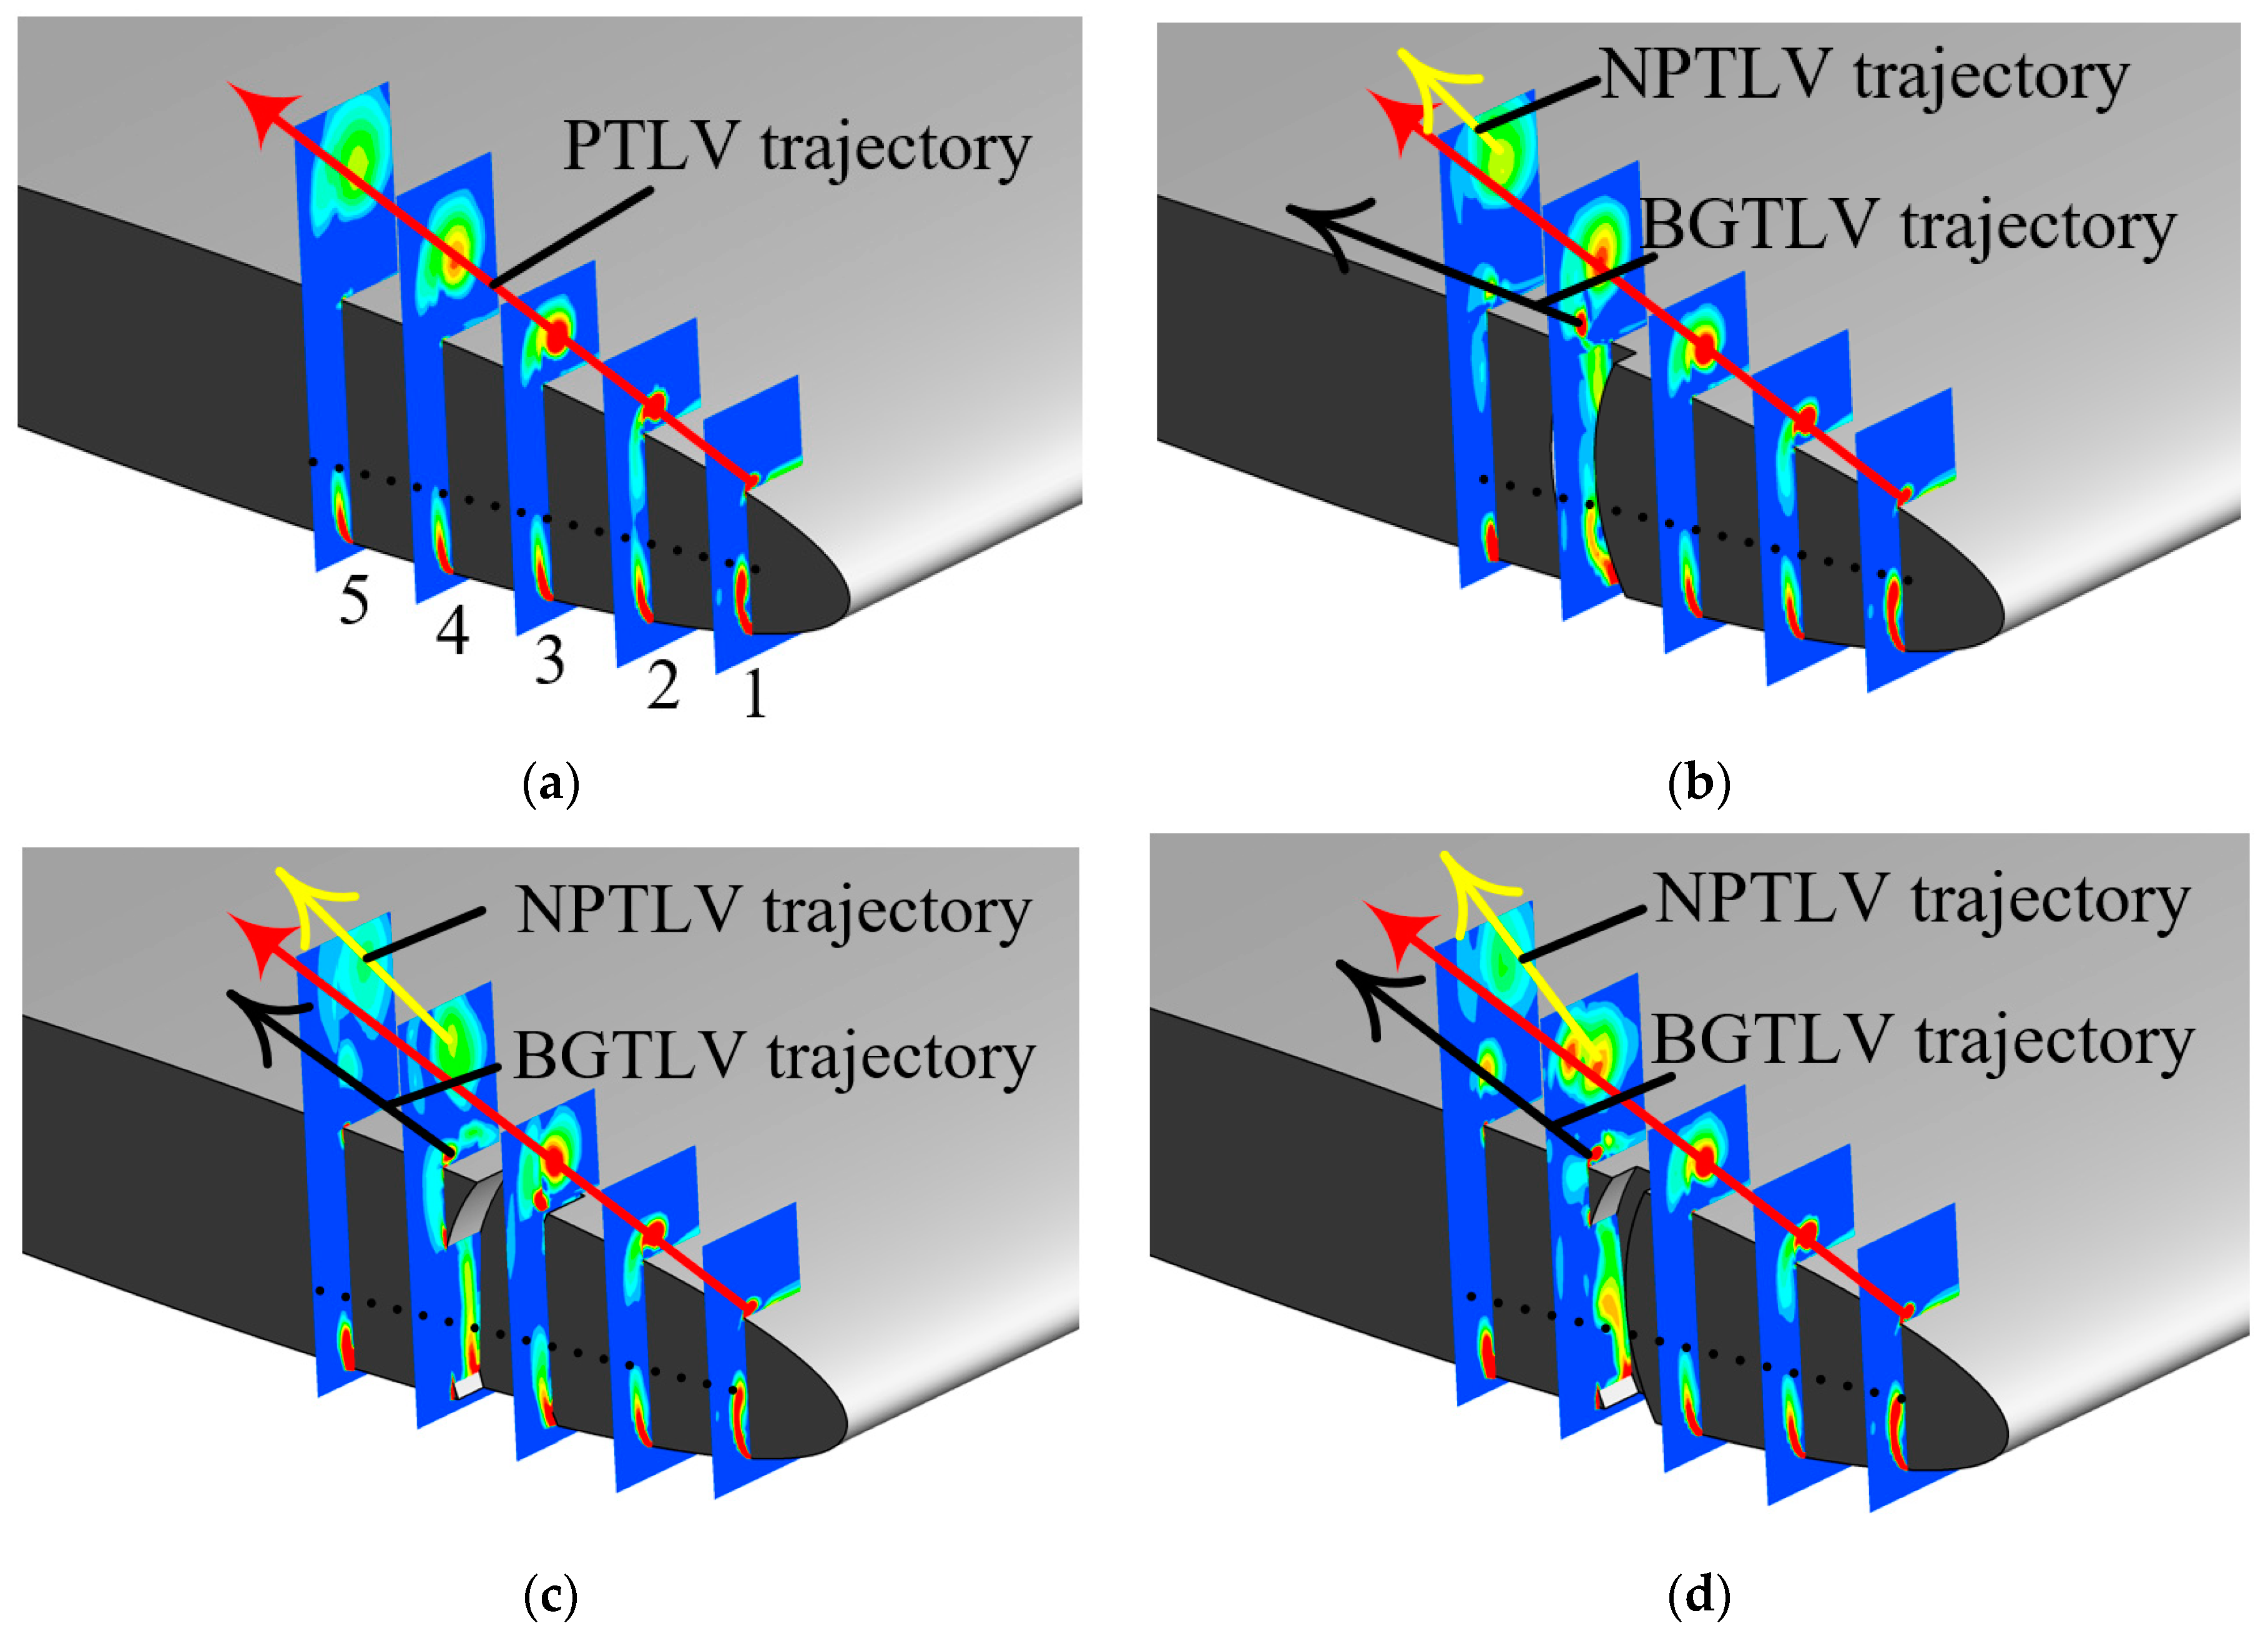
To further investigate the groove effect on TLV, the velocity swirling strength contour at different planes are investigated as shown in Figure 10. Plane 1 is located at 0.05c from the foil head, and the distance between the planes is also 0.05c.
For the origin case, the PTLV trajectory, marked by the red arrow, is a straight line from plane 1 to plane 5, as shown in Figure 10a. For the optimized cases, the new vortex structure can be observed as shown in Figure 10b–d, namely the BGTLV structure, marked by the black arrow. The BGTLV trajectory is parallel to the pressure surface of the foil downstream of the groove in Case A. The angle between the NPTLV and BGTLV trajectory is about 10°, as shown in Figure 10b. The BGTLV trajectory is parallel to the PTLV trajectory, and the angel between NPTLV and BGTLV trajectory is about 15° and 20°, respectively, in Case B and Case C as shown in Figure 10c,d.
4.4. Groove Impact on the Flow Pattern
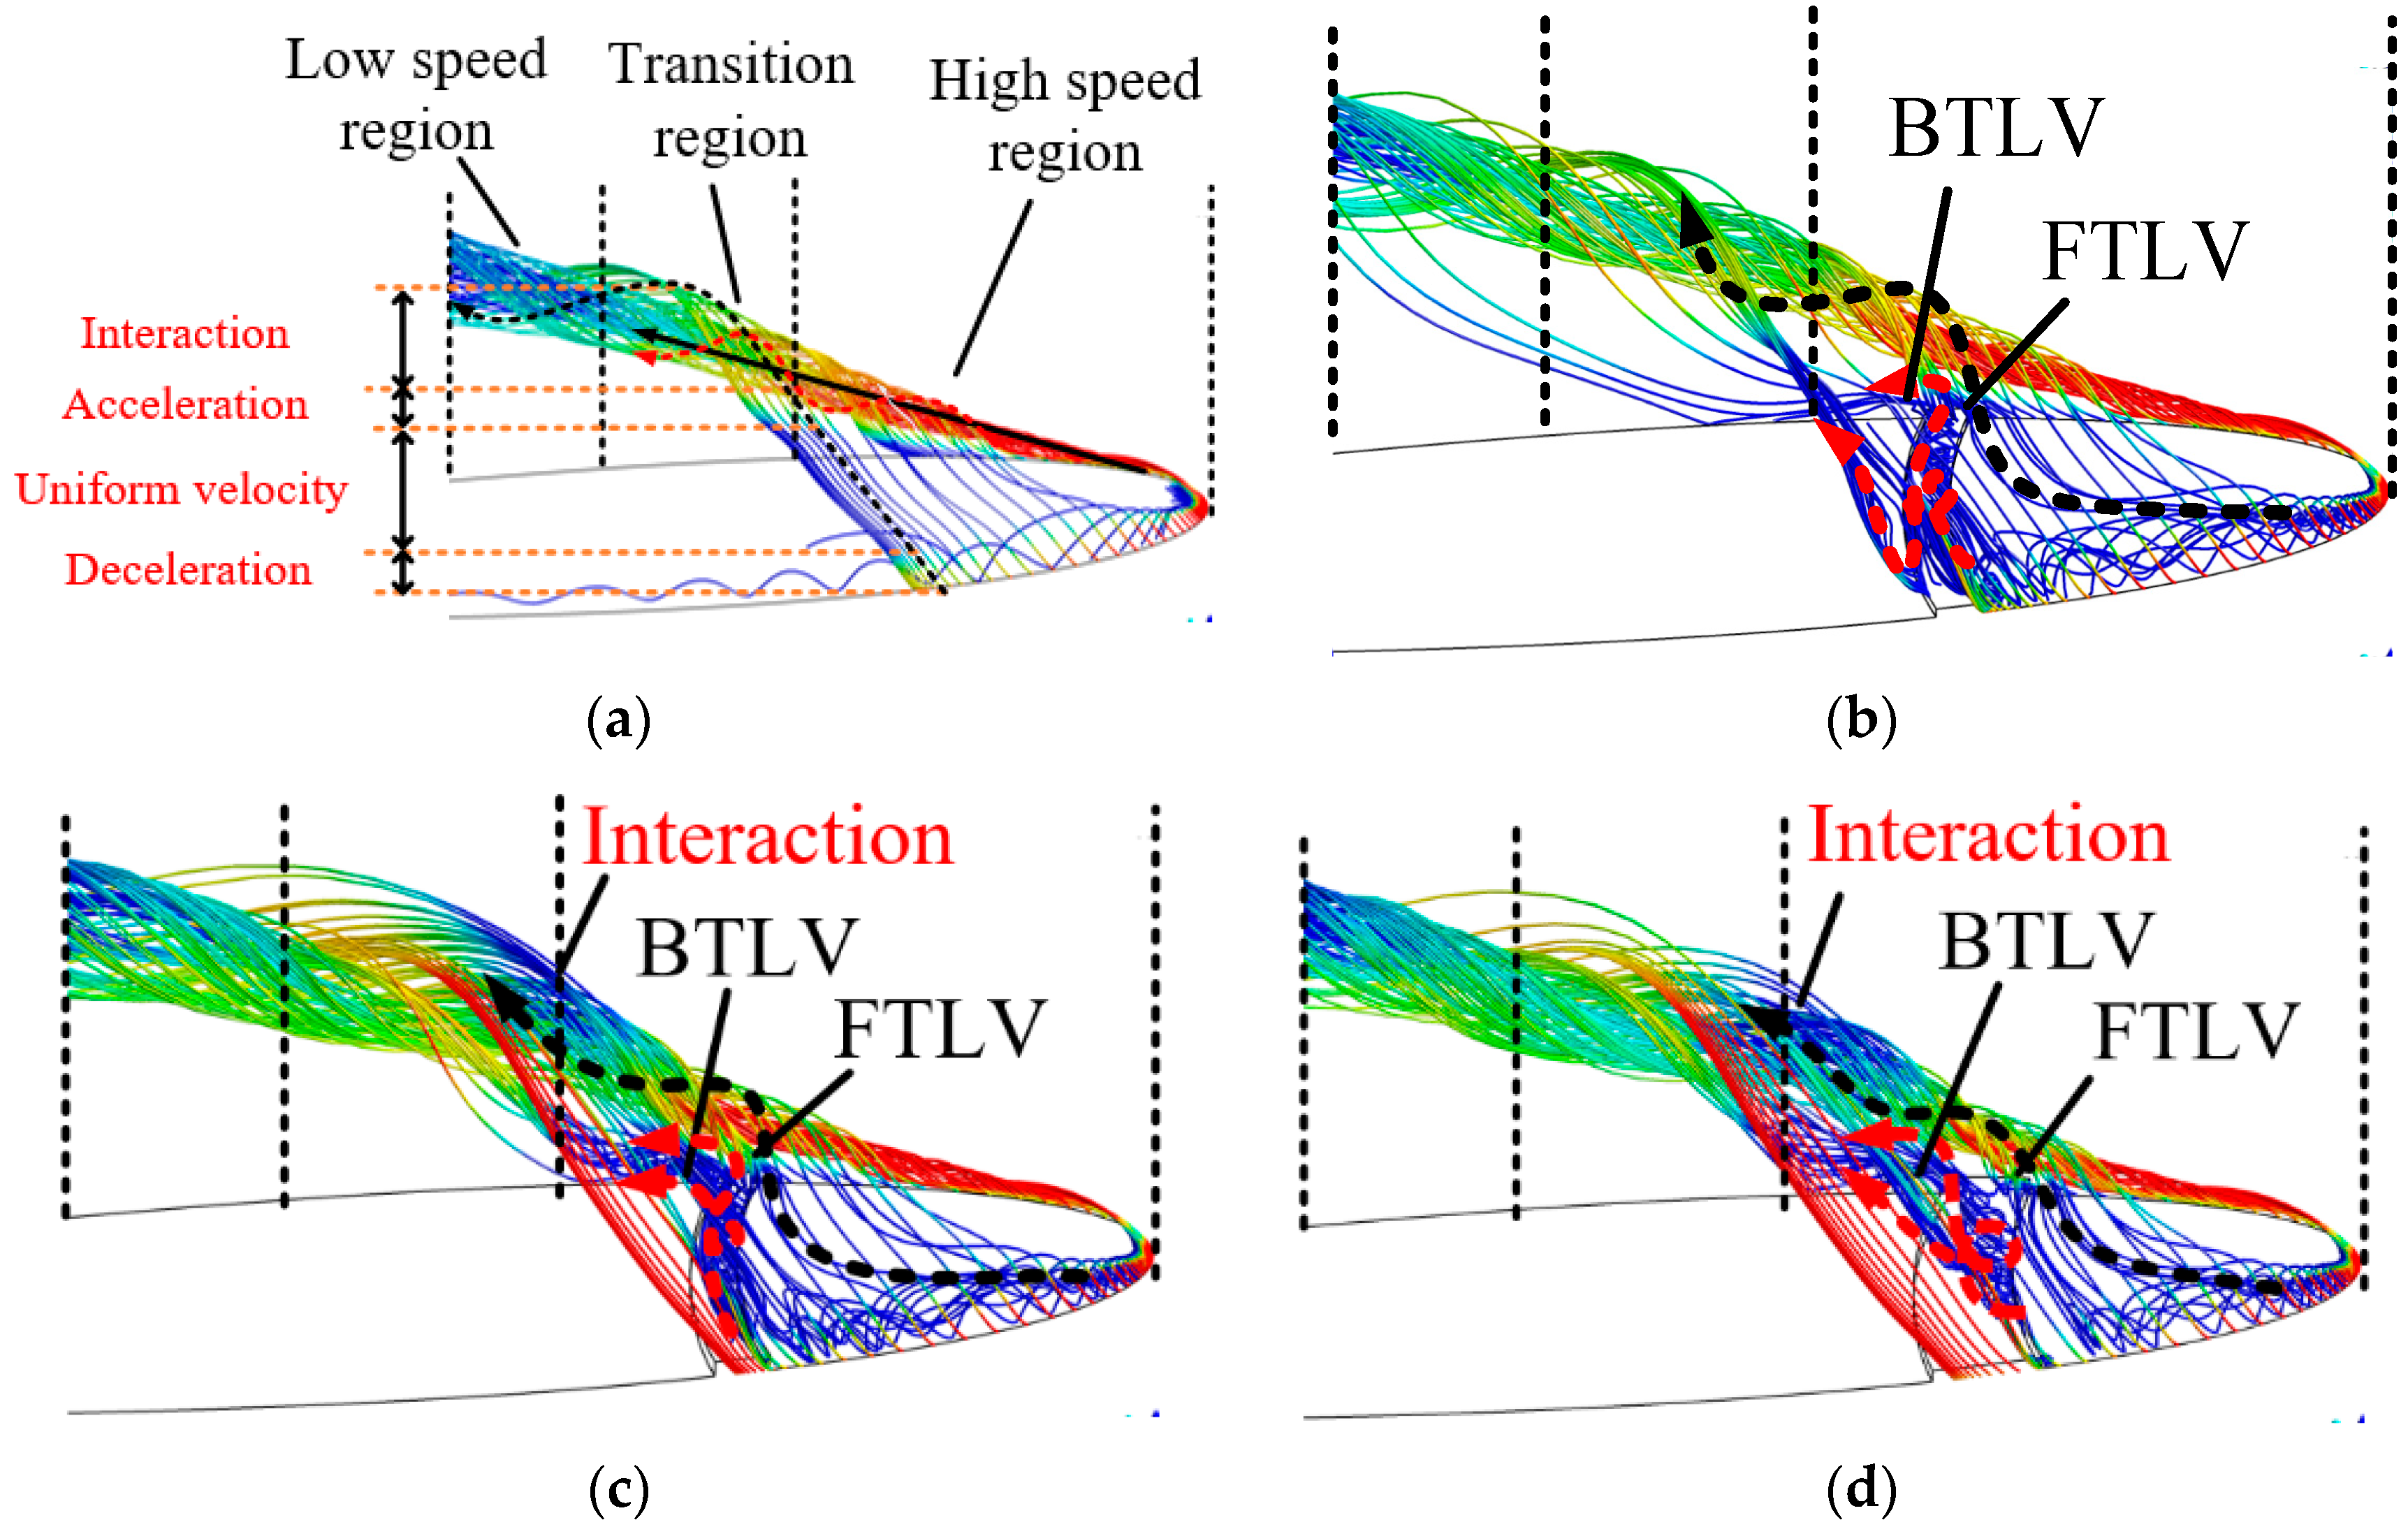
Although the present method can be applied to suppress the TLV, it also has a great impact on the flow pattern. An improper BSG may lead to aggravating the instability of the flow field and decrease energy performance further. Therefore, it is necessary to investigate the groove’s impact on the flow pattern. Figure 11 shows the streamline of the blade tip gap. It consists of two parts: one is the primary stream up the foil pressure face, the other part is tip leakage flow. The primary stream can be divided into the high-speed region, transition region, and low-speed region, as shown in Figure 11a according to the velocity intensity. The high-speed region is also the region with the maximum intensity of TLV. The fluid in the high-speed region spirals backward, gradually driving the surrounding fluid to spiral backward as the viscosity of the fluid. The leakage flow passes through the blade tip gap and enters the foil pressure surface with the rapid change of velocity. It can be divided into four stages, namely deceleration, uniform velocity, acceleration, and interaction. In stage one, when the leakage flow enters tip clearance from the suction surface, the velocity intensity gradually decreases as the obstruction affects the clearance. In stage two, the flow velocity is gradually stable in the tip clearance. In stage three, the flow enters the foil pressure surface from the tip clearance and accelerates by the primary stream. In stage four, the flow interacts with the primary stream and forms a whole structure, as shown in Figure 11a.
The tip leakage flow is significantly changed by the BSG. In the local resistance, caused by the groove, the leakage flow deposits in the groove first and then overflow from it, as the red arrow shown in Figure 11b–d. Besides, the silting effect, caused by fluid deposition, moves forward, making the leakage flow between the groove and the foil head concentrated in the area near the junction of the BSG and the airfoil pressure surface, as the dark arrow in Figure 11b–d.
The leakage flow in the optimized groove can be divide into two parts: part of the fluid overflows from the BSG and then flows into the foil pressure surface through the tip of foil. The other part flows into the pressure surface of foil along the BSG channel to further form the BTLV, as shown by the red dotted arrow in Figure 11b–d. The distribution of the two parts of fluid is sensitive to the shape of the groove. For Case A, the overflow leakage flow is dominant. For Case B, the leakage flow along the groove channel is dominant. The distribution of Case C is between Case A and B. This difference of the distribution is caused by the different local resistance loss of optimized grooves. With the enhancement of the leakage flow along the groove channel, the interaction between it and the primary stream is strengthened, which leads to the decrease of the PTLV area, as shown in Figure 11b,d.
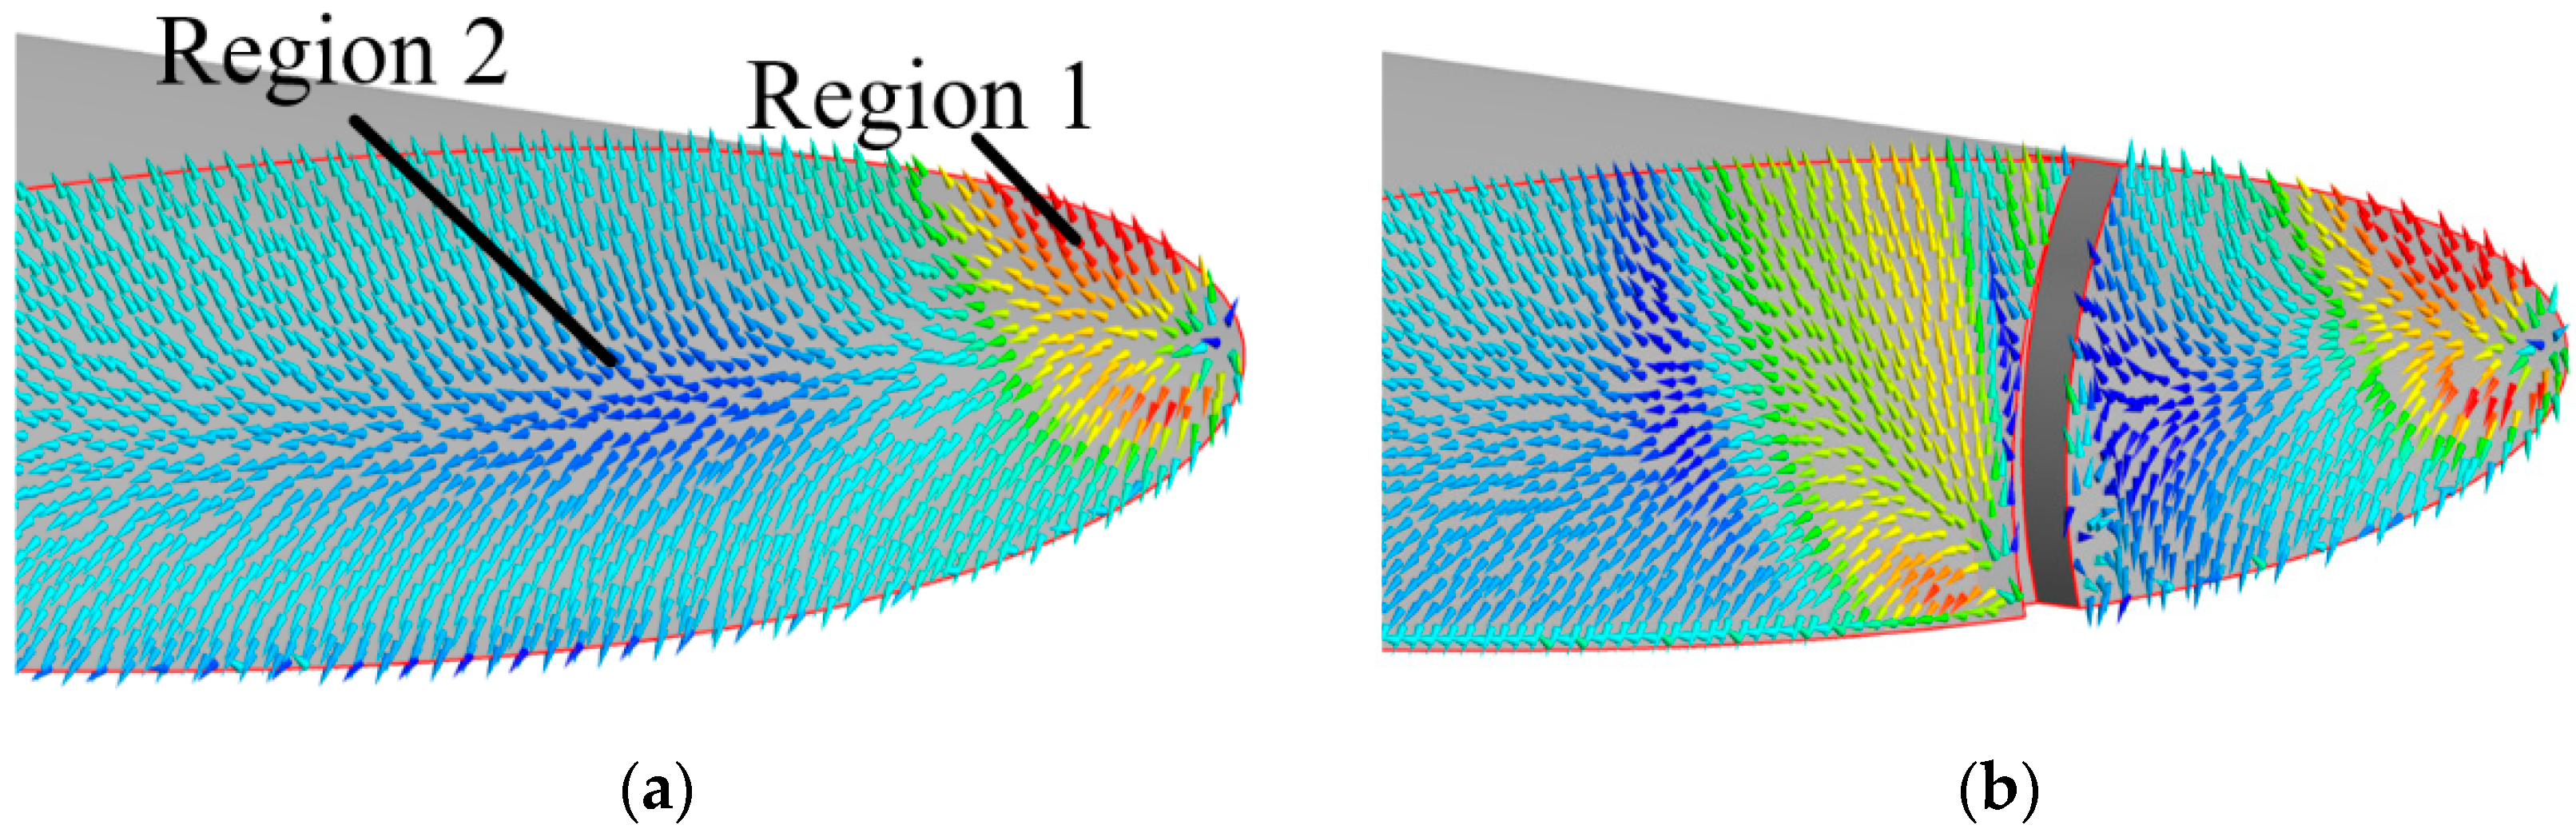
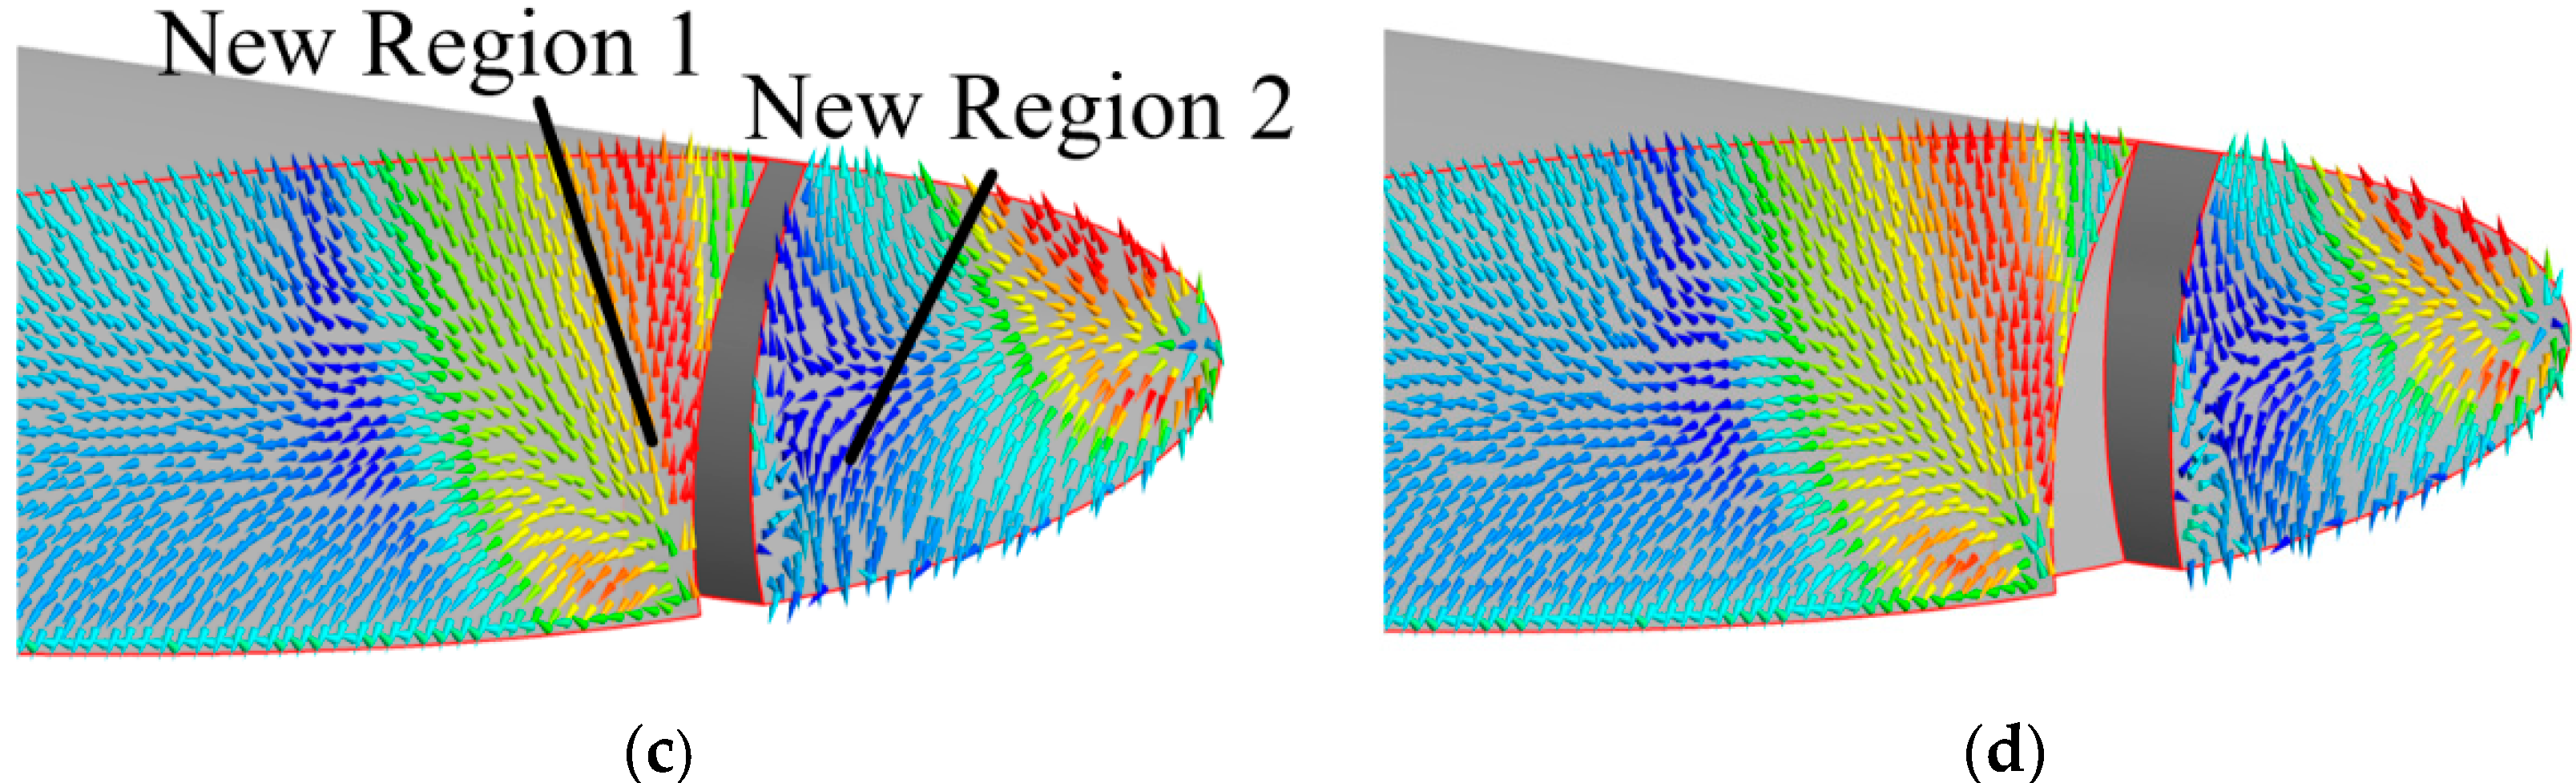
Figure 12 is the velocity vector of the foil tip. Due to the TLV effect, there is a high-speed region and a low-speed region at the tip of the initial airfoil, as shown in Region 1 and Region 2 in Figure 12a, respectively.
The new Region 1 and Region 2 are generated by the groove, as shown in Figure 12c. The size of the new Region 1 is related to the inflow angle of the fluid at the junction of the BSG and the suction surface of the foil, and the inflow angle is controlled by parameter θ. The θ of Case A, Case B, and Case C is 1.08°, 5.17°, and 8.28°, respectively. With the increase of θ, the inflow angle gradually increases, and the area of new Region 1 also increases.
5. Conclusions
In the present work, a parametric design method, which combines DOE, CFD, RSM, and MOGA, is briefly presented, and then it is employed to develop a BSG method to suppress TLV and increase the lift drag ratio. The effects of the BSG parameters on energy performance, flow patterns are systematically investigated. The main conclusions can be drawn as follows:
- (1)
- The preferred BSG foil, Case A, reduces the non-dimensional Q vortex isosurfaces area (Qarea = 2 × 107) by 5.14% and increases the lift drag ratio by 17.02%, compared to the initial case, proving that the present design strategy can be adapted to determine the preferred BSG configuration. However, some of the BSG configurations may cause performance deterioration. Therefore, the present BSG method should be adopted with caution.
- (2)
- According to the optimization result, when the present method is applied, a groove with a location far from the foil head, a tiny ration angle of θ, β, a 0.5 times gap size depth and an approximately gap size width is more contribute to improving the performance of the foil, as shown in Table 4.
- (3)
- Among the optimized parameters of BSG, groove depth d and groove width w have much more impact on foil performance. To match the optimization targets, the smaller groove depth is recommended. Besides, a wider groove width will significantly improve the lift drag ratio, but with energy loss.
- (4)
- The BSG can reduce the Q vortex area and slightly change the PTLV trajectory at the downstream. However, more vortex structure is produced, named GLV, BGLV, and FGLV, as shown in Figure 9.
- (5)
- The tip leakage flow is significantly affected by the BSG. Part of the leakage flow deposits in the groove first and then is divided into two parts. Part of the fluid overflows from the groove, and through the downstream blade tip into the primary stream. Another part of the fluid flows along the groove channel which further induces BGTV.
For the hydraulic airfoil, besides the TLV and lift drag ratio, the cavitation performance and pressure fluctuation under different inlet boundaries are also important. Therefore, enlarging the present strategy to consider the cavitation and unsteady characters would be valuable.
Author Contributions
Z.H. (Zanao Hu): Methodology, Numerical simulation, Data Analysis, Writing—Reviewing, and Editing; C.H.: Methodology, Numerical simulation, Data Analysis, Writing—Reviewing, and Editing; Z.H. (Zhenwei Huang): Data Analysis, Writing—Reviewing; J.Z.: Writing—Reviewing and Editing. All authors have read and agreed to the published version of the manuscript.
Funding
This research was funded by [National Natural Science of China] grant number [52077218].
Conflicts of Interest
The authors declare that they have no known competing financial interests or personal relationships that could have appeared to influence the work reported in this paper.
References
- Taha, Z.; Sugiyono, T.M.Y.S.T.; Ya, T. Sawada, Numerical investigation on the performance of Wells turbine with non-uniform tip clearance for wave energy conversion. Appl. Ocean. Res. 2011, 33, 321–331. [Google Scholar] [CrossRef]
- Lu, Y.; Wang, Z.; Liu, X.; Xiao, Y.; Chen, C.; Wang, H.; Yan, J. Numerical prediction of pressure pulsation for a low head bidirectional tidal bulb turbine. Energy 2015, 89, 730–738. [Google Scholar] [CrossRef]
- Heo, M.W.; Kim, K.Y.; Kim, J.H.; Choi, Y.S. High-efficiency design of a mixed-flow pump using a surrogate model. J. Mech. Sci. Technol. 2016, 30, 541–547. [Google Scholar] [CrossRef]
- Zhang, W.W.; Yu, Z.Y.; Zhu, B.S. Characteristic analysis on the pressure fluctuation in the impeller of a low specific speed mixed flow pump. IOP Conf. Ser. Mater. Sci. Eng. 2016, 129, 12035. [Google Scholar] [CrossRef] [Green Version]
- Zhang, W.; Yu, Z.; Zhu, B. Influence of Tip Clearance on Pressure Fluctuation in Low Specific Speed Mixed-Flow Pump Passage. Energies 2017, 10, 148. [Google Scholar] [CrossRef]
- You, D.; Mittal, R.; Wang, M.; Moin, P. Large-eddy simulation of a rotor tip-clearance flow. Aiaa J. 2013. [Google Scholar] [CrossRef] [Green Version]
- Decaix, J.; Dreyer, M.; Balarac, G.; Farhat, M.; Münch, C. RANS computations of a confined cavitating tip-leakage vortex. Eur. J. Mech. B Fluids 2018, 67, 198–210. [Google Scholar] [CrossRef] [Green Version]
- Guo, T.; Zhao, S.; Liu, C. Study on flow characteristics and flow ripple reduction schemes of spool valves distributed radial piston pump. Proc. Inst. Mech. Eng. Part C J. Mech. Eng. Sci. 2017, 231, 2291–2301. [Google Scholar] [CrossRef]
- Zhang, W.; Zhu, B.; Yu, Z.; Yang, C. Numerical study of pressure fluctuation in the whole flow passage of a low specific speed mixed-flow pump. Adv. Mech. Eng. 2017, 9, 168781401770765. [Google Scholar] [CrossRef] [Green Version]
- Experimental Study of the Effect of Blade Tip Clearance and Blade Angle Error on the Performance of Mixed-Flow Pump. SpringerLink. Available online: https://link.springer.com/article/10.1007/s11431-012-5080-6 (accessed on 7 August 2020).
- Hao, B.; Cao, S.L.; Chenglian, H.E.; Li, L.U. Experimental study of the effect of blade tip clearance and blade angle error on the performance of mixed-flow pump. Sci. China Technol. Sci. 2013, 56, 293–298. [Google Scholar] [CrossRef]
- Thakker, A.; Dhanasekaran, S.T. Computed effects of tip clearance on performance of impulse turbine for wave energy conversion. Renew. Energy 2004. [Google Scholar] [CrossRef]
- Kim, M.C.; Chun, H.H. Experimental Investigation into the performance of the Axial-Flow-Type Waterjet according to the Variation of Impeller Tip Clearance. Ocean Eng. 2007, 34, 275–283. [Google Scholar] [CrossRef]
- Inoue, M.; Kuroumaru, M.; Fukuhara, M. Behavior of Tip Leakage Flow behind an Axial Compressor Rotor. J. Eng. Gas. Turbines Power 1986, 108. [Google Scholar] [CrossRef]
- Lakshminarayana, B. Methods of Predicting the Tip Clearance Effects in Axial Flow Turbomachinery. J. Basic Eng. 1970, 92. [Google Scholar] [CrossRef]
- Miorini, R.L.; Wu, H.; Katz, J. The internal structure of the tip leakage vortex within the rotor of an axial waterjet pump. J. Turbomach. 2012, 134. [Google Scholar] [CrossRef]
- You, D.; Wang, M.; Moin, P.; Mittal, R. Study of tip-clearance flow in turbomachines using large-eddy simulation. Comput. Sci. Reng. 2004, 6. [Google Scholar] [CrossRef]
- You, D.; Wang, M.; Moin, P.; Mittal, R. Large-eddy simulation analysis of mechanisms for viscous losses in a turbomachinery tip-clearance flow. J. Fluid Mech. 2007, 586. [Google Scholar] [CrossRef] [Green Version]
- Guo, Q.; Zhou, L.; Wang, Z. Numerical evaluation of the clearance geometries effect on the flow field and performance of a hydrofoil. Renew. Energy 2016, 99. [Google Scholar] [CrossRef]
- Nho, Y.C.; Park, J.S.; Yong, J.S.; Kwak, J.S. Effects of turbine blade tip shape on total pressure loss and secondary flow of a linear turbine cascade. Int. J. Heat Fluid Flow 2012, 33. [Google Scholar] [CrossRef]
- Ye, X.; Zhang, J.; Li, C. Effect of blade tip pattern on performance of a twin-stage variable-pitch axial fan. Energy 2017. [Google Scholar] [CrossRef]
- Jung, Y.J.; Jeon, H.; Jung, Y.; Lee, K.J.; Choi, M. Effects of recessed blade tips on stall margin in a transonic axial compressor. Aerosp. Sci. Technol. 2016, 54. [Google Scholar] [CrossRef]
- Jung, Y.; Choi, M.; Park, J.Y.; Baek, J.H. Effects of recessed blade tips on the performance and flow field in a centrifugal compressor. J. Power Energy 2013, 227. [Google Scholar] [CrossRef]
- Xuemin, Y.; Pengmin, L.; Chunxi, L.; Xueliang, D. Numerical investigation of blade tip grooving effect on performance and dynamics of an axial flow fan. Energy 2015. [Google Scholar] [CrossRef]
- Zhao, J.L.; Wang, H.J.; Gong, R.Z.; Xuan, T.; Li, X.Y. Vortex structure research method based on Q-criterion in a high-speed centrifugal pump. In Proceedings of the 2014 ISFMFE-6th International Symposium on Fluid Machinery and Fluid Engineering, Wuhan, China, 22 October 2014. [Google Scholar] [CrossRef]
- Kolá, V.; Istek, J. Corotational and Compressibility Aspects Leading to a Modification of the Vortex-Identification Q-Criterion. Aiaa J. 2015, 53. [Google Scholar] [CrossRef]
- Dreyer, M.; Decaix, J.; Münch-Alligné, C.; Farhat, M. Mind the gap: A new insight into the tip leakage vortex using stereo-PIV. Exp. Fluids 2014, 55. [Google Scholar] [CrossRef]
- Li, D.; Wang, H.; Li, Z.; Nielsen, T.K.; Goyal, R.; Wei, X.; Qin, D. Transient characteristics during the closure of guide vanes in a pump-turbine in pump mode. Renew. Energy 2018, 118. [Google Scholar] [CrossRef]
- Huang, Z.; Huang, Z.; Fan, H. Influence of C groove on energy performance and noise source of a NACA0009 hydrofoil with tip clearance. Renew. Energy 2020, 159. [Google Scholar] [CrossRef]
- Ismail, C.; Urmila, B. Procedure for Estimation and Reporting of Uncertainty Due to Discretization in CFD Applications. J. Fluids Eng. 2008. [Google Scholar] [CrossRef] [Green Version]
- Liu, L.; Zhu, B.; Li, B.; Liu, X.; Zhao, Y. Parametric Design of an Ultrahigh-Head Pump-Turbine Runner Based on Multiobjective Optimization. Energies 2017, 10, 169. [Google Scholar] [CrossRef] [Green Version]
Figure 1.
Stereoview with measurement plane.

Figure 2.
Parametric bending shrinkage groove (BSG).

Figure 3.
Comparison of the axial velocity contour at cut-plane of z/c = 1 between experiment [27] and numerical simulation. (a) Experimental results. (b) Numerical results.
Figure 3.
Comparison of the axial velocity contour at cut-plane of z/c = 1 between experiment [27] and numerical simulation. (a) Experimental results. (b) Numerical results.

Figure 4.
Grid arrangement: (a) refined grid in tip clearance; (b) refined grid around the foil; (c) refined grid in the groove.
Figure 4.
Grid arrangement: (a) refined grid in tip clearance; (b) refined grid around the foil; (c) refined grid in the groove.

Figure 5.
The flow chart of the parametric design of the BSG.

Figure 6.
The optimization results.

Figure 7.
Effects of design parameters on foil performances. (a) Q votex isosurface(Qarea = 2 × 10⁷), (b) lift drag ratio.
Figure 7.
Effects of design parameters on foil performances. (a) Q votex isosurface(Qarea = 2 × 10⁷), (b) lift drag ratio.

Figure 8.
Global effects of design parameters. (a) Q votex isosurface(Qarea = 2 × 10⁷), (b) lift drag ratio.
Figure 8.
Global effects of design parameters. (a) Q votex isosurface(Qarea = 2 × 10⁷), (b) lift drag ratio.

Figure 9.
The vortex around the foil for different cases. (a) Origin case, (b) Case A, (c) Case B, (d) Case C.
Figure 9.
The vortex around the foil for different cases. (a) Origin case, (b) Case A, (c) Case B, (d) Case C.

Figure 10.
Velocity swirling strength contour on different planes. (a) Origin Case, (b) Case A, (c) Case B, (d) Case C.
Figure 10.
Velocity swirling strength contour on different planes. (a) Origin Case, (b) Case A, (c) Case B, (d) Case C.

Figure 11.
Streamline at the blade tip. (a) Origin Case, (b) Case A, (c) Case B, (d) Case C.

Figure 12.
Velocity vector of the foil tip. (a) Origin Case, (b) Case A, (c) Case B, (d) Case C.


Table 1.
Grid independence of the initial foil.
| Mesh | Mesh Nodes | CL | CD |
|---|---|---|---|
| Mesh1 | 3890724 | 1.232 | 0.0454 |
| Mesh2 | 4911942 | 1.236 | 0.0456 |
| Mesh3 | 5824564 | 1.241 | 0.0458 |
Table 2.
Grid independence of BSG.
| Mesh | Mesh Nodes | CL | CD |
|---|---|---|---|
| G-Mesh1 | 5613162 | 1.2396 | 0.0459 |
| G-Mesh2 | 5683407 | 1.2395 | 0.0459 |
| G-Mesh3 | 5754192 | 1.2392 | 0.0459 |
Table 3.
Range of variables.
| Range | d [mm] | l [mm] | θ [°] | β [°] | w [mm] |
|---|---|---|---|---|---|
| Lower bound | 1 (0.5δ) | 5 (0.05c) | 0 | −5 | 2 |
| Upper bound | 3 (1.5δ) | 20 (0.2c) | 10 | 5 | 5 |
Table 4.
Comparison of the selected scheme and the initial scheme.
| Case | Design Parameters | Qarea | R | ||||||
|---|---|---|---|---|---|---|---|---|---|
| d [mm] | l [mm] | θ [°] | β [°] | w [mm] | RSM | CFD | RSM | CFD | |
| A | 1.00 | 19.91 | 1.08 | −0.93 | 2.13 | 0.36 | 0.37 | 1.06 | 1.10 |
| B | 1.76 | 18.45 | 5.17 | 3.28 | 2.10 | - | 0.22 | - | 1.00 |
| C | 1.35 | 15.86 | 8.28 | −4.31 | 4.48 | - | 0.00 | - | 0.73 |
| Initial Case | - | - | - | - | - | - | 0.39 | - | 0.94 |
Publisher’s Note: MDPI stays neutral with regard to jurisdictional claims in published maps and institutional affiliations. |
© 2020 by the authors. Licensee MDPI, Basel, Switzerland. This article is an open access article distributed under the terms and conditions of the Creative Commons Attribution (CC BY) license (http://creativecommons.org/licenses/by/4.0/).
Share and Cite
MDPI and ACS Style
Hu, Z.; Huang, C.; Huang, Z.; Zhang, J. A Method of Bending Shrinkage Groove on Vortex Suppression and Energy Improvement for a Hydrofoil with Tip Gap. Processes 2020, 8, 1299. https://doi.org/10.3390/pr8101299
AMA Style
Hu Z, Huang C, Huang Z, Zhang J. A Method of Bending Shrinkage Groove on Vortex Suppression and Energy Improvement for a Hydrofoil with Tip Gap. Processes. 2020; 8(10):1299. https://doi.org/10.3390/pr8101299
Chicago/Turabian StyleHu, Zanao, Chuibing Huang, Zhenwei Huang, and Jinsong Zhang. 2020. "A Method of Bending Shrinkage Groove on Vortex Suppression and Energy Improvement for a Hydrofoil with Tip Gap" Processes 8, no. 10: 1299. https://doi.org/10.3390/pr8101299
Note that from the first issue of 2016, this journal uses article numbers instead of page numbers. See further details here.