Influence of Scanning Strategy on the Performances of GO-Reinforced Ti6Al4V Nanocomposites Manufactured by SLM


1
Jiangsu Key Laboratory of Advanced Food Manufacturing Equipment & Technology, Wuxi 214122, China
2
School of Mechanical Engineering, Jiangnan University, Wuxi 214122, China
3
Bingjiang College, Nanjing University of Information Science & Technology, Wuxi 214105, China
4
Additive Manufacturing Products Supervision and Inspection Center of Jiangsu Province, Wuxi Institution of Supervision & Testing on Product Quality, Wuxi 214100, China
*
Authors to whom correspondence should be addressed.
Metals 2020, 10(10), 1379; https://doi.org/10.3390/met10101379
Submission received: 9 September 2020
/
Revised: 7 October 2020
/
Accepted: 12 October 2020
/
Published: 16 October 2020
Abstract
:In this work, the effects of line (L-scanning strategy), stripe (S-scanning strategy), hollow square (H-scanning strategy) and chess board partition (C-scanning strategy) on the performances of graphene oxide reinforced Ti6Al4V matrix nanocomposites (GO/TC4) as fabricated by selective laser melting (SLM) were investigated. Numerical temperature field simulation of four different scanning strategies was utilized to investigate the effects of thermal concentration on SLM-processed GO/TC4 nanocomposites, linking to its micro-voids, surface roughness, porosity, microhardness and tribological properties. The proposed simulation scheme is validated by comparing the simulated thermal analysis with experimental results. Simulation results show that the thermal concentration effects of a part during SLM process is distinctive under different scanning strategies, with the slowest cooling rate of 64,977.5 °C/s that is achieved by C-scanning strategy specimen. The experimental results indicate that the performances of the L-scanning strategy or S-scanning strategy sample are seriously affected by the thermal concentration, causing a large number of micro-voids and defects. All the experimental results suggest that the sample using C-scanning strategy exhibits the optimal performance of all investigated specimens, which closely correlates with its lowest temperature gradients. This study highlights the importance of using a partition scanning strategy during SLM process, which can be easily extended to other powder bed fusion process.
1. Introduction
Ti6Al4V (TC4) alloy has been widely used in marine, aerospace and biomedical fields due to its excellent properties such as low density, high specific strength, excellent corrosion resistance and biocompatibility [1,2]. Accordingly, it is one of the commonly used materials for additive manufacturing (AM) of components with functional and complex geometry. As an emerging additive manufacturing technology, selective laser melting (SLM) has considerable potential in fabricating metallic parts with any shape, which is unlimited by the type of material [3,4]. However, the low elastic modulus, poor wear resistance and low thermal conductivity of TC4 limit its further application [5,6].
Recently, graphene oxide (GO) has attracted tremendous attentions, owing to its excellent mechanical properties, good thermal conductivity (5300 W/(m·K)), high specific surface area (2630 m2/g) and high strength, which is considered as a promising filler introduced into metal matrices. Xiao et al. [7] demonstrated that selective laser melting is a viable method to fabricate graphene/Inconel 718 composites, and the addition of graphene nanoplatelets leads to a significant strengthening of Inconel 718 alloy, as well as the improvement of its tribological performance. Zhao et al. [8] prepared grapheme/Al composites by selective laser melting, which confirmed that the formation of Al-C covalent bonds and Al-Al metallic bonds increased the interfacial bonding strength. Wen et al. [9] fabricated RGO/S136 MMCs by combining liquid deposition with selective laser melting and demonstrated that the addition of RGO with appropriate content can improve the mechanical properties of the substrate. Zhao et al. [10] found that the SLMed Fe/GO composites had a finer grain size, higher hardness and faster biodegradation rate in comparison to the pure Fe. Therefore, as an ideal reinforcement, GO, with its huge specific surface area, excellent mechanical properties and good thermal conductivity, can be compatible with specific applications that need high thermal conductivity and excellent wear resistance.
However, during the preparation of GO/TC4 nanocomposites, the processing parameters, such as scanning speed, laser power, hatch spacing and layer thickness, play an important role on the quality of SLM-processed products, which is under extensive exploration. For example, Liu et al. [11] conducted an investigation on how the hatching space, scanning speed and the solid solution of Al affect the surface quality, relative density and mechanical properties of SLMed AZ61. Li et al. [12] also investigated the mechanical and tribological properties of the SLMed AlSi10Mg Alloy manufactured with different building directions and hatching space. The effects of TC4 samples prepared by different scanning speed and scanning strategies on its porosity and grain structure were also studied by Thijs et al. [13]. Moreover, in case of different scanning strategies, the positions and sequences of laser is considerably different, causing a difference in temperature distributions, which will influence the density, surface roughness and mechanical properties of SLM-processed parts. Qiu et al. [14] compared the effects of three different scanning strategies on the surface structure and porosity of 316L. Salman et al. [15] investigated the effects of different scanning strategies on the microstructure and mechanical behaviors of 316L stainless steel synthesized by SLM, which indicated that the material manufactured by stripe strategy with contour performed the best mechanical properties. Yan et al. [16] focused their investigation on the effects of meander, stripe, and chess board scanning strategies on overall stress values of SLMed parts, which demonstrated that the distribution of stress was more uniform when using chess board scanning strategies. Hence, it is highly desirable to study the effects of different scanning strategies on the properties of GO/TC4 nanocomposites, while fewer researches focus on the combination of simulation and experiment of the composites.
It was demonstrated from preliminary research that GO/TC4 nanocomposites show optimal performances when the content of reinforcement phase was 0.5 wt.%. Hence, 0.5 wt.% GO was introduced into the TC4 matrix in this work, and then GO/TC4 nanocomposites were successfully manufactured by SLM technology. Combining with the numerical simulation of temperature fields, the effects of line, stripe, hollow square and chess board scanning strategy on the properties of GO/TC4 nanocomposites were investigated, using Profilometer, Image-pro Plus software, Archimedes drainage method, Tribometer and Scanning electron microscope (SEM), which suggests the efficacy of chess board scanning strategy to fabricate GO/TC4 nanocomposites with excellent performances.
2. Materials and Methods
2.1. Preparation of GO/TC4 Nanocomposites
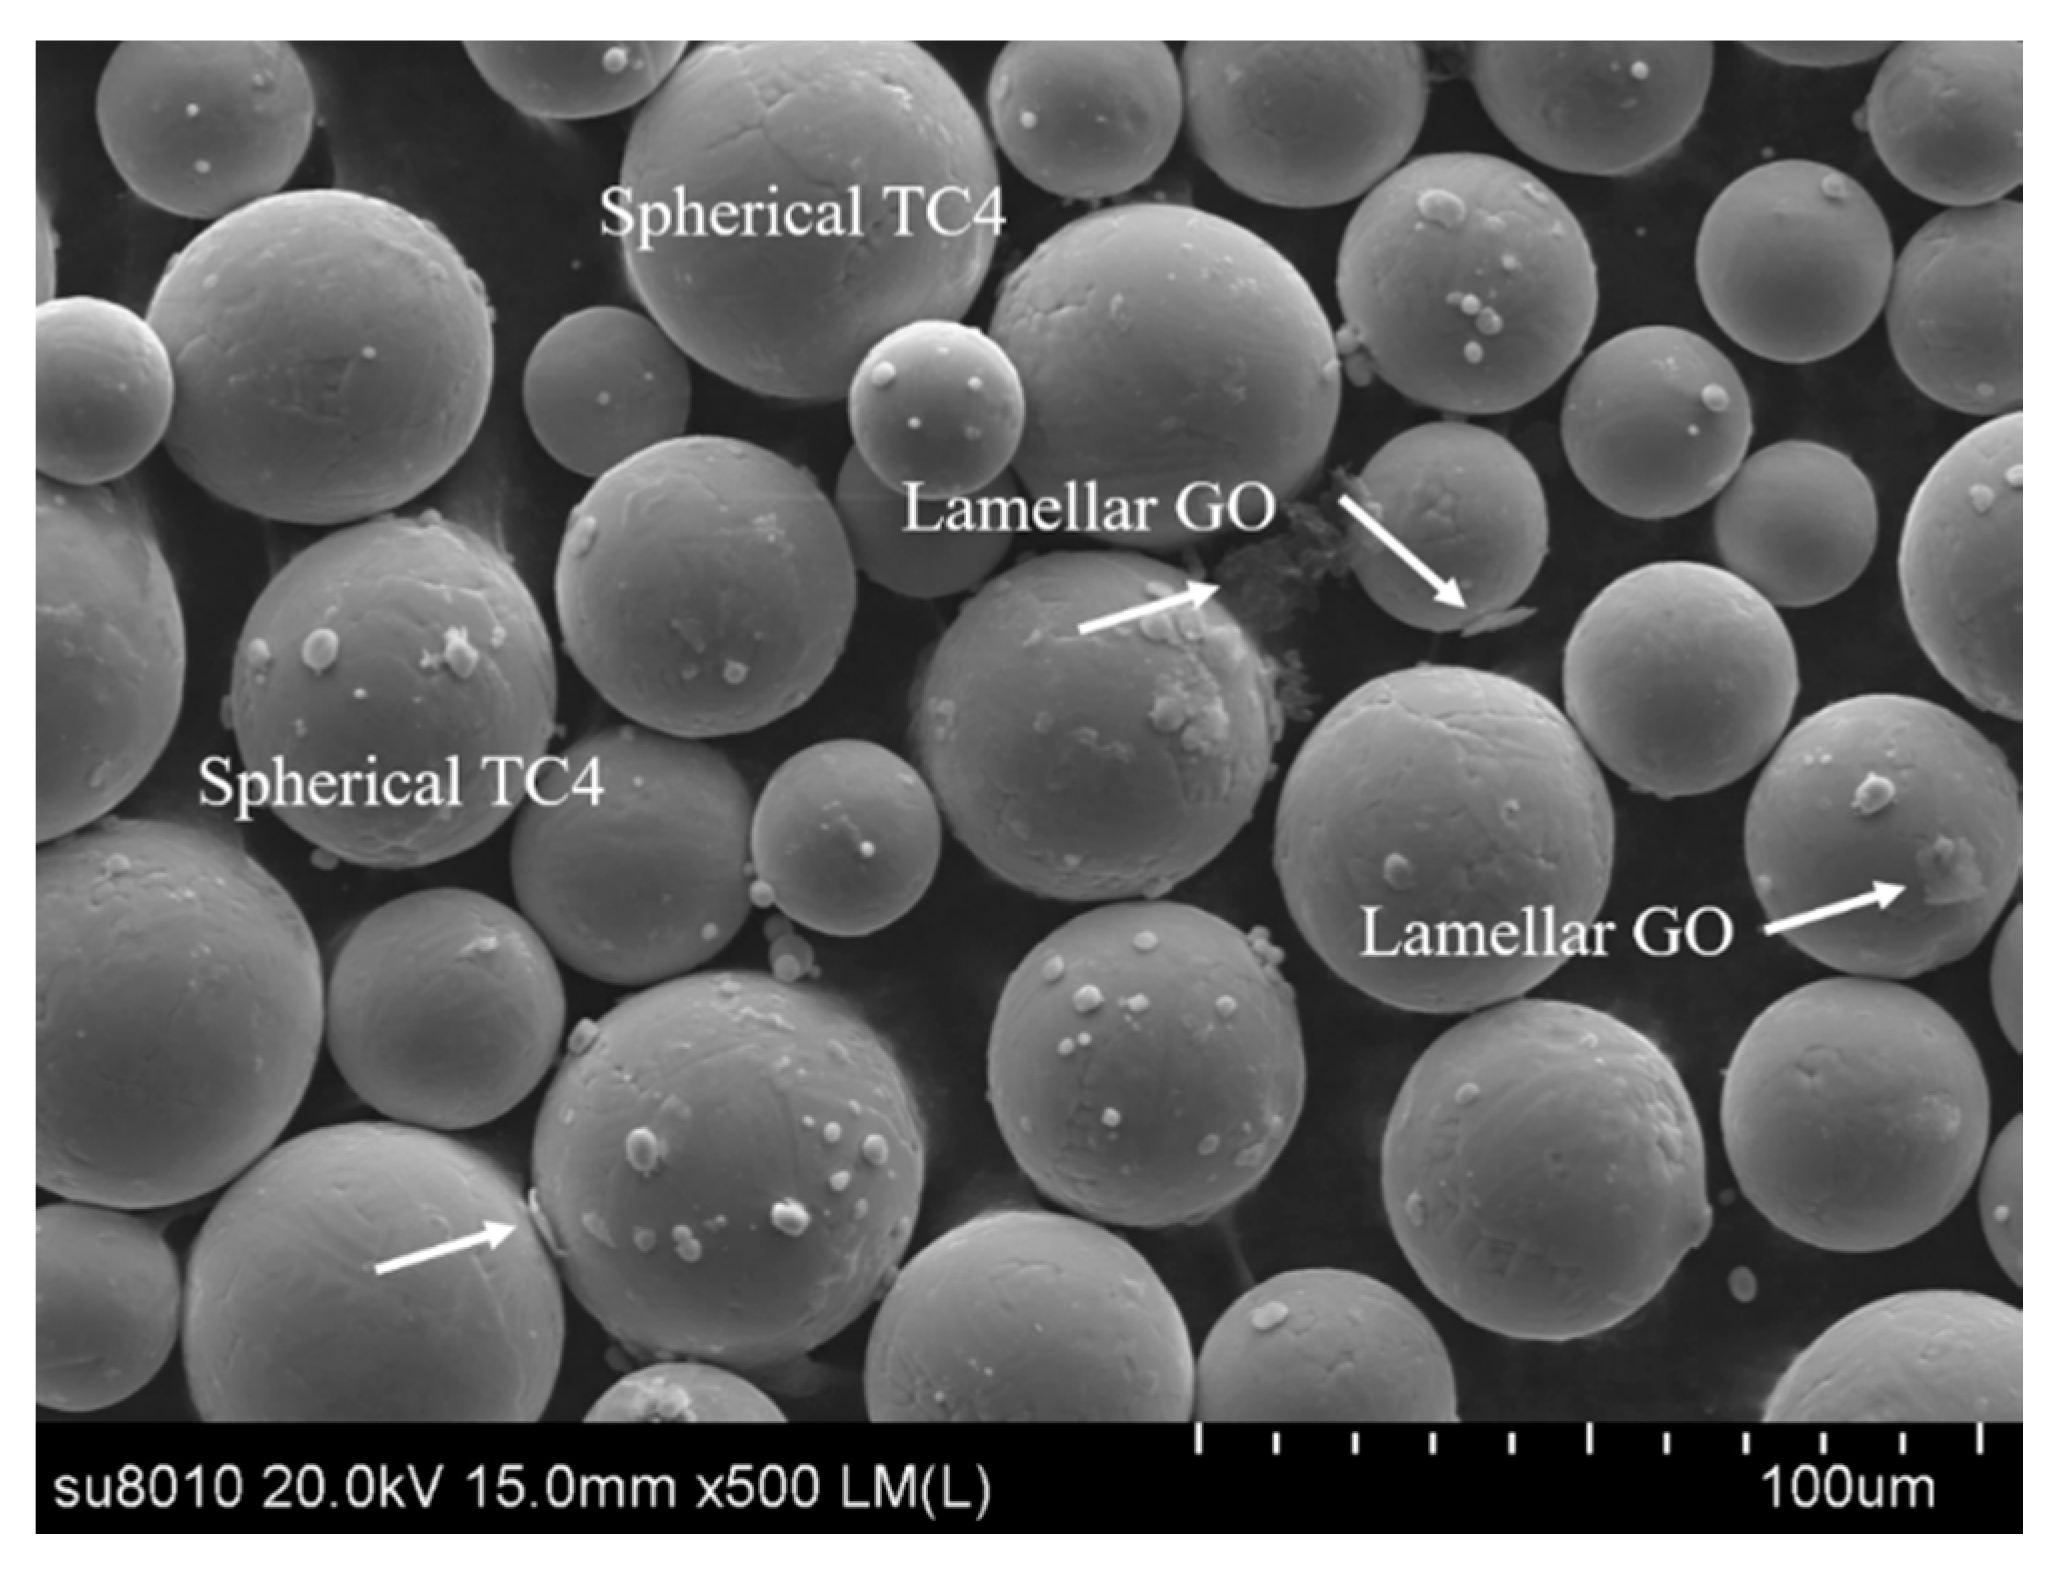
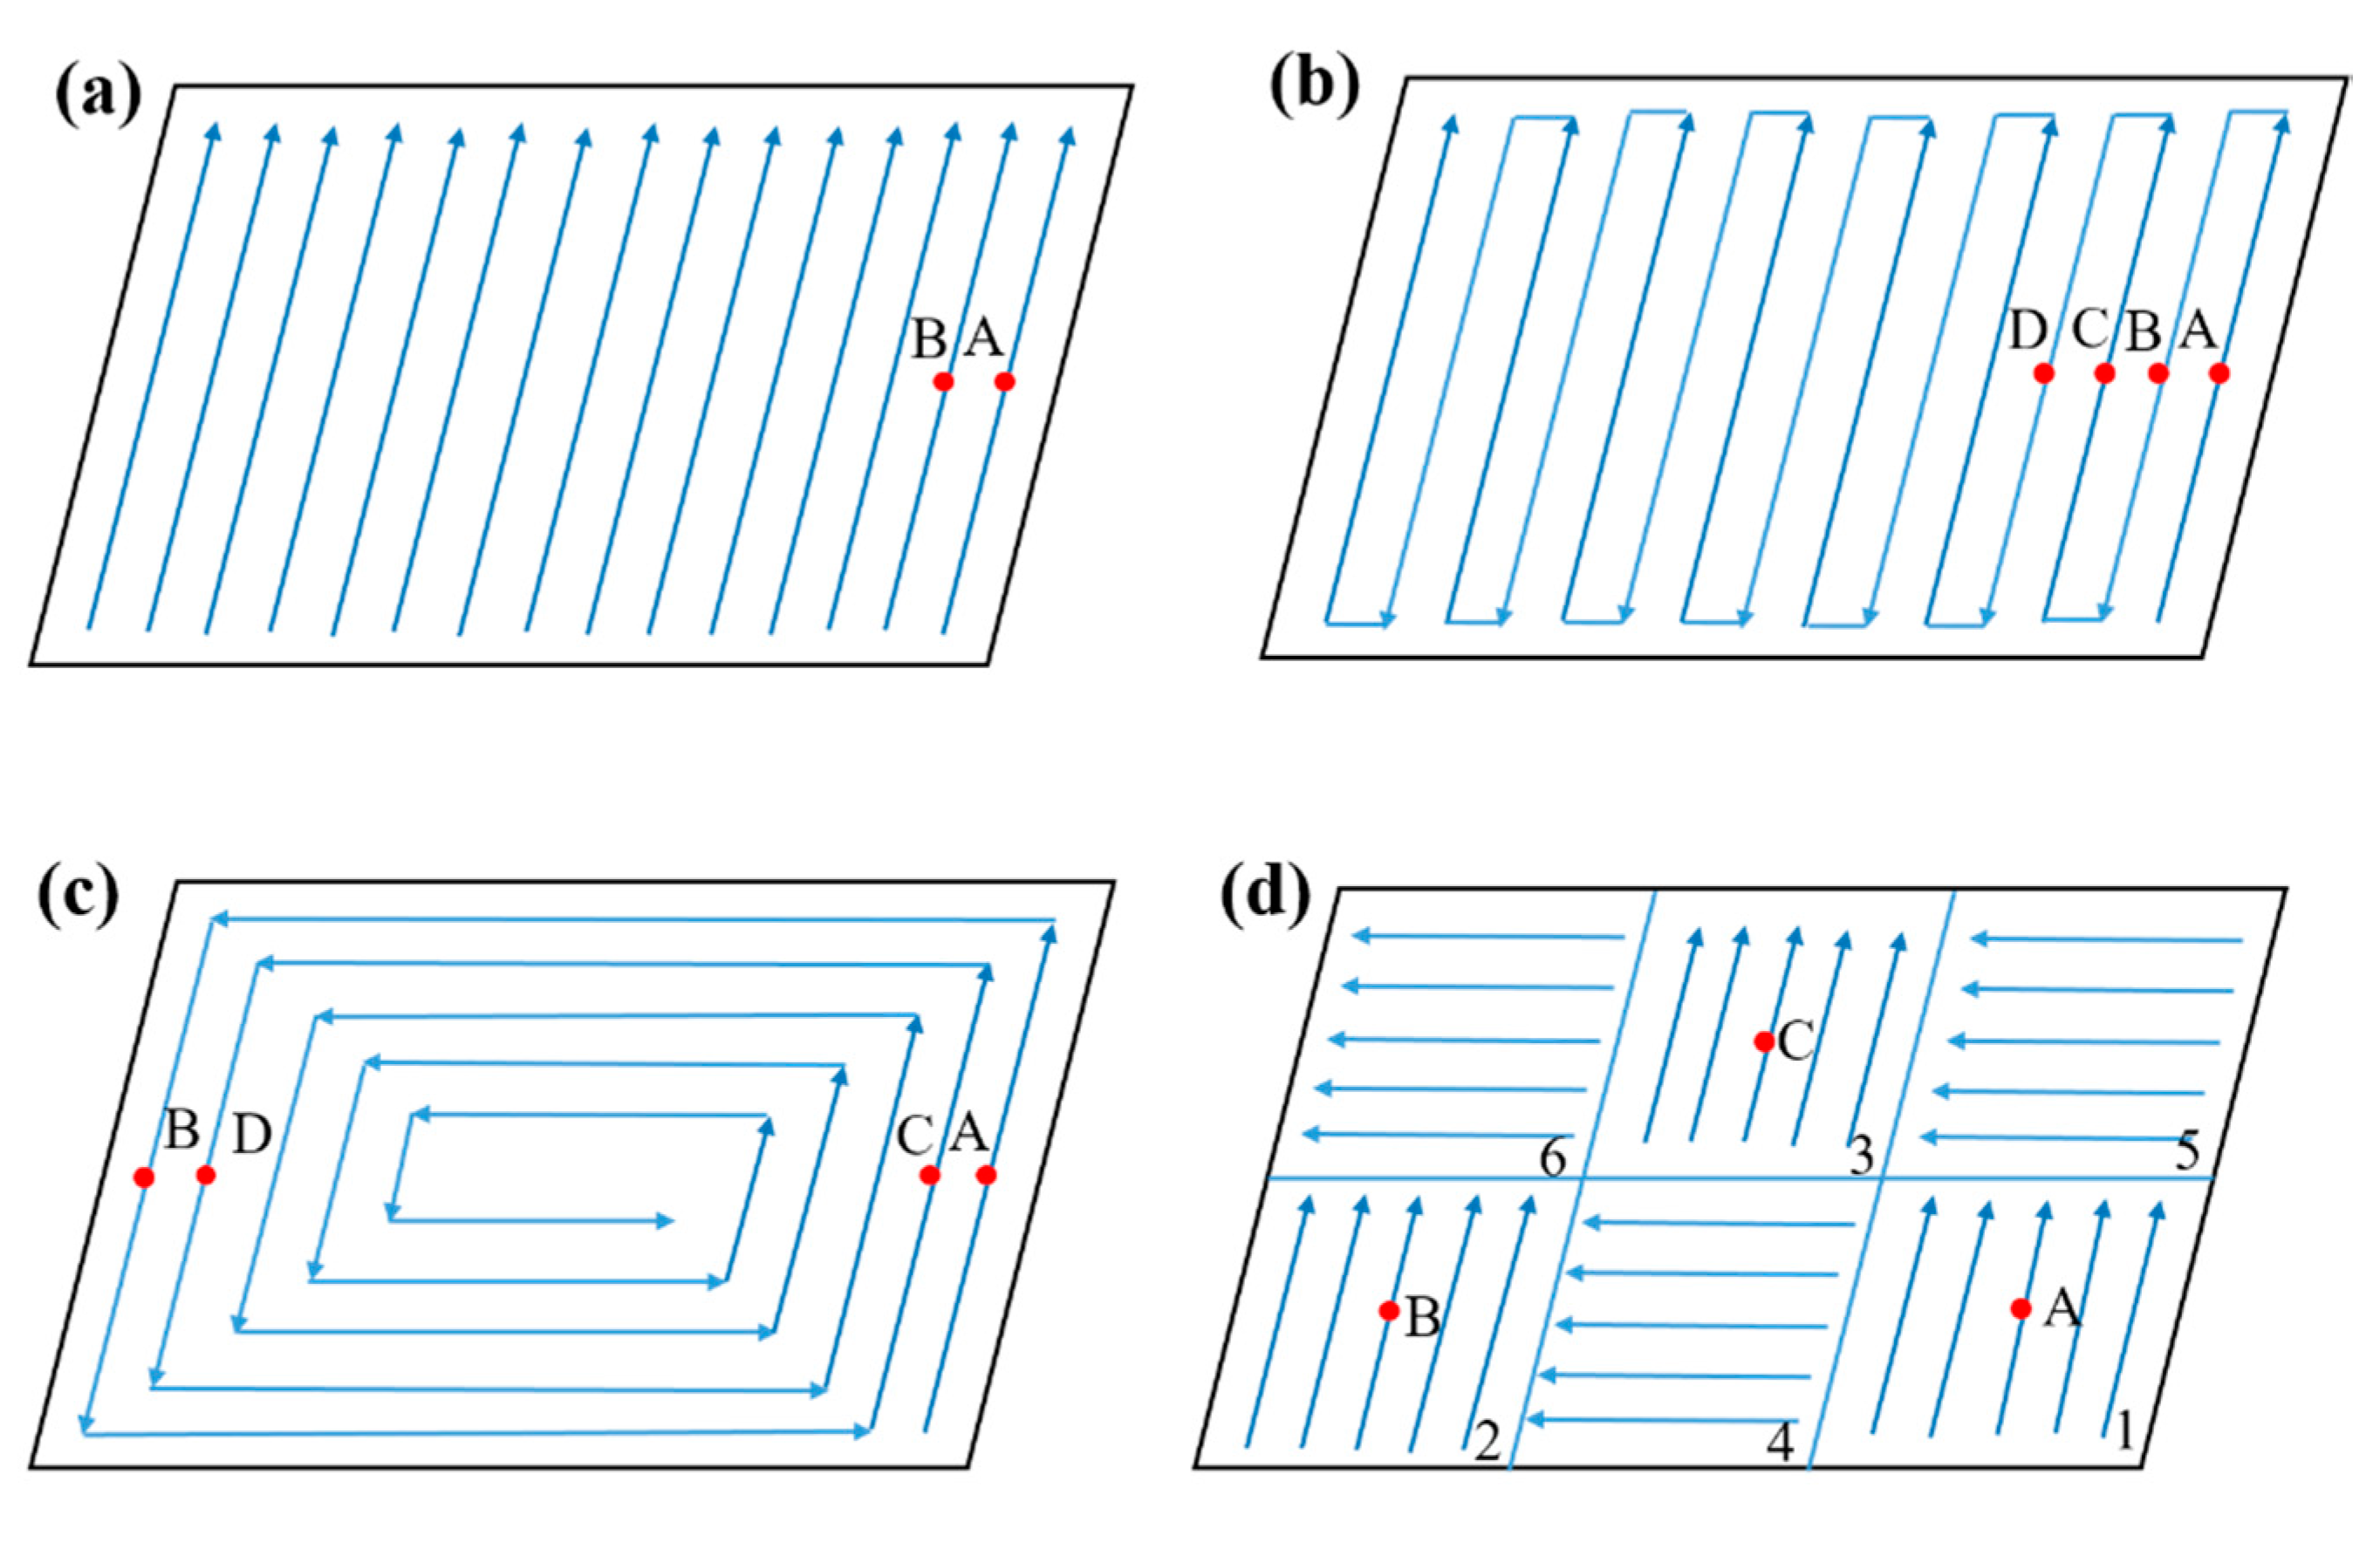
The TC4 powder with a particle size range from 15 to 50 μm was supplied by Falcontech Rapid Manufacturing Co., Ltd., Wuxi, China, and mixed with 0.5% weight ratio of graphene oxide sheets purchased from Shanghai Carbon Source Huigu New Material Technology Co., Ltd., Shanghai, China. The GO sheets and TiAl4V powders were mixed by using a QM-3SP2 planetary ball mill (Nanjing Nanda Instrument Co., Nanjing, China) at a speed of 400 r/min, for 30 min, and the stainless steel ball had a diameter of 4 and 8 mm. Graphene oxide sheets were easily find on the SEM image, as shown in Figure 1. GO/TC4 nanocomposites with a dimension of 12 mm × 10 mm × 3 mm were manufactured by SLM, under four different scanning strategies of line (L-scanning strategy), stripe (S-scanning strategy), hollow square (H-scanning strategy) and chess board partition (C-scanning strategy), using a YMLASER YLM-120 device (Suzhou, China) under an argon atmosphere with an oxygen level of 0.1%. The four scanning strategies used in this work were presented in Figure 2, and the process parameters were selected according to the studies of Maamoun et al. [17] and Lu et al. [18], as listed in Table 1.
2.2. Finite Element Model for Thermal Analysis
To further analyze the temperature distributions of GO/TC4 samples manufactured by different scanning strategies, ANSYS Mechanical APDL 15.0 (ANSYS, Canonsburg, PA, USA) is proposed to establish the transient finite element model for thermal analysis of the SLM process. The following section presents the essential features of the model [19,20].
The initial and ambient temperature is set as 298 K in the whole system, and the boundary condition is defined as follows:
where Q represents the rate of heat flow, h is the heat convection coefficient, Ts is the environment temperature, σ is the Stefan-Boltzman constant and ε is the emissivity of the powder bed surface.
The simulation accuracy of temperature field in the SLM process depends on the thermal properties of materials, including density, thermal conductivity and specific heat capacity, which are all highly non-linear with the change of temperature and phase transformation. Accordingly, in this research, temperature-dependent material properties are used to capture the rapid change of material properties with the variation of temperature. Moreover, SLM technology is a melting and solidification process of metal powder, which is equivalent to include the latent heat during the melting process. Herein, the phase change is modeled based on the apparent heat-capacity method, and the enthalpy of the solid or powder is defined as follows:
where is the density of powder bed, and c is the specific heat capacity of powder bed.
The thermal physical parameters of metal matrix nanocomposites can be obtained by the following equation:
where Mphase and Mmatrix are the thermal physical parameters of reinforced phase and matrix, composite materials, respectively; and φ is the proportion of reinforced phase.
The Gaussian point heat source has been widely used for finite element modeling of SLM process, which can be derived as follows:
where A is the laser energy absorption coefficient, P is the laser power that is selected as 160 W, r is the distance from any point on the powder bed to the center of the laser spot and r0 is the radius of the laser spot that is selected as 50 μm.
2.3. Material Characterization
After preparation of GO/TC4 nanocomposites, the samples were coarsely ground with abrasive paper of #250, #400 and #800, respectively, and finely ground with sandpaper of #1500 and #2000. Then, they were polished in alumina polishing solution [21]. All specimens for material characterization and tribological test were ground and polished by the YMP-2 equipment (Shanghai Jinxiang Machinery Equipment Co., Ltd., Shanghai, China), and their surface morphologies were observed, using white light interference Profilometry (MFD-D, Rtec company, Delaware City, DE, USA). The surface roughness was measured in horizontal and vertical directions. Moreover, the volume porosity of samples manufactured by four scanning strategies was calculated based on the Archimedes drainage method, while the surface porosity was calculated by the relative ratio of the defect area to the surface area, using Image-Pro Plus software. It should be underlined that the surface roughness and porosity of each sample were repeated five times, to obtain an average value.
2.4. Tribological Test
The tribological tests of GO/TC4 nanocomposites sliding against with Si3N4 ball (a diameter of 6 mm) were carried out on a tribometer (MFT-500, Rtec company, Delaware City, DE, USA) with a reciprocating ball-on-plate sliding test mode under the condition of dry friction. The tests were conducted at a load of 10 N with a frequency for 1 Hz and a sliding distance for 4 mm. In addition, all experiments were performed at room temperature. Herein, each test was repeated three times, and the average value was applied. Scanning electron microscope (SEM, SU8010, Hitachi, Tokyo, Japan) was utilized to observe the worn morphologies, and the wear volume was calculated by using the Profilometry mentioned above.
3. Results and Discussion
3.1. Numerical Simulation of Temperature Fields
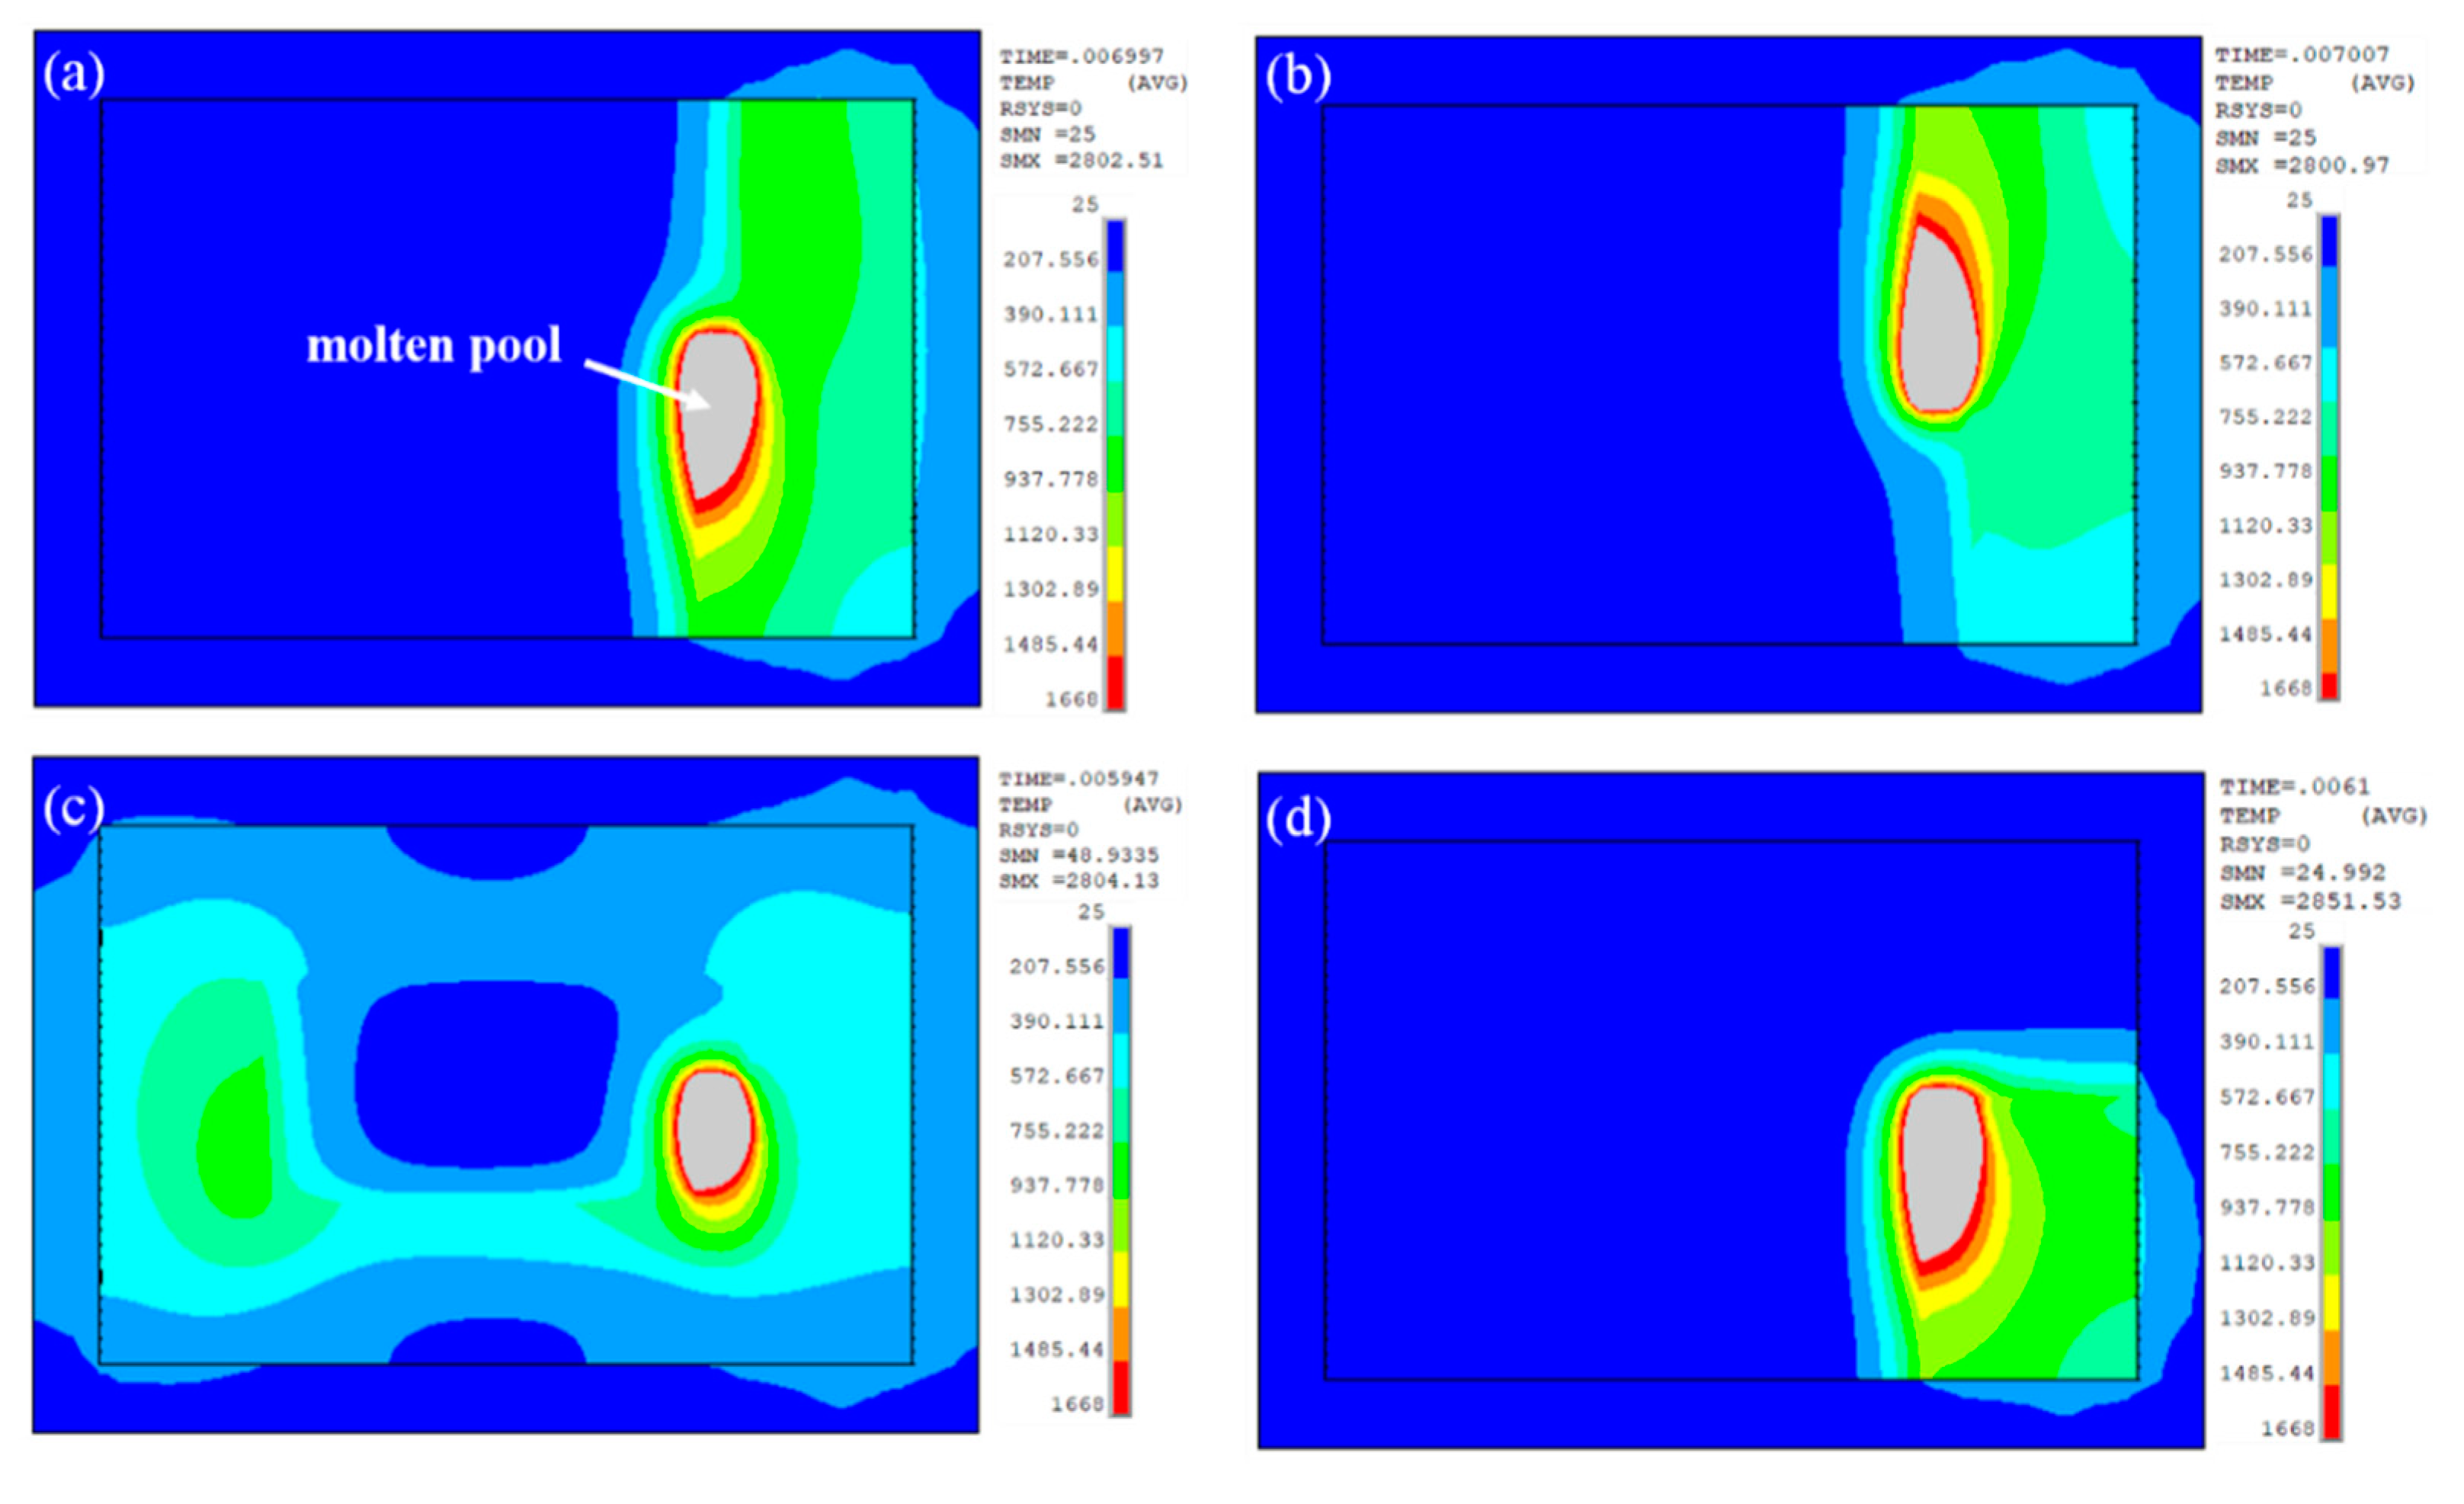
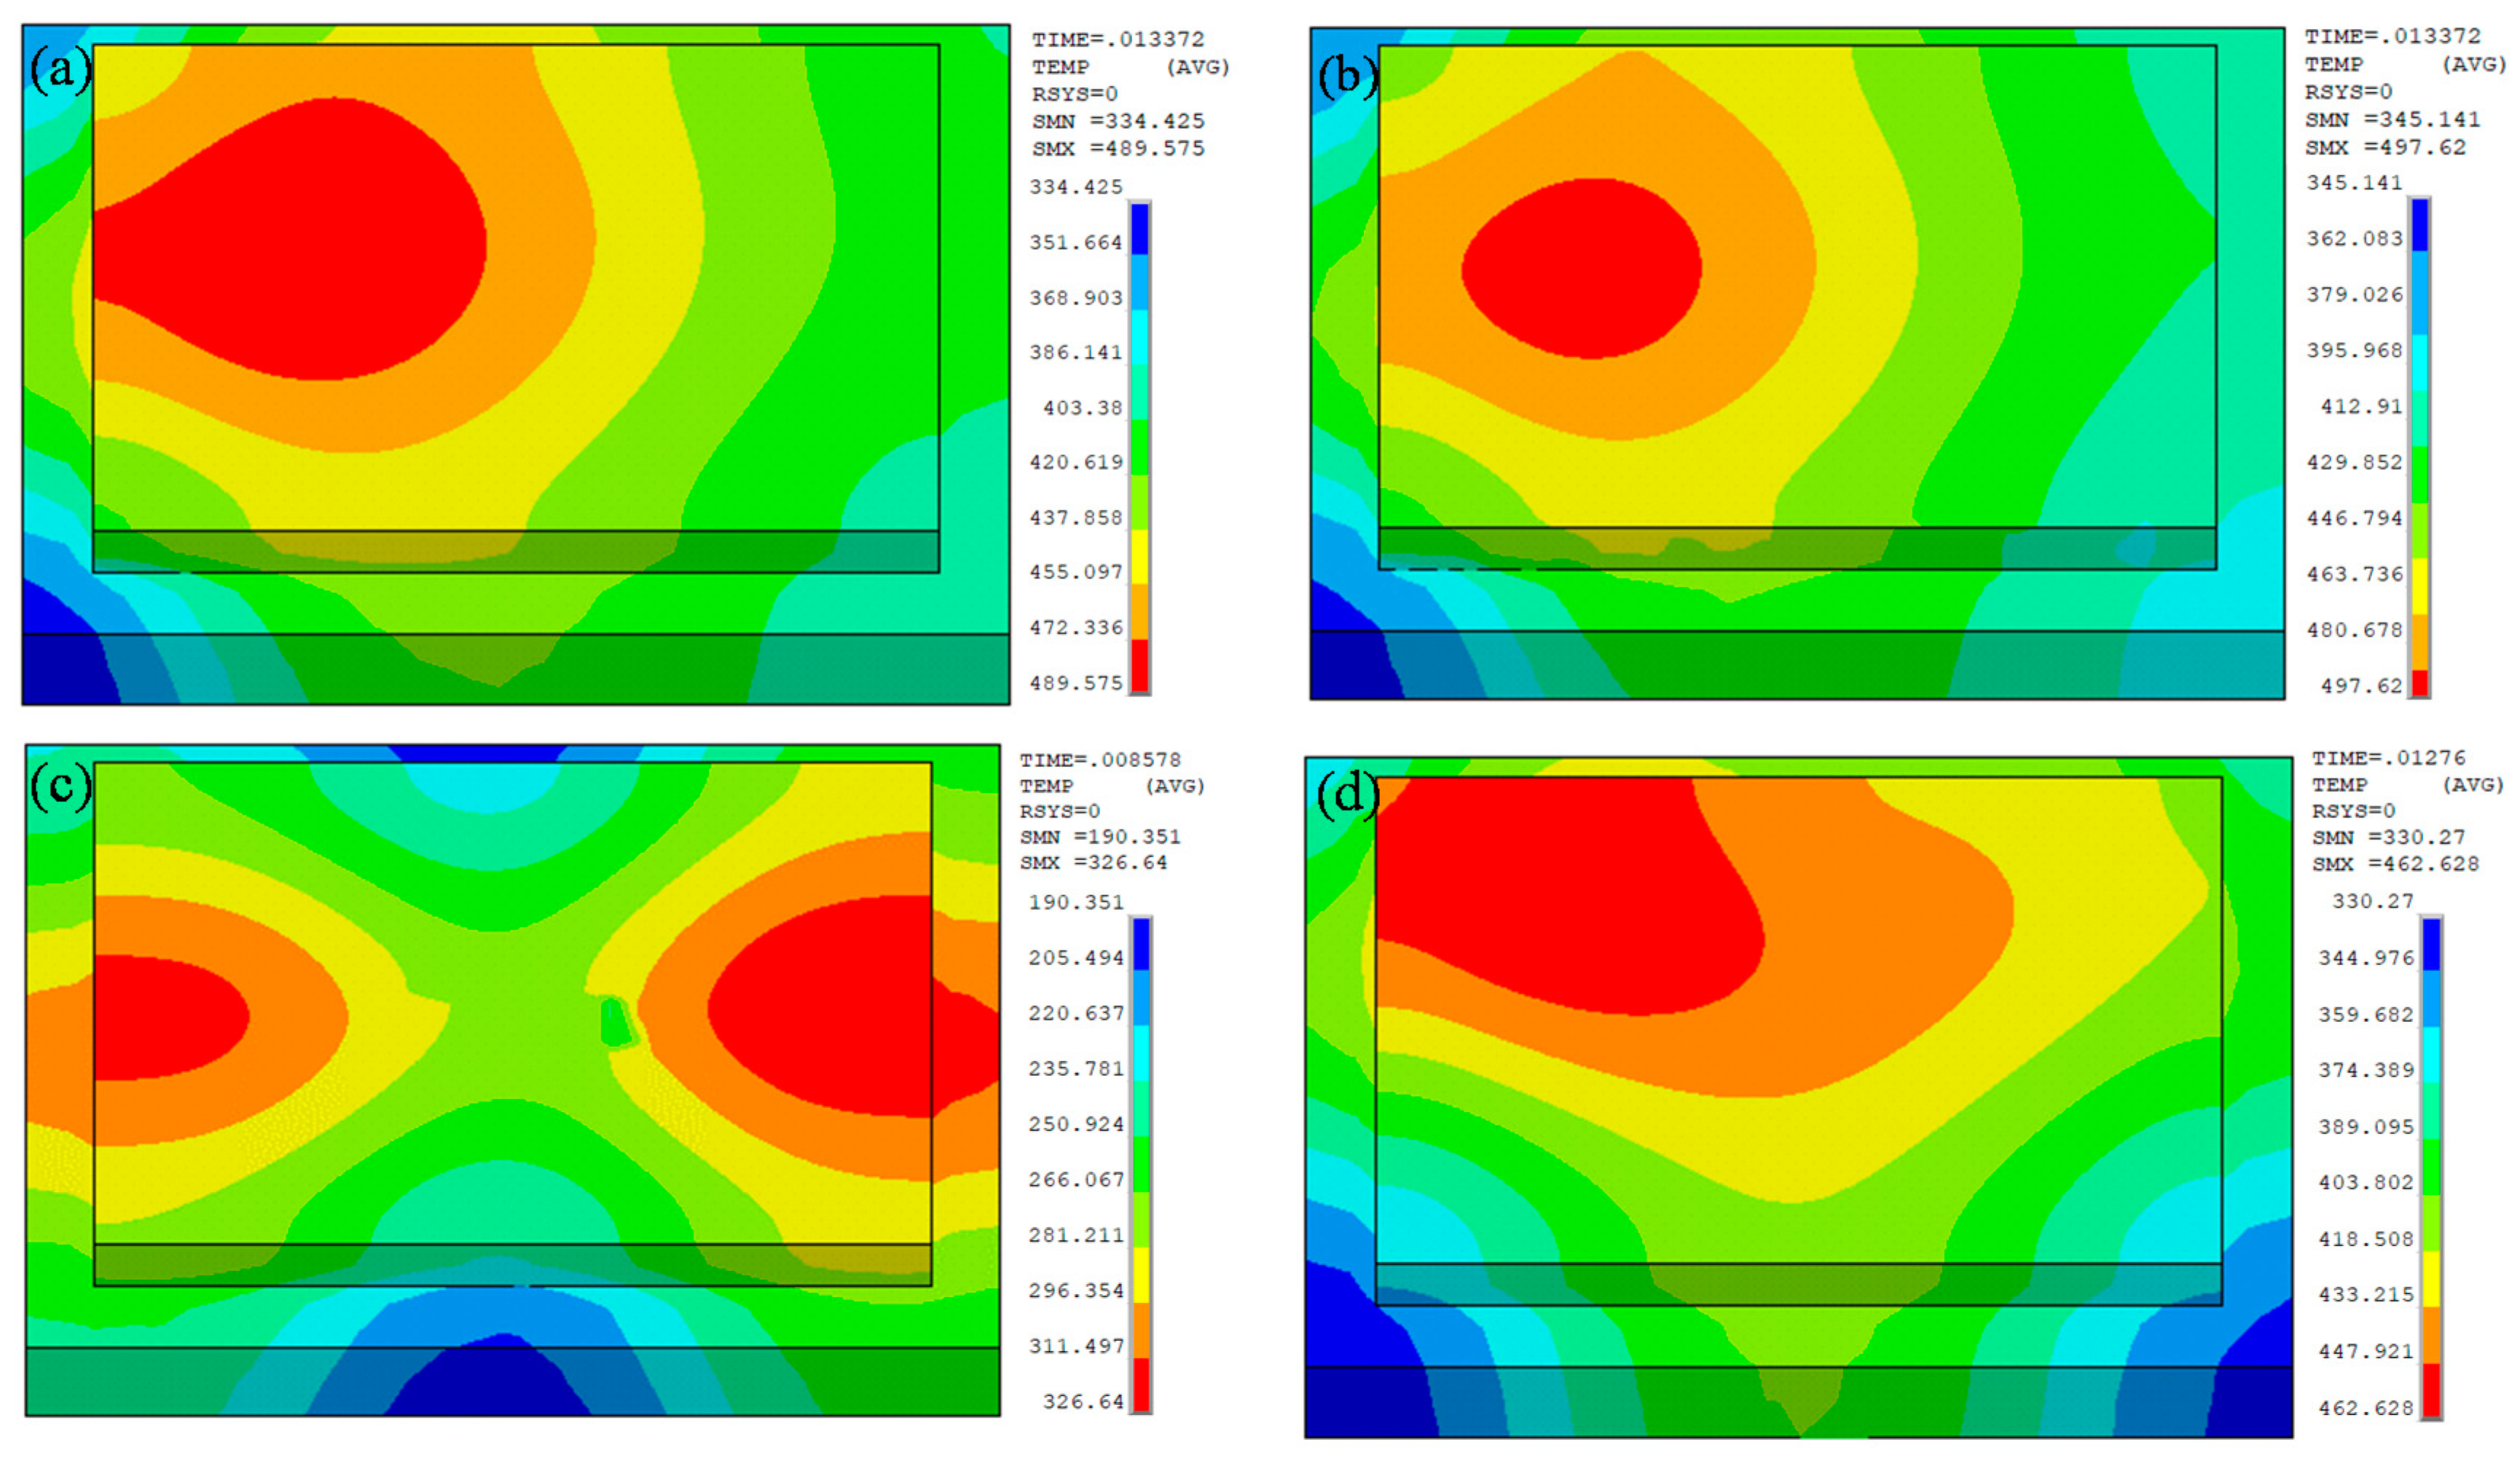
Figure 3 presents the simulated temperature distributions at the center of the fourth scanning track under different scanning strategies. It can be seen that the morphology of the melt pool is similar to the shape of “droplets”, and the temperature of the melt pool is decreased from the center of the laser heat source to the edge, which indicates that the temperature distributions are correspond to that of the Gaussian heat source. The isotherm in front of laser heat source is denser than the posterior part, causing the much higher temperature gradient ahead of the laser spot [22]. This can be attributed to the larger thermal conductivity of solidified material, which can be served as a heat sink. Under the function of high-energy laser beam, the powder behind the laser heat source has been rapidly melted, cooled and solidified to a solid state, while the forepart is still the unmelt powder, so that the heat input behind the laser spot can be rapidly conducted and transferred.
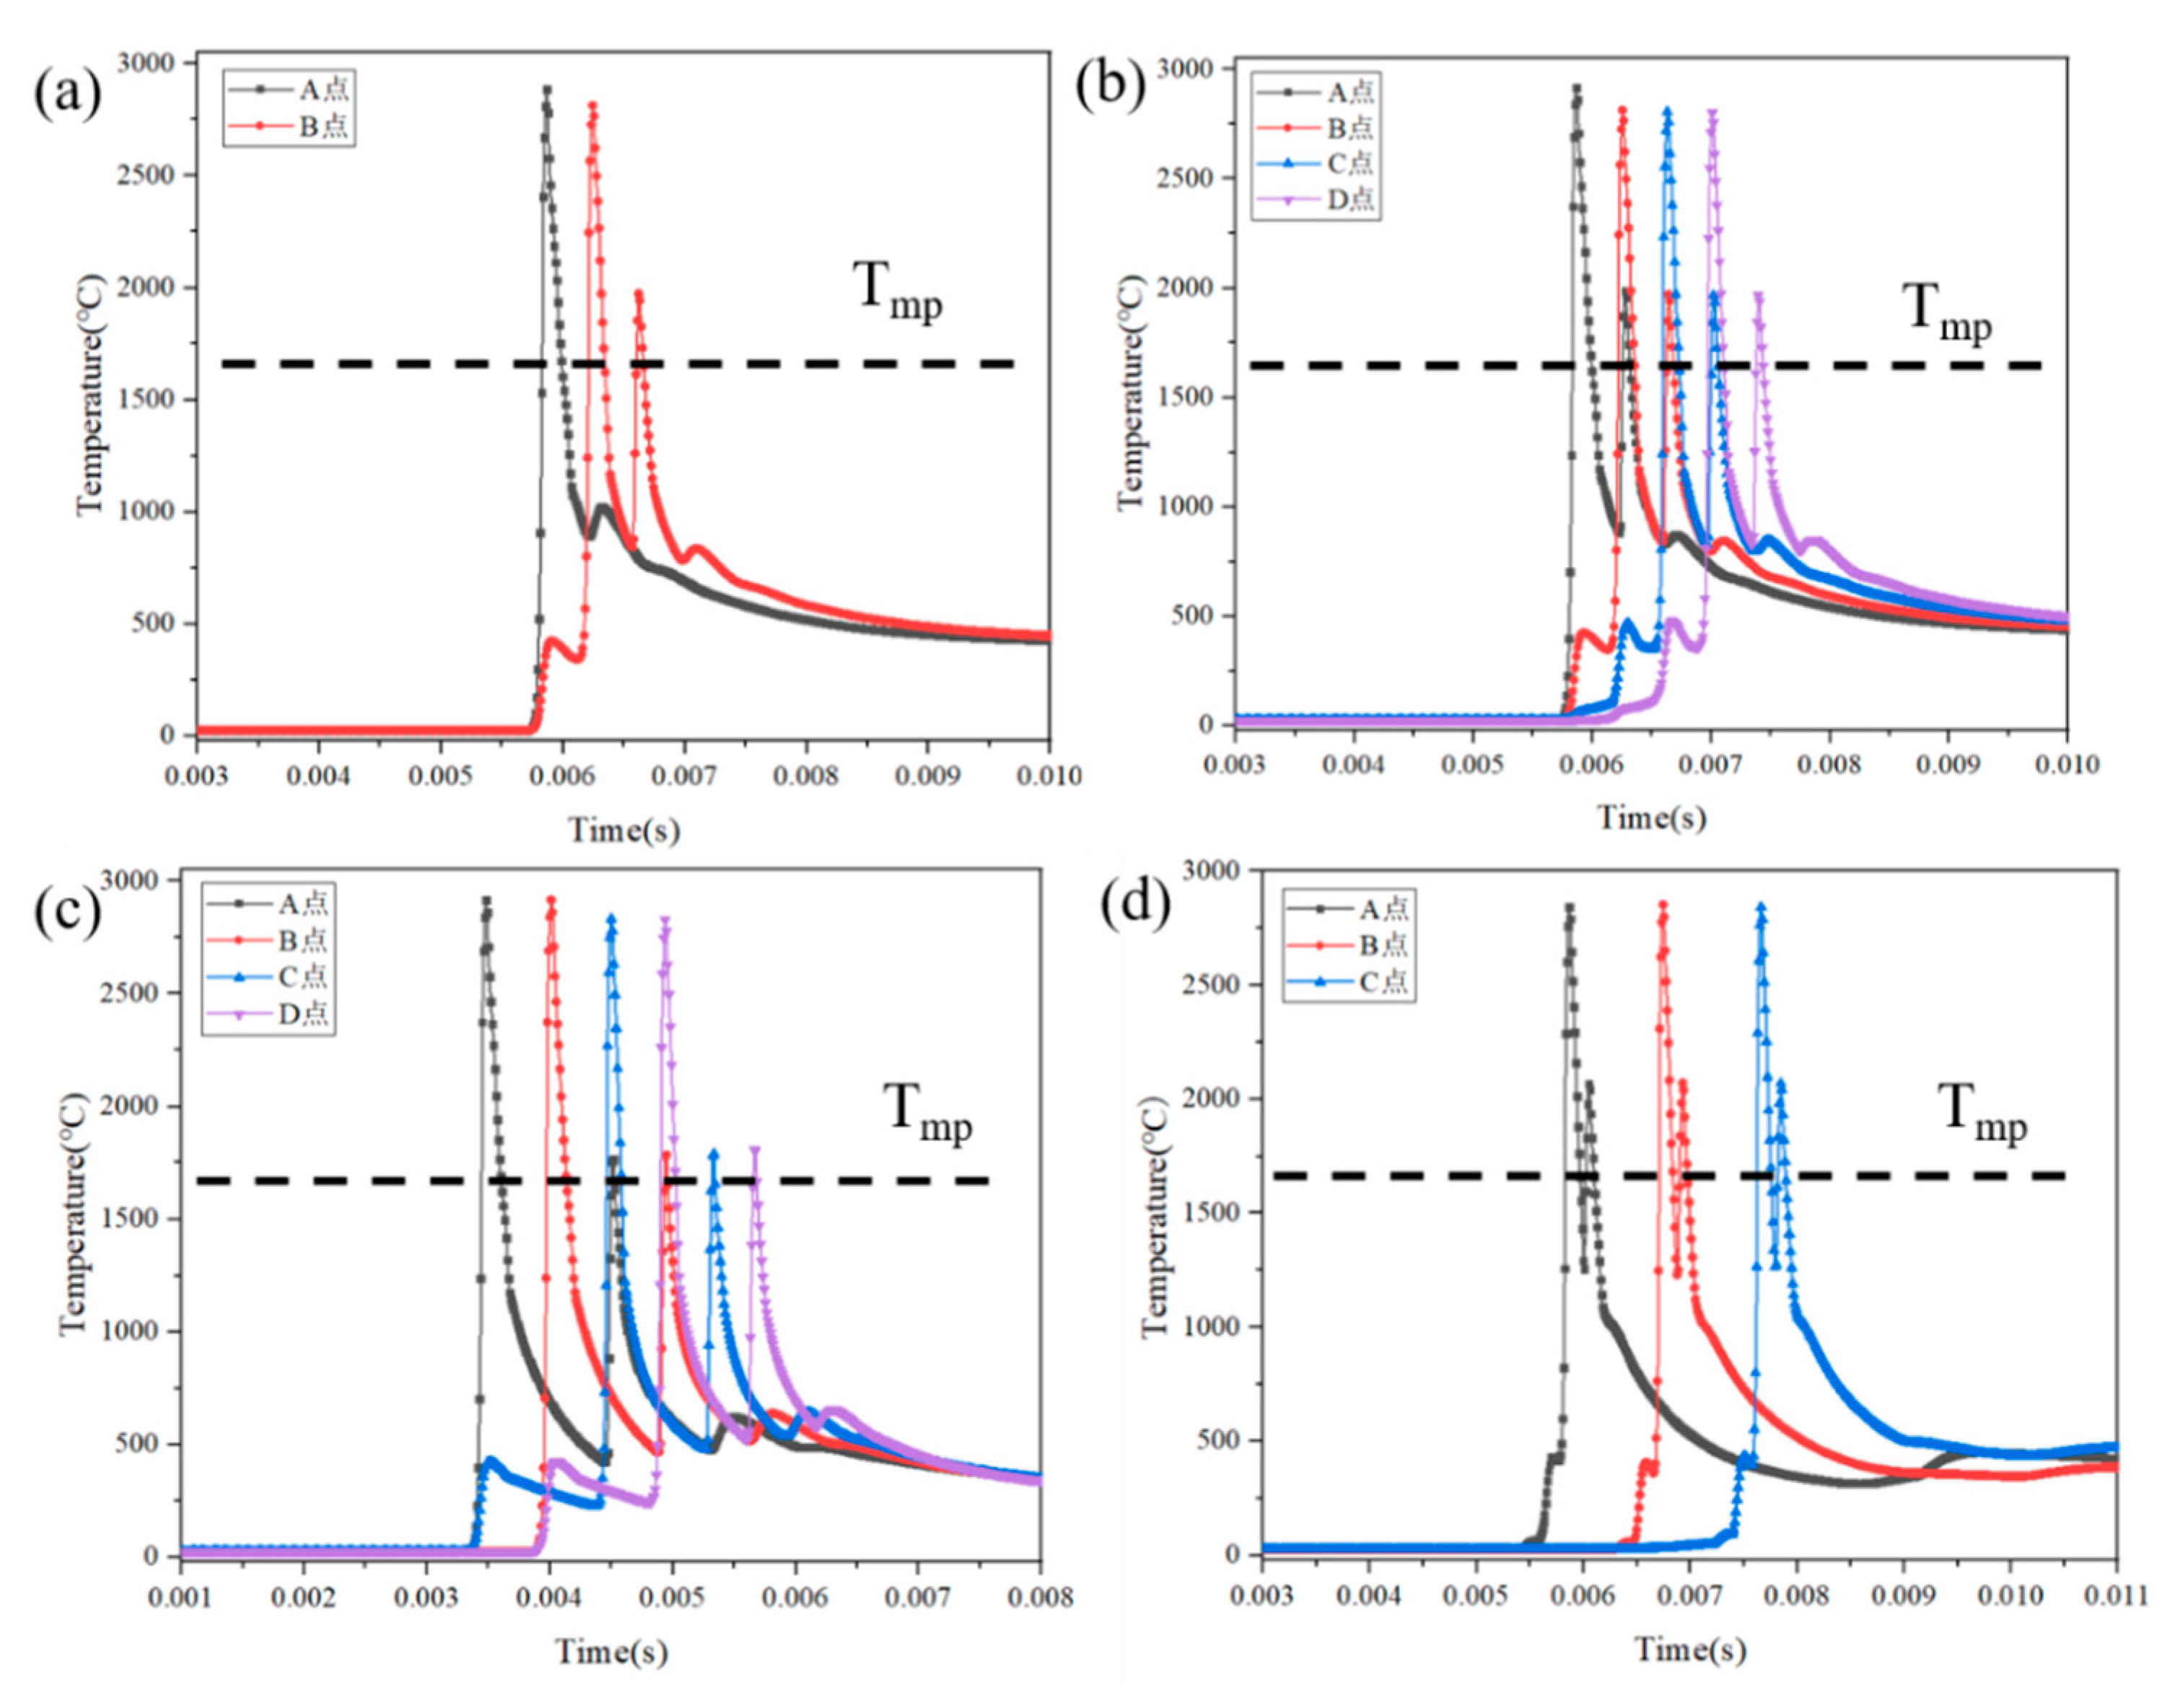
To evaluate the temperature evolution of GO/TC4 nanocomposites under different scanning strategies, the temperature profiles of different testing points illustrated in Figure 2 are recorded and drawn in Figure 4. It can be noted that the temperature is raised rapidly as the laser beam approaches to testing points, and it is up to the highest value at this point. With the scanning process continues, the accumulated heat is gradually decreased, resulting in a decrement in the transient temperature peak to a stable value [23]. Moreover, each temperature profile also has a secondary peak that is close to the melting point of the material. This indicates that, when the laser heat source moves to the same position of the adjacent melting channel at the corresponding point, the heat generated by melting powder is transferred to the surroundings. Consequently, the temperature of the melt pool is higher than the melting point of the material, causing the melting channel to be re-melt. Similar temperature history trends for these points can be found in case of different scanning strategies, except there is a difference about the converge temperature. As shown in Figure 4a,b, the maximum temperature of point B (2814.03 °C) tends to be lower than that of point A (2886.37 °C), which demonstrates that the initial scanning has a preheating effect on the powder. It can also be observed from Figure 4c that the temperature of point C (2832.32 °C) and point D (2828.20 °C) is lower than that of point A (2916.56 °C) and point B (2916.50 °C), respectively, which indicates that the heat generated during the SLM process will be transferred from the outside to the inner unmelt powder under the hollow square scanning strategy. As a result, the accumulative heat generated by the initial scanning is reduced. Figure 4d shows that scanning strategy of chess board partition can also reduce thermal effects.
In order to further analyze the simulated temperature distributions in the entire domain under four different scanning strategies, the temperature distributions at the end of the building process after cooling for 0.00204 s are given in Figure 5. The cooling rate is calculated by the ratio of temperature gradient to cooling time, as listed in Table 2. As the Gaussian heat source moves, heat accumulation will occur between adjacent melting channels. As shown in Figure 5a,b, the laser scanning path and the laser action time are longer in case of L-scanning strategy and S-scanning strategy, which will accumulate substantial of heat. Nevertheless, the heat accumulation will no longer have any effect on the specimens once the scanning path reaches a certain value. Hence, it is observed that the temperature under the H-scanning strategy is gradually decreased from the outside to the sample inside, which confirms that the H-scanning strategy has an effect of heat dissipation. Furthermore, when we compare the temperature distributions under four scanning strategies, the temperature gradient of the C-scanning strategy is the lowest. Since the scan length of each track is so short that the accumulated heat is small, which is more beneficial for generated heat to transfer to the surroundings.
3.2. Surface Topography and Surface Roughness
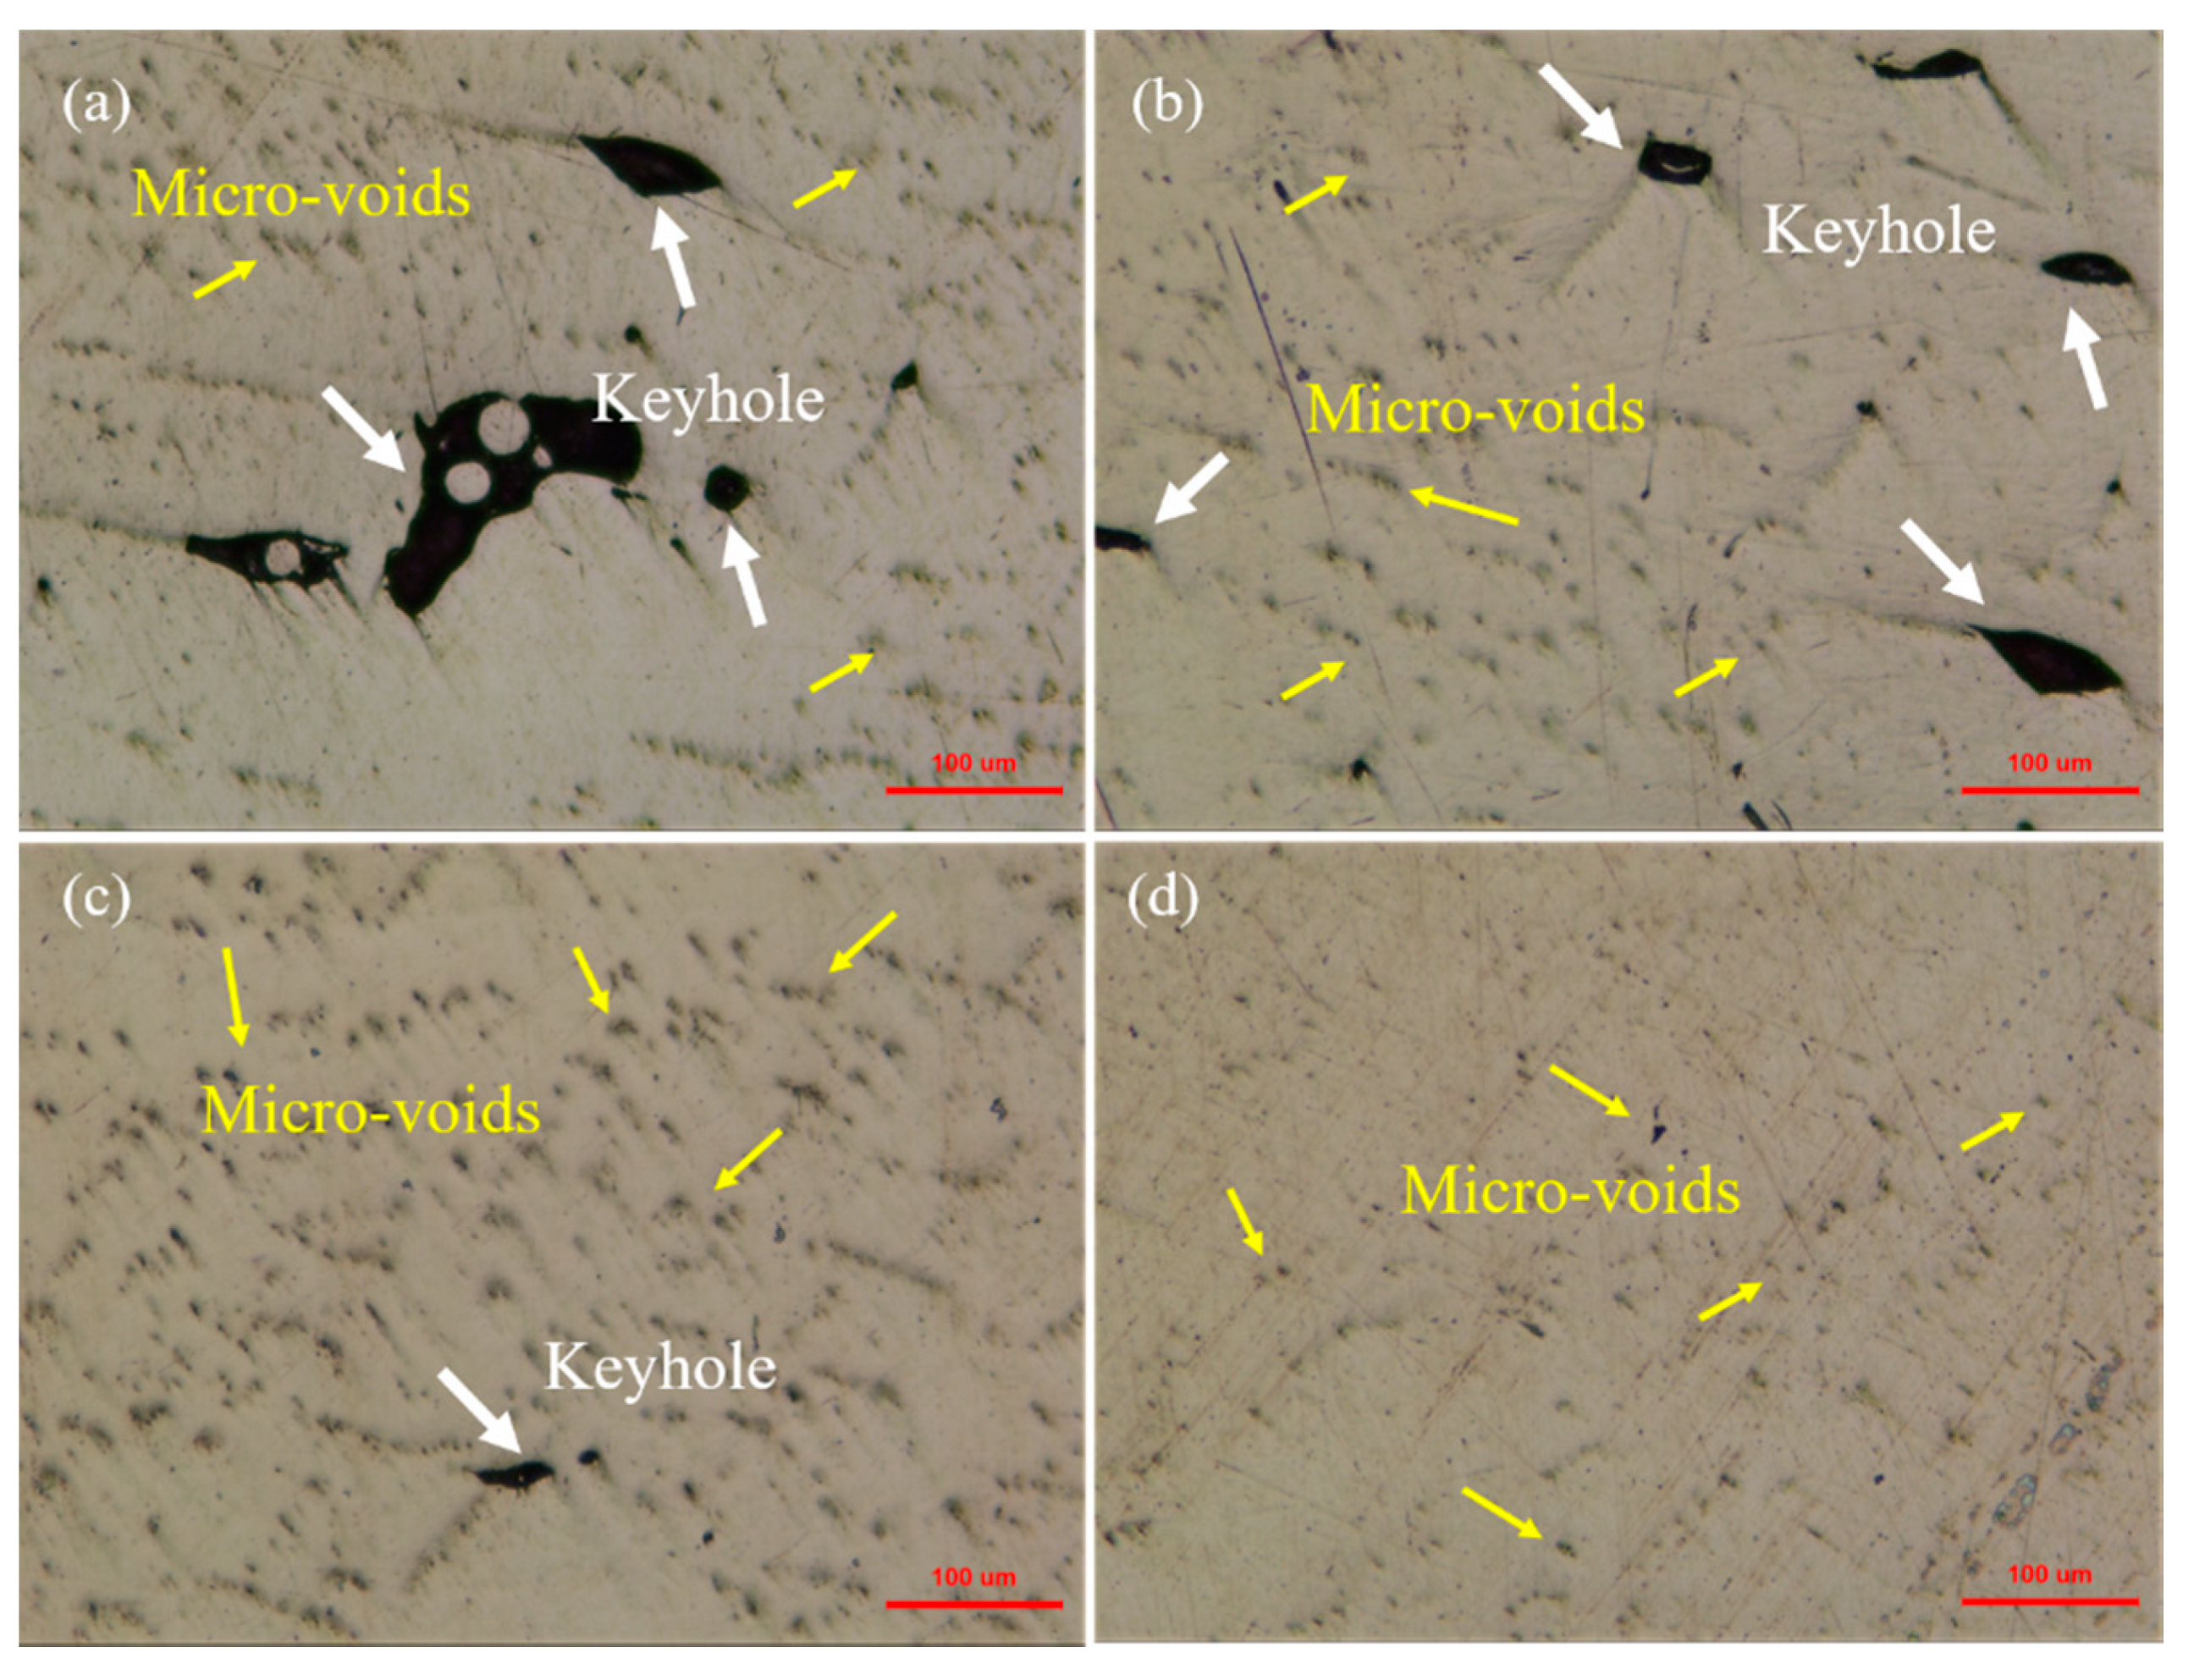
Figure 6 illustrates the surface topography of the as-built GO/TC4 specimens under different scanning strategies. Generally, process-induced porosity is one of the most common problems encountered in the production of almost all metallic materials fabricated by the SLM process, which is verified by other researchers [24,25,26]. Figure 6 depicts the defects including micro-pores and keyholes observed on the surface of GO/TC4 nanocomposites [27,28]. Substantial of defects and micro-voids can be obviously seen on the surface of L-scanning strategy sample, which implies the relatively long heating time in the laser fabrication process. In contrast to other samples, the C-scanning strategy sample displays the smoothest surface, owing to its least heat effects, which is consistent with the results of thermal analysis. Accordingly, it is determined that the difference in scanning strategy causes a considerable change in the surface morphologies of titanium matrix composites.
The surface roughness of SLMed GO/TC4 nanocomposites was characterized by using a Profilometer, with the results listed in Table 3. It can be clearly seen that the value of surface roughness along a plane perpendicular to the building direction (horizontal direction, H-surface roughness) of L-scanning strategy, S-scanning strategy, H-scanning strategy and C-scanning strategy samples are 9.20, 5.84, 6.67 and 2.80 μm, respectively. In comparison to the roughness value in horizontal direction, it can be induced that the surface roughness value along a plane parallel to the building direction (vertical direction, V-surface roughness) is smaller, which indicates that the surface of SLM-processed specimens along the building direction is smoother that is in agreement with the other literatures [29,30].
3.3. Surface and Volume Porosity
Additive manufacturing process is different from traditional casting process, which will not be affected by the attached force to obtain the full dense sample [31,32,33]. The surface porosity and volume porosity of the as-built samples, using four different scanning strategies are listed in Table 4, where the surface porosity is quantified by the relative ratio of the defect area to the surface area [34,35,36]. It is worth noting that the C-scanning strategy sample exhibits the best surface morphology, owing to a decrement in thermal effects. However, the surface porosity and volume porosity of L-scanning strategy sample were measured as approximately 12.3% and 7.59%, respectively, which results from the heat concentration during the SLM process, making the temperature of the melt pool to a great value, further promoting the evaporation of the powder bed.
3.4. Microhardness
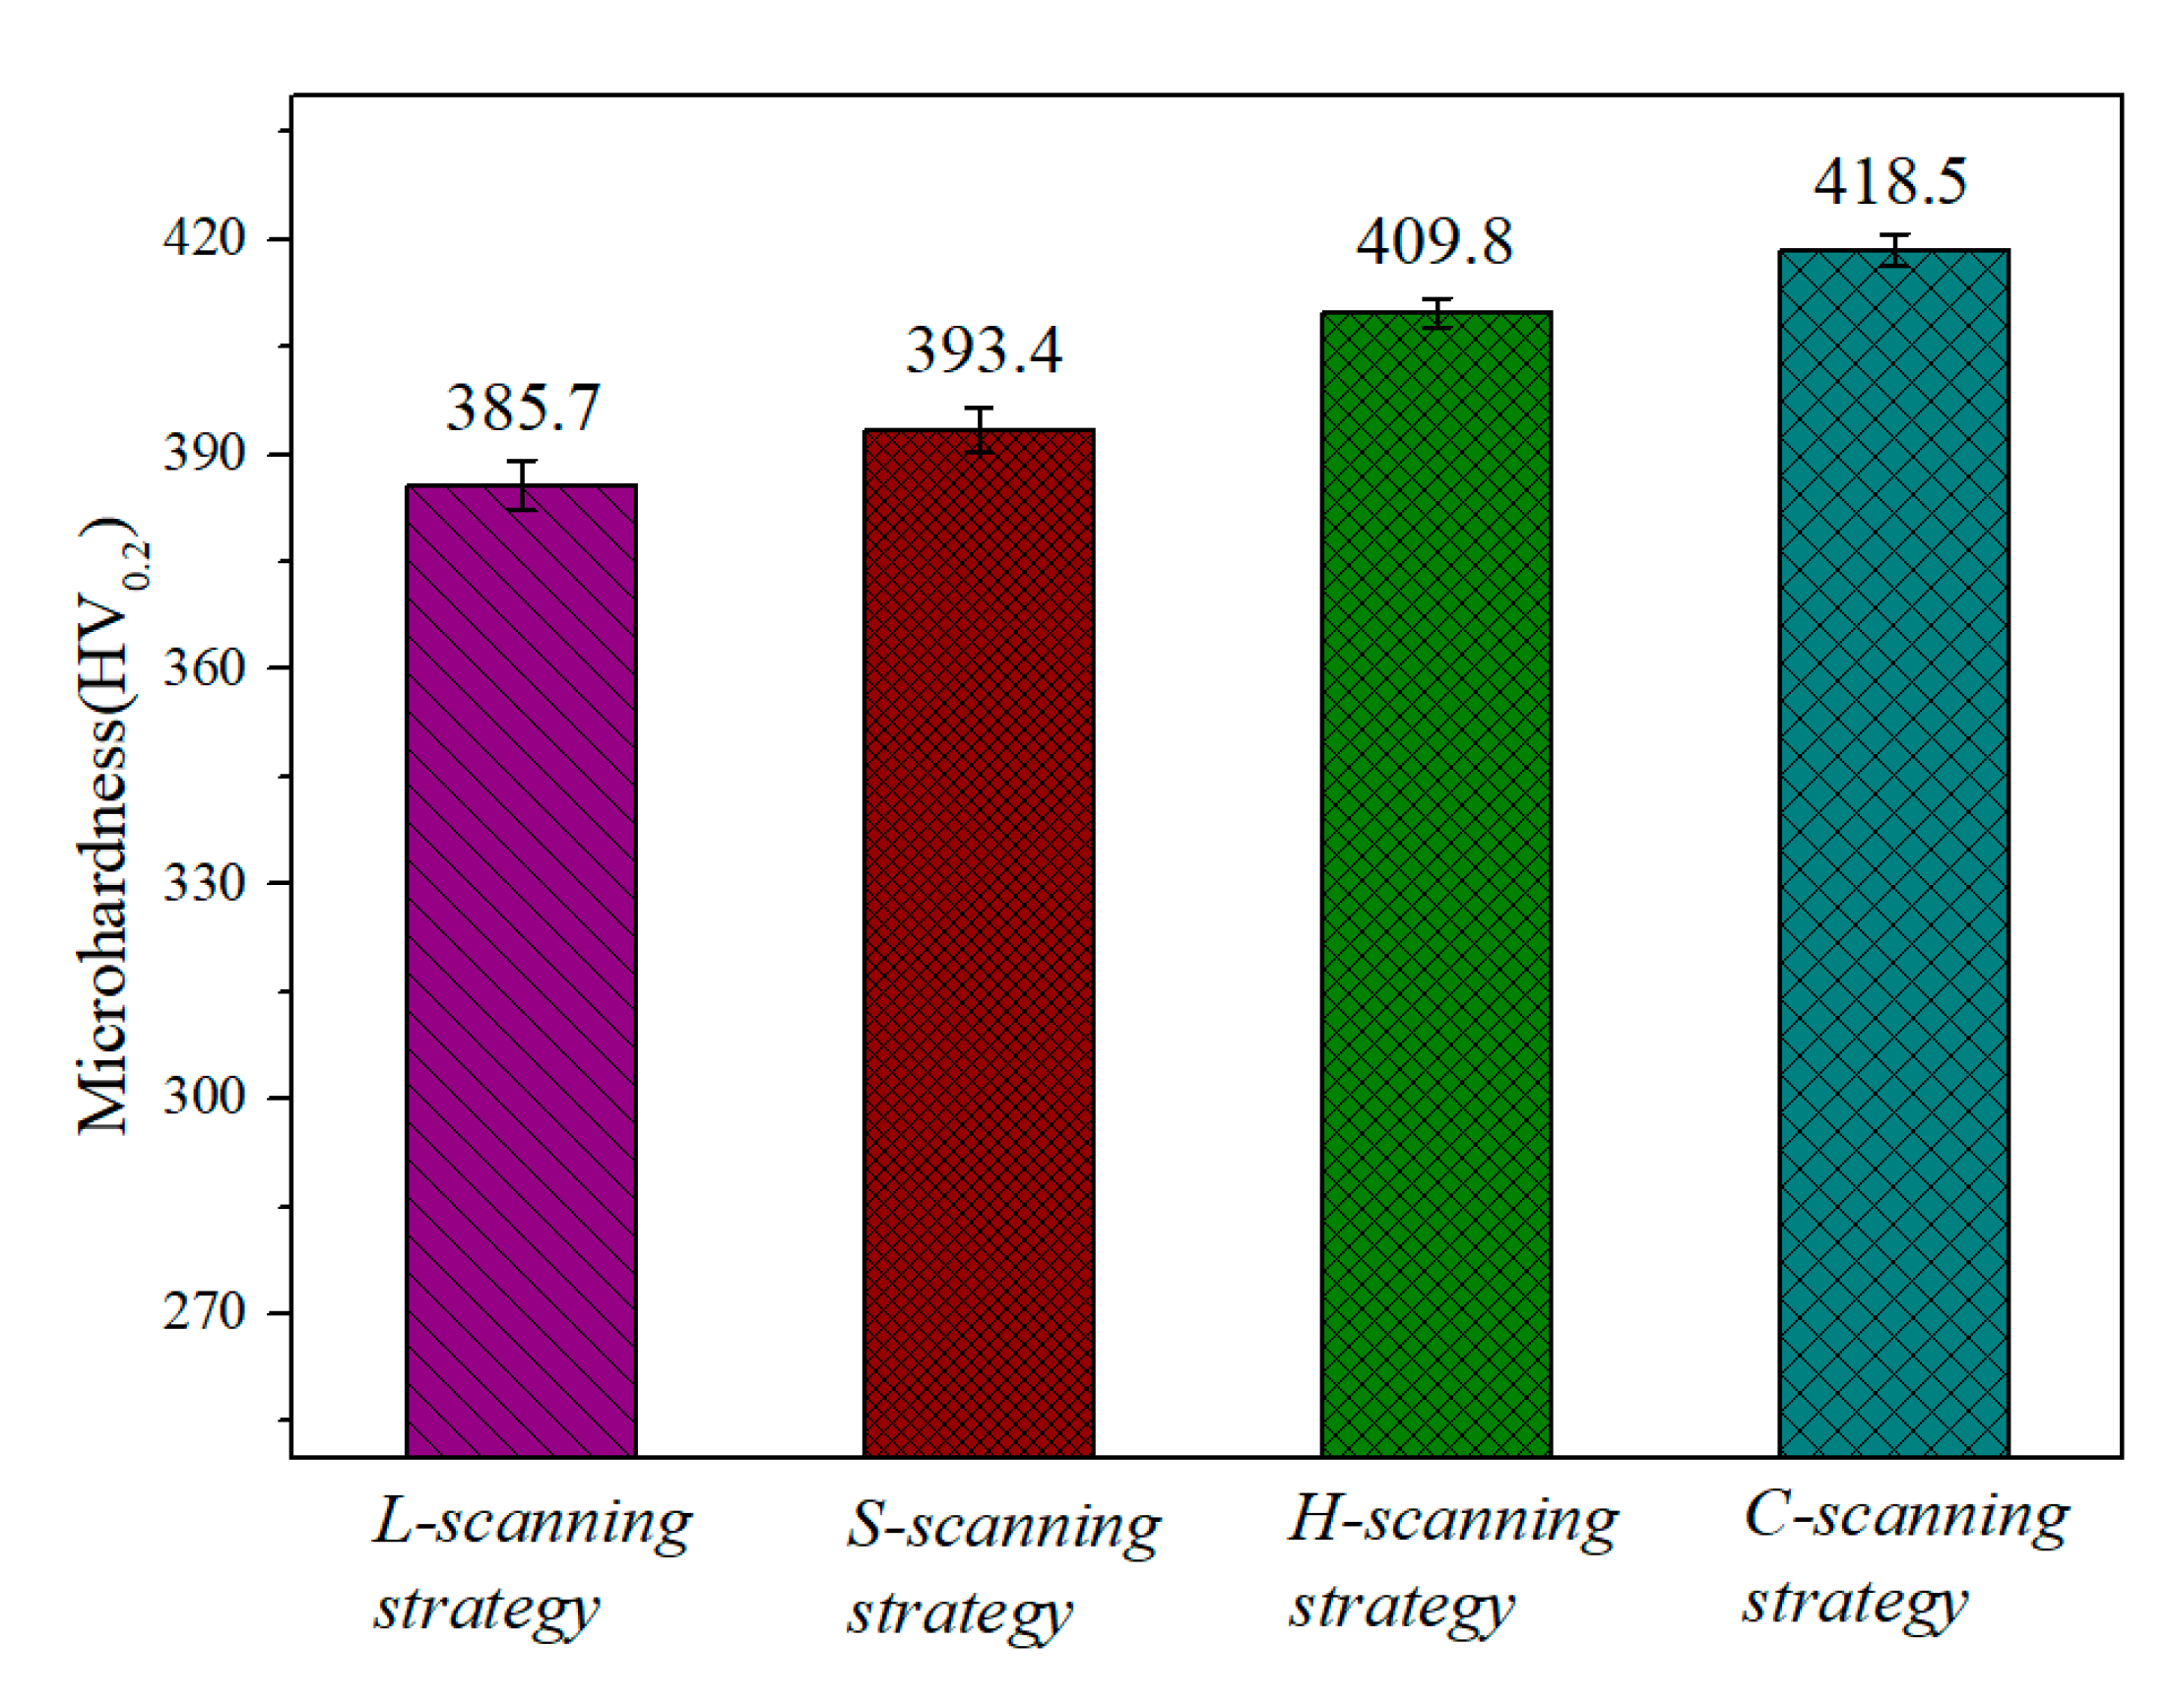
Figure 7 summarizes the microhardness of SLM-processed GO/TC4 nanocomposites under different scanning strategies. It is evident that the microhardness values of all the samples are in the rage of 380HV0.2 to 420HV0.2, where the L-scanning strategy sample is the lowest with the value for 385.7HV0.2, resulting from its higher porosity and more defects. The microhardness value of the S-scanning strategy sample is a bit higher than that of the L-scanning strategy sample. The GO/TC4 nanocomposites produced using C-scanning strategy are 8.50% harder than the ones produced using L-scanning strategy. This observation gives a direct evidence for the effects of different scanning strategies on the mechanical properties of metal matrix nanocomposites [37,38].
3.5. Tribological Behavior
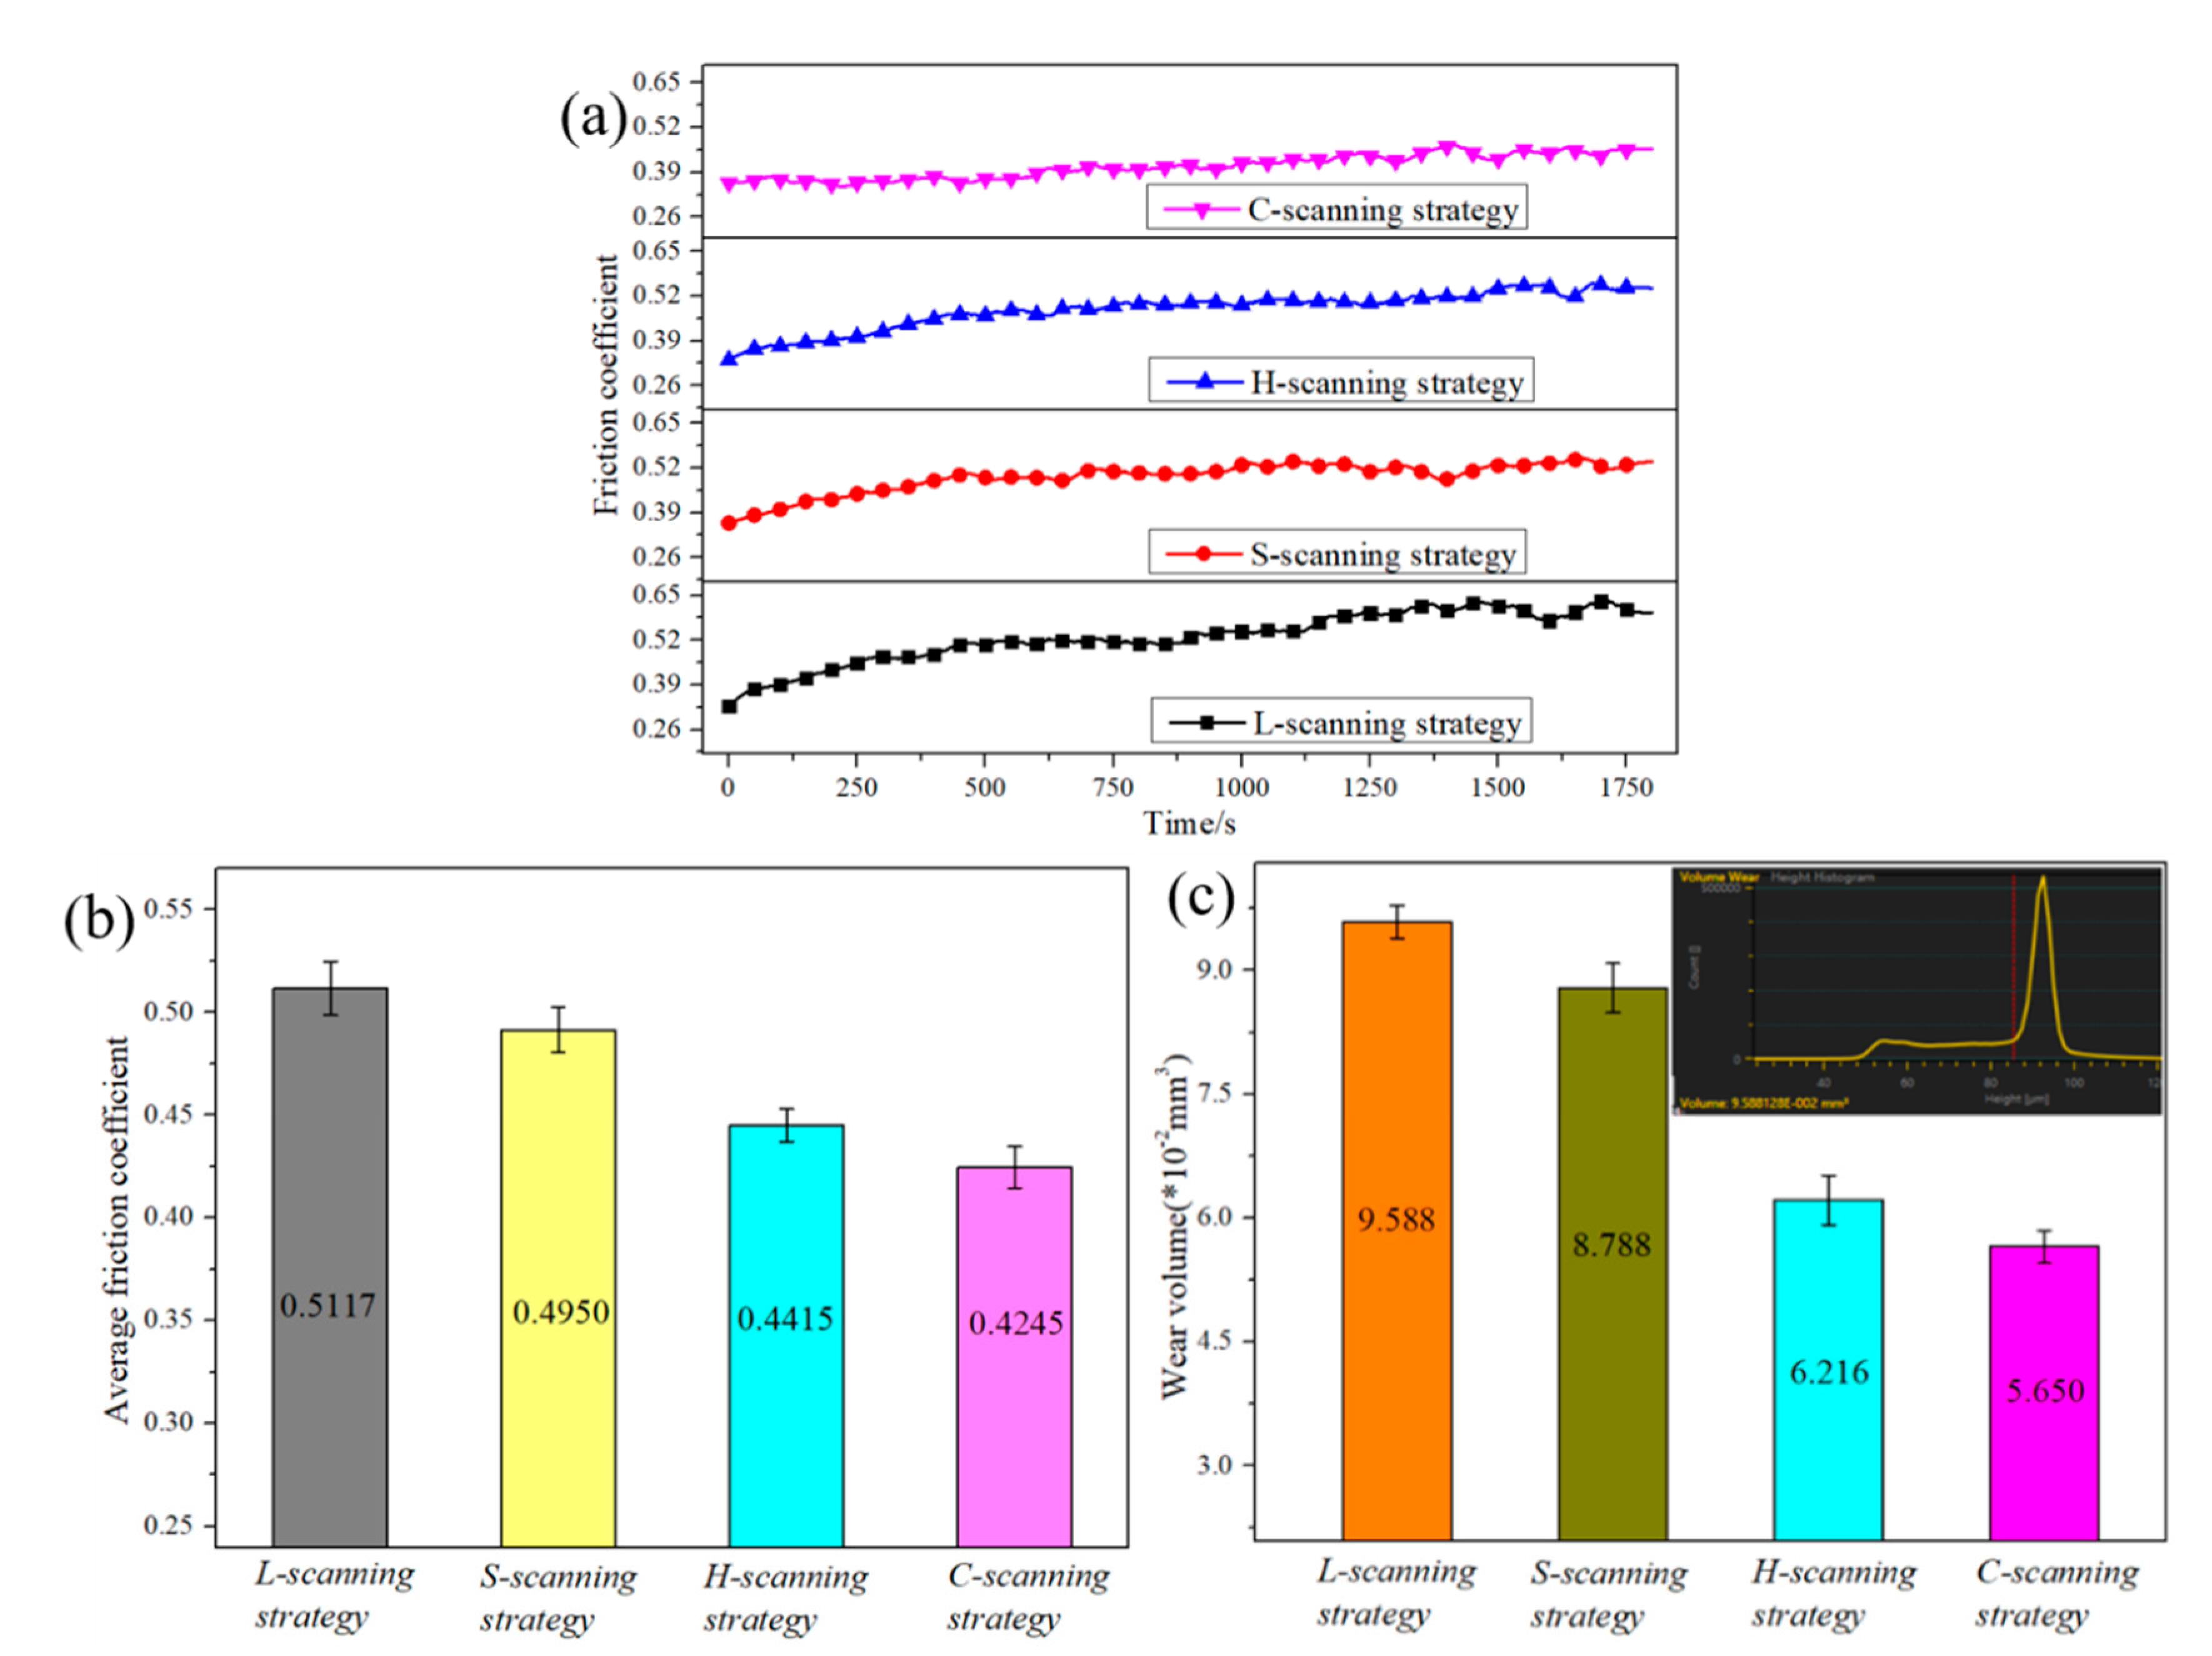
The variations of friction coefficient and wear volume of the GO/TC4 specimens under different scanning strategies against the Si3N4 balls are given in Figure 8, where the average friction coefficient calculated from friction data obtained after it reaches a stable condition are summarized in Figure 8b. As shown in Figure 8a, it is obvious that the L-scanning strategy sample shows a large fluctuation in the friction coefficient, indicating the frictional instability properties, which results from its rough surface and the generation of abrasive particles during the friction process. In comparison, the tribological performances of C-scanning strategy sample are always superior to those of other samples, especially the stability of the real-time friction coefficient and wear volume. It can be seen from Figure 8b that the average friction coefficient of L-scanning strategy sample is 0.5117, which is 20.54% higher than that of the C-scanning strategy sample. Furthermore, the L-scanning strategy sample has the largest wear volume, with the value of 9588 × 10−2 mm3, as displayed in Figure 8c.
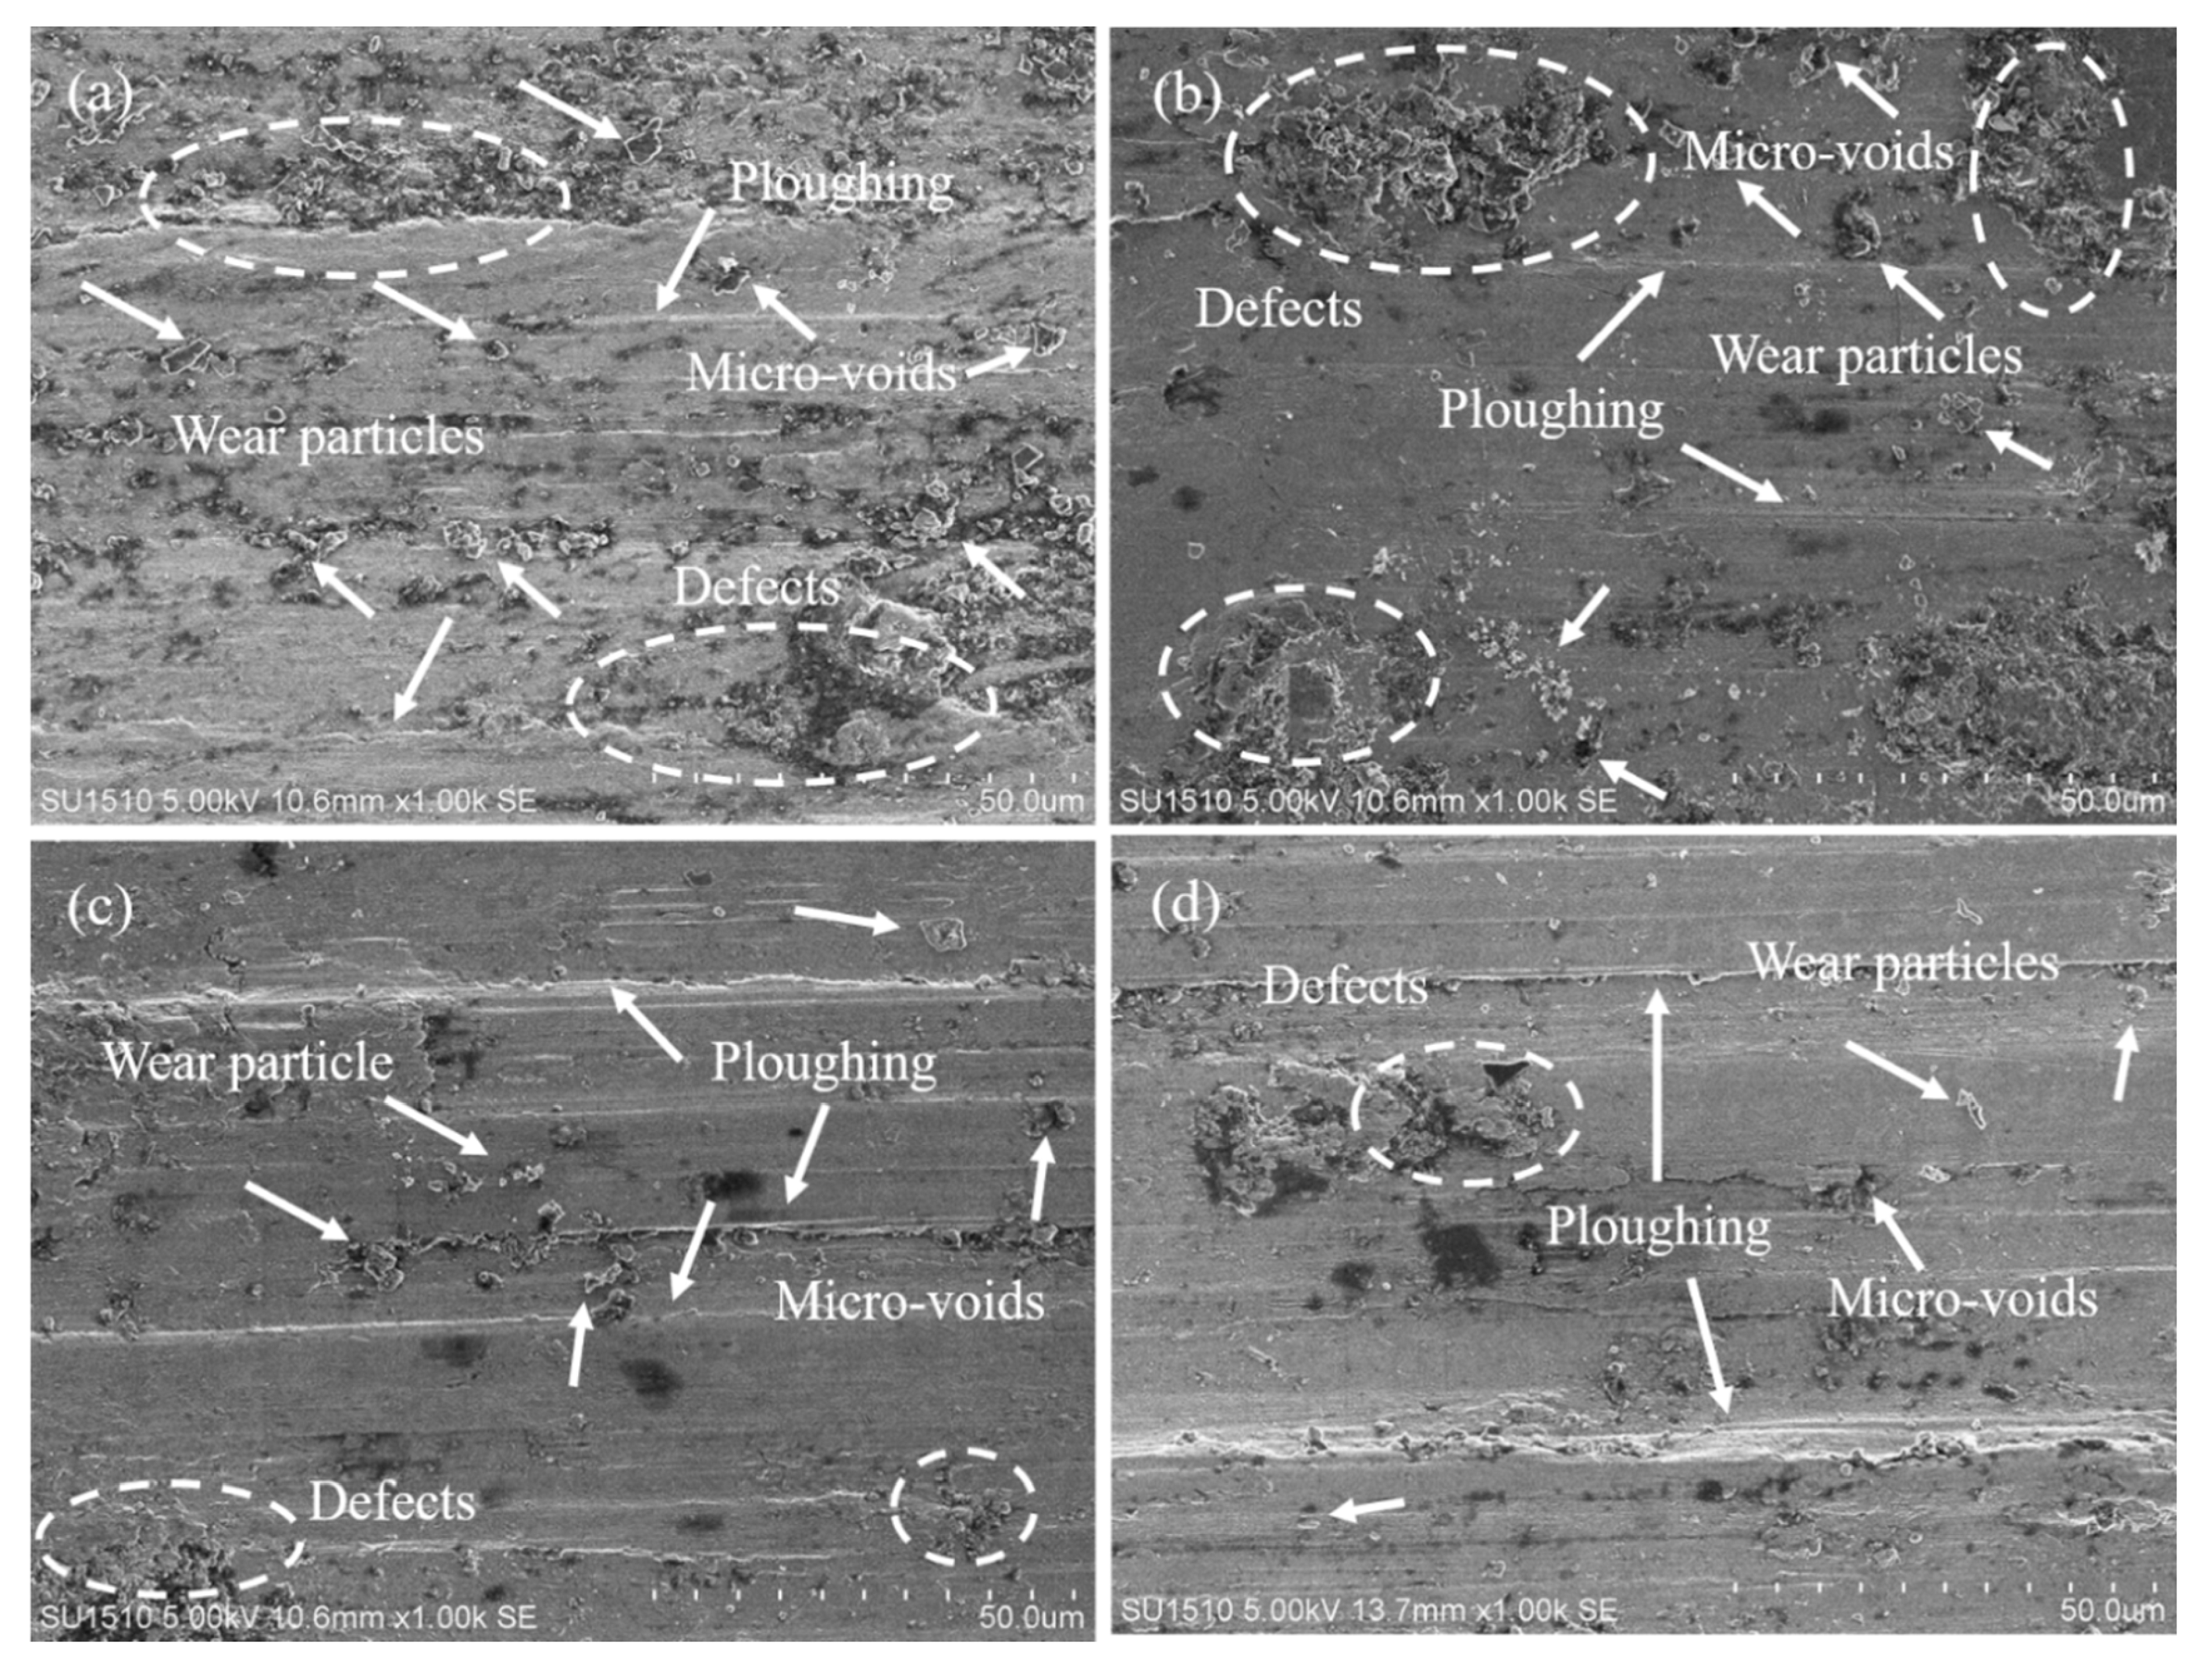
Figure 9 shows the SEM images of the worn surfaces of all samples. Surface ploughing is observed in all specimens. As shown in Figure 9a,b, the surface appearances of L-scanning strategy and S-scanning strategy sample are rougher, with a large number of defects and micro-voids, playing a role in accelerating wear and tear. Meanwhile, the generation of wear particles during the test reduce the wear resistance of the GO/TC4 nanocomposites due to the poor wear resistance of the TC4 matrix. It can be observed from Figure 9c that the H-scanning strategy sample exhibits better wear resistance than the L-scanning strategy and S-scanning strategy sample. Furthermore, the result of Figure 9d indicated that chess board scanning strategy can significantly improve the wear resistance of GO/TC4 nanocomposites, owing to its superior surface performances. In a word, GO/TC4 nanocomposites present a surface damage with typical abrasive and ploughing wear feature.
In summary, this study was exclusively focused on the performances of SLM-processed GO/TC4 nanocomposites, under different scanning strategies, by temperature field simulation, surface roughness, surface appearance, friction tests and so on. In light of that exposed above, regarding the primary performance, the SLMed GO/TC4 nanocomposites manufactured by scanning strategy of chess board partition can be the best solution due to their superior performances.
4. Conclusions
Due to the excellent mechanical and anti-friction properties of graphene oxide (GO), it is considered to be an ideal candidate reinforcement introduced into metal matrices. Herein, the titanium alloy (TC4) mixed with 0.5 wt.% GO fabricated by selective laser melting (SLM) process, using four different scanning strategies, was investigated and compared, in regard to the micro-voids, surface roughness, surface and volume porosity, microhardness and tribological properties, to the GO/TC4 nanocomposites. The results obtained can be summarized as follows:
(1) The simulation results of the numerical temperature field of the SLM-produced GO/TC4 nanocomposites show that the chess board scanning strategy has the smallest temperature gradients and thermal concentration of all investigated specimens.
(2) The surface roughness and porosity of the SLMed parts is sensitive to scanning strategy. Line or stripe scanning strategies lead to the formation of numerous micro-voids, defects and higher surface roughness.
(3) The thermal concentration is less pronounced in the chess board scanned specimen, resulting in a significant reduction in the size and number of defects and micro-pores of GO/TC4 nanocomposites.
(4) GO/TC4 nanocomposites manufactured by scanning strategy of chess board partition exhibits superior performances with a smoothest surface, the highest microhardness and the best wear resistance with average friction coefficient of 0.5245 and wear volume of 5.650 × 10⁻² mm3.
Author Contributions
Conceptualization, X.M. and P.L.; methodology, X.M. and M.W.; software, X.L. and J.H.; validation, X.M. and W.D.; formal analysis, X.M. and P.L.; investigation, X.L., W.D. and J.H.; resources, W.D. and M.W.; data curation, X.M. and X.L.; writing—original draft preparation, X.M. and X.L.; writing—review and editing, P.L. and M.W.; visualization, X.M., W.D. and J.H.; supervision, P.L. and M.W.; funding acquisition, M.W. All authors have read and agreed to the published version of the manuscript.
Funding
This research was funded by the Ministry of Education’s Joint Fund for Pre-Research Project, grant number 6141A0221.
Conflicts of Interest
The authors declare no conflict of interest.
References
- Wu, G.; Wang, Y.; Sun, M.; Zhang, Q.; Yao, J. Influence of microstructure of TC4 substrate on the MAO coating. Surf. Eng. 2019, 36, 1–10. [Google Scholar] [CrossRef]
- Wang, X. Properties of Jet electrodeposition Nickel Coating on TC4 Alloy Prepared by Selective Laser Melting. Int. J. Electrochem. Sci. 2019, 14, 7717–7728. [Google Scholar] [CrossRef]
- Bartolomeu, F.; Costa, M.; Gomes, J.; Alves, N.; Abreu, C.S.; Silva, F.S.; Miranda, G. Implant surface design for improved implant stability—A study on Ti6Al4V dense and cellular structures produced by Selective Laser Melting. Tribol. Int. 2019, 129, 272–282. [Google Scholar] [CrossRef]
- Rane, K.; Strano, M. A comprehensive review of extrusion-based additive manufacturing processes for rapid production of metallic and ceramic parts. Adv. Manuf. 2019, 7, 155–173. [Google Scholar] [CrossRef]
- Miranda, G.; Faria, S.; Bartolomeu, F.; Pinto, E.; Alves, N.; Peixinho, N.; Gasik, M.; Silva, F.S. A study on the production of thin-walled Ti6Al4V parts by selective laser melting. J. Manuf. Process. 2019, 39, 346–355. [Google Scholar] [CrossRef]
- He, Y.; Montgomery, C.; Beuth, J.; Webler, B. Melt pool geometry and microstructure of Ti6Al4V with B additions processed by selective laser melting additive manufacturing. Mater. Des. 2019, 183, 108126. [Google Scholar] [CrossRef]
- Xiao, W.-H.; Lu, S.-Q.; Wang, Y.-C.; Shi, J. Mechanical and tribological behaviors of graphene/Inconel 718 composites. Trans. Nonferrous Met. Soc. China 2018, 28, 1958–1969. [Google Scholar] [CrossRef]
- Zhao, Z.; Zhao, W.; Bai, P.; Wu, L.; Huo, P. The interfacial structure of Al/Al4C3 in graphene/Al composites prepared by selective laser melting: First-principles and experimental. Mater. Lett. 2019, 255, 126559. [Google Scholar] [CrossRef]
- Wen, S.; Chen, K.; Li, W.; Zhou, Y.; Wei, Q.; Shi, Y. Selective laser melting of reduced graphene oxide/S136 metal matrix composites with tailored microstructures and mechanical properties. Mater. Des. 2019, 175, 107811. [Google Scholar] [CrossRef]
- Zhao, Y.; Tang, Y.; Zhao, M.-C.; Liu, L.; Gao, C.; Shuai, C.; Zeng, R.-C.; Atrens, A.; Lin, Y. Graphene Oxide Reinforced Iron Matrix Composite With Enhanced Biodegradation Rate Prepared by Selective Laser Melting. Adv. Eng. Mater. 2019, 21. [Google Scholar] [CrossRef]
- Liu, S.; Yang, W.; Shi, X.; Li, B.; Duan, S.; Guo, H.; Guo, J. Influence of laser process parameters on the densification, microstructure, and mechanical properties of a selective laser melted AZ61 magnesium alloy. J. Alloy. Compd. 2019, 808, 151160. [Google Scholar] [CrossRef]
- Li, X.; Ni, J.; Zhu, Q.; Su, H.; Cui, J.; Zhang, Y.; Li, J. Structure and Mechanical Properties of the AlSi10Mg Alloy Samples Manufactured by Selective Laser Melting. IOP Conf. Ser. Mater. Sci. Eng. 2017, 269, 012081. [Google Scholar] [CrossRef]
- Thijs, L.; Verhaeghe, F.; Craeghs, T.; Van Humbeeck, J.; Kruth, J.-P. A study of the microstructural evolution during selective laser melting of Ti-6Al-4V. Acta Mater. 2010, 58, 3303–3312. [Google Scholar] [CrossRef]
- Qiu, C.; Wang, Z.; Aladawi, A.S.; Al Kindi, M.; Al Hatmi, I.; Chen, H.; Chen, L. Influence of Laser Processing Strategy and Remelting on Surface Structure and Porosity Development during Selective Laser Melting of a Metallic Material. Met. Mater. Trans. A 2019, 50, 4423–4434. [Google Scholar] [CrossRef]
- Salman, O.; Brenne, F.; Niendorf, T.; Eckert, J.; Prashanth, K.G.; He, T.; Scudino, S. Impact of the scanning strategy on the mechanical behavior of 316L steel synthesized by selective laser melting. J. Manuf. Process. 2019, 45, 255–261. [Google Scholar] [CrossRef]
- Yan, X.; Pang, J.; Jing, Y. Ultrasonic Measurement of Stress in SLM 316L Stainless Steel Forming Parts Manufactured Using Different Scanning Strategies. Materials 2019, 12, 2719. [Google Scholar] [CrossRef] [Green Version]
- Maamoun, A.H.; Xue, Y.F.; Elbestawi, M.; Veldhuis, S.C. Effect of Selective Laser Melting Process Parameters on the Quality of Al Alloy Parts: Powder Characterization, Density, Surface Roughness, and Dimensional Accuracy. Materials 2018, 11, 2343. [Google Scholar] [CrossRef] [Green Version]
- Lu, P.; Wu, M.; Liu, X.; Miao, X. Effects of Laser Power on Micro-structure and Tribological Properties of SLMed GO/TC4 Nanocomposites. JOM 2020. [Google Scholar] [CrossRef]
- Li, H.; Ramezani, M.; Chen, Z.; Singamneni, S. Effects of Process Parameters on Temperature and Stress Distributions During Selective Laser Melting of Ti-6Al-4V. Trans. Indian Inst. Met. 2019, 72, 3201–3214. [Google Scholar] [CrossRef]
- Ma, C.; Zhao, J.; Cao, C.; Lin, T.-C.; Li, X. Fundamental Study on Laser Interactions With Nanoparticles-Reinforced Metals—Part I: Effect of Nanoparticles on Optical Reflectivity, Specific Heat, and Thermal Conductivity. J. Manuf. Sci. Eng. 2016, 138, 121001. [Google Scholar] [CrossRef]
- Jazi, M.R.G.; Golozar, M.A.; Raeissi, K.; Fazel, M. Evaluation of corrosion and tribocorrosion of plasma electrolytic oxidation treated Ti-6Al-4V alloy. Surf. Coat. Technol. 2014, 244, 29–36. [Google Scholar] [CrossRef]
- Lu, P.; Cheng-Lin, Z.; Liang, W.; Tong, L.; Jiang-Lin, L. Molten pool structure, temperature and velocity flow in selective laser melting AlCu5MnCdVA alloy. Mater. Res. Express 2020, 7, 086516. [Google Scholar] [CrossRef]
- Zhang, X.; Chen, L.; Zhou, J.; Ren, N. Simulation and experimental studies on process parameters, microstructure and mechanical properties of selective laser melting of stainless steel 316L. J. Braz. Soc. Mech. Sci. Eng. 2020, 42, 1–14. [Google Scholar] [CrossRef]
- Yadollahi, A.; Shamsaei, N. Additive manufacturing of fatigue resistant materials: Challenges and opportunities. Int. J. Fatigue 2017, 98, 14–31. [Google Scholar] [CrossRef] [Green Version]
- Yadollahi, A.; Shamsaei, N.; Thompson, S.M.; Elwany, A.; Bian, L. Effects of building orientation and heat treatment on fatigue behavior of selective laser melted 17-4 PH stainless steel. Int. J. Fatigue 2017, 94, 218–235. [Google Scholar] [CrossRef]
- Wan, H.; Zhou, Z.; Li, C.; Chen, G.; Zhang, G. Effect of scanning strategy on mechanical properties of selective laser melted Inconel 718. Mater. Sci. Eng. A 2019, 753, 42–48. [Google Scholar] [CrossRef]
- Aboulkhair, N.T.; Everitt, N.M.; Ashcroft, I.; Tuck, C. Reducing porosity in AlSi10Mg parts processed by selective laser melting. Addit. Manuf. 2014, 1, 77–86. [Google Scholar] [CrossRef]
- Maamoun, A.H.; Elbestawi, M.; Dosbaeva, G.K.; Veldhuis, S. Thermal post-processing of AlSi10Mg parts produced by Selective Laser Melting using recycled powder. Addit. Manuf. 2018, 21, 234–247. [Google Scholar] [CrossRef]
- Han, J.; Wu, M.; Ge, Y.; Wu, J. Correction to: Optimizing the structure accuracy by changing the scanning strategy using selective laser melting. Int. J. Adv. Manuf. Technol. 2019, 106, 1567. [Google Scholar] [CrossRef] [Green Version]
- Lin, K.; Gu, D.; Xi, L.; Yuan, L.; Niu, S.; Lv, P.; Ge, Q. Selective laser melting processing of 316L stainless steel: Effect of microstructural differences along building direction on corrosion behavior. Int. J. Adv. Manuf. Technol. 2019, 104, 2669–2679. [Google Scholar] [CrossRef]
- Amirjan, M.; Sakiani, H. Effect of scanning strategy and speed on the microstructure and mechanical properties of selective laser melted IN718 nickel-based superalloy. Int. J. Adv. Manuf. Technol. 2019, 103, 1769–1780. [Google Scholar] [CrossRef]
- Koutný, D.; Paloušek, D.; Pantelejev, L.; Holler, C.; Pichler, R.; Tesicky, L.; Kaiser, J. Influence of Scanning Strategies on Processing of Aluminum Alloy EN AW 2618 Using Selective Laser Melting. Materials 2018, 11, 298. [Google Scholar] [CrossRef] [PubMed] [Green Version]
- Mancisidor, A.; Garciandia, F.; Sebastian, M.S.; Álvarez, P.; Díaz, J.; Unanue, I. Reduction of the Residual Porosity in Parts Manufactured by Selective Laser Melting Using Skywriting and High Focus Offset Strategies. Phys. Procedia 2016, 83, 864–873. [Google Scholar] [CrossRef] [Green Version]
- Zhao, L.; Ouyang, Q.; Chen, D.; Udupa, J.K.; Wang, H.; Zeng, Y. Defect detection in slab surface: A novel dual charge-coupled device imaging-based fuzzy connectedness strategy. Rev. Sci. Instrum. 2014, 85, 115004. [Google Scholar] [CrossRef]
- Cheng, B.; Shrestha, S.; Chou, K. Stress and deformation evaluations of scanning strategy effect in selective laser melting. Addit. Manuf. 2016, 12, 240–251. [Google Scholar] [CrossRef]
- Rtimi, S.; Giannakis, S.; Bensimon, M.; Pulgarin, C.; Sanjines, R.; Kiwi, J. Supported TiO2 films deposited at different energies: Implications of the surface compactness on the catalytic kinetics. Appl. Catal. B Environ. 2016, 191, 42–52. [Google Scholar] [CrossRef] [Green Version]
- Beal, V.E.; Erasenthiran, P.; Hopkinson, N.; Dickens, P.; Ahrens, C.H. The effect of scanning strategy on laser fusion of functionally graded H13/Cu materials. Int. J. Adv. Manuf. Technol. 2006, 30, 844–852. [Google Scholar] [CrossRef]
- Demir, A.G.; Previtali, B. Additive manufacturing of cardiovascular CoCr stents by selective laser melting. Mater. Des. 2017, 119, 338–350. [Google Scholar] [CrossRef] [Green Version]
Figure 1.
Scanning electron microscope (SEM) image of graphene oxide/Ti6Al4V (GO/TC4) powder.

Figure 2.
Schematic of four different scanning strategies: (a) L-scanning strategy; (b) S-scanning strategy; (c) H-scanning strategy; (d) C-scanning strategy (scan in the order of 1–6).
Figure 2.
Schematic of four different scanning strategies: (a) L-scanning strategy; (b) S-scanning strategy; (c) H-scanning strategy; (d) C-scanning strategy (scan in the order of 1–6).

Figure 3.
Melt tracks and temperature distributions of melt pool under different scanning strategies: (a) L-scanning strategy; (b) S-scanning strategy; (c) H-scanning strategy; (d) C-scanning strategy.
Figure 3.
Melt tracks and temperature distributions of melt pool under different scanning strategies: (a) L-scanning strategy; (b) S-scanning strategy; (c) H-scanning strategy; (d) C-scanning strategy.

Figure 4.
Temperature profiles of testing points under different scanning strategies: (a) L-scanning strategy; (b) S-scanning strategy; (c) H-scanning strategy; (d) C-scanning strategy.
Figure 4.
Temperature profiles of testing points under different scanning strategies: (a) L-scanning strategy; (b) S-scanning strategy; (c) H-scanning strategy; (d) C-scanning strategy.

Figure 5.
Temperature distributions at the end of the building process after cooling for 0.00204 s: (a) L-scanning strategy; (b) S-scanning strategy; (c) H-scanning strategy; (d) C-scanning strategy.
Figure 5.
Temperature distributions at the end of the building process after cooling for 0.00204 s: (a) L-scanning strategy; (b) S-scanning strategy; (c) H-scanning strategy; (d) C-scanning strategy.

Figure 6.
Surface topography of GO/TC4 samples under different scanning strategies: (a) L-scanning strategy; (b) S-scanning strategy; (c) H-scanning strategy; (d) C-scanning strategy.
Figure 6.
Surface topography of GO/TC4 samples under different scanning strategies: (a) L-scanning strategy; (b) S-scanning strategy; (c) H-scanning strategy; (d) C-scanning strategy.

Figure 7.
Microhardness of GO/TC4 nanocomposites under different scanning strategies.

Figure 8.
Tribological behaviors of GO/TC4 nanocomposites: (a) real-time friction coefficient; (b) average coefficient of friction; (c) wear volume.
Figure 8.
Tribological behaviors of GO/TC4 nanocomposites: (a) real-time friction coefficient; (b) average coefficient of friction; (c) wear volume.

Figure 9.
SEM images of worn surfaces of different samples: (a) L-scanning strategy; (b) S-scanning strategy; (c) H-scanning strategy; (d) C-scanning strategy.
Figure 9.
SEM images of worn surfaces of different samples: (a) L-scanning strategy; (b) S-scanning strategy; (c) H-scanning strategy; (d) C-scanning strategy.


Table 1.
Process parameters of selective laser melted (SLM) graphene oxide/Ti6Al4V (GO/TC4) nanocomposites.
Table 1.
Process parameters of selective laser melted (SLM) graphene oxide/Ti6Al4V (GO/TC4) nanocomposites.
| Laser Power (w) | Scanning Speed (mm/s) | Hatching Space (mm) | Layer Thickness (mm) | Laser Spot (μm) |
|---|---|---|---|---|
| 160 | 1000 | 0.06 | 0.03 | 50 |
Table 2.
Temperature gradient and cooling rate under different scanning strategies.
| Indicators | L-Scanning Strategy | S-Scanning Strategy | H-Scanning Strategy | C-Scanning Strategy |
|---|---|---|---|---|
| Temperature Gradient (°C) | 155.15 | 152.479 | 136.289 | 132.35 |
| Cooling Rate (°C/s) | 76,053.9 | 74,744.6 | 66,808.3 | 64,877.5 |
Table 3.
Surface roughness of GO/TC4 nanocomposites under different scanning strategies.
| Roughness (μm) | L-Scanning Strategy | S-Scanning Strategy | H-Scanning Strategy | C-Scanning Strategy |
|---|---|---|---|---|
| H-Surface | 9.20 ± 1.30 | 5.84 ± 0.60 | 6.67 ± 0.60 | 2.80 ± 0.40 |
| V-Surface | 6.60 ± 0.80 | 5.23 ± 0.50 | 1.96 ± 0.40 | 1.02 ± 0.30 |
Table 4.
The surface and volume porosity of the SLM-processed GO/TC4 nanocomposites.
| Porosity (%) | L-Scanning Strategy | S-Scanning Strategy | H-Scanning Strategy | C-Scanning Strategy |
|---|---|---|---|---|
| Surface | 12.3 ± 3 | 10.6 ± 2 | 3.2 ± 1 | 2.6 ± 1 |
| Volume | 7.59 ± 1.80 | 5.28 ± 1.50 | 1.96 ± 1.70 | 1.12 ± 0.50 |
Publisher’s Note: MDPI stays neutral with regard to jurisdictional claims in published maps and institutional affiliations. |
© 2020 by the authors. Licensee MDPI, Basel, Switzerland. This article is an open access article distributed under the terms and conditions of the Creative Commons Attribution (CC BY) license (http://creativecommons.org/licenses/by/4.0/).
Share and Cite
MDPI and ACS Style
Miao, X.; Liu, X.; Lu, P.; Han, J.; Duan, W.; Wu, M. Influence of Scanning Strategy on the Performances of GO-Reinforced Ti6Al4V Nanocomposites Manufactured by SLM. Metals 2020, 10, 1379. https://doi.org/10.3390/met10101379
AMA Style
Miao X, Liu X, Lu P, Han J, Duan W, Wu M. Influence of Scanning Strategy on the Performances of GO-Reinforced Ti6Al4V Nanocomposites Manufactured by SLM. Metals. 2020; 10(10):1379. https://doi.org/10.3390/met10101379
Chicago/Turabian StyleMiao, Xiaojin, Xin Liu, Peipei Lu, Jitai Han, Weipeng Duan, and Meiping Wu. 2020. "Influence of Scanning Strategy on the Performances of GO-Reinforced Ti6Al4V Nanocomposites Manufactured by SLM" Metals 10, no. 10: 1379. https://doi.org/10.3390/met10101379
Note that from the first issue of 2016, this journal uses article numbers instead of page numbers. See further details here.