1. Introduction
Atrial fibrillation (AF) is the most common rhythm disorder worldwide [
1]. AF uses up significant healthcare resources [
2], with a high risk of a variety of co-morbidities, up to 30% of the risk of clinical cerebrovascular events [
3,
4,
5] and a greater mortality risk [
6]. Given the high incidence of AF within the general population and its extensive impact on both life expectancy and quality of life, correct and prompt management of the cardiopathy is necessary [
7]. During AF, uncoordinated electrical impulses take control of the atrial activation and substitute normal sinus node pacemaker functions, provoking accelerated, irregular heart rate.
In the order of their prognostic significance, the treatment targets in AF patients are as follows: 1. Prevention of ischemic stroke/peripheral arterial embolism with anticoagulants; 2. Control/prevention of the risk factors/diseases leading to the development of AF or recurrence of AF episodes; 3. Rate control; and 4. Rhythm control (i.e., normal sinus rhythm restoration) [
8].
The fundamental observation of Haïssaguerre et al. was the identification of ectopic beats at the pulmonary veins (PV) as important triggers for the initation of AF, which could be isolated by means of radiofrequency ablation [
9]. However, the multiple wave hypothesis states that AF can be perpetuated by continuous conduction of several independent waves propagating through the atrial musculature in an apparently in a chaotic way [
10]. Nevertheless, numerous experiments and clinical observations can be reconciled with the multiple wave hypothesis. As long as the number of wavefronts remains above a critical level, they will be able to sustain the arrhythmia. Moreover, the number of waves circulating in the atria affects the spatio-temporal organization of AF and the effectiveness of defibrillation [
10,
11], with organization defined as an atrial signal with high periodicity and consistent morphology.
Although PV isolation is today considered as a cornerstone in AF ablation procedures, it still has a limited success rate regarding AF recurrence [
12,
13,
14]. A correct selection of patients for ablation is important to avoid exposing patients who are unlikely to maintain long-term sinus rhythm to such an invasive procedure, as well as to avoid repeating the procedure when the arrhythmia becomes permanent [
12,
13,
14,
15,
16].
It has recently been proven that, when the onset of the arrhythmia is very recent, the activation sequences within a small region are closely correlated (reflecting their involvement in the same wavelet), whereas the activation sequences beyond a certain distance are not as highly correlated (reflecting their involvement in different wavelets) [
17]. In addition, time delay estimation [
18] and Granger causality [
19] were proposed as helpful measurements to investigate wavefront propagation and connectivity between different atrial sites.
In this article, we test the hypothesis that the similarity between wavefronts located in the pulmonary veins is lower in patients with AF recurrence than in patients who maintain a normal rhythm after successful ablation. The goal of this study is, therefore, to analyze atrial electrical activity similarity using cross-correlation and time-directed information transfer from recordings registered along PVs with the aim to help in decision-making during the ablation procedure.
The rest of the paper is organized as follows.
Section 2 provides the materials used and the measurement procedures are explained in detail.
Section 3 introduces the methodology employed.
Section 4 presents the results obtained.
Section 5 presents and discusses the research results and study limitations. Finally,
Section 6 presents our conclusions.
2. Materials
Ten patients with AF submitted to a radiofrequency catheter ablation procedure for PV isolation were considered for this study. Intracardiac recordings for a duration of 60 s were sequentially taken previous to the ablation of each single PV until all four PV were isolated. Patients were divided into two groups according to follow-up results, whether they remained in sinus rhythm or, otherwise, presented AF recurrence.
Table 1 shows several parameters consisting of age (years), electrical cardioversion (ECV), sex, AF duration longer than six months and recurrence in the arrhythmia, using either one (1) or zero (0), expressing “true” or “false”, respectively.
Electrode catheters are used for recording and pacing. These consist of insultated wires that, introduced via a transatrial septal long sheath, are connected to their respective electrodes at the distal tip of the catheter. Our recordings are derived from a ten pole catheter, with bipolar electrodes positioned 2 mm apart and an interelectrode distance of 5 mm (Lasso, 2-5-2 mm electrode spacing). The catheter was configured according to distal ring with its five bipolar electrodes surrounding the PV. With this configuration, the distance between the electrodes was either 5 mm or 10 mm. The wires from the catheter were connected to an external device that digitized and recorded the signals at a sampling rate of 1 kHz.
Bipolar electrograms were sequentially recorded in each of the pulmonary veins before being isolated, with the following order: (1) left inferior PV (LIPV); (2) left superior PV (LSPV); (3) right inferior PV (RIPV), and (4) right superior PV (RSPV).
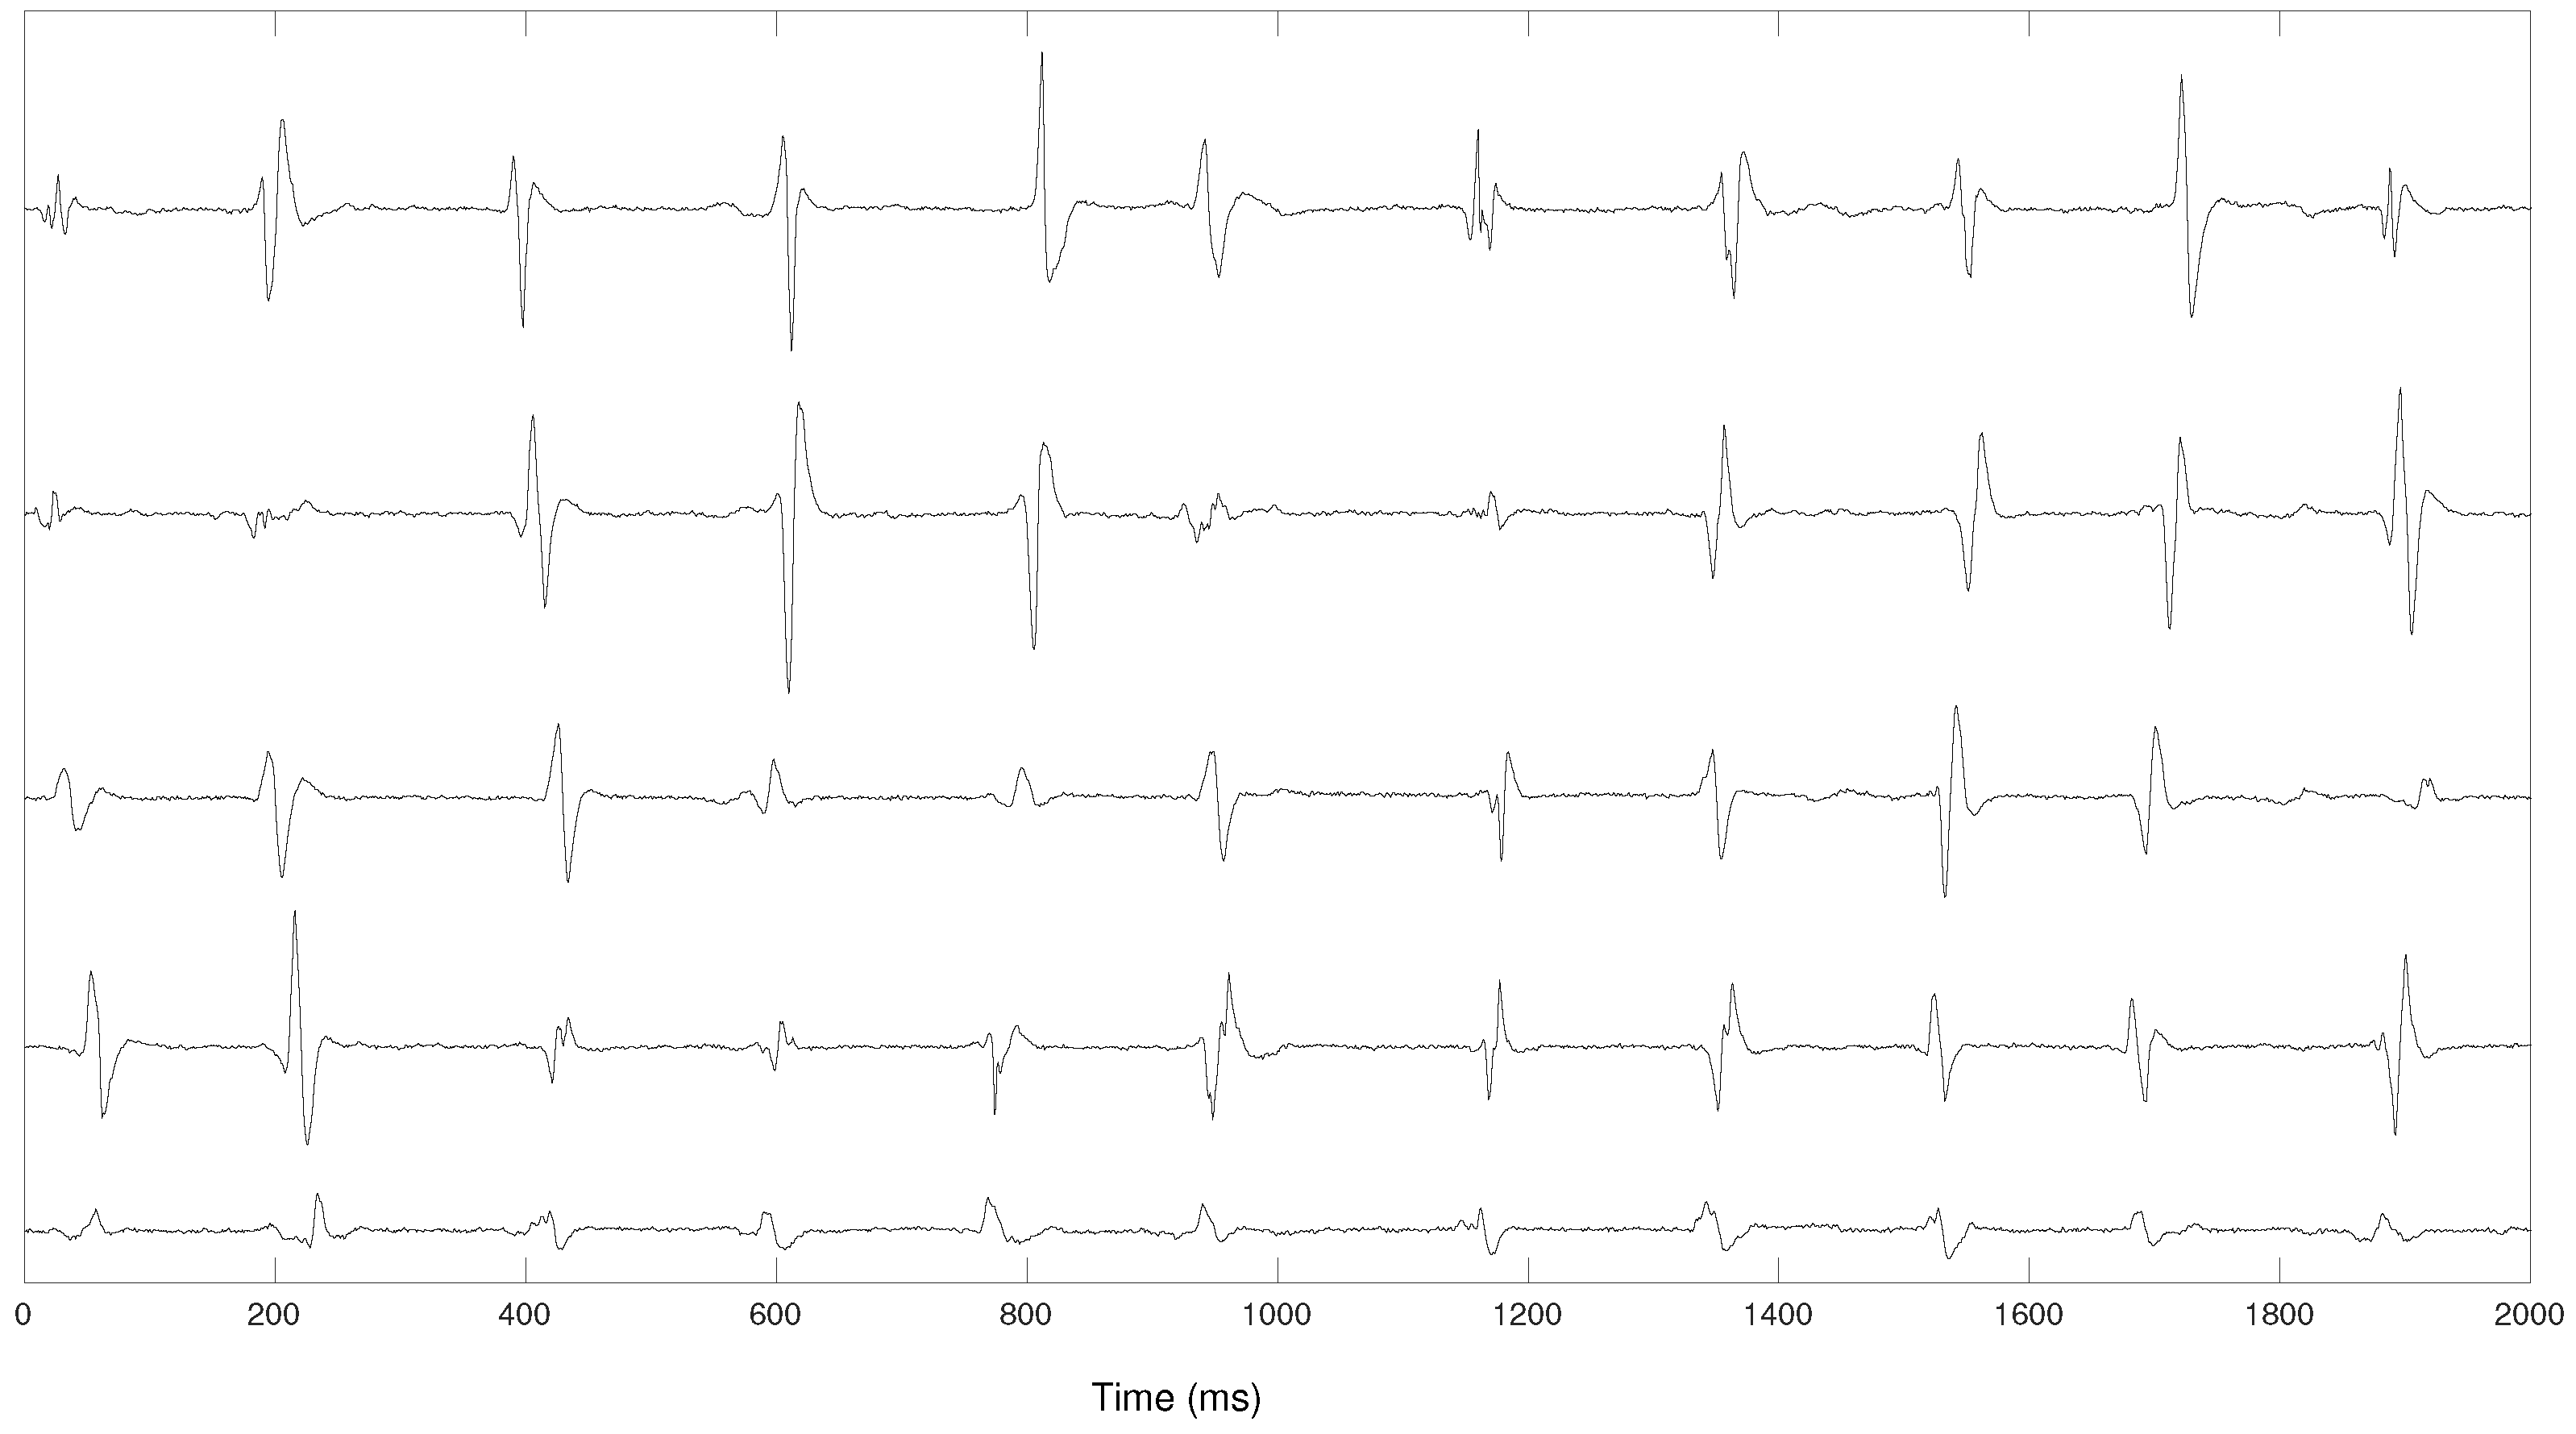
Each pair of bipolar electrodes outputs a pulsatile signal reflecting local activation times (LATs). As occurs with bipolar electrodes, the morphology of the pulse depends on the wavefront direction with regard to the electrode pair. As a result, stable and repeatable wavefronts will generate periodic pulses with similar morphology. Conversely, non-stable wavefronts will generate irregular intervals between LATs and a more variable pulse waveform (
Figure 1).
3. Methods
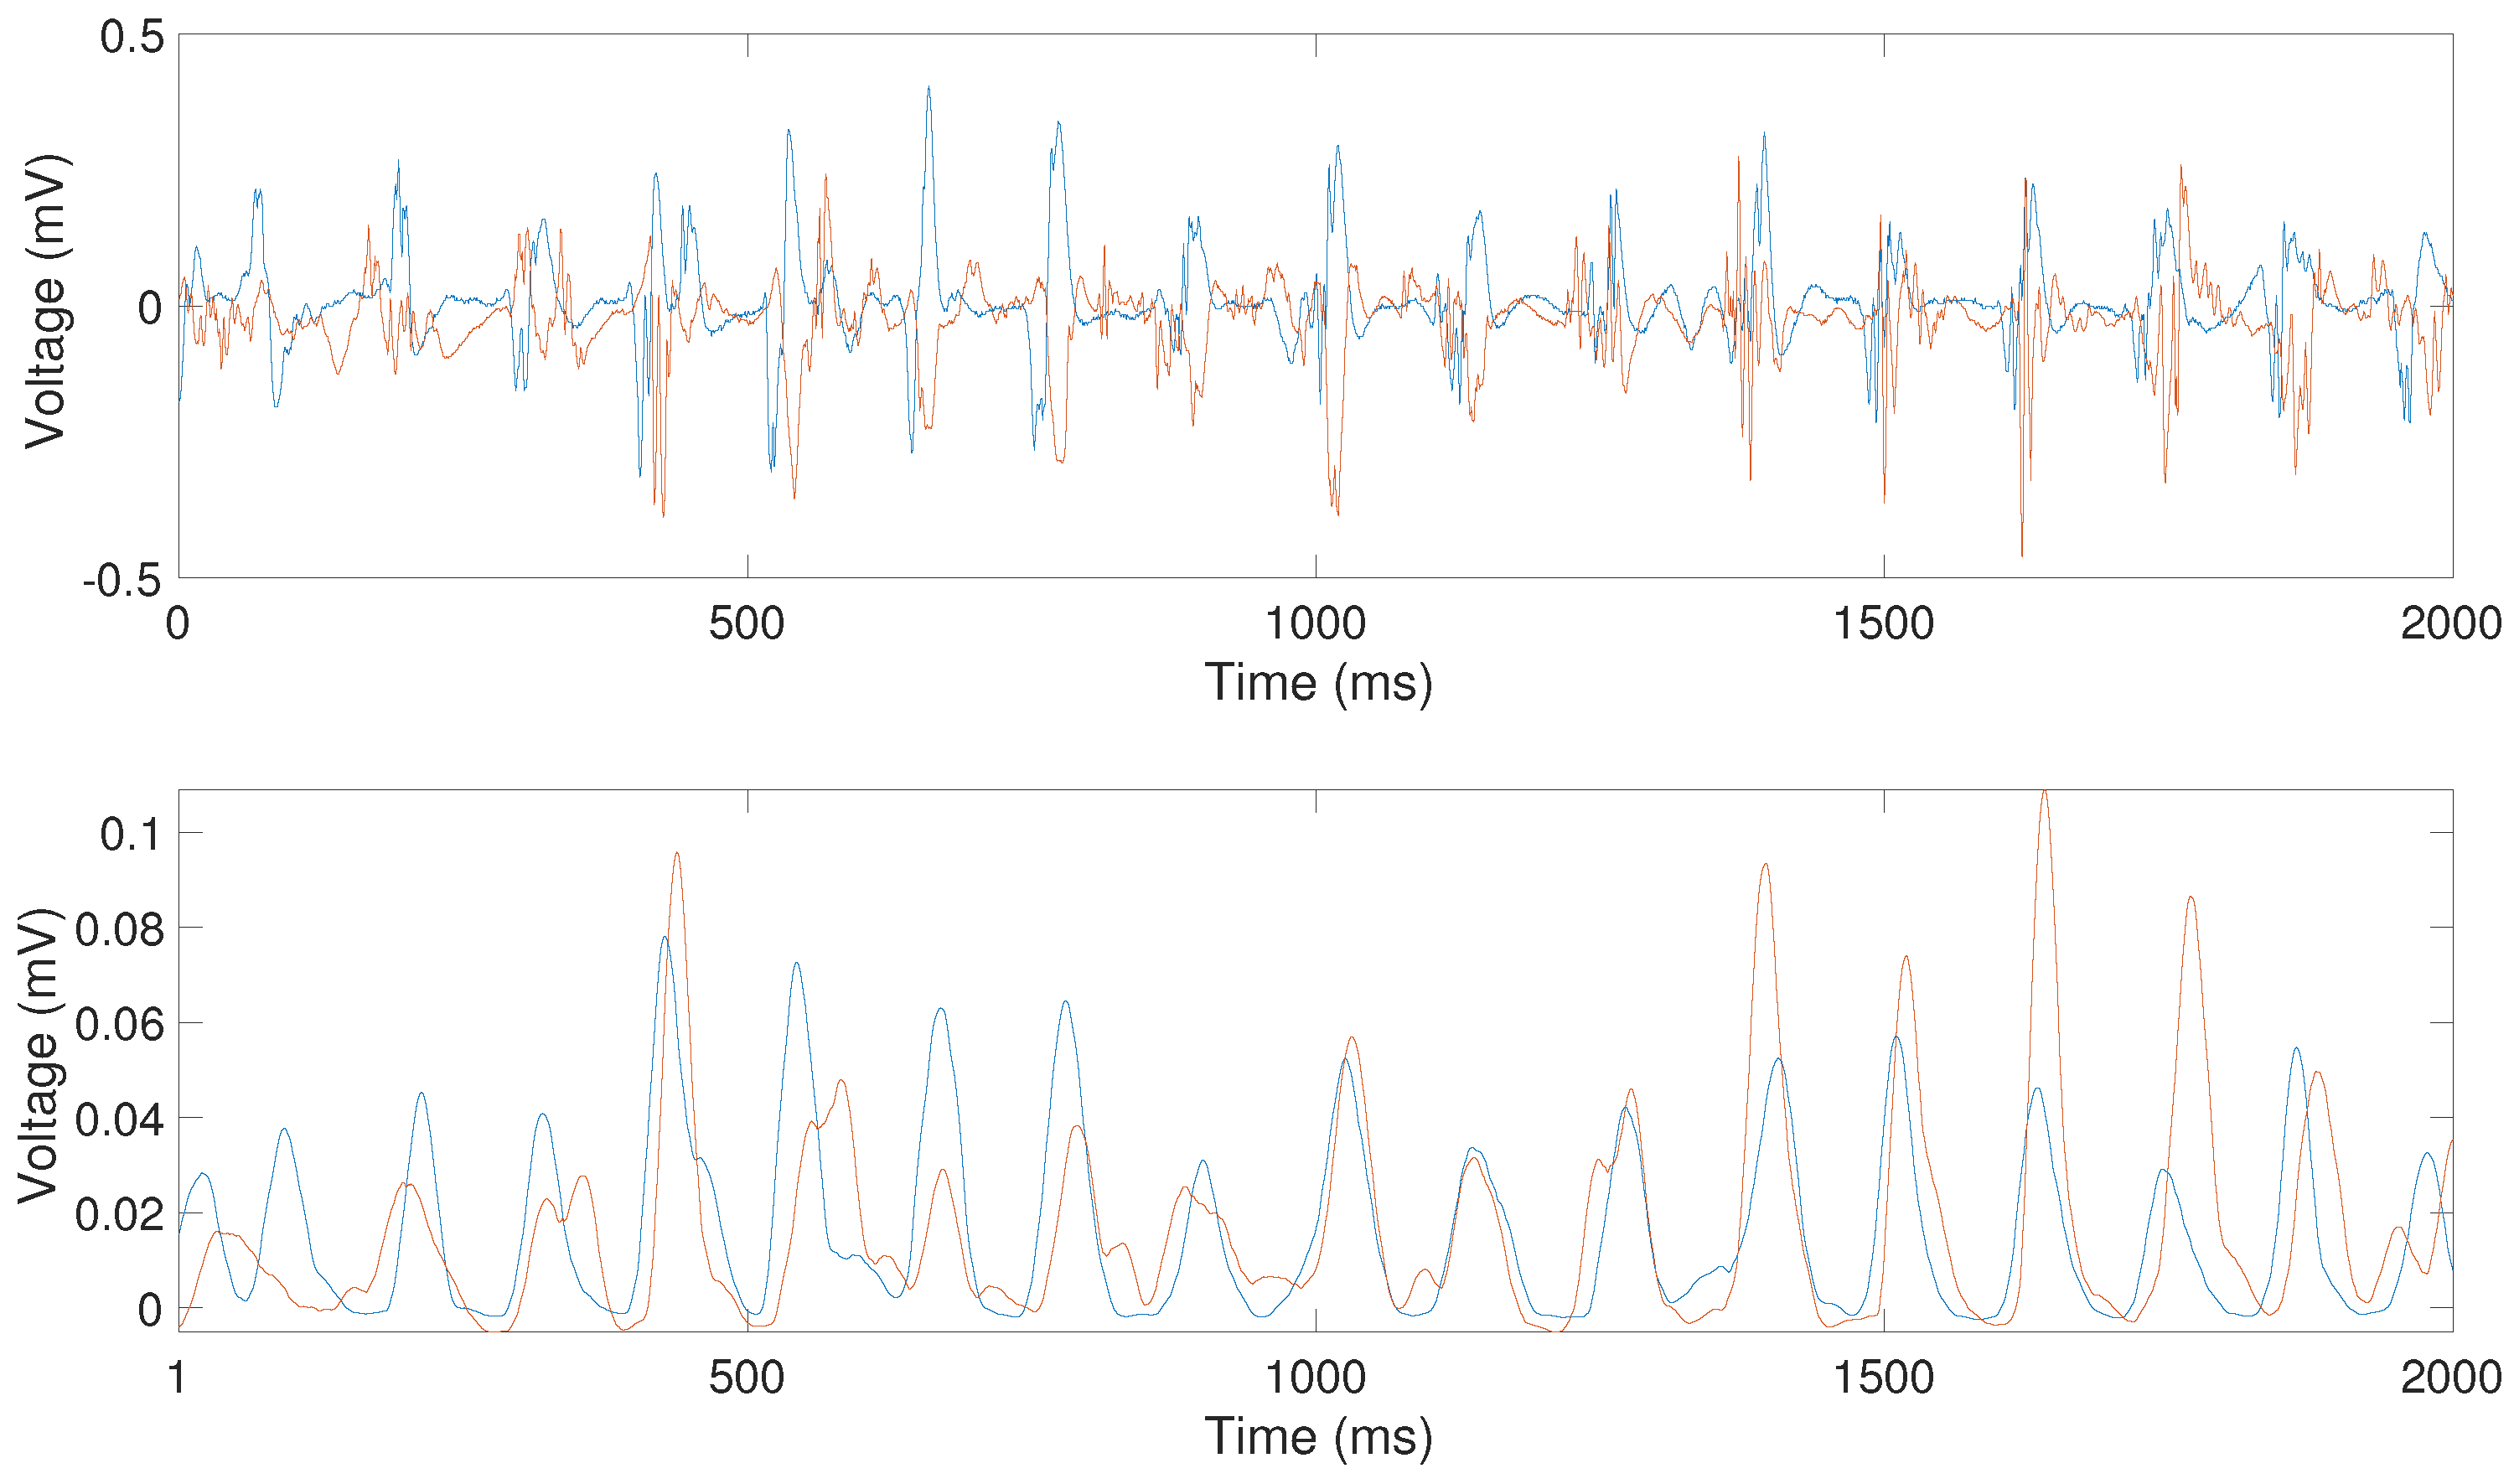
In order to convert the irregular waveforms of the activations recorded by bipolar electrodes during AF, the following prepocessing was applied: firstly the signals were band-pass filtered, employing a third-order Butterworth filter with lower and upper cutoff frequencies of 40 Hz and 250 Hz, respectively. The resulting filtered signals were then rectified. Finally, signals were low-pass filtered using a 20 Hz third-order Butterworth filter (
Figure 2). This preprocessing provides a time-varying signal with more homogeneous pulse shapes while preserving the LATs of the original signal [
20] and was proposed as a previous step to compute the cross-correlation between pairs of electrograms [
17]. The underlying objective is to look for relationships between the time series at two different atrial sites as a measurement of spatial organization [
21].
After the preprocessing step, cross-correlation measurements were carried out in order to quantify the synchronization of the local activation time series between different sites. This analysis has been previously applied to different types of signals, from biomedical to meteorological signals [
22,
23,
24]. Mathematics can be helpful for a better understanding of wave propagation in these cardiac models to gain a clear picture of the correlation as a snapshot measure of global synchrony.
A system, such as the atria and its electrical activity, can be measured by two variables, x and y.
The series
with
i the temporal index) is reduced to a process with zero mean and unitary variance by means of the normalization
where
and
are the mean and standard deviation of the series, respectively.
From the normalized series, the cross-correlation feature and transfer entropy were implemented to ascertain whether variations between wave morphologies alongside the time and atrial regions could be recognized. This analysis requires two simultaneous recorded signals x and y from closely spaced recordings. The series y may be related to past lags of the x activation series, or vice versa. These measurements can be useful to assess the degree of organization, delay between activation and causal direction.
3.1. Correlation
From the normalized time series,
and
, the cross-correlation function was carried out to evaluate the consistency of the LATs sequence between different sites. It may be approximated by:
where
N is the length of the segments to be correlated,
k is the signals time-lag ranging from
to
K (i.e., the range within the correlation function is to be evaluated),
and
are the mean values of the two time series, and
,
are the standard deviations of the corresponding segments from
and
, respectively.
If the peak correlation is at the centre (offset = 0), this indicates that the two time series are most synchronized at that moment. However, the peak correlation may be at a different offset if one signal precedes another. Indeed, cross-correlation functions can be used to quantify time delays between signals (lags) and thus reveal the dynamic causality. Therefore, time lagged cross correlation can identify directionality, such as a leader-follower relationship in which the leader initiates a response, which is repeated by the follower and also identify how this behavior shifts over time. The maximum absolute peak was considered as the correlation coefficient between two sites and k as the time lag at which the correlation between and was maximum, where k is negative, x precedes y, and the predictor is y. On the other hand, when k is positive, x lags y, and the predictor is x. This operation was repeated sequentially for all recordings. The time lag reports the duration by which one series leads or trails the other, in other words, how long it takes for the effect to propagate from one dipole to the other. Therefore, the relationship between proximal vein observations or locations is characterized by two parameters: the correlation value and the time lag.
3.2. Transfer Entropy
Schreiber proposed an information-theoretic measure called Transfer Entropy (TE) [
25], which can be used to detect the directionality of the flow of information within many areas of application, ranging from biomedicine [
26] to engineering [
27]. We propose this unmodeled method for estimating connectivity. In particular, TE quantifies how much the present and past of a random variable conditions the future transitions of another.
Given the normalized time series,
x and
y, the entropy for a signal
lagged
k samples (i.e.,
) with respect to another signal
can be defined by Equation (
3) and with respect to itself (i.e.,
) by Equation (
4).
where
i covers all recorded time intervals, and
p denotes the transition probability density. If
x is transferring information to
y, we should observe a drop in
relative to
, since knowing the past values of
x would reduce uncertainty about the future of
y. Thus, TE, termed
, is the difference between these two entropies:
This equation resolves uncertainty in predicting Y when considering the past values of both Y and X compared to considering the past values of Y alone.
3.3. Statistical Analysis
As a final step statistical techniques have been carried out to the extracted parameters. One-way ANOVA with repeated measures tests have been used for comparison among both groups of outcomes alongside the radio-frequency ablation procedure. Results are considered to be statistically significant at .
4. Results
4.1. Cross-Correlation Results
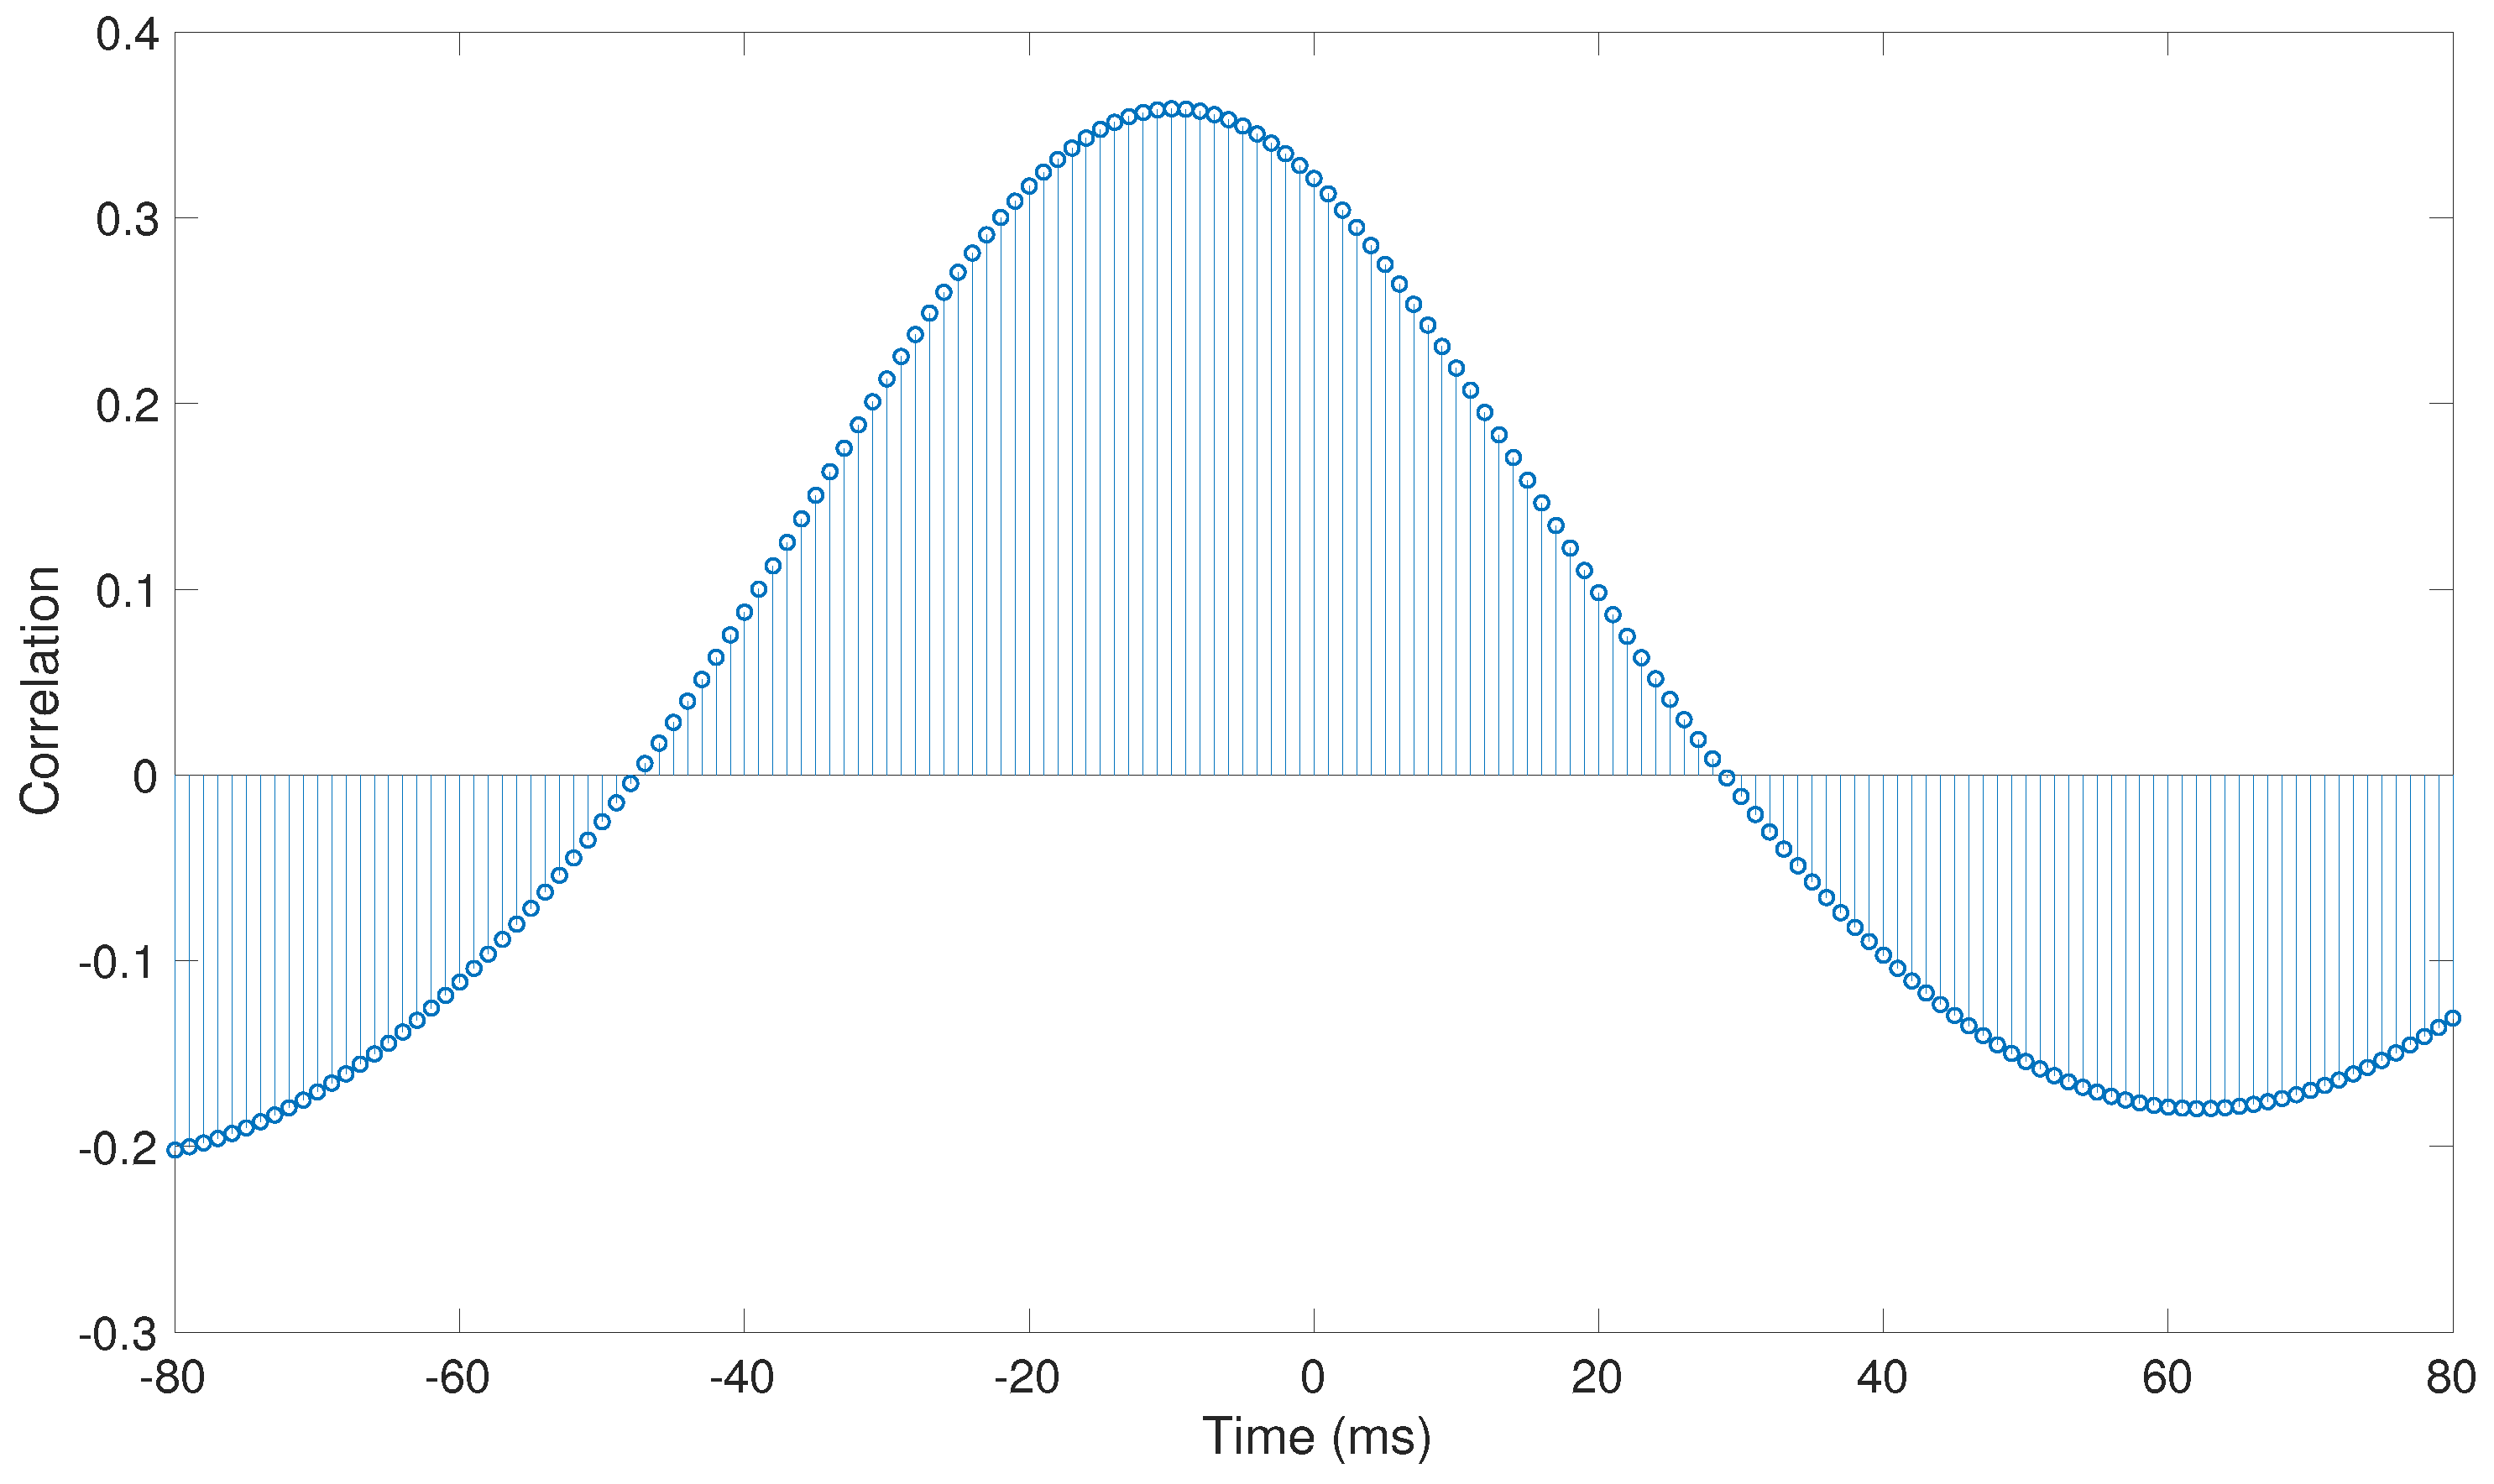
An example of the cross-correlation function between a pair of simultaneous signals (
Figure 2) is shown in
Figure 3. As can be observed, peak correlation is not at the center, which indicates that both time series are not synchronized at that moment, but there is a time lag between them instead. The negative offset reflects that
x is leading the interaction (correlation is maximized when
y is pulled forward by 40 ms). Thus, signal dynamics are assessed at a global level. It thus allows us to observe that time lag between electrodes depends on the wavelets along the atria and on the distance between electrodes. Previous studies showed that, in patients with AF, the correlation between signals decreases through an exponential distribution, as the distance between the electrodes increases [
17].
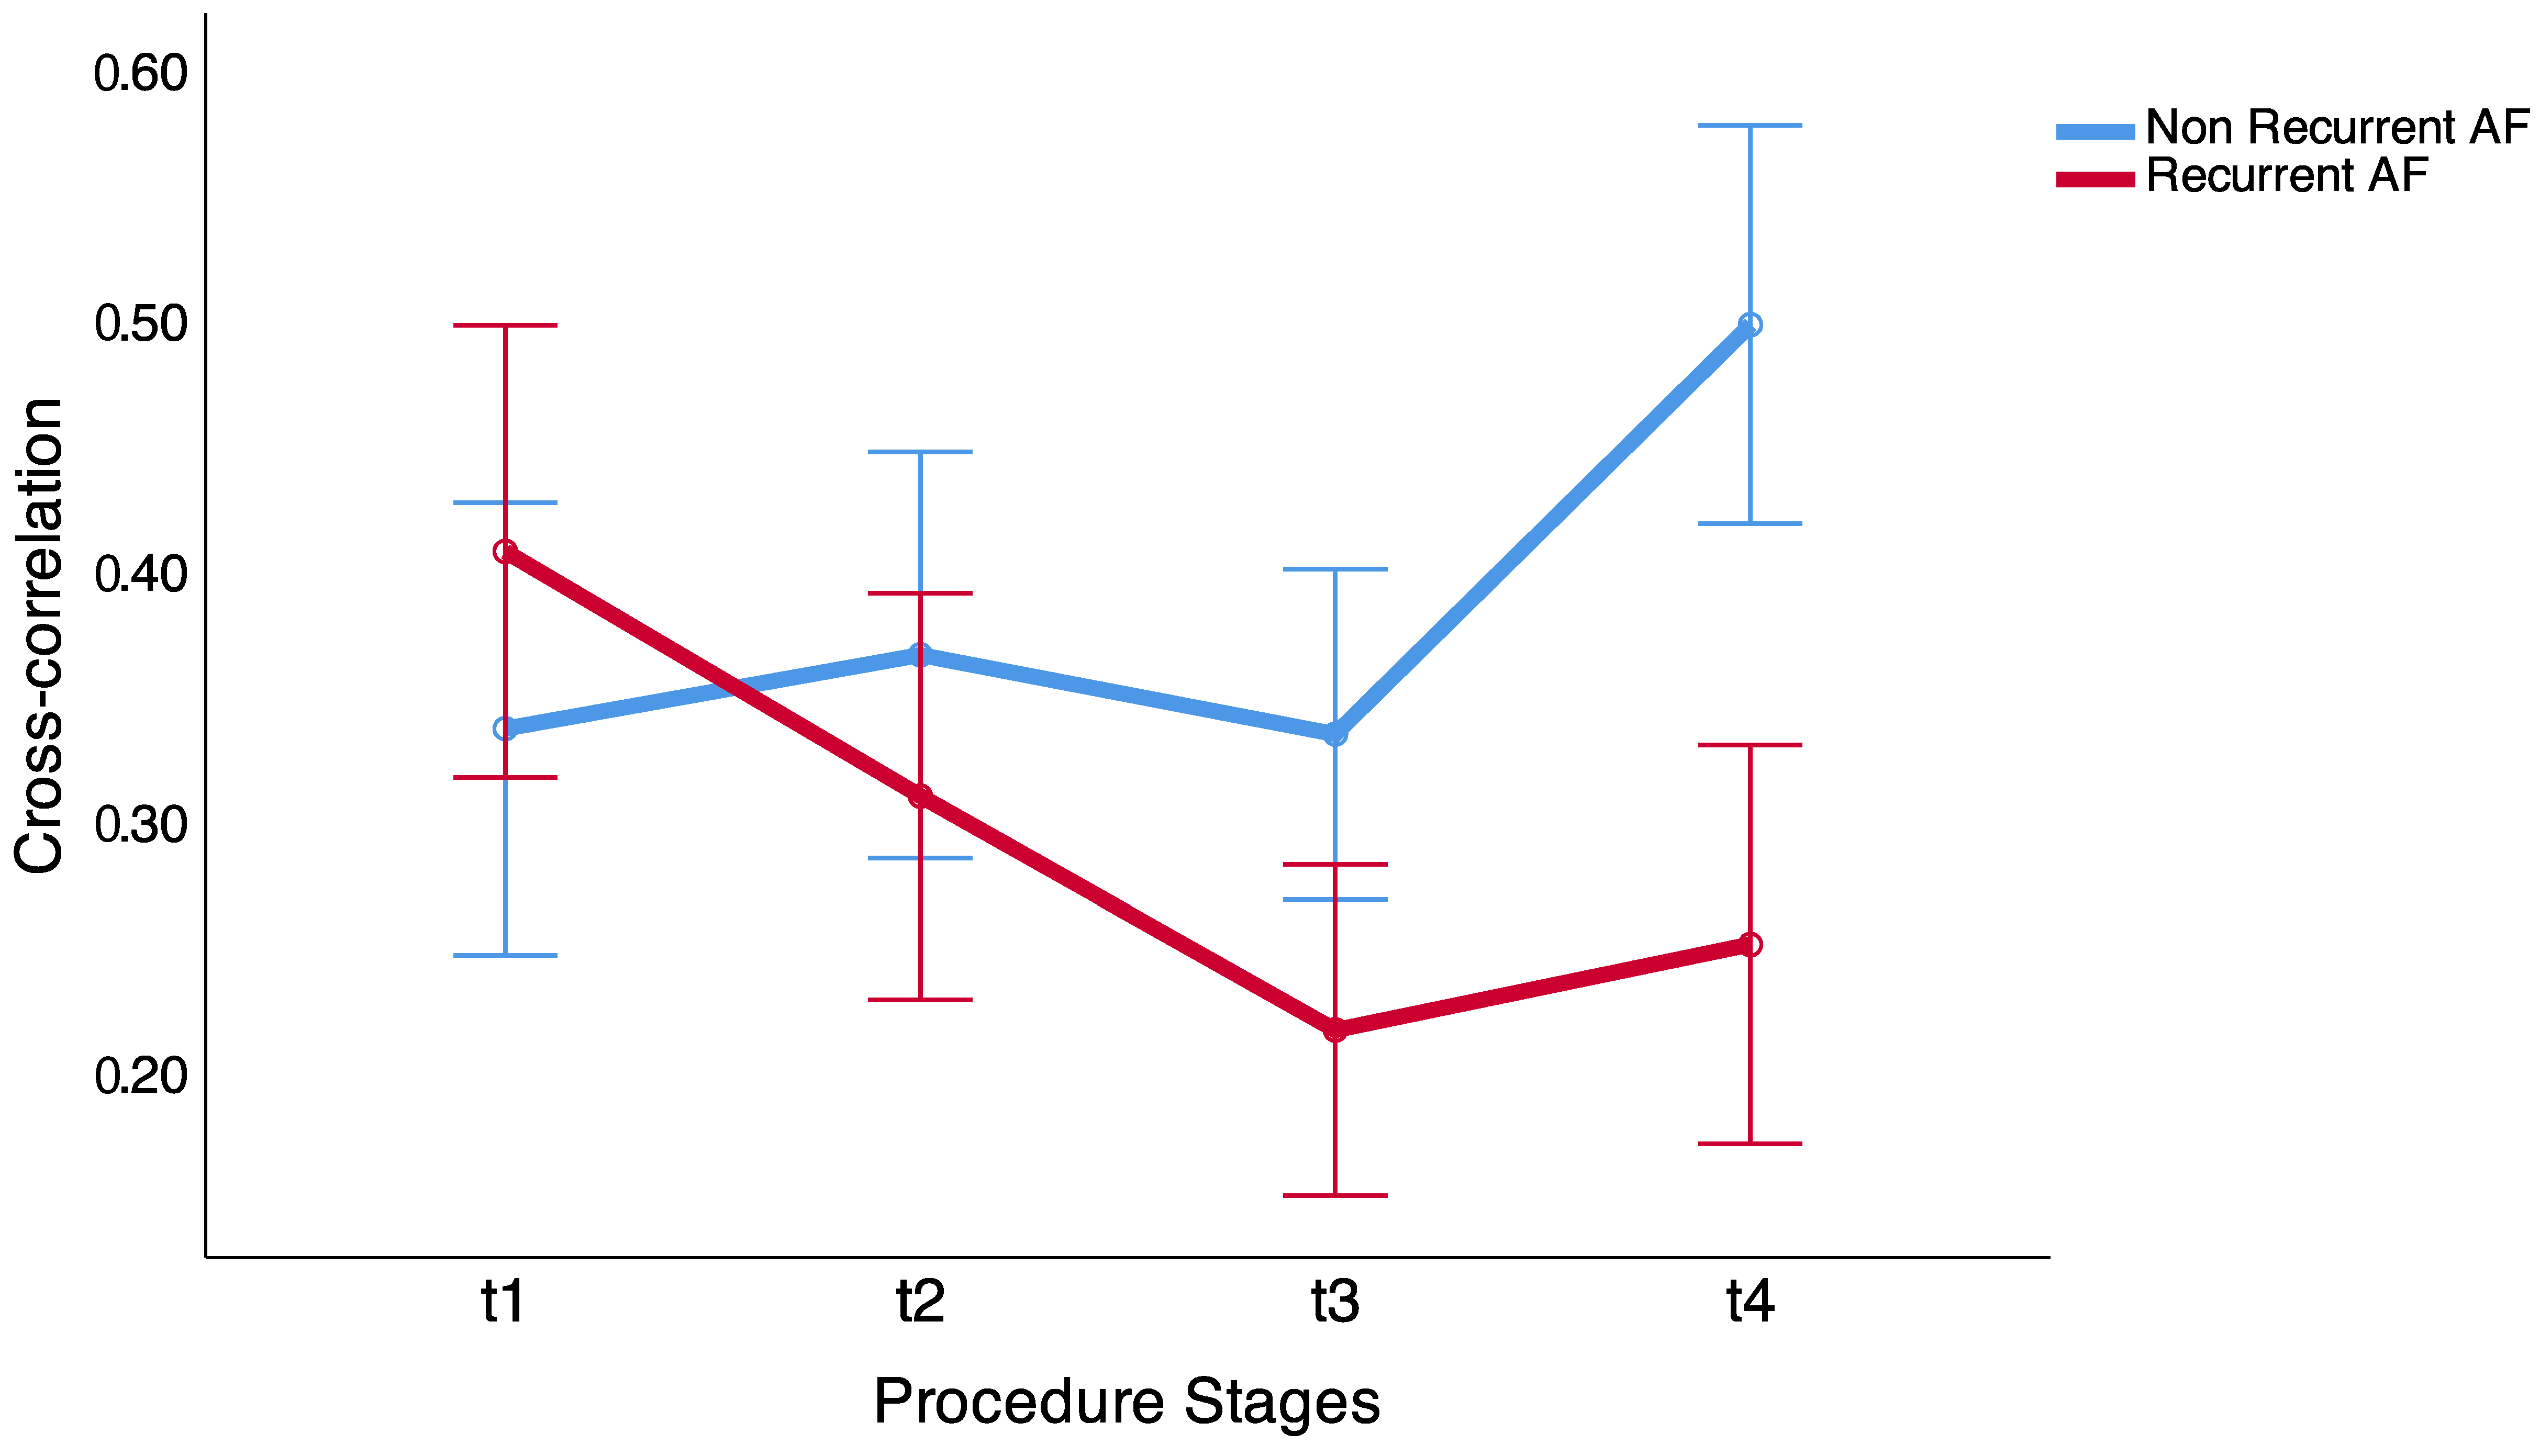
The cross-correlation coefficient and time lag between time series were calculated between dipoles located in each PV, between dipoles located 5 mm and 10 mm distance to each other in sequential moments, previous to electrical isolation of each pulmonary vein. Results show that, in patients without recurrences in the arrhythmia the correlation increases during the ablation procedure, and in patients that had long-term recurrences in the AF, the correlation between dipoles does not increase (
Figure 4). The global differences between both groups showed statistically significant differences
vs.
in non-recurrent AF and recurrent AF groups, respectively (
p = 0.013).
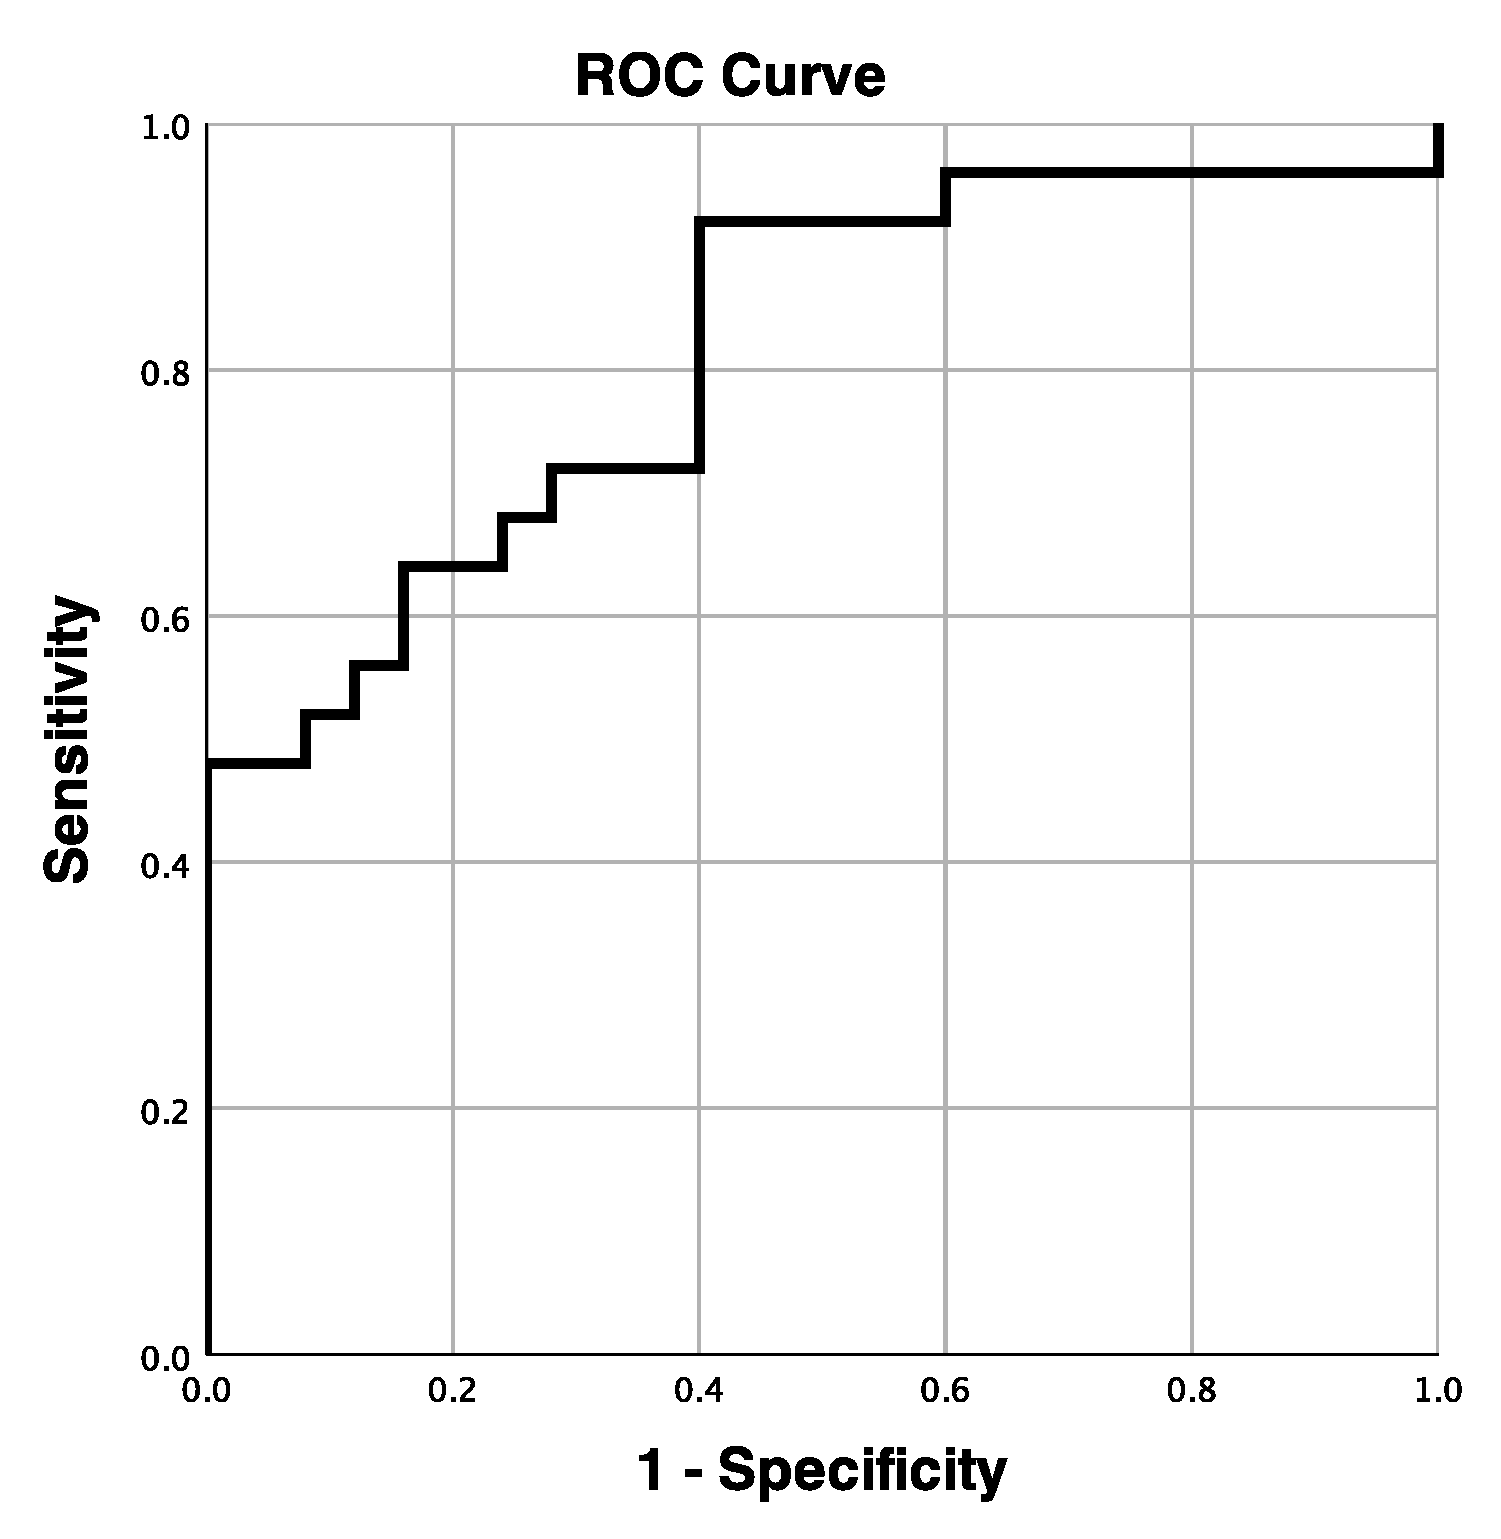
Thus, from the third ablation procedure stage (t3), before isolating the third PV, we found statistically significant differences between both groups (
Table 2). Nevertheless, from the last procedure stage (t4), it is possible to discriminate between the two groups with an accuracy of 81.4% (
Figure 5).
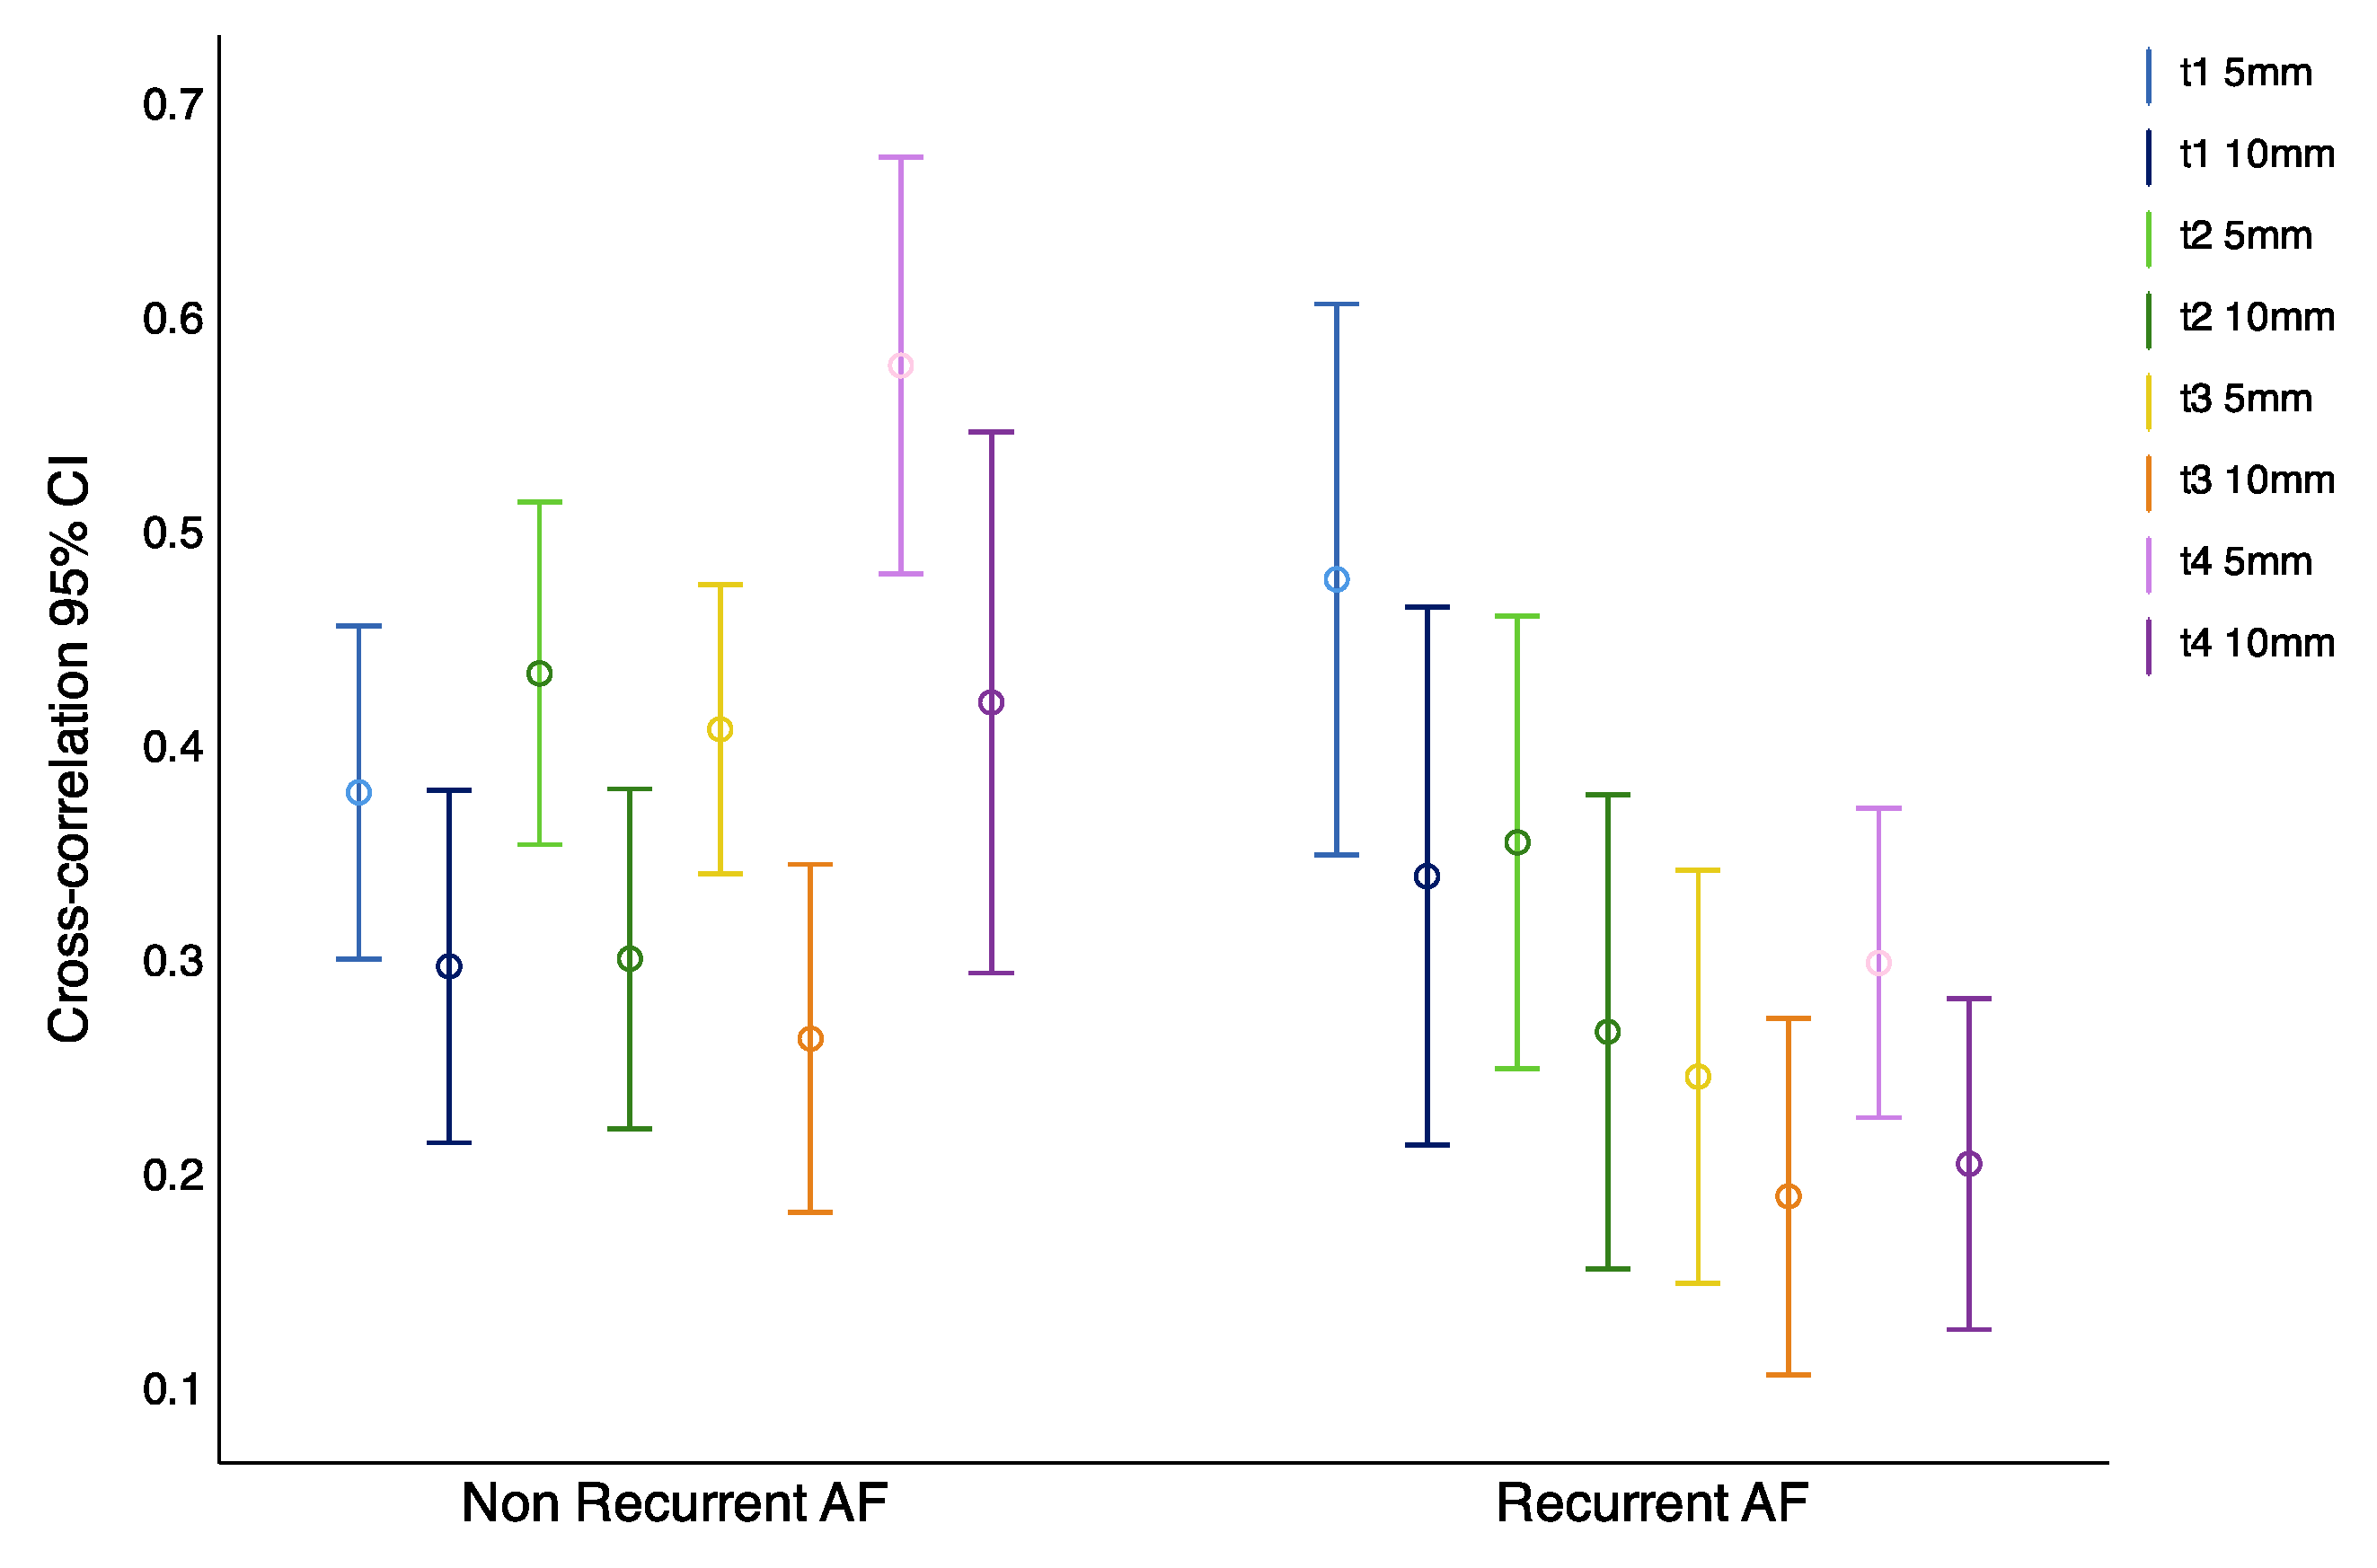
Observations indicate that, in patients that maintain sinus rhythm, the correlation between closer located dipoles increases throughout the evolution of the procedure. However, in recordings from patients with AF recurrence, this effect was not observed (
Figure 6). Furthermore, these differences between the two groups were statistically significant in the more closely located dipoles (
Table 3).
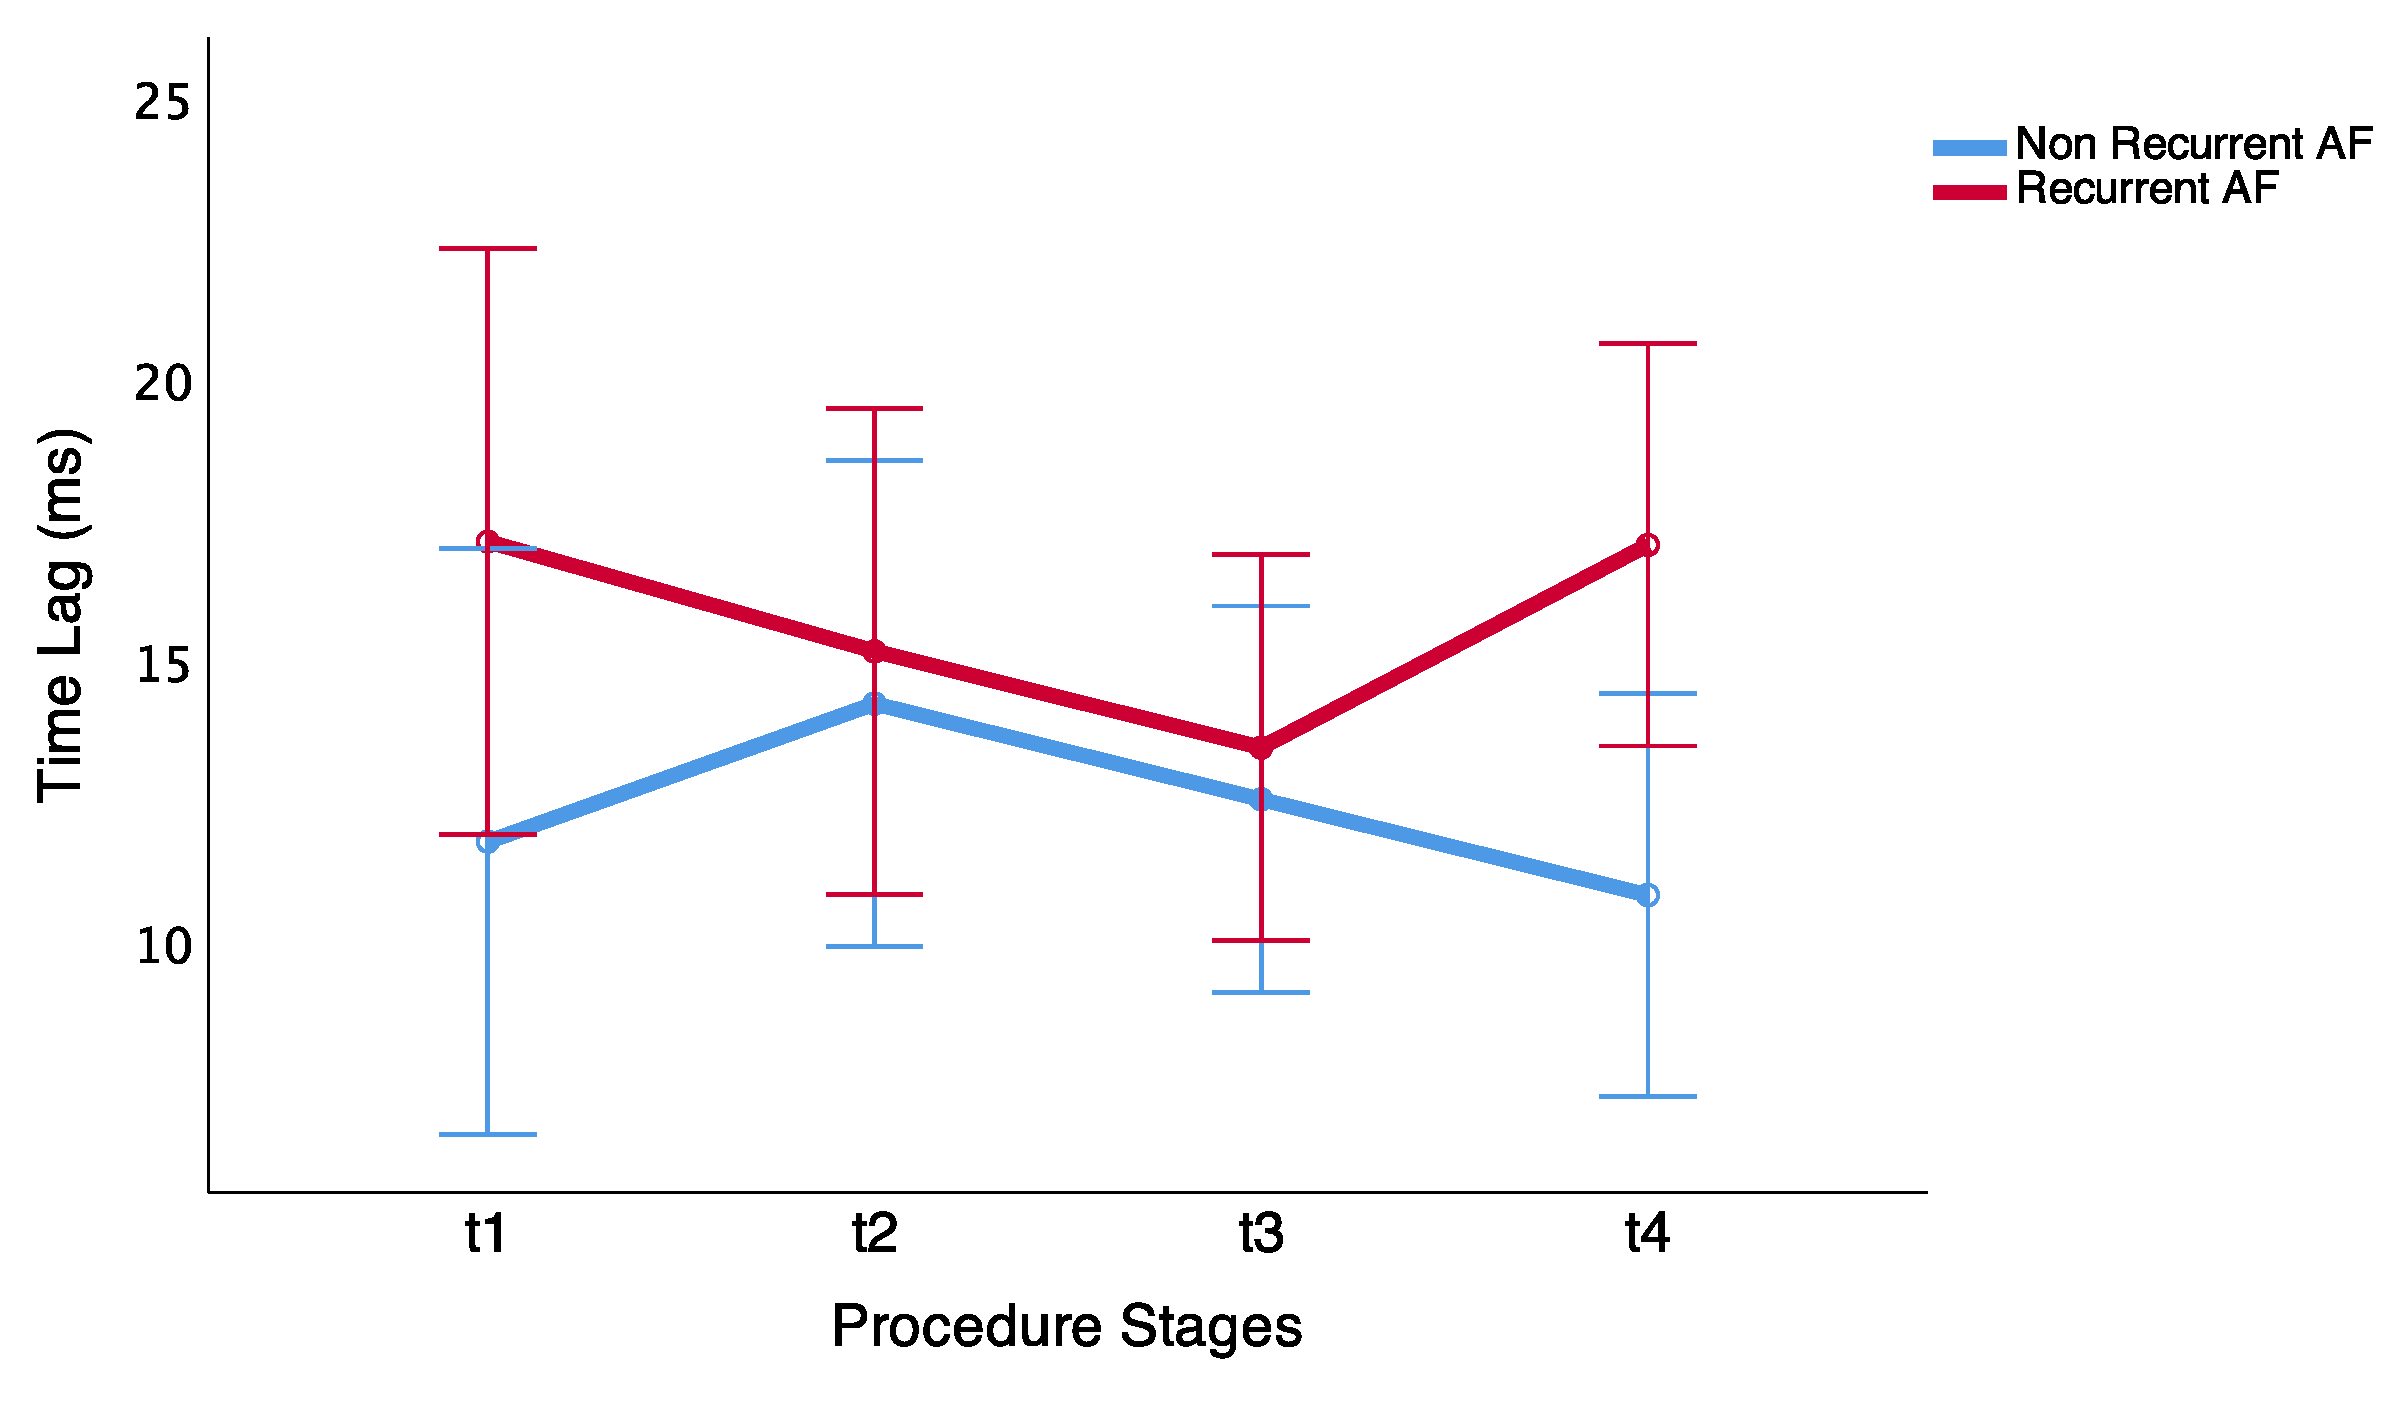
In addition, time lags along the ablation procedure follows an opposite trend in the two patient groups: whereas delays between wavefronts decrease in patients that maintain sinus rhythm, they increase in patients with AF recurrence (
Figure 7).
Moreover, it was possible to find differences over time with a different trend in both groups during the last stage of PV ablation procedure. Thus, in patients that maintain sinus rhythm, it is possible to observe different delays between dipoles located at different distances. Nevertheless, these differences were not shown in patients with arrhythmia recurrence.
Finally, we observed statistical significance in time-lag differences between both groups before the last ablation procedure stage (t4)
ms vs.
ms in the non-recurrent AF and recurrent AF groups, respectively (
p = 0.017). Thus, delay differences showed differences at closer inter-dipole distance in the patients that maintain sinus rhythm (
Table 4).
4.2. Transfer Entropy Results
Transfer entropy results between closely located dipoles were significant in the same stages as in the correlation study. These results are detailed in
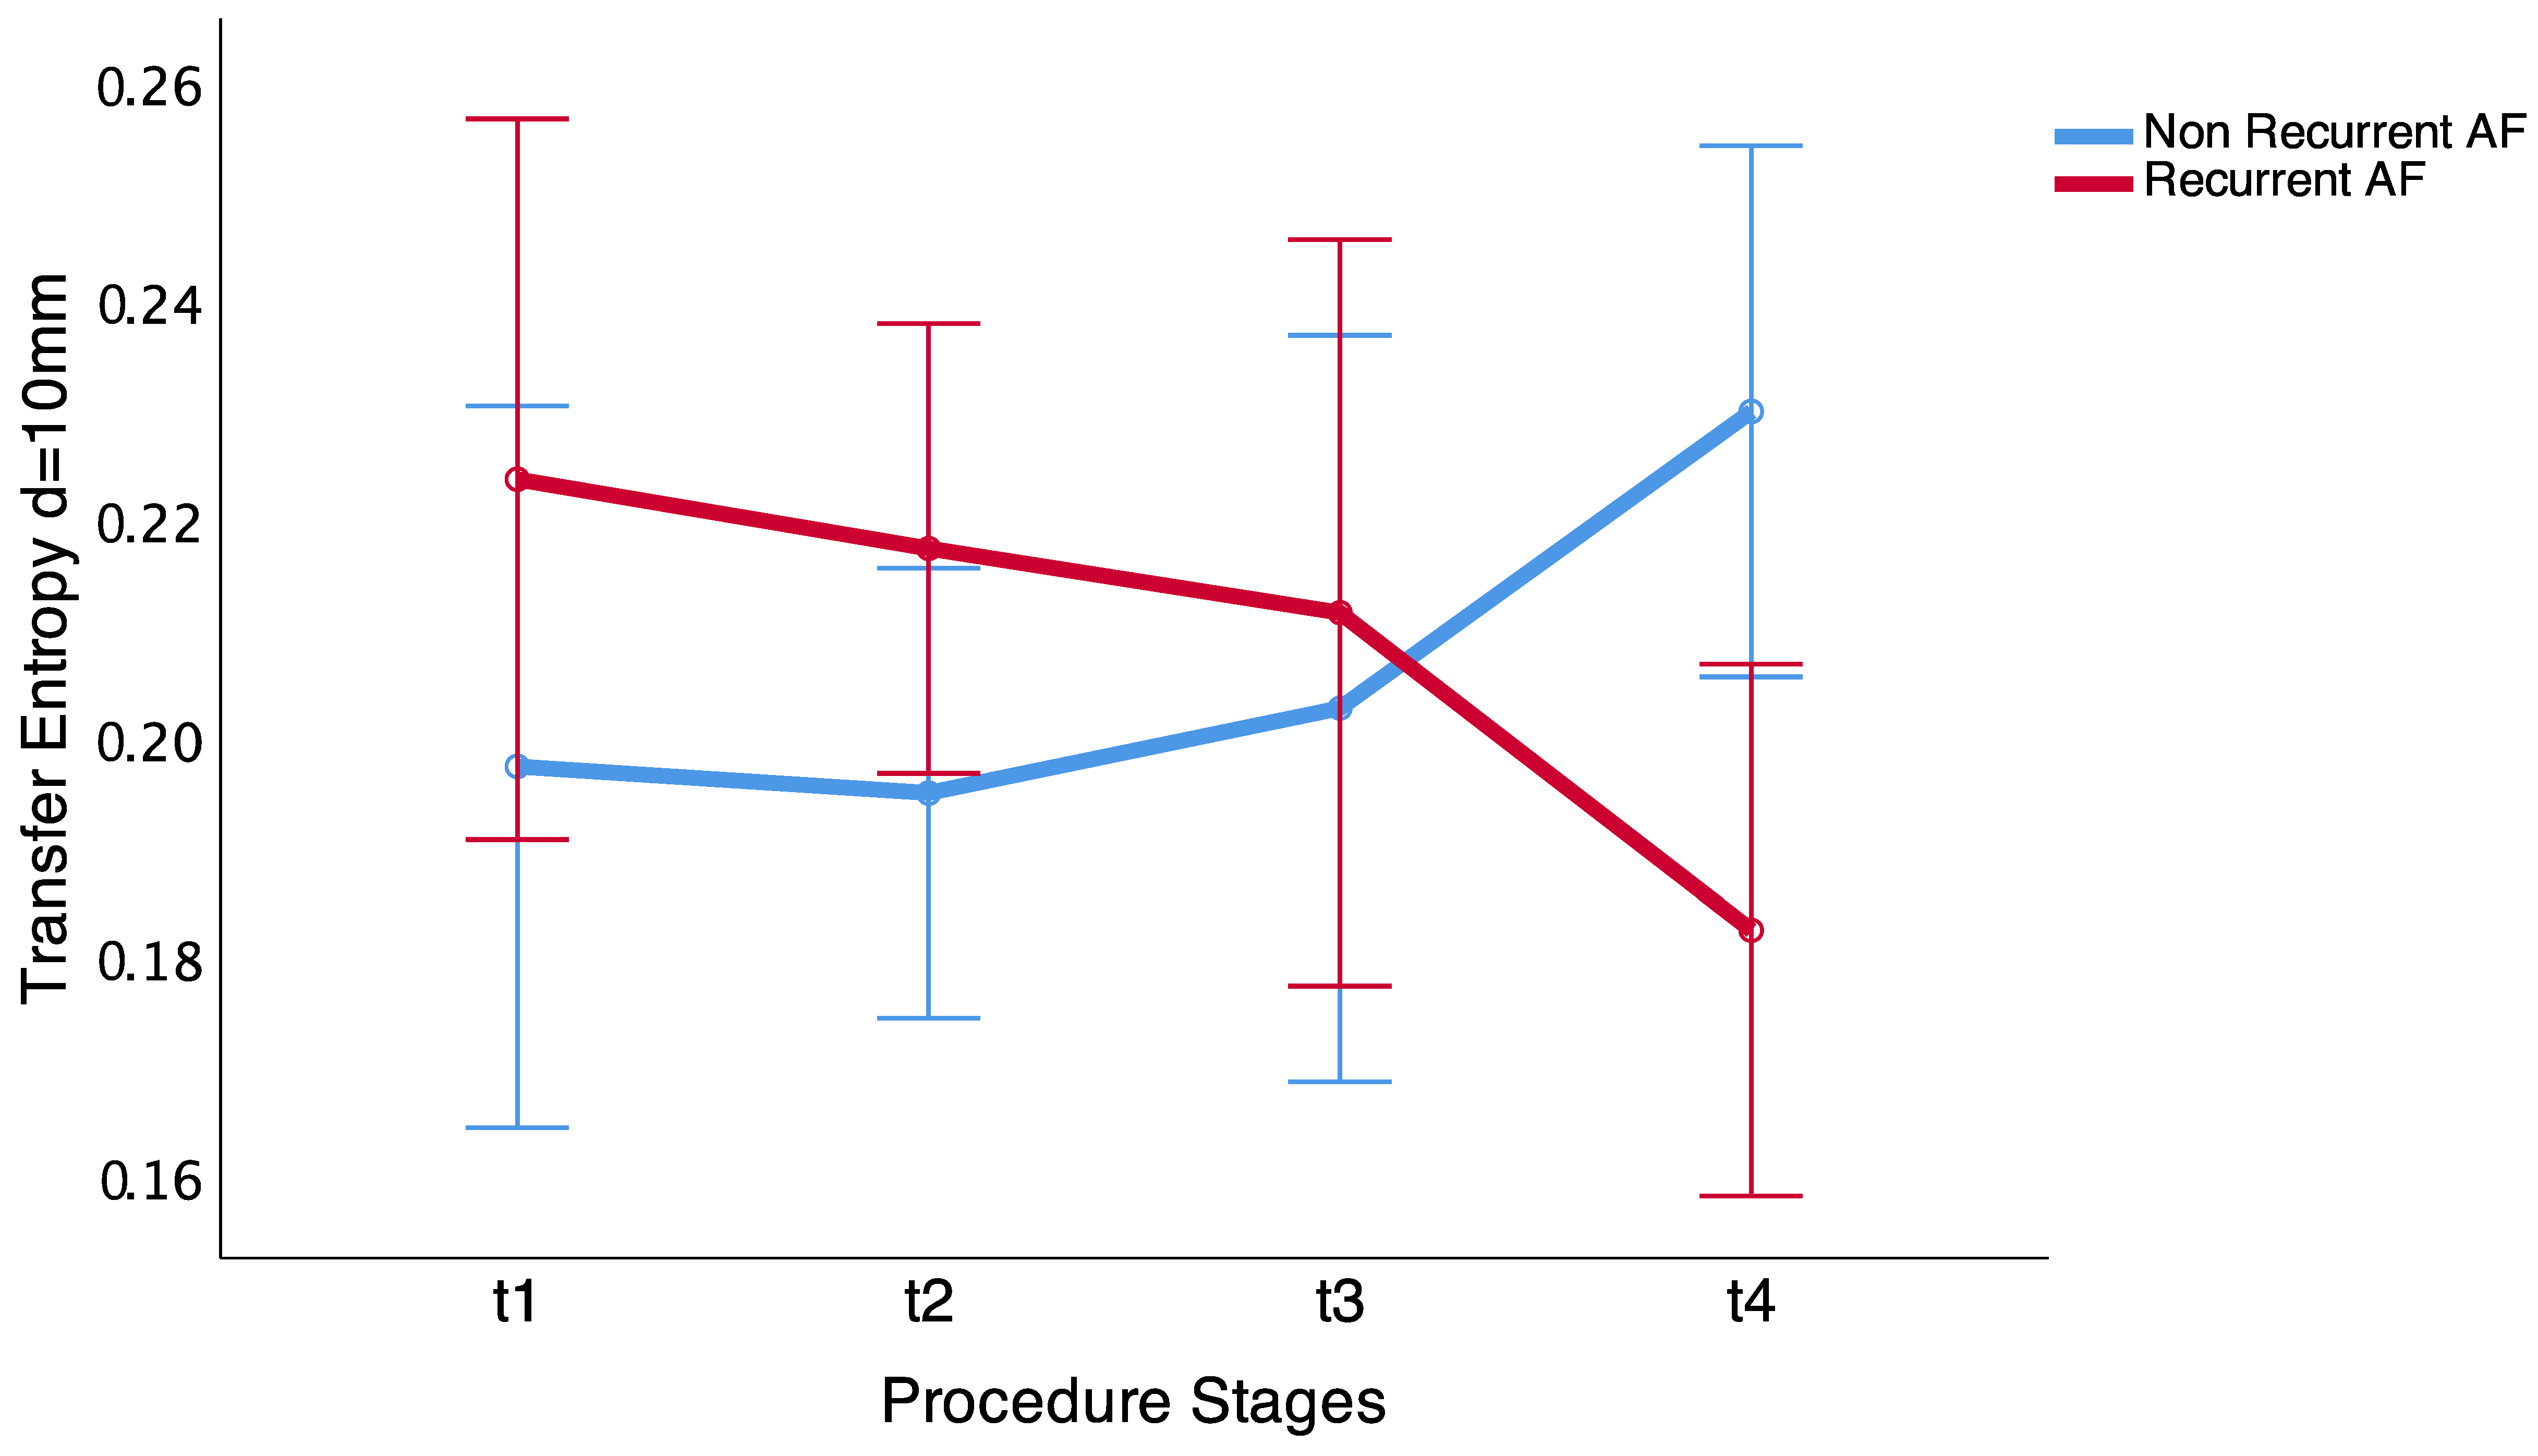
Table 5. As can be observed, they follow the same trend as correlation measurements, consistent with the results described above. Nevertheless, when the inter-dipole distance increases, TE does not show statistical significant differences between the two groups (
Table 6). In contrast, it shows a fluctuation in the information transfer between dipoles
x and
y, which may be due to the fact that electrodes are located in the same anatomical area. However, at the end of the procedure (t4 stage), TE increases in patients that maintain sinus rhythm, even for the 10 mm inter-dipole distance, with statistical significant differences (
p = 0.009)—see
Figure 8. Our results further verify the long-term correlation characteristics, suggesting an increase in transfer information. Thus, there is a similarity between wavefronts when the ablation procedure is successful long-term, whereas, in other cases, atrial activity may mainly be affected by the existence of variable fluctuations in the PV region.
5. Discussion
In our study, we found a higher correlation and information transfer in patients who maintained sinus rhythm after the ablation procedure, as well as smaller time lags between neighboring sites. These differences, which were not observable before the initiation of the ablation procedure, became more evident as more PVs were isolated. Indeed, before the ablation of the fourth PV, an accuracy of 0.814 was achieved in the discrimination between the two groups.
Pulmonary vein catheter ablation is an extensively used therapy in patients with AF. It prevents that any ectopic activation from these veins from reaching the rest of the cardiac tissue [
28,
29]. In an early study, Haissaguerre et al. found that PV was the origin for the AF in several patients, as well as that they showed that quickly firing ectopy foci in pulmonary veins triggered AF and electrical PV isolation and could terminate the arrhythmia [
30]. The ablation of the PVs is usually the first objective of the electrophysiologic intervention, and, in fact, normal sinus rhythm is successfully restored after this procedure in many patients. Nonetheless, it has a limited overall success rate and it is often necessary to carry out a new ablation procedure some months later, after patient’s follow up, which is certainly undesired for the patient, and expensive for health care systems and services. Unfortunately, it is a priori unkown whether a patient will require a second intervention or not. These limitations can be caused by our current poor understanding of the pathophysiology of the arrhythmia.
In order to define inclusion criteria for patients to be submitted to an ablation procedure, previous studies have described a number of clinical variables that were known as independent predictors of AF recurrence: non-paroxysmal AF, aging, left ventricular systolic and diastolic dysfunction, enlarged left atrium, long AF duration, the presence of non-PV triggers, obesity, or hypertension [
1,
31,
32,
33,
34]. Nevertheless, the mechanistic nature that causes and perpetuates the arrhythmia can not be assessed without an intracardiac electrophysiologic exploration. According to this, previous studies have presented quantitative analysis of the similarity between electrogram signals at two separate sites by use of the coherence spectrum or correlation [
35,
36,
37]. These strategies have drawn attention to the varying characteristics of wavefront propagation during AF and have demonstrated that the spatial extent of this organization is influenced by the atrial substrate.
Our findings show that closely spaced electrode signals were more similar and entail lower delays. This could suggest that both recording sites could be activated by the same wavefront. Nevertheless, as the distance between the recording sites increased, the activation sequences became less similar, as the two sites were less likely to be stimulated by the same wavelet. Furthermore, information flow from one dipole to another is higher in patients with no recurrences of the arrhythmia. These measures possess some important properties, such as detecting flow directions and transfer asymmetry between dipoles, so as to represent the causal relationships [
19]. At the end of the procedure, TE increases, which is not surprising as in normal sinus rhythm there is a consistent causal pattern. In addition, the evaluation of atrial activity delays, prior to starting the ablation procedure, showed differences between patients that maintain sinus rhythm and patients with long-term recurrences in the arrhythmia, with lower correlation and higher time delays in the patients that return to AF. These observations are aligned with the multiple-wavelet theory that hypothesized that the smaller number of simultaneous wavelets could favor AF spontaneously termination. We would expect that non-recurrent AF patients should be characterized by lower delays constants and higher similarity between signals that imply less simultaneous wavelets.
Study Limitations
The main limitation of the study is the small number of AF subjects included in the study. Therefore, further clinical studies are required to confirm and validate the approaches presented in this work.
6. Conclusions
To conclude, lower correlation and higher delays between PV electrical activity could prognosticate atrial fibrillation recurrences after ablation. Our results suggest that more random atrial electrical activity predicts a very high-risk of AF recurrence. These findings show that correlation measurements along PVs emerge as promising indicators of risk for AF recurrence after successful AF ablation. The fact that differences between patient groups were unveiled before the end of the intervention could open new decision-making strategies, as it may suggest the need to explore for other potential drivers throughout the atria in patients with higher probability of AF recurrence. For this, further studies would be required in order to assess the effectiveness of new procedures based on these results to increase non-recurrence rates.
Author Contributions
Conceptualization, J.M. (Javier Moreno) and J.P.-V.; Formal analysis, R.C.; Investigation, R.C. and F.C.; Methodology, R.C.; Project administration, J.M. (José Millet); Resources, J.M. (José Millet) and F.C. All authors have read and agreed to the published version of the manuscript.
Funding
This research was funded by Spanish Ministry of Research and Innovation: PID2019-109547RB-I00.
Acknowledgments
This research was supported by the PID2019-109547RB-I00 National Research Program RETOS from the Spanish Ministry of Research and Innovation and partialy by GVA (PROMETEO/2018/078) & ISCIII (CB16/11/00486). Thanks to Michael Charles Willoughby for English language and scientific editing services.
Conflicts of Interest
The authors declare no conflict of interest.
References
- Andrade, J.; Khairy, P.; Dobrev, D.; Nattel, S. The clinical profile and pathophysiology of atrial fibrillation: Relationships among clinical features, epidemiology, and mechanisms. Circ. Res. 2014, 114, 1453–1468. [Google Scholar] [CrossRef] [PubMed]
- Kim, M.H.; Johnston, S.S.; Chu, B.C.; Dalal, M.R.; Schulman, K.L. Estimation of total incremental health care costs in patients with atrial fibrillation in the United States. Circ. Cardiovasc. Qual. Outcomes 2011, 4, 313–320. [Google Scholar] [CrossRef] [PubMed] [Green Version]
- Andersson, T.; Magnuson, A.; Bryngelsson, I.L.; Frøbert, O.; Henriksson, K.M.; Edvardsson, N.; Poçi, D. All-cause mortality in 272,186 patients hospitalized with incident atrial fibrillation 1995–2008: A Swedish nationwide long-term case-control study. Eur. Heart J. 2013, 34, 1061–1067. [Google Scholar] [CrossRef] [PubMed] [Green Version]
- Chugh, S.S.; Havmoeller, R.; Narayanan, K.; Singh, D.; Rienstra, M.; Benjamin, E.J.; Gillum, R.F.; Kim, Y.H.; McAnulty, J.H., Jr.; Zheng, Z.J.; et al. Worldwide epidemiology of atrial fibrillation: A Global Burden of Disease 2010 Study. Circulation 2014, 129, 837–847. [Google Scholar] [CrossRef] [Green Version]
- Saglietto, A.; Matta, M.; Gaita, F.; Jacobs, V.; Bunch, T.J.; Anselmino, M. Stroke-independent contribution of atrial fibrillation to dementia: A meta-analysis. Open Heart 2019, 6, e000984. [Google Scholar] [CrossRef]
- Wattigney, W.A.; Mensah, G.A.; Croft, J.B. Increased atrial fibrillation mortality: United States, 1980–1998. Am. J. Epidemiol. 2002, 155, 819–826. [Google Scholar] [CrossRef]
- Krijthe, B.P.; Kunst, A.; Benjamin, E.J.; Lip, G.Y.H.; Franco, O.H.; Hofman, A.; Witteman, J.C.M.; Stricker, B.H.; Heeringa, J. Projections on the number of individuals with atrial fibrillation in the European Union, from 2000 to 2060. Eur. Heart J. 2013, 34, 2746–2751. [Google Scholar] [CrossRef] [Green Version]
- Writing Group Members; January, C.T.; Wann, L.S.; Calkins, H.; Chen, L.Y.; Cigarroa, J.E.; Cleveland, J.C., Jr.; Ellinor, P.T.; Ezekowitz, M.D.; Field, M.E.; et al. 2019 AHA/ACC/HRS focused update of the 2014 AHA/ACC/HRS guideline for the management of patients with atrial fibrillation: A Report of the American College of Cardiology/American Heart Association Task Force on Clinical Practice Guidelines and the Heart Rhythm Society. Heart Rhythm 2019, 16, e66–e93. [Google Scholar] [CrossRef] [Green Version]
- Haïssaguerre, M.; Jaïs, P.; Shah, D.C.; Takahashi, A.; Hocini, M.; Quiniou, G.; Garrigue, S.; Le Mouroux, A.; Le Métayer, P.; Clémenty, J. Spontaneous initiation of atrial fibrillation by ectopic beats originating in the pulmonary veins. N. Engl. J. Med. 1998, 339, 659–666. [Google Scholar] [CrossRef] [Green Version]
- Moe, G. On multiple wavelet hypothesis of atrial fibrillation. Archives Internationales de Pharmacodynamie et de Therapie 1962, 140, 183–188. [Google Scholar]
- Allessie, M.; Bonke, F.; Schopman, F. Circus Movement in Rabbit Atrial Muscle as a Mechanism of Tachycardia .2. Role of Nonuniform Recovery of Excitability in Occurrence of Unidirectional Block, as Studied with Multiple Microelectrodes. Circ. Res. 1976, 39, 168–177. [Google Scholar] [CrossRef] [PubMed] [Green Version]
- Kirchhof, P.; Benussi, S.; Kotecha, D.; Ahlsson, A.; Atar, D.; Casadei, B.; Castella, M.; Diener, H.C.; Heidbuchel, H.; Hendriks, J.; et al. 2016 ESC Guidelines for the management of atrial fibrillation developed in collaboration with EACTS. Europace 2016, 18, 1609–1678. [Google Scholar] [CrossRef] [PubMed]
- Calkins, H.; Kuck, K.H.; Cappato, R.; Brugada, J.; Camm, A.J.; Chen, S.A.; Crijns, H.J.G.; Damiano, R.J., Jr.; Davies, D.W.; DiMarco, J.; et al. 2012 HRS/EHRA/ECAS expert consensus statement on catheter and surgical ablation of atrial fibrillation: Recommendations for patient selection, procedural techniques, patient management and follow-up, definitions, endpoints, and research trial design: A report of the Heart Rhythm Society (HRS) Task Force on Catheter and Surgical Ablation of Atrial Fibrillation. Developed in partnership with the European Heart Rhythm Association (EHRA), a registered branch of the European Society of Cardiology (ESC) and the European Cardiac Arrhythmia Society (ECAS); and in collaboration with the American College of Cardiology (ACC), American Heart Association (AHA), the Asia Pacific Heart Rhythm Society (APHRS), and the Society of Thoracic Surgeons (STS). Endorsed by the governing bodies of the American College of Cardiology Foundation, the American Heart Association, the European Cardiac Arrhythmia Society, the European Heart Rhythm Association, the Society of Thoracic Surgeons, the Asia Pacific Heart Rhythm Society, and the Heart Rhythm Society. Heart Rhythm 2012, 9, 632–696.e21. [Google Scholar] [CrossRef] [PubMed]
- Ganesan, A.N.; Shipp, N.J.; Brooks, A.G.; Kuklik, P.; Lau, D.H.; Lim, H.S.; Sullivan, T.; Roberts-Thomson, K.C.; Sanders, P. Long-term outcomes of catheter ablation of atrial fibrillation: A systematic review and meta-analysis. J. Am. Heart Assoc. 2013, 2, e004549. [Google Scholar] [CrossRef] [Green Version]
- Pison, L.; Tilz, R.; Jalife, J.; Haïssaguerre, M. Pulmonary vein triggers, focal sources, rotors and atrial cardiomyopathy: Implications for the choice of the most effective ablation therapy. J. Intern. Med. 2016, 279, 449–456. [Google Scholar] [CrossRef]
- Kirchhof, P.; Benussi, S.; Kotecha, D.; Ahlsson, A.; Atar, D.; Casadei, B.; Castellá, M.; Diener, H.C.; Heidbuchel, H.; Hendriks, J.; et al. 2016 ESC Guidelines for the Management of Atrial Fibrillation Developed in Collaboration With EACTS. Rev. Esp. Cardiol. (Engl. Ed.) 2017, 70, 50. [Google Scholar] [CrossRef] [Green Version]
- Botteron, G.; Smith, J. A technique for measurements of the extent of spatial organization of atrial activation during atrial fibrillation in the intact human heart. IEEE Trans. Biomed. Eng. 1995, 42, 579–586. [Google Scholar] [CrossRef]
- Cervigón, R.; Moreno, J.; Millet, J.; Pérez-Villacastín, J.; Castells, F. Propofol effects on atrial fibrillation wavefront delays. IEEE Trans. Biomed. Eng. 2010, 57, 1877–1885. [Google Scholar] [CrossRef]
- Cervigón, R.; Castells, F.; Gómez-Pulido, J.; Pérez-Villacastín, J.; Moreno, J. Granger Causality and Jensen–Shannon Divergence to Determine Dominant Atrial Area in Atrial Fibrillation. Entropy 2018, 20, 57. [Google Scholar] [CrossRef] [Green Version]
- Castells, F.; Cervigón, R.; Millet, J. On the Preprocessing of Atrial Electrograms in Atrial Fibrillation: Understanding Botteron’s Approach. Pacing Clin. Electrophysiol. 2013. [Google Scholar] [CrossRef]
- Thomas, H.; Everett, I.; Kok, L.C.; Richard, H.; Vaughn, J.; Randall, M.; Haines, E. Quantitative assessment of the spatial organization of atrial fibrillation in the intact human heart. Circulation 1996, 93, 513–518. [Google Scholar]
- Wu, X.; Lu, W. Four Constructions of Asymptotically Optimal Codebooks via Additive Characters and Multiplicative Characters. Mathematics 2019, 7, 1144. [Google Scholar] [CrossRef] [Green Version]
- Wei, X.; Zhang, H.; Gong, X.; Wei, X.; Dang, C.; Zhi, T. Intrinsic Cross-Correlation Analysis of Hydro-Meteorological Data in the Loess Plateau, China. Int. J. Environ. Res. Public Health 2020, 17, 2410. [Google Scholar] [CrossRef] [PubMed] [Green Version]
- Wang, J.; Wang, L.; Xi, X.; Miran, S.M.; Xue, A. Estimation and Correlation Analysis of Lower Limb Joint Angles Based on Surface Electromyography. Electronics 2020, 9, 556. [Google Scholar] [CrossRef] [Green Version]
- Schreiber, T. Measuring information transfer. Phys. Rev. Lett. 2000, 85, 461. [Google Scholar] [CrossRef] [Green Version]
- Tehrani-Saleh, A.; Adami, C. Can Transfer Entropy Infer Information Flow in Neuronal Circuits for Cognitive Processing? Entropy 2020, 22, 385. [Google Scholar] [CrossRef] [Green Version]
- Overbey, L.; Todd, M. Dynamic system change detection using a modification of the transfer entropy. J. Sound Vib. 2009, 322, 438–453. [Google Scholar] [CrossRef]
- Calkins, H.; Reynolds, M.R.; Spector, P.; Sondhi, M.; Xu, Y.; Martin, A.; Williams, C.J.; Sledge, I. Treatment of atrial fibrillation with antiarrhythmic drugs or radiofrequency ablation: Two systematic literature reviews and meta-analyses. Circ. Arrhythm. Electrophysiol. 2009, 2, 349–361. [Google Scholar] [CrossRef] [Green Version]
- Ouyang, F.; Bänsch, D.; Ernst, S.; Schaumann, A.; Hachiya, H.; Chen, M.; Chun, J.; Falk, P.; Khanedani, A.; Antz, M.; et al. Complete isolation of left atrium surrounding the pulmonary veins: New insights from the double-Lasso technique in paroxysmal atrial fibrillation. Circulation 2004, 110, 2090–2096. [Google Scholar] [CrossRef]
- Chen, S.A.; Hsieh, M.H.; Tai, C.T.; Tsai, C.F.; Prakash, V.S.; Yu, W.C.; Hsu, T.L.; Ding, Y.A.; Chang, M.S. Initiation of atrial fibrillation by ectopic beats originating from the pulmonary veins: Electrophysiological characteristics, pharmacological responses, and effects of radiofrequency ablation. Circulation 1999, 100, 1879–1886. [Google Scholar] [CrossRef] [Green Version]
- Sotomi, Y.; Kikkawa, T.; Inoue, K.; Tanaka, K.; Toyoshima, Y.; Oka, T.; Tanaka, N.; Nozato, Y.; Orihara, Y.; Iwakura, K.; et al. Regional difference of optimal contact force to prevent acute pulmonary vein reconnection during radiofrequency catheter ablation for atrial fibrillation. J. Cardiovasc. Electrophysiol. 2014, 25, 941–947. [Google Scholar] [CrossRef]
- Balk, E.M.; Garlitski, A.C.; Alsheikh-Ali, A.A.; Terasawa, T.; Chung, M.; Ip, S. Predictors of atrial fibrillation recurrence after radiofrequency catheter ablation: A systematic review. J. Cardiovasc. Electrophysiol. 2010, 21, 1208–1216. [Google Scholar] [CrossRef]
- Ad, N.; Holmes, S.D.; Patel, J.; Je, H.G.; Shuman, D.J. The Need for Consistent Predictors of Success for Surgical Ablation of Atrial Fibrillation: A Call to Action. Innovations (Phila) 2017, 12, 421–429. [Google Scholar] [CrossRef] [PubMed]
- Njoku, A.; Kannabhiran, M.; Arora, R.; Reddy, P.; Gopinathannair, R.; Lakkireddy, D.; Dominic, P. Left atrial volume predicts atrial fibrillation recurrence after radiofrequency ablation: A meta-analysis. Europace 2018, 20, 33–42. [Google Scholar] [CrossRef] [PubMed]
- Ropella, K.M.; Sahakian, A.V.; Baerman, J.M.; Swiryn, S. The coherence spectrum. A quantitative discriminator of fibrillatory and nonfibrillatory cardiac rhythms. Circulation 1989, 80, 112–119. [Google Scholar] [CrossRef] [Green Version]
- Cervigón, R.; Moreno, J.; Sánchez, C.; Reilly, R.B.; Villacastín, J.; Millet, J.; Castells, F. Atrial fibrillation organization: Quantification of propofol effects. Med. Biol. Eng. Comput. 2009, 47, 333–341. [Google Scholar] [CrossRef] [PubMed]
- Cervigón, R.; Moreno, J.; Reilly, R.B.; Pérez-Villacastín, J.; Castells, F. Quantification of anaesthetic effects on atrial fibrillation rate by partial least-squares. Physiol. Meas. 2012, 33, 1757–1768. [Google Scholar] [CrossRef] [PubMed]
| Publisher’s Note: MDPI stays neutral with regard to jurisdictional claims in published maps and institutional affiliations. |
© 2020 by the authors. Licensee MDPI, Basel, Switzerland. This article is an open access article distributed under the terms and conditions of the Creative Commons Attribution (CC BY) license (http://creativecommons.org/licenses/by/4.0/).

 ,
, 


