Strong Influence of Baseline Respiration in an Oligotrophic Coastal Ecosystem
 Kevin Vikström
 Ines Bartl
 Jan Karlsson1
  Johan Wikner
- 1Department of Ecology and Environmental Science, Umeå University, Umeå, Sweden
- 2School of Environmental Sciences, University of East Anglia, Norwich, United Kingdom
- 3Leibniz Institute for Baltic Sea Research Warnemünde, Rostock, Germany
- 4Umeå Marine Sciences Center, Umeå University, Hörnefors, Sweden
Respiration is a key metabolic process in the marine environment and contemporary phytoplankton production (PhP) is commonly assumed the main driver. However, respiration in the absence of contemporary PhP, termed baseline respiration, can influence the energetics of an ecosystem and its sensitivity to hypoxia. Direct studies of baseline respiration are currently lacking. This study aims to obtain a first estimate of baseline respiration in a sub-arctic estuary and determine its contribution to plankton community respiration. Three approaches used to define baseline respiration determined the average rate to be 4.1 ± 0.1 (SE) mmol O2 m–3 d–1. A hypsographic model at the basin scale accounting for seasonal variation estimated an annual contribution of 30% baseline respiration to planktonic respiration. There was no correlation between plankton respiration and PhP, but a significant linear dependence was found with the total carbon supply from phytoplankton and riverine input. The sum of dissolved organic carbon transported by rivers, provided by both benthic and pelagic algae, could sustain 69% of the annual plankton respiration, of which as much as 25% occurred during winter. However, only 32% of the winter season respiration was explained, indicating that unknown carbon sources exist during the winter. Nitrification had a negligible (≤2.4%) effect on baseline respiration in the system. The results show that baseline respiration accounted for a significant percentage of coastal plankton respiration when allochthonous sources dominated the carbon supply, weakening the respiration-to- PhP relationship.
Introduction
The presence of sufficient oxygen is essential for maintaining healthy aquatic ecosystems. The availability of oxygen is largely set by the balance between primary production and respiration, solubility of oxygen and its transport with water currents (Oschlies et al., 2018). Increasing our understanding of this balance is crucial for improving estimations of CO2 exchange between aquatic systems and the atmosphere as well as for improving sustainable management of marine environments, especially in light of continuous climate change, eutrophication, and increasing hypoxia worldwide (Cubasch et al., 2001; Diaz and Rosenberg, 2008; Conley et al., 2011). Respiration rates in marine carbon cycle models are typically assumed to depend on the supply of organic carbon from primary producers, temperature, and oxygen concentration (e.g., Robinson, 2008; Bendtsen and Hansen, 2013; Du and Shen, 2015). However, the strength of this relationship in different types of aquatic environments subject to management is still unclear (del Giorgio and Williams, 2005).
Respiration in lakes and rivers can be supported both by autochthonous carbon derived from primary production, and allochthonous carbon from terrestrial sources (del Giorgio et al., 1999; Prairie et al., 2002; Karlsson et al., 2007; McCallister and del Giorgio, 2008). This is also the case in estuaries where allochthonous carbon inputs from rivers can support respiration and bacterial production, decoupling respiration from autochthonous primary production (Preen and Kirchman, 2004; Sandberg et al., 2004). Results from a global compilation of respiration and primary production estimates show a direct relationship between respiration and primary production (based on a log–log scale, Duarte and Agustí, 1998). In addition, a study of Chesapeake Bay shows that respiration is predominately supported by phytoplankton generated organic carbon, with only minor contribution of allochthonous carbon (Smith and Kemp, 2001). Both studies are markedly influenced by environments with high primary production rates (the former also benthic production rates). However, neither of them resolve the relationship at low values in oligotrophic water bodies, which are common in many marine environments where pelagic production dominates (Table 1).
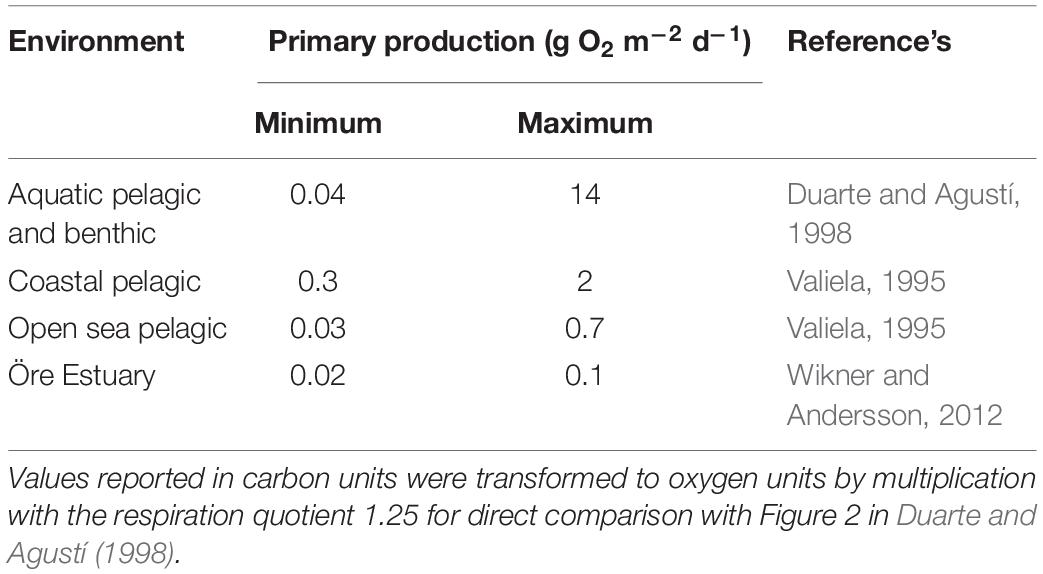
Table 1. Comparison of the range of primary production in the studied oligotrophic estuary, the data set of Duarte and Agustí (1998) and other global compilations from dominant marine environments.
Baseline respiration (Rbl) is the respiration driven by carbon sources other than contemporary primary production. It is defined as “steady consumption of organic matter that is relatively independent of the contemporary primary production” (del Giorgio and Williams, 2005). However, the time scale of the cited “contemporary primary production” is not defined. A tentative scale for contemporary may be constrained within the typical period for respiration measurements of 24 h mainly due to methodological reasons. The carbon that sustains Rbl can thus be old autochthonous carbon (more than a day), including recycled biomass, as well as allochthonous carbon at any time scale, according to the current definition.
Growth-related respiration and maintenance respiration are both integral parts of Rbl and are influenced by carbon supply and temperature (Pirt, 1982; Robinson, 2000; Hopkinson and Smith, 2005; Apple et al., 2006; Vikström and Wikner, 2018). The growth-related portion of Rbl is different from other growth-related respiration by its dependence on non-contemporary primary production or allochthonous carbon. Bacterial and protozoan respiration are major contributors to aquatic oxygen consumption and are expected to markedly contribute to Rbl (Robinson and Williams, 2005). A recent estimate showed that bacterial maintenance contributed 58% to the annual bacterial respiration in an estuary, which could be a significant part of Rbl (Vikström and Wikner, 2018). Protozoa and mesozooplankton can contribute to Rbl by maintenance respiration, but also growth-related respiration when based on allochthonous carbon.
On a theoretical level, Rbl is important for ecosystem sensitivity to eutrophication as it maintains a continuous oxygen consumption throughout the year. Thus, a relatively high Rbl implies an increased risk of hypoxia even at moderate levels of eutrophication by further increasing respiration of contemporary and, to some extent, non-contemporary carbon sources. On the other hand, there is also a risk that a reduction in nutrient inputs to an ecosystem with significant Rbl, have a limited effect on oxygen consumption due to a high amount of latent carbon. Latent is referring to allochthonous and non-contemporary autochthonous carbon. Therefore, it is important to determine the Rbl rate and contribution in an ecosystem and defining the response model for respiration at different carbon productivity levels.
The microbial process of nitrification yields energy from the oxidation of ammonium to nitrite and of nitrite to nitrate consuming O2, and simultaneously CO2 as an inorganic carbon source (Ward, 2008). The process consumes oxygen decoupled from primary production and can contribute to Rbl. Using Redfield stoichiometry, previous studies estimated the contribution of nitrification to community respiration to be 1−58% (Lipschultz et al., 1986; Berounsky and Nixon, 1993; Grundle and Juniper, 2011; Hsiao et al., 2014). To our knowledge, no such estimates exist for its contribution to Rbl.
The Rbl rate for the marine environment is currently unknown. To estimate Rbl in a water body, one may use the winter season in the temperate climate zone, as pelagic photosynthesis would be close to zero, especially if ice cover is present (Andersson et al., 1996). However, Rbl probably occurs during other seasons and can then be challenging to determine, as it becomes more difficult to distinguish contemporary primary production from older carbon pools. Environments without net primary production, such as deep aphotic water, would be consistent with the current definition for Rbl. However, this requires the application of a reasonable time frame for defining sedimentation of contemporary phytoplankton carbon production. In addition, Rbl may vary over seasons as the relative distribution of carbon between contemporary and latent sources varies seasonally or even annually.
In this study, we analyze a 3-year data set of plankton respiration (Rp) as well as potential factors influencing Rp such as phytoplankton production (PhP), dissolved organic carbon (DOC), nitrification, riverine inflow, and total organic carbon (TOC) encompassing a full annual cycle in a sub-arctic estuary. Our main objectives were to investigate the Rbl rate and the annual contribution of Rbl to Rp. Additionally, we investigate if riverine organic carbon can account for Rbl during winter and if oxygen consumption via nitrification represent a significant part of Rbl. We discuss the results in the context of ecosystem sensitivity to eutrophication, the development of hypoxia and the potential of nutrient reduction to counteract this environmental status.
Materials and Methods
Study Area and Sampling
Water samples were collected from two stations in the Öre estuary located in the northern part of the Baltic Sea. The estuary has a mean depth of 10 m, a maximum depth of 35 m, and an area of approximately 71 km2 (SMHI, 2003). The average salinity over the years studied was 4.3, ranging from 2.5 to 5.9 depending on river inflow. The oligotrophic and heterotrophic estuary is phosphorus limited (Zweifel et al., 1995). The estuary is also influenced by allochthonous carbon inputs via the humic-rich Öre River (average DOC concentration 948 μmol dm–3), with a mean discharge of 36 m3 s–1 forming a river plume that is 2–3 m deep during the spring flood, while the estuary is otherwise well mixed most of the year (Forsgren and Jansson, 1993). The water residence time is approximately 10 days, which is calculated using sea level changes, local wind speed, the density profile at the border of the estuary, and river discharge (Engqvist, 1993; SMHI, 2003). Sampling was conducted in conjunction with national marine monitoring survey, alternating the samplings between the two monitoring stations B3 (N63° 29.98 E19° 49.14, WGS84) and B7 (N63° 31.50 E19° 48.49, WGS84) from 2014 to 2016 (Figure 1). The sampling frequency of the estuary was 16–18 year–1 during the study period. Four depths (1, 5, 15, and 20 m) were sampled for Rp during each sampling event, and additional variables such as bacterial, phytoplankton, and zooplankton abundance, DOC in the pelagic, photosynthetically active radiation (PAR) and CTD data were extracted from the national monitoring survey data set for the relevant depths.
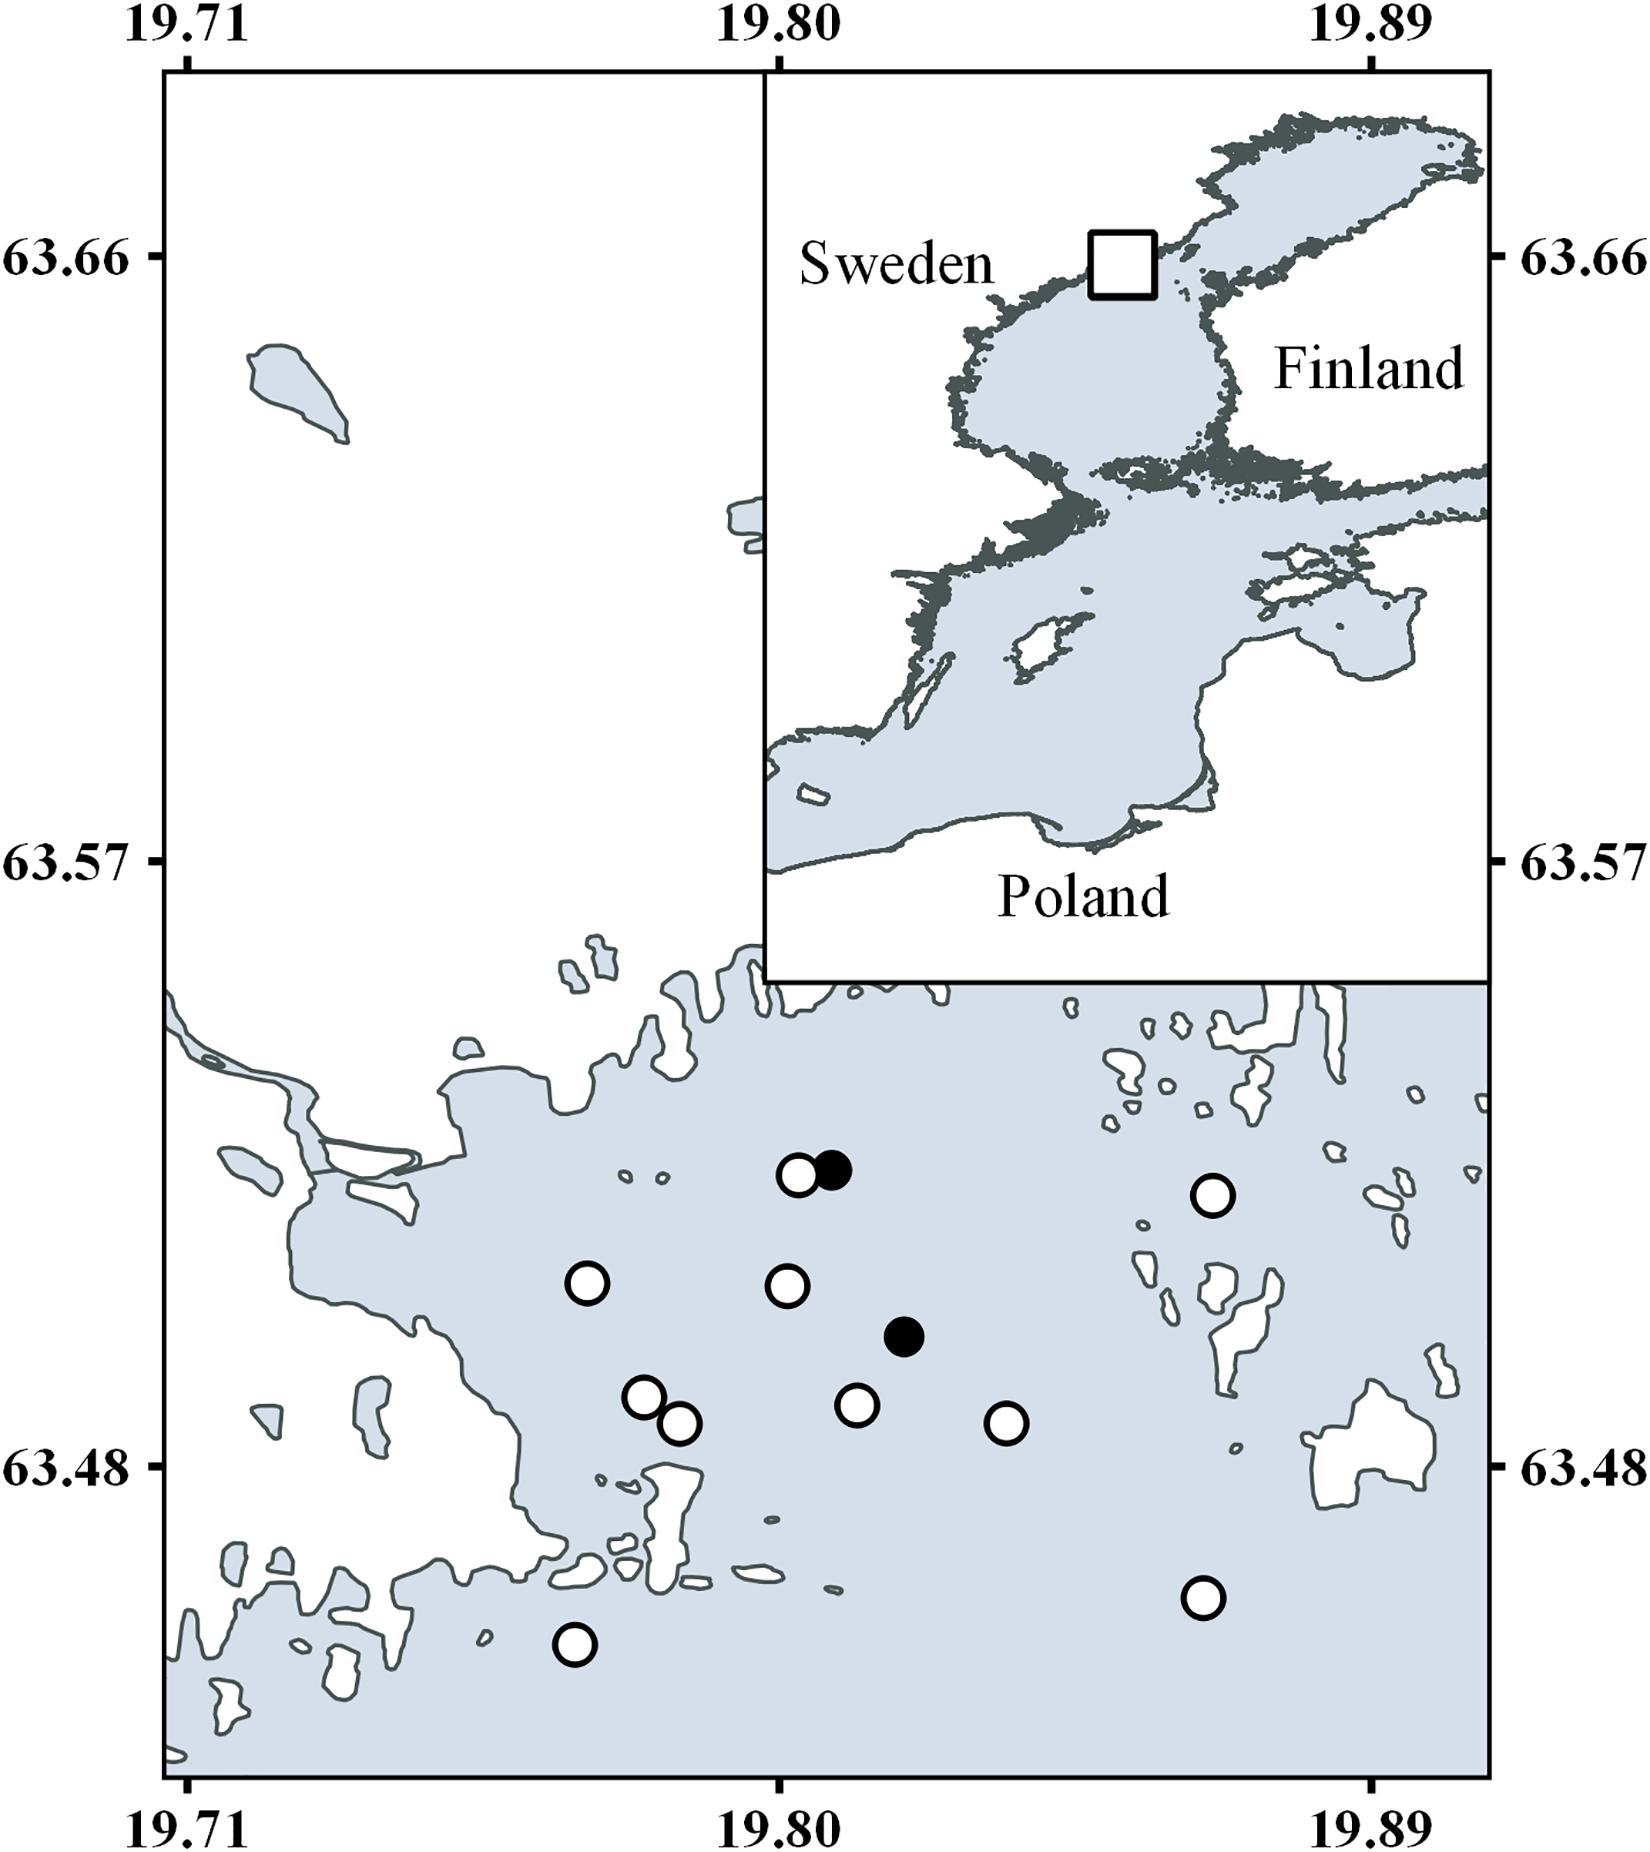
Figure 1. Map of the Öre estuary and sampling stations. Filled circles show the environmental monitoring stations B7 and B3 used for the majority of measurements. Open circles show the stations for the nitrification measurements. The insert show an overview of the Baltic Sea.
Hydrography
Hydrography was analyzed according to accredited standard operating procedures recommended by the Helsinki Commission Combine Guidelines1. Briefly, conductivity, temperature, and depth (i.e., CTD, Seabird SBE 19plus, Seabird Electronics) data collection and PAR-light (LI 193, LI-COR biosciences) were sampled at each station. The data are publicly available in the national monitoring database (SMHI, 2016) and the database dBotnia managed by Umeå Marine Sciences Center (dBotnia, 2016).
Dissolved Organic Carbon
In the marine environment, DOC was measured after 0.2 μm filtration and the expunging of volatile compounds in HCl-acidified samples (Suzuki et al., 1992; Norrman, 1993). The DOC concentration was measured with non-dispersive infrared (NDIR) detection and a TOC-L instrument (Shimadzu Corporation, Kyoto, Japan). Riverine inflow rates and corresponding TOC rates were retrieved and used to calculate riverine TOC inflow (RTOC) from the Swedish Agricultural University database (SLU, 2017).
Plankton Respiration
Dark incubation respiration measurements were conducted using the OPTOCS method with Aanderaa 4330 oxygen OptodesTM with titanium housing (Vikström et al., 2018). Glass bottles with a volume of 1 dm3 were carefully filled with sample water, sealed by specially designed stoppers with attached optodes, and incubated at in situ temperatures in the dark using thermostat-controlled water baths (±0.1°C, Julabo ED, Julabo 13) equipped with an immersion cooler (Julabo FT 200). The decrease in oxygen concentration was measured with a sampling rate of 1 min–1 over 24 h. Non-linear time series were derived at 1 h from the start of the incubation (3 h from sampling) to obtain rates close to the natural environment (see Vikström et al., 2018). The detection limit for this method was 0.97 mmol O2 m–3 d–1 for individual optode measurements.
Nitrification
Samples for nitrification rates were taken in April 2015 and August 2015 at stations spanning from the river mouth of the Öre River into the Öre estuary (Figure 1). Nitrification rates from the aphotic bottom water were determined using the 15N-NH4+ tracer incubation method (described in detail by Bartl et al., 2019) and were converted to oxygen consumption by applying a stoichiometric ratio of 2 mol oxygen consumed per 1 mol nitrogen oxidized from ammonium to nitrate (Eqs 4 and 5).
Phytoplankton Production and 14C Incorporation Detection Limit
Phytoplankton production was measured by H14CO3– uptake according to the Helcom COMBINE guidelines, following an international method comparison (Richardson, 1991) and validation of the incubator method by Riegman et al. (1990). Briefly, samples from the mixed phototrophic layer were collected with a 10 m hose (inner ø 25 mm, Lindahl, 1986) at stations B3 and B7, gently distributed by gravity force to a black polyethylene container and then distributed to 11 cell-culture flasks (50 cm–3) with varying light shading (0–100%, Hydro-biosTM). NaH14CO3 (DHI Water & Environment) with a specific activity of 2.1 mCi mmol–1 was added (64 mm–3), and the samples were incubated for 3 h at 625 μE m–2 s–1 maximum internal flask light intensity (LiCor TL33 sensor, 100% transmittance flask) and in situ temperature. Incubations were stopped by putting samples in a dark box and adding HCl (300 mm–3, 5 mol dm–3). Excess 14CO2 was expunged by evaporation 30 min before measuring disintegrations per minute (dpm) using a calibrated and quench-corrected liquid scintillation analyzer TriCarb 2910TR (Perkin-Elmer, Singapore). The uptake of CO2 was calculated from fixed 14CO2 in the whole water and the concentration of CO2 in situ according to Andersson et al. (1996). The CO2 uptake as a function of light irradiance (PAR) in the flasks was fitted to a hyperbolic tangent function to calculate the photosynthetic maximum (Pmax, μmol C dm–3 h–1) and the maximum light utilization coefficient [αP/I, μmol C dm–3 h–1 (μE m–2 s–1)–1] (Jassby and Platt, 1976). The in situ uptake of CO2 (PCO2, μmol C dm–3 h–1) was calculated at each depth and hour using Eq. 3, using the obtained coefficients and PAR-irradiance at each depth (Iz, Beer’s law, reflectance coefficient 0.82).
Equation 3 thus estimates CO2 fixation on a volumetric dimension. Integrating the rates for each hour over 24 h gives the daily rate for each depth. By further integrating the daily rate at each depth over the whole water column, the daily rate per m2 is given. The incubator method is within 5% of the estimates based on incubating samples on a rope in situ (Riegman and Colijn, 1991).
We have not found a published detection limit for the 14C incorporation method. Therefore, the detection limit for the 14C method was derived as the median of the extended uncertainty (Sokal and Rohlf, 2012) according to Eq. 4, using the standard error of αP/I (SEαP/I), Pmax (SEPmax), Iz (SEIz, i.e., extinction coefficient), coefficient of variation for global irradiation (CVIG) and scintillation counter (CVdpm). These factors were assumed to be the major contributors to the measurement uncertainty, and resulted in a detection limit of 0.1 mmol m–3 d–1.
Estimating Baseline Respiration
We used seasons according to the meteorological definitions for northern Sweden. Winter was the period between November to March, spring between April to May, summer between June to August and autumn the period between September to October. To apply the Rbl concept, we defined contemporary primary production as PhP measured on the same day as Rp, a similar time scale as used by Carvalho et al. (2017). The Rbl rate was estimated by using different approaches to determine when PhP was negligible (i.e., below the detection limit), and thus, Rp ≈ Rbl according to the definition by del Giorgio and Williams (2005).
In the first approach (1) Rbl was determined as the median Rp during the winter season, showing negligible PhP, in accordance to the current concept. In this approach Rbl was assumed to remain constant over the whole year. The second approach (2) used the 14C method detection limit over all seasons to determine when PhP was negligible. Rbl was then determined as the median Rp in all the samples below the 14C detection limit, including the whole water column. The third approach (3) used the compensation depth (Izc), defined as 1% of the incoming light in the surface water (Iz0), as a methodologically independent criterion to constrain Rbl (Valiela, 1995). Photosynthetically active radiation (PAR) profiles with depth (binning by 0.1 m) at both stations were used to calculate the depth of the 1% light level for each month (except December, as the low light level did not allow for this analysis). The PAR light at 0.3 m was used as Iz0 light to ensure that the light sensor was fully submerged even during harsh weather conditions. The median Rp rate below the calculated compensation depth again defined Rbl (Table 2). A fourth approach (4) used a regression analysis between Rp and PhP on the 3-year data set as an independent variable, defining Rp at the detection level for PhP as Rbl. We applied a model II regression with a major axis as loss function to derive the coefficients. Due to a weak correlation with PhP, we assessed the approach as uncertain, and not used for further analysis. We would like to note that approach 2 and 3 account for seasonal variability in Rbl when present.
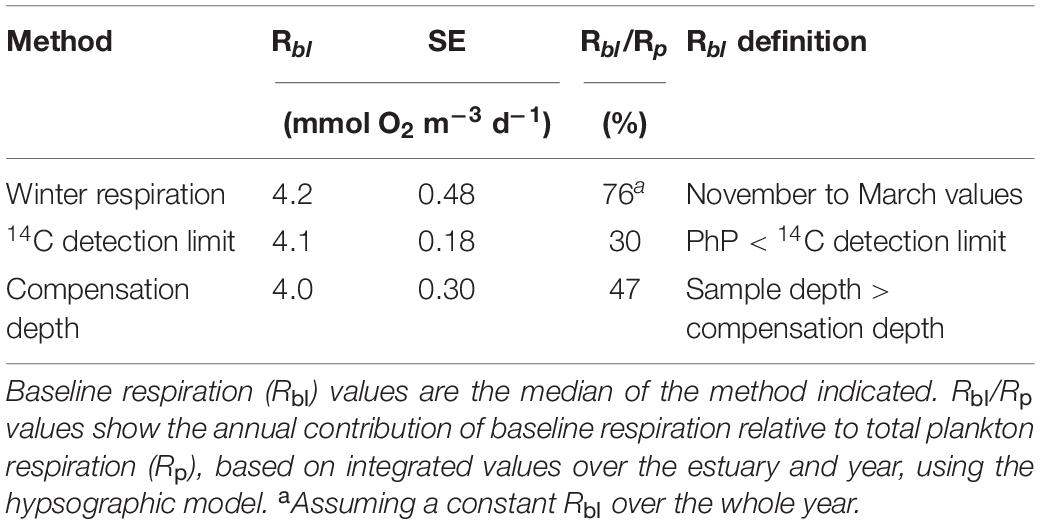
Table 2. The rate of baseline respiration using different approaches for its estimation.
Annual Contribution of Baseline Respiration to Pelagic Respiration
To estimate the contribution of Rbl to Rp at the water body and annual scales, we applied a model based on a hypsographic map over the estuary accounting for variability in Rp and PhP over both seasons and depth. Here, basin values for PhP, RTOC load, and estuarine DOC, as well as Rbl (according to each approach) and Rp, were calculated by trapezoidal integration over depth for each sampling time and the sum of all grids in the basin. Integration of each variable over time formed a seasonal or annual basin estimate. Subsequently, the estimation of the relative contribution of Rbl to Rp was derived from these values. RTOC, DOC, and PhP were used to estimate to what extent these measured carbon sources supplied the observed respiration rates with carbon (see section “Carbon Supply of Baseline Respiration”).
The hypsographic map was formed by using bathymetrical depth measurement data from the Swedish Geological Survey (SGU), which were converted into line shapes using ArcGIS (Environmental Systems Research Institute). These line shapes were converted to polygons that included the depth attributes measured. A three-dimensional hypsographic map was formed by applying the geoprocessing tool in ArcGIS using the triangulated irregular network (TIN) conversion with a scaling of 0.3 m × 0.3 m. The estuary was divided into a fishnet grid (n = 283; 500 m × 500 m squares, ∼71 km2 total estuary area) overlaying the hypsographic raster map, referred to as a depth grid. The median bottom depth within each square, calculated in QGIS (Open Source Geographical Information System), was the maximum depth used for the trapezoidal integration of the variables. The calculation steps described above were performed using Python (X, Y) with the Scipy, Numpy, and Pandas modules installed (Van Rossum, 1995). The different approaches defined above resulted in an annual estimate of Rbl at the basin scale.
Carbon Supply of Baseline Respiration
We compiled the carbon sources measured and literature values to test whether the estimated Rp, and thus Rbl, rate was plausible. The RTOC load was calculated as the concentration of RTOC multiplied by the river flow rate and was assumed to mix homogenously throughout the estuary within each season and year. The RTOC concentration discharged divided by the total volume (7.7 × 10⁸ m3) of the estuary represented the volumetric load of allochthonous carbon, and divided by area (7.1 × 10⁷ m2) represented the area specific RTOC flux. Flocculation was not accounted for, as earlier studies have shown that flocculation is a minor loss process in the Öre estuary (Forsgren and Jansson, 1993; Sandberg et al., 2004). For benthic littoral primary production, spring, and summer values in Ask et al. (2016) were used and scaled up to the whole estuary, assuming that 50% of this production eventually ends up in the pelagic zone. Finally, all carbon sources were summed to estimate the carbon availability (CAv). Eighty-five percent of the RTOC load was assumed to be bioavailable based on estimates from the literature (Bertilsson et al., 1999; Sandberg et al., 2004; Aarnos et al., 2012). Eighty percent of the carbon from PhP was further assumed to supply Rp on the timescale of seasons and years, while the remaining fraction was buried in sediments or transported off-shore (cf. Sandberg et al., 2004)
Results
Production, Respiration and Compensation Depth in the Ecosystem
The Rp and PhP time series were not normally distributed, and non-parametric tests were therefore applied (Kolmogorov–Smirnov test, p < 0.01). The rates of both Rp and PhP did not differ between the two stations (Mann–Whitney U test, p > 0.05). Therefore, the stations were averaged and assumed to be representative of the whole estuary in further analyses. However, the rates of both Rp and PhP differed between seasons (Mann–Whitney U test p < 0.01).
Phytoplankton production was at an average of 0.9 mmol C m–3 d–1 throughout the 3 years and a maximum of 10.9 mmol C m–3 d–1. Rp exceeded PhP throughout the 3-year period except in 3% of the total samples, assuming a respiration quotient (RQ) of 1 (Figure 2). Rp increased from the initiation of the spring bloom in late April to early May, with a range of 6–11 mmol O2 m–3 d–1. Both Rp and PhP peaked during the spring season in the surface layer (7.7 mmol O2 m–3 –1 and 2.9 mmol C m–3 d–1, respectively). PhP was higher in the autumn than in the winter (Mann–Whitney U test, p < 0.01) when values were below the detection limit (Figures 2, 3).
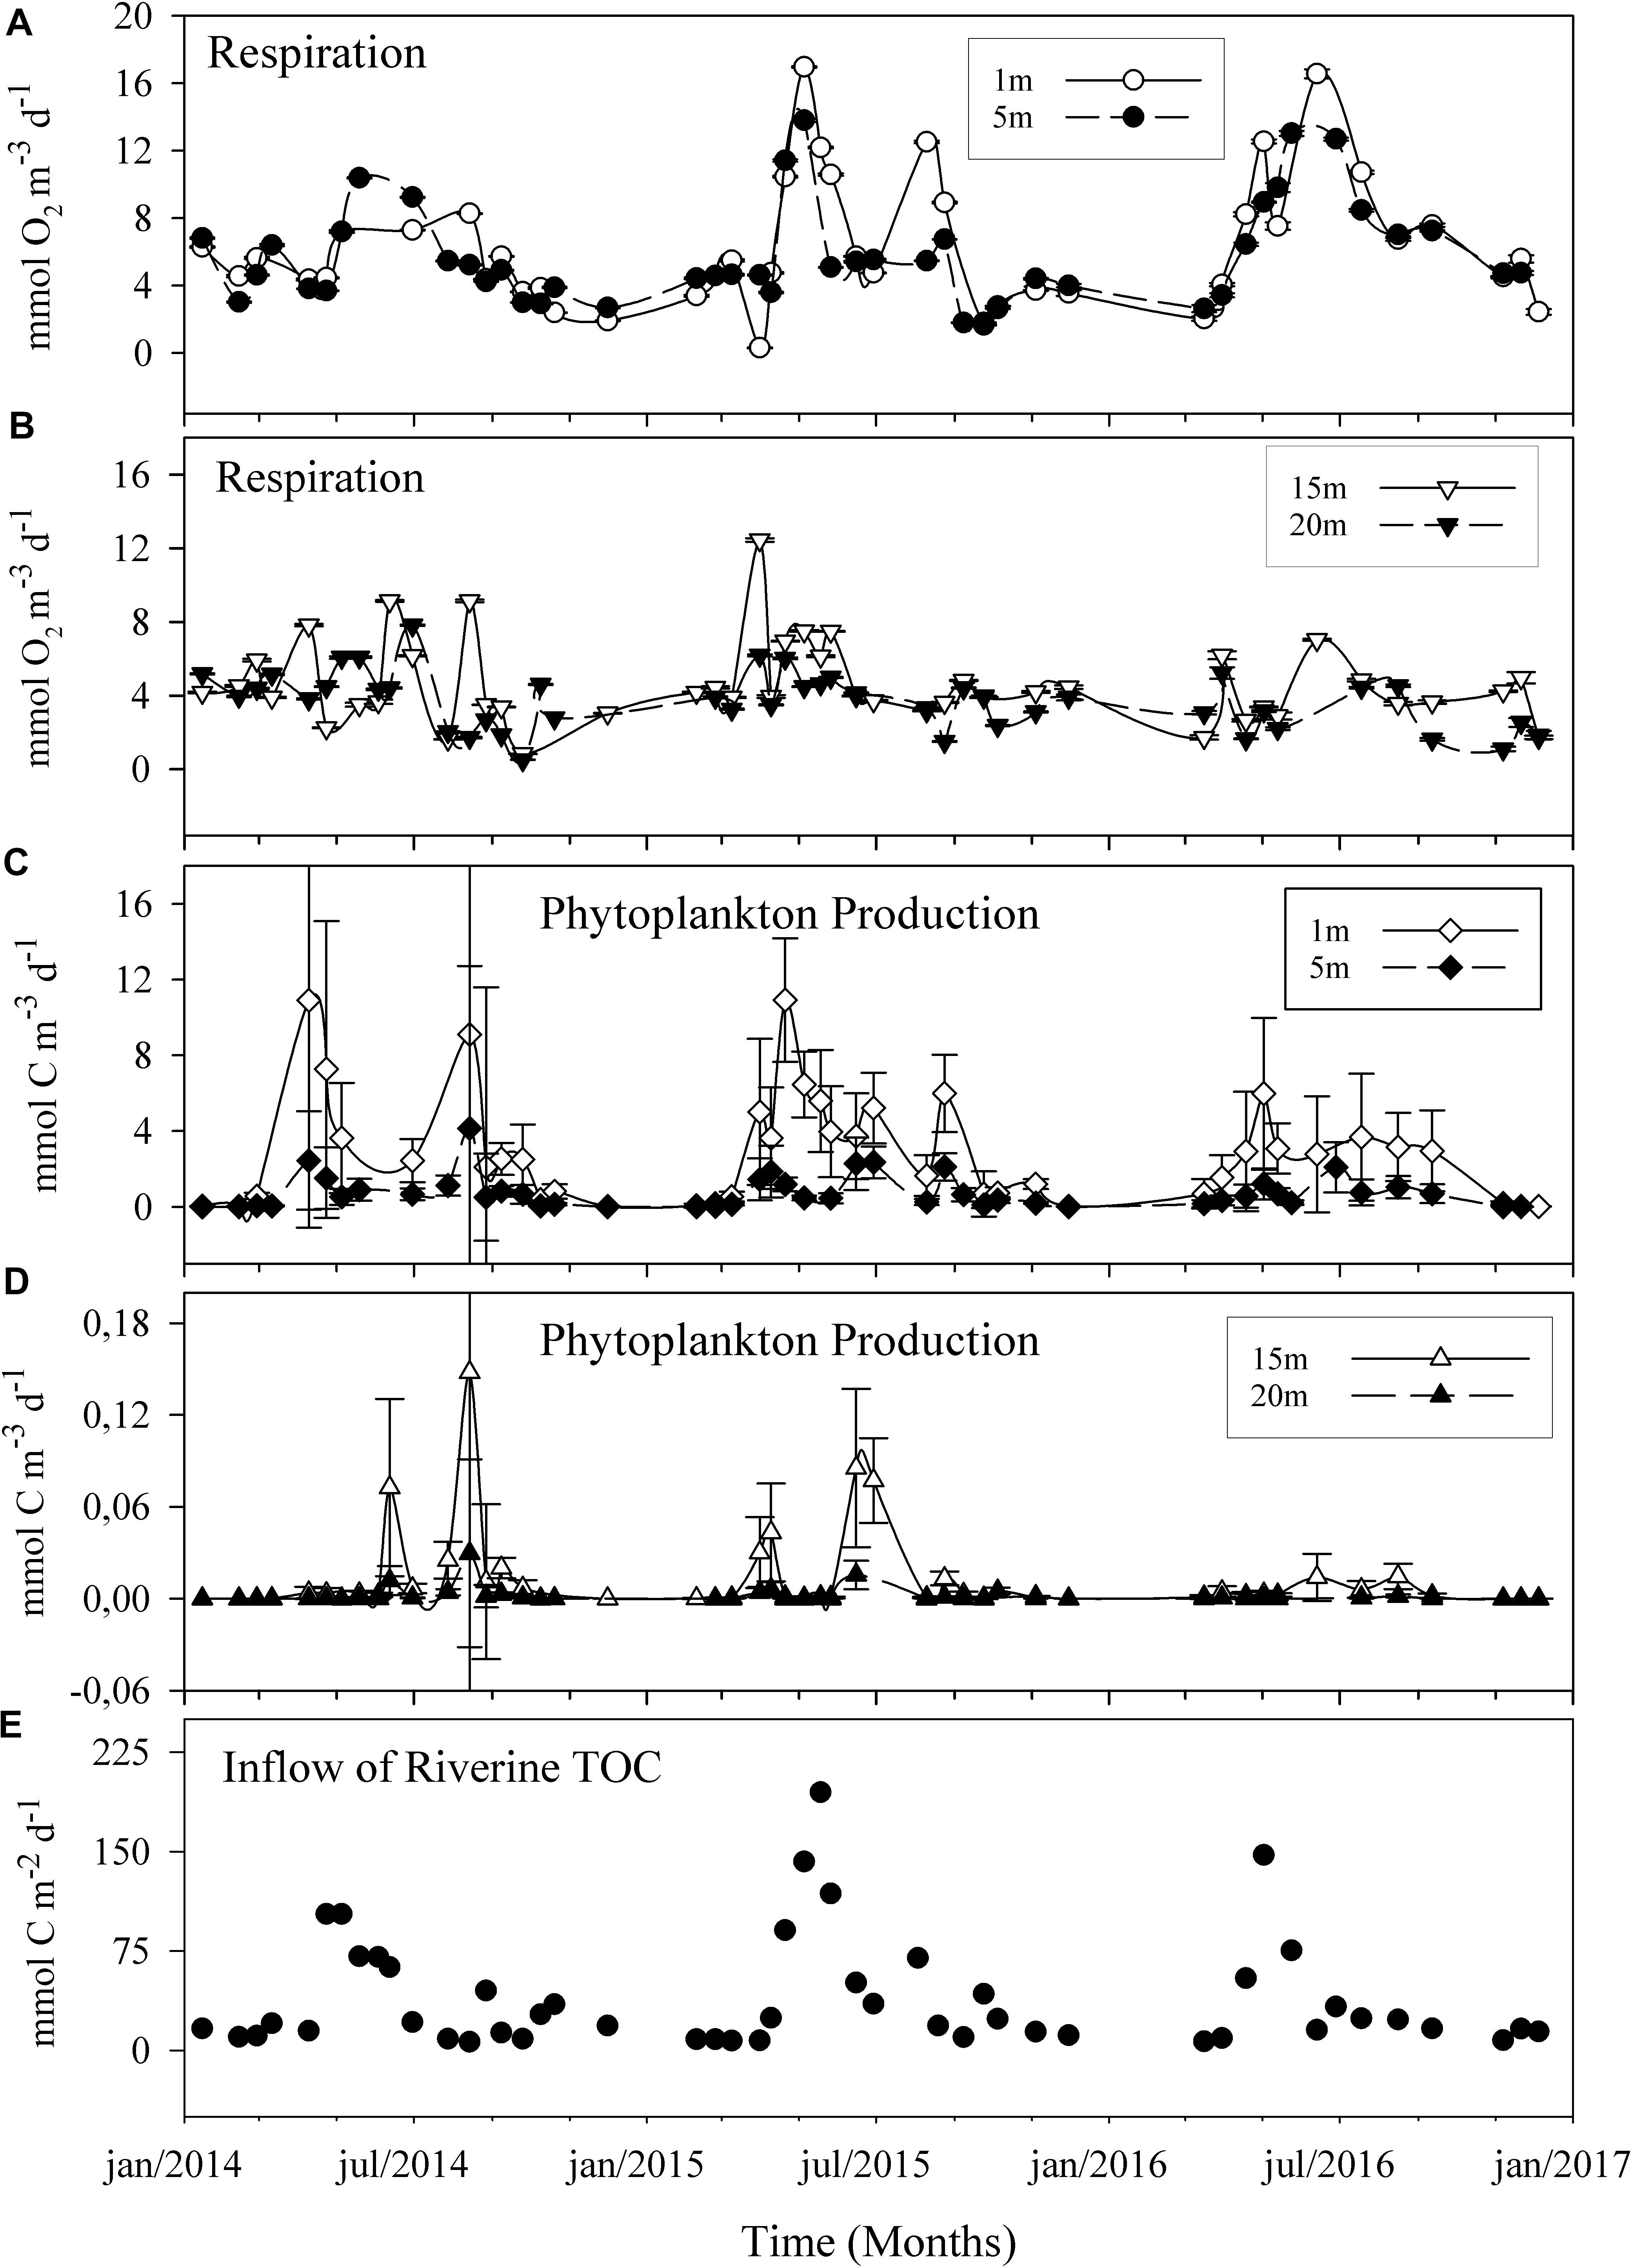
Figure 2. Three-year time series of plankton respiration (A,B) and phytoplankton production (C,D) in the sub-arctic Öre estuary. Panels show the results for surface water (≤5 m, A,C) and deep water (≥15 m, B,D). Error bars show the analytical precision as 95% confidence limits (R) and 2 × SE (PhP), respectively. Error bars are smaller than the symbol where not visible. The lowest panel shows the inflow of total organic carbon from the Öre River (E). Note the different scales for phytoplankton production >15 m. Lines are based on a spline smoother.
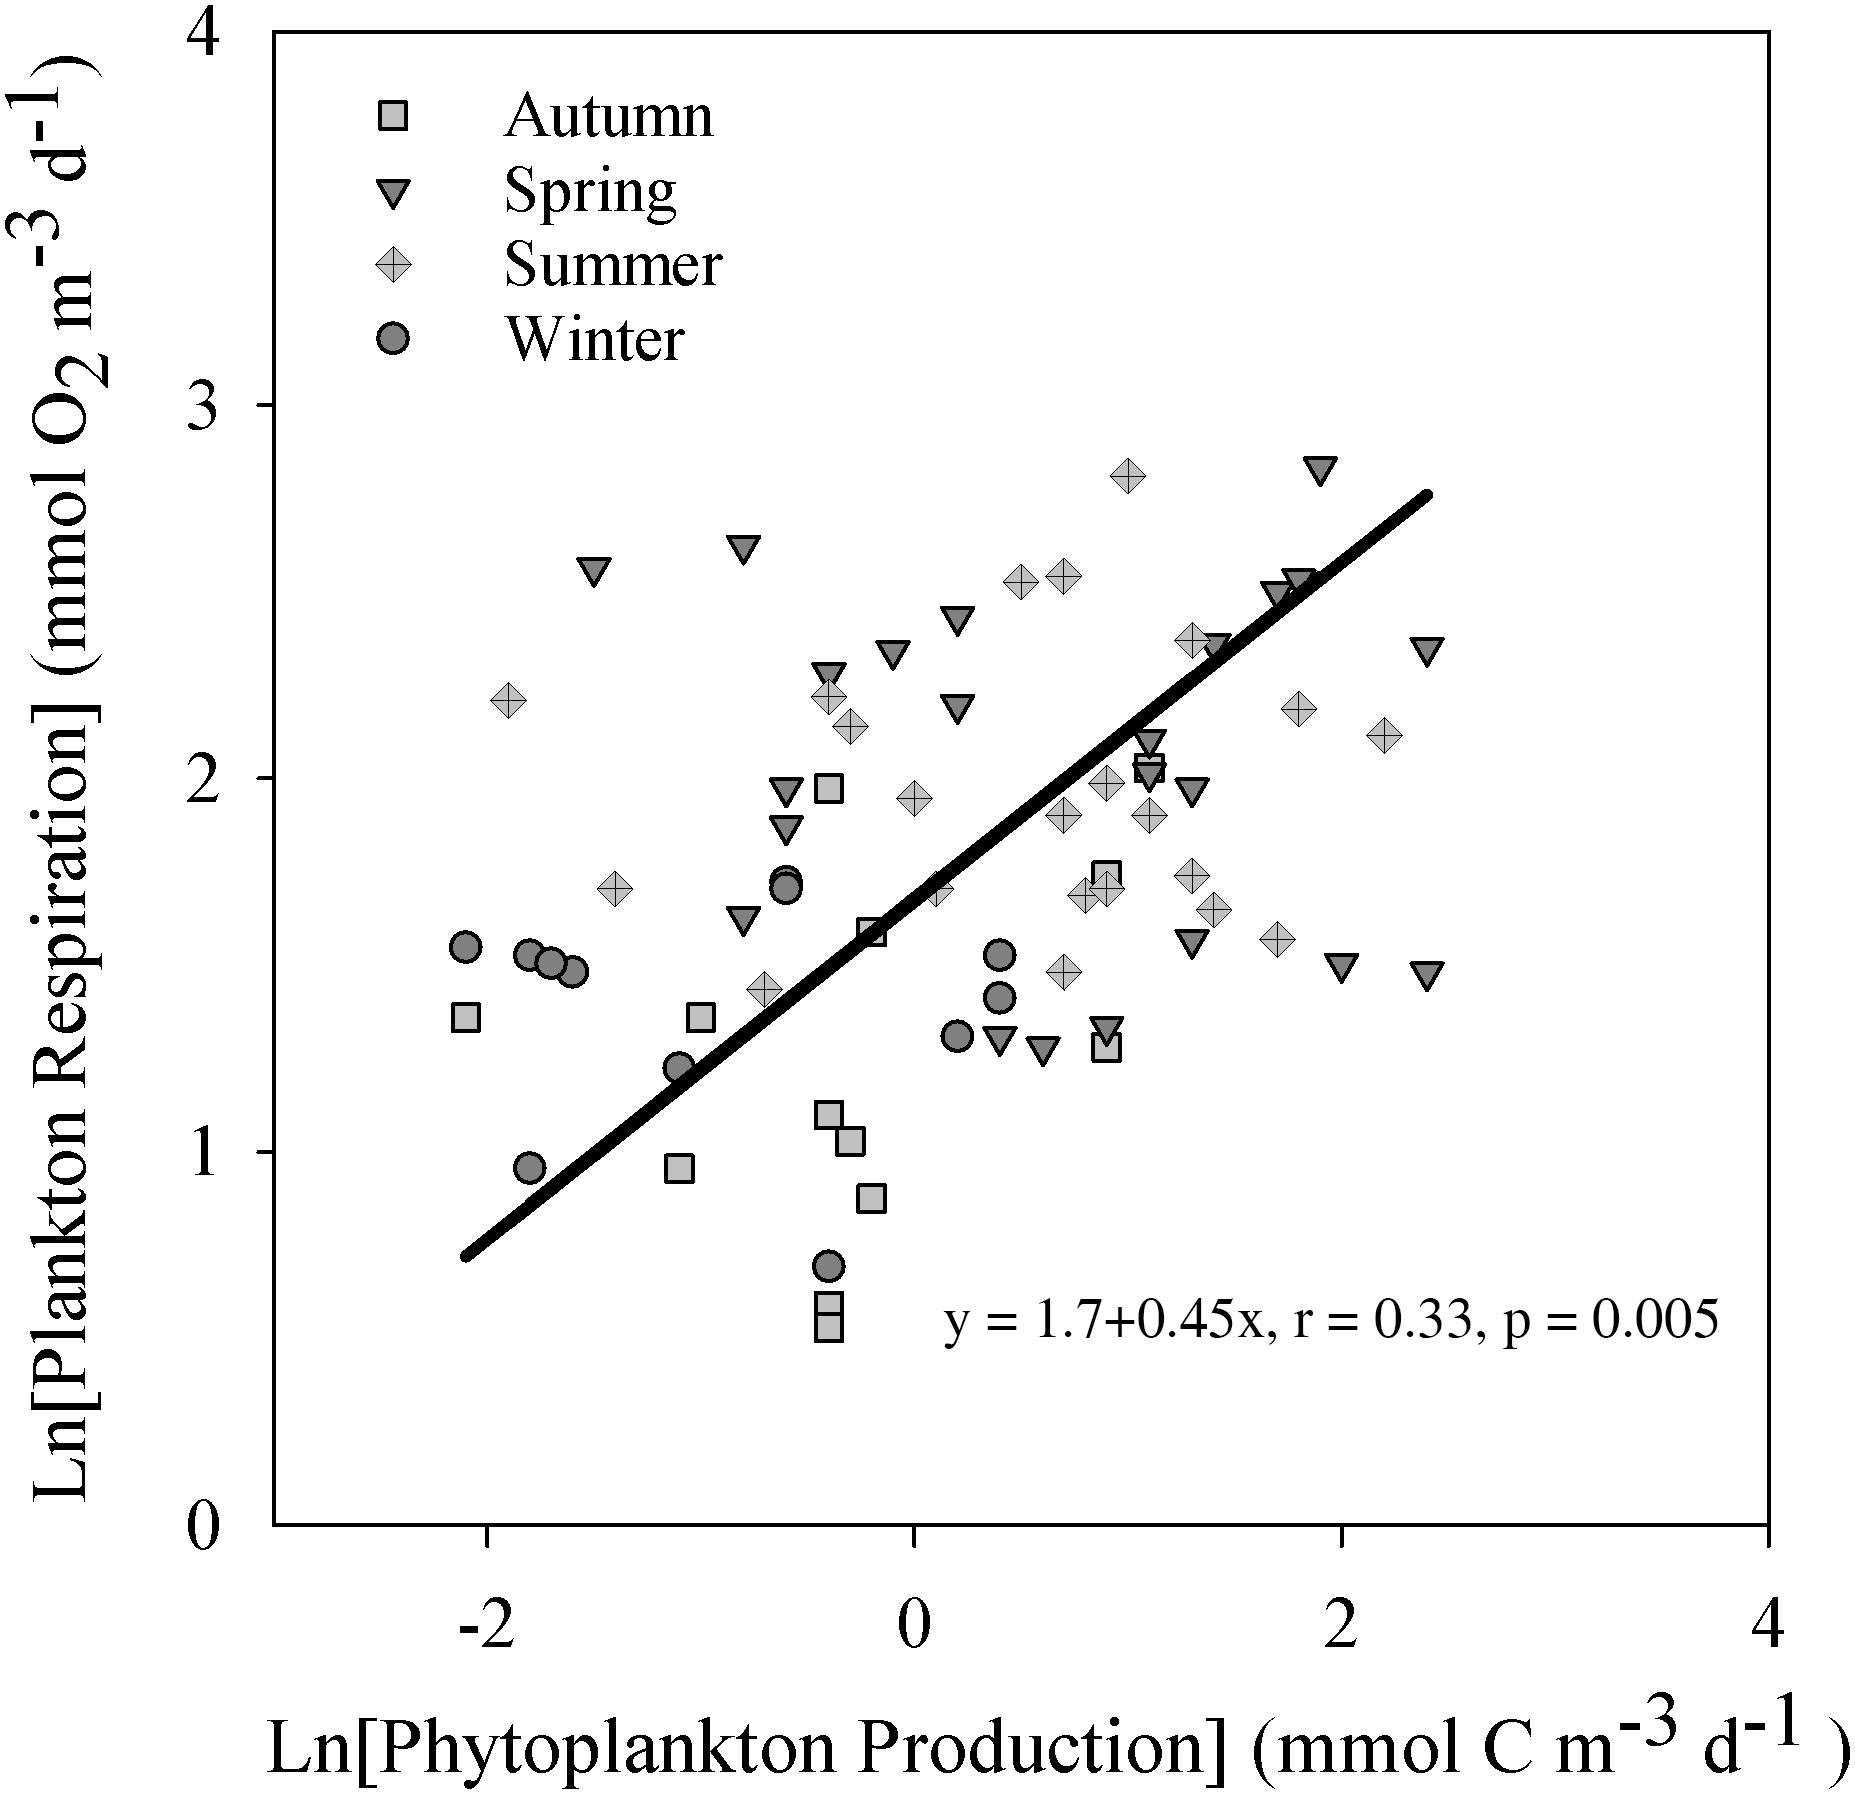
Figure 3. Natural logarithm-transformed plankton respiration vs. the phytoplankton production categorized by season. Only cases above the calculated detection limits are included. The solid line show the fit by a model II regression. The figure include the resulting function and Pearson correlation coefficient with significance level.
In contrast, Rp did not differ between autumn and winter (Mann–Whitney U test, p > 0.05). The integrated PhP (ranging from 275 to 1889 mmol C m–2 season–1) supported 3–29% of the seasonal Rp, (ranging from 2202 to 8806 mmol C m–2 season–1) with a higher share during the spring and summer months. No coupled dynamics between phytoplankton-produced carbon and Rp could be seen, possibly dependant on the applied sampling frequency (Figure 2). Furthermore, the weak seasonal dynamics observed at depths ≥15 m may suggest, although not conclusively, rapid consumption and distribution of contemporary photosynthetically derived carbon in the first few meters of the water column.
Baseline Respiration and Annual Contribution to Pelagic Respiration
The Rbl rates estimated by three different and accepted approaches (Winter time Rp, 14C detection limit and compensation depth) did not differ significantly from each other in terms of their 95% confidence intervals (Table 2). They had an average of 4.1 mmol O2 m–3 d–1 with an SE of ±0.1.
Absolute values of PhP and Rp showed no significant relationship over the study period (linear regression, p > 0.05 r2 = 0.01) with or without values below the detection limit. Natural logarithm transformed values above the detection limits improved the relationship, but with a low correlation coefficient (r = 0.33, p = 0.005, Figure 3). Using the 14C method detection limit of 0.1 mmol C m–3 d–1 [Ln (PhP) = −2.3] to derive a baseline value showed a statistically significant Rbl of 1.9 mmol O2 m–3 d–1. Upper and lower 95% confidence limits were 1.3 and 2.5 mmol O2 m–3 d–1, respectively (n = 70). Due to the imposed transformation and poor correlation, we excluded this estimate from further calculations (e.g., Table 2).
In the winter season, the majority of the respiration values (78%) occurred below the detection limit of PhP by the 14C method. However, a large share of the Rp measurements during other seasons also coincided with PhP-values below the estimated 14C detection limit. Using the median values from the meteorologically defined winter season (November–March) resulted in an Rbl of 4.2 mmol O2 m–3 d–1 (Table 2). This value corresponded to an annual contribution of 76% from Rbl to the annual Rp, assuming the estimated Rbl (i.e., winter season) to be the same throughout the whole year and throughout the water column. In contrast to a constant rate of Rbl, the second and third approaches allowed for a more dynamic estimate of Rbl over seasons where productivity and temperature changed. The second approach used the detection limit of the 14C method (0.1 mmol C m–3 d–1) as the criterion for estimating baseline respiration. This resulted in a median Rp of 4.1 mmol O2 m–3 d–1. Using only the Rp values occurring below the 14C detection limit in the hypsographic depth grid resulted in an annual contribution from a baseline of 30% to Rp (Table 2). The third strategy to estimate Rbl used the compensation depth level ranging between 8.8 and 11 m with an average of 9.3 m. Using the hypsographic model and defining the Rp values below the compensation depth as Rbl resulted in similar rates as those of the previous two approaches (4.0 mmol O2 m–3 d–1 and 47% of annual Rp).
Relationship of Respiration vs. Major Carbon Input
Plotting the sum of the major carbon sources RTOC and PhP vs. Rp in a linear regression analysis showed a significant linear relationship (r2 = 0.38 and p < 0.001 n = 46).
The values in parentheses are the standard error. The regression analysis excluded five points as outliers, based on the Cook’s distance Di values greater than 3 times the average.
Carbon Supply to Baseline Respiration
To verify that the measured carbon sources could supply the comparably high Rp relative to PhP in the estuary, respiration rates were converted from oxygen to carbon assuming a RQ of 1 (del Giorgio and Williams, 2005). The annual average carbon consumption was 20 370 mmol C m–2 year–1 (corresponding to 5.1 μmol dm–3 d–1 on average), using the two full years (Table 3). The annual RTOC load from the Öre River was the largest measured carbon input to the estuary (10,929 mmol C m–2 year–1, 85% utilized), while PhP was clearly a lower carbon source (3198, 80% utilized mmol C m–2 year–1). The annual carbon sources available within the estuary supplied 69% of the annual Rp carbon demand. The net change in DOC in the estuary for the winter seasons was not included in the budget due to the low sampling frequency and moderate variation between seasons (Supplementary Figure 1). The consumption of carbon by Rbl during the winter season was 4 915 mmol C m–2 winter–1, accounting for 83% of the winter season respiration demand (Table 3). The carbon available during the winter periods (1660 mmol C m–2 winter–1) could only supply 32% of the Rp.
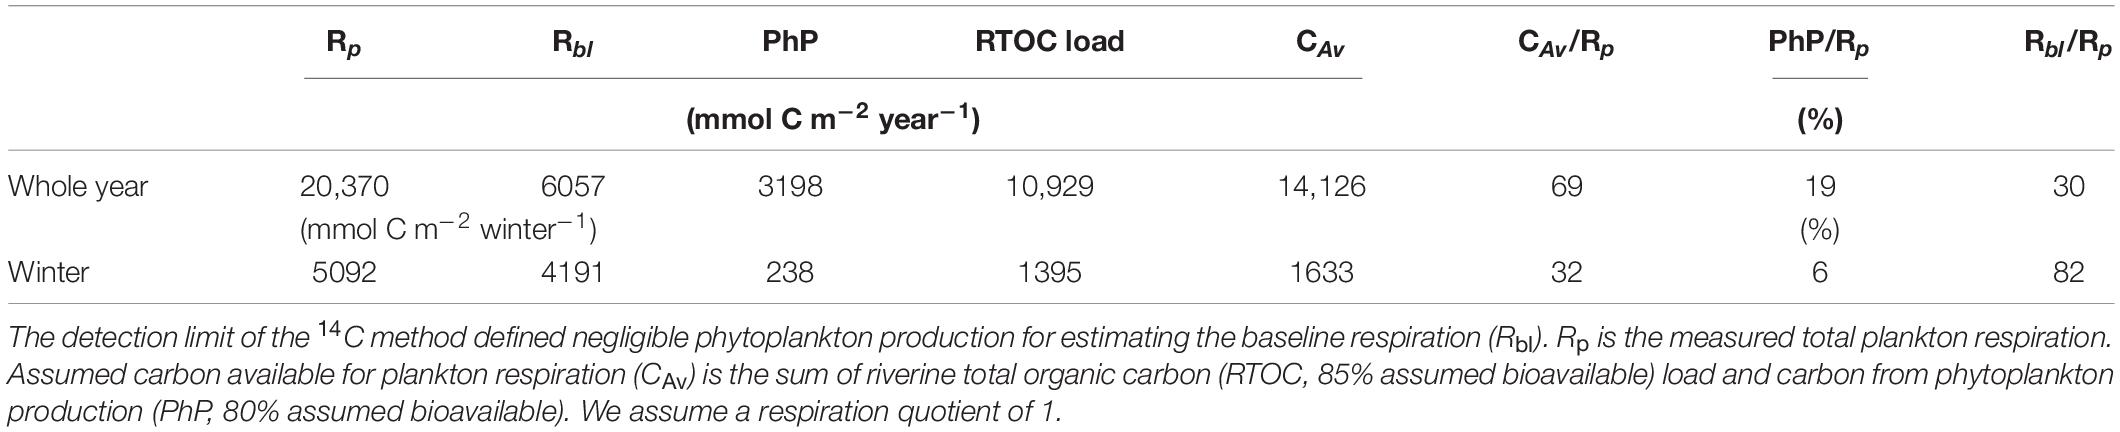
Table 3. Integrated rates for the whole volume of the estuary (0.77 km3) per year or per winter.
Oxygen consumption via nitrification in the bottom water of the Öre estuary was 0.043 ± 0.014 mmol m–3 d–1 and 0.097 ± 0.054 mmol m–3 d–1 in April 2015 and August 2015, respectively. The corresponding oxygen consumption via nitrification contributed only 0.9−1.1% (April 2015) and 2.1−2.4% (August 2015) to the estimated Rbl (Table 4).
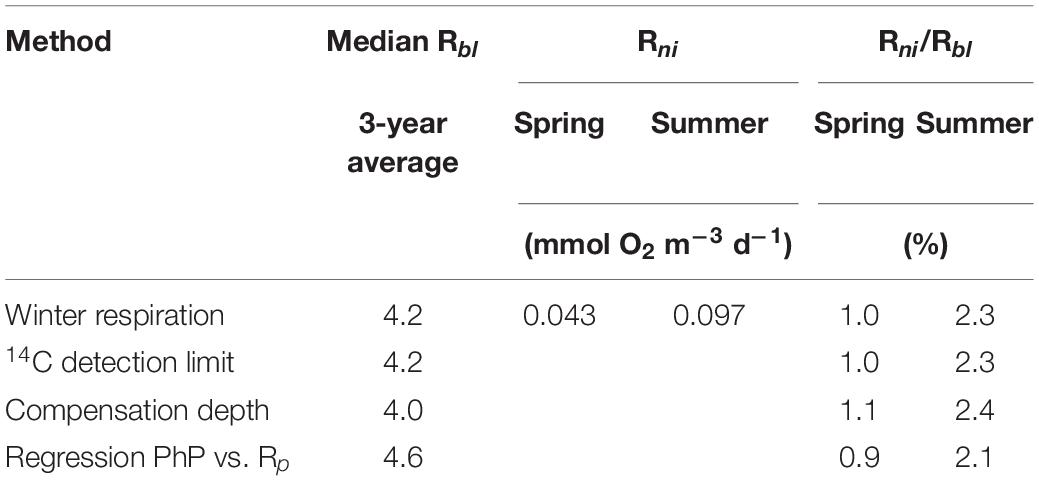
Table 4. Baseline respiration (Rbl) compared to the mean oxygen consumption by nitrification (Rni) in spring and summer 2015 in the Öre estuary.
Discussion
Rate of Baseline Respiration
In this study, we estimated, for the first time, the baseline respiration and its contribution to annual Rp within a water body. The median Rbl rates of the different methods applied were similar to each other (Table 2) and averaged 4.1 mmol O2 m–3 d–1 (±SE 0.1 mmol O2 m–3 d–1). The winter season estimate is the closest to the original definition of Rbl due to low light irradiance and low temperatures in this season, leading to a negligible rate of PhP (sensu del Giorgio and Williams, 2005). However, this approach relies on the characteristic winter conditions of temperate climate zones, which may be unsuitable to apply in other environments. As this approach assumes Rbl stable over seasons and depths, it also neglects seasonal variability in Rbl.
Measurements of pelagic respiration during winter are rare in the literature and were unexpectedly high in the studied estuary (4.2 mmol O2 m–3 d–1), most likely due to the high influence of allochthonous carbon (Table 3). Since the winter season spans a large part of the year in the region, it contributed a considerable share to the annual Rp (25%). The winter Rp rates observed were similar to those in the Chesapeake Bay, which has a reported value of 4.7 mmol O2 m–3 d–1 (Du and Shen, 2015), indicative of a similar level of Rbl despite some PhP still present in that system during winter. In contrast, Smith and Kemp (2001) did not report the influence of allochthonous carbon in the Chesapeake Bay, possibly due to a data set covering only April to November omitting the lowest rates. However, the winter respiration observed in our study was less than half the rate in a coastal Mediterranean site with similar oligotrophic conditions (Navarro et al., 2004). They reported a low share of winter Rp at 13% of the annual Rp, which was the only other corresponding estimate we found in the literature. Winter respiration in the Mediterranean is expected to be higher than our rates measured in the studied sub-arctic area, due to higher light irradiance and therefore higher (i.e., contemporary) PhP.
The limited applicability of the winter respiration approach to ecosystems lacking a winter season implies the need of alternative, more dynamic, approaches to estimate Rbl. These approaches could also indicate whether Rbl is markedly different during the productive seasons than during the low-productive winter season. The additional approaches, using the 14C detection limit and the compensation depth, are consistent with the definition of Rbl occurring at negligible PhP. However, in contrast to the winter season approach when PhP is low, these approaches also include respiration driven by autotrophic organic carbon produced at an earlier time or at a different location (e.g., sedimentation from the photic zone). However, the similar results for the baseline respiration estimate obtained with the winter approach and the other approaches suggest that the influence of these sources was minor in our study. The weak seasonal dynamics in pelagic respiration at a depth of 15 m also corroborated the minor influence of settling organic carbon (Figure 2).
The calculated detection limit of PhP coincided with the level where an increase in Rp began and continued with increasing PhP, lending support to the obtained value from the 14C detection limit approach. Due to the imposed limitation in sample size we consider the applied detection limit a maximum estimate, as larger sample sizes should reduce SE for all variance components (Eq. 4). The compensation depth approach has a well-established limit for significant PhP (i.e., 1% of Iz0) and is methodologically independent of the rate measurements, which is beneficial but requires that light measurements are available for the photic zone. We inferred that the similar values obtained when using the detection limit and compensation depth approaches to the winter values provided confidence in our Rbl estimate (Table 2).
Estimating baseline respiration by the y-intercept of the PhP vs. Rp plot requires a strong relationship between these variables. In our study, PhP showed a significant relationship to Rp only when both variables were ln-transformed, with a still low correlation coefficient (Figure 3). Ln-transformation means that we cannot derive a y-intercept, as a power function asymptotically approach infinity, and therefore not claim to properly apply the y-intercept approach. Our assumption to derive Rbl at the detection limit for PhP by back-transformation, add subjectivity to the estimate and increase uncertainty. This combined with the low r of 0.33 led us to remove the estimate from further calculations. The low influence of PhP was also manifested by a low contribution (19%) to the yearly Rp carbon demand, while the allochthonous RTOC load supplied three times as much carbon (Table 3). Therefore, the PhP vs. Rp approach is more applicable in environments with relatively high supply of autochthonous production and a low influence of allochthonous organic carbon. Consequently, despite the common assumption of a marked coupling between PhP and Rp, it was poor in this particular system and we cannot apply a regression on the linear scale to derive Rbl. Thus, we advocate using the PhP detection limit or compensation depth as more generally applicable strategies, including also ecosystems where no clear low productive season is expected. As a result, the data presented in Table 3 were based on the 14C detection limit approach. The applied approaches encompass independent criteria and quantities to constrain the spatiotemporal space where baseline respiration is probable, allowing for a first estimate of Rbl relevant for management strategies, as discussed below in section “Managing Hypoxia at Low Productivity.” Nevertheless, the lack of a firm division between contemporary and non-contemporary primary production still leaves some uncertainty in the estimate of Rbl by all approaches.
Significant Contribution of Baseline Respiration
Studying the annual contribution of Rbl to Rp required an upscaling of respiration rates to the level of the whole estuary (i.e., basin level). We used a hypsographic map and a fishnet grid to account for the variable influence of both Rp and PhP with depth in the estuary. Although we lack observations in all individual squares of the fishnet grid, the two stations sampled, 1.7 km apart, were not significantly different from each other, providing some confidence that the respiration upscaling was representative of the whole estuary.
A high contribution of Rbl to Rp implies a greater sensitivity of an ecosystem to hypoxia, which is important knowledge to support sustainable coastal management and ecosystem health. The winter season approach resulted in an annual contribution of Rbl to Rp of 76%, assuming constant Rbl throughout the year. However, a constant Rbl over depth and season was not obvious, as the contribution from contemporary productivity varies. The 14C detection limit and the compensation depth approaches, including seasonal and depth variation in Rbl, resulted in 30 and 47% contribution from Rbl to Rp, respectively, indicating a lower annual Rbl contribution than the conservative winter season approach. The average of the two recommended approaches resulted in an annual contribution of Rbl to Rp of approximately 40%, indicating that Rbl is an important contributor to Rp in this sub-arctic estuary (Table 3). This is in line with the results of Carvalho et al. (2017), who estimated that 55% of Rp in oceanic surface waters was driven by carbon older than 24 h (i.e., corresponding to Rbl).
Baseline Respiration Carbon Supply
The available carbon sources supplied 69% of the annual Rp demand, assuming that 85% of riverine RTOC and 80% of PhP-derived C were utilized within the year (Table 3). An assumed annual utilization of 85% RTOC may seem high but agree with observations of increased bioavailability of riverine carbon due to photochemical reactions and increased salinity (Bertilsson et al., 1999; Wikner et al., 1999). Bertilsson et al. (1999) showed that when irradiating RTOC for 12 h, bacteria could utilize 72% of riverine carbon, and Aarnos et al. (2012) estimated that 75% of the incoming riverine carbon were metabolized by bacterioplankton. Furthermore, Sandberg et al. (2004) showed that all of the allochthonous carbon entering the Gulf of Bothnia must be utilized to support the respiration of the system on an annual timescale.
Sandberg et al. (2004) calculated a bacterial respiration rate from bacterial community growth, assuming a bacterial growth efficiency (BGE) of 30%, resulting in one fifth of our measured annual Rp (Table 3). Current estimates of BGE from this area show values three times lower, suggesting that the respiration in Sandberg et al. (2004) was underestimated (Wikner et al., 1999; del Giorgio et al., 2011; Vikström and Wikner, 2018). Assuming that bacterial respiration accounts for 50% of the total plankton respiration in their study, we calculated a similar Rp (18,600 mmol m–2 year–1) as observed in that study (Table 3). Therefore, our direct measurements of plankton respiration and a better-constrained BGE value both suggest that most of the organic carbon entering the estuary is mineralized to CO2 on an annual scale.
The major carbon source for Rp at an annual scale was RTOC (54%) rather than PhP. This conclusion is still consistent with reports of 25% aggregation of the annual RTOC load, as the remaining part (75%) could be accounted for by respiration, and some aggregated carbon may also be mineralized in the water column or sediment (Forsgren and Jansson, 1992; Sandberg et al., 2004). Given the uncertainties related to both measurements, the up-scaling and the potential lack of some carbon sources in the available data, the overall uncertainty may approach tens of percent. With this in mind, a 69% coverage of the annual Rp is close to balancing the budget. The potential contribution from a net decrease in the marine DOC pool during winter was not included due to the low sampling frequency (Supplementary Figure 1). We therefore conclude that a 68% coverage of the annual Rp is realistic when the two most important carbon sources, PhP and RTOC are included. An exhaustive carbon budget for the estuary was not within the scope of this study.
The winter season, however, showed a larger carbon deficit of 68%, and thus, the RTOC discharge alone could not account for the measured Rbl. A net decline in the marine DOC pool did not fully explain this deficit; as such a decline during winter should have been clearly detectable in the DOC data (Supplementary Figure 1). Instead, the existence of additional carbon sources, not measured during our study, is the most plausible explanation for the observed carbon deficit during the winter. Several potential sources of carbon need to be added or investigated in more detail for a more complete budget calculation. These sources include DOC exchange with the offshore environment (Engqvist, 1993), resuspension and DOC release of sediment organic matter (Brydsten, 1992), benthic primary production (Ask et al., 2016), and groundwater inputs of terrestrial carbon (Kwon et al., 2014).
We can currently not identify a plausible mechanism that could cause an overestimation of the respiration estimates. The Rp rates observed were well within the range (0.6–225 mmol m–3 d–1) of published rates (e.g., Sherr and Sherr, 1996; Smith and Kemp, 2003; Preen and Kirchman, 2004; Apple et al., 2006; Caffrey et al., 2014; Carvalho et al., 2017). Wikner et al. (2013) further successfully validate the optode method vs. the Winkler titration method. Values for BGE, using the same method for respiration, also compares well with independent estimates by increase in bacterial biomass and net change in DOC (Wikner et al., 1999; Vikström and Wikner, 2018). We have also excluded the few measurements showing initial oversaturation of oxygen. The PhP rates obtained were of the same range as reported rates from other oligotrophic systems (Lemee et al., 2002), reports from the same estuary (Sandberg et al., 2004) and studies of the adjacent offshore area (Andersson et al., 1996), lending confidence to the measured PhP rates.
Nitrification consumes oxygen when oxidizing ammonium to nitrate (Ward, 2008) and may thus be part of Rbl. Our results, however, show that nitrification rates in the bottom water of the estuary had a minor contribution (≤2.4%) to Rbl. Assuming that the observed rates (Bartl et al., 2018) were representative of the whole year, nitrification has a limited influence on both the oxygen (including Rbl) and carbon budgets (i.e., CO2 uptake) in this estuary. Taken together with the carbon sources presented above, our data show that the RTOC load is the major carbon source for Rp annually, while it is an insufficient source during the winter.
Weak Relationship at Low Productivity
Given the high contribution of allochthonous organic carbon to the carbon supply of this estuary, we hypothesized that the RTOC load combined with PhP could control the rate of Rp. The significant relationship obtained confirmed allochthonous organic carbon as an important source for Rp (Figure 4), as contemporary phytoplankton productivity alone was a poor predictor of Rp (Figure 3). In addition, this analysis again showed that a significant Rp also occurred during winter at the lowest carbon supply of the year. This is different from the linear relationship between PhP and Rp through the origin, often inferred from cross-ecosystem comparisons or corresponding large productivity ranges (Duarte and Agustí, 1998; Smith and Kemp, 2001). The productivity range for the Öre estuary (i.e., oligotrophic status) matched the lower end of these cross-ecosystem data sets well, corroborating their weaker relationship, and the positive y-intercept indicated at lower production values. The relatively low coefficient of determination showed that factors other than RTOC and PhP markedly influenced the rate of Rp (e.g., temperature, Robinson, 2008). The linear relationship between Rp and the combined RTOC and PhP was also consistent with the dependence of respiration on gross production for a freshwater lake at a corresponding productivity level as determined by del Giorgio and Williams (2005). Our results therefore show that also a coastal marine environment, represented by an oligotrophic site, can have a significant Rbl, mainly driven by contributions from allochthonous carbon sources.
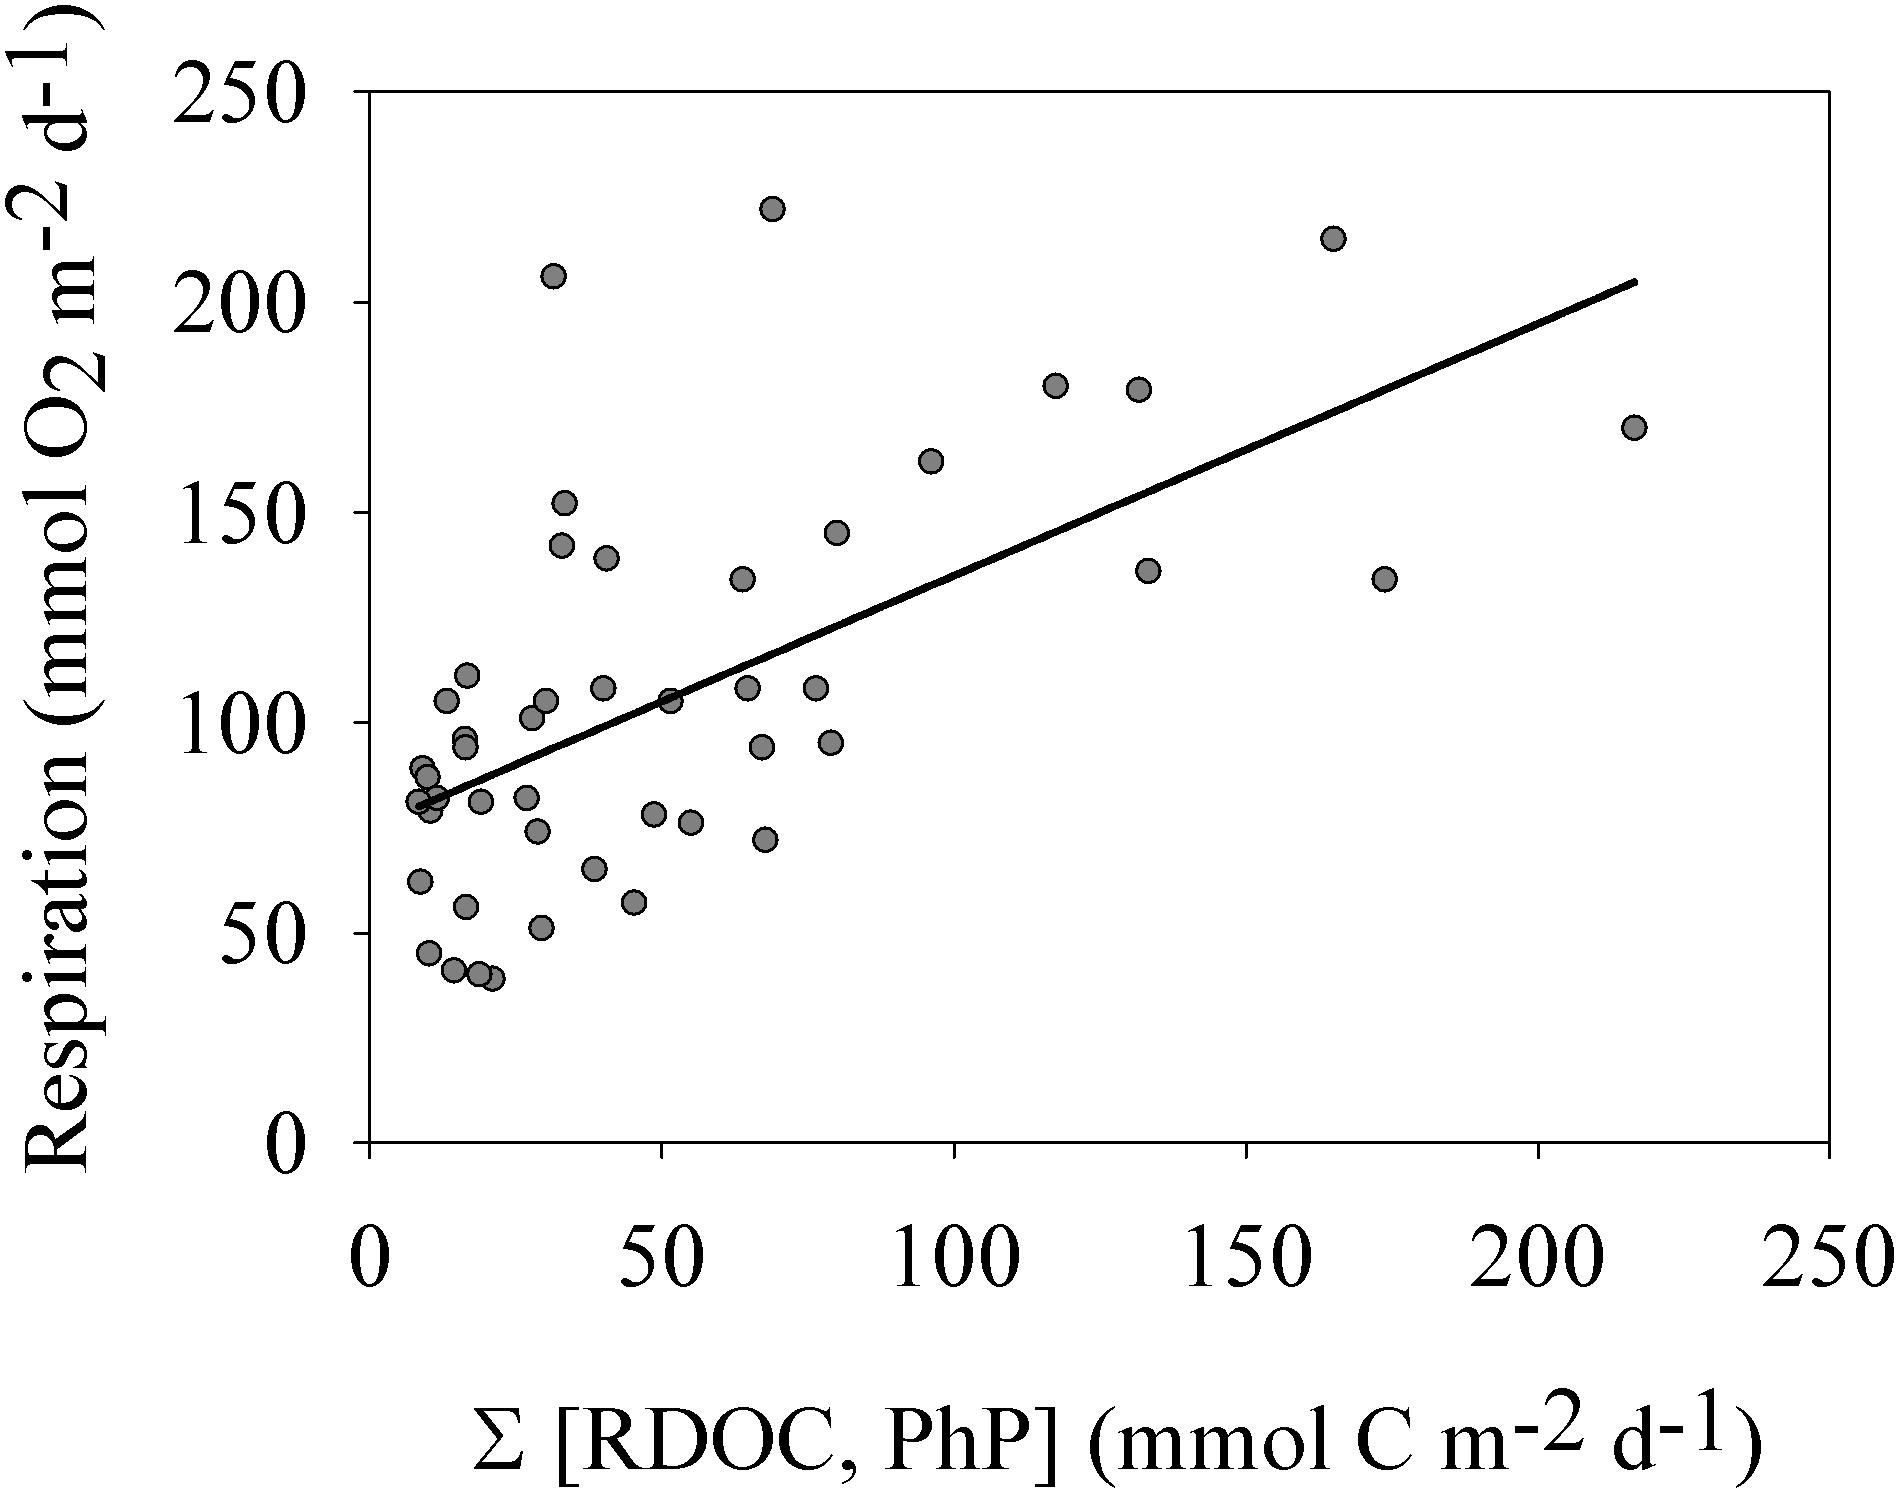
Figure 4. Plankton respiration vs. the sum of phytoplankton production and river inflow of riverine organic carbon (RTOC). The linear relationship was significant (p < 0.001 and r2 = 0.38). See section “Results” for more details.
Managing Hypoxia at Low Productivity
We have demonstrated that baseline respiration driven by allochthonous carbon markedly influences oxygen consumption in a coastal water body. Consequently, oxygen consumption does not show a strong linear relationship with PhP, which has important implications for managing hypoxia (Figure 5). The manageable part of oxygen consumption by nutrient reduction is limited when Rbl significantly contributes to Rp and the primary production level is low in an ecosystem. In principle, the upper panel of Figure 5 corresponds to the lower panel during low productivity when approaching the origin. Therefore, it is vital for effective management of hypoxia driven by eutrophication to consider the actual scale of primary productivity and the resulting response curve for respiration. Actions to limit discharge of nitrogen and phosphorus could reduce the pool of latent autochthonously produced carbon, while allochthonous organic carbon would be difficult to manage. Our results show that it is important to consider the input of allochthonous organic carbon and its contribution to ecosystem Rp is for informed management decisions. However, at a high productivity level and negligible Rbl, nutrient reduction strategies remain effective (cf. Riemann et al., 2016), as Rp rates show a relatively stronger relationship to PhP (Duarte and Agustí, 1998; Smith and Kemp, 2001). Consequently, the functional response of Rp to PhP is important to know for effective management of a water body. Large marine environments, like the pelagic open and coastal sea areas, fall into the lower end of the marine productivity range (Table 1), potentially influenced by a non-linear relationship related to a significant Rbl. These environments also include sea areas commonly classified as eutrophic, such as the Baltic Sea.
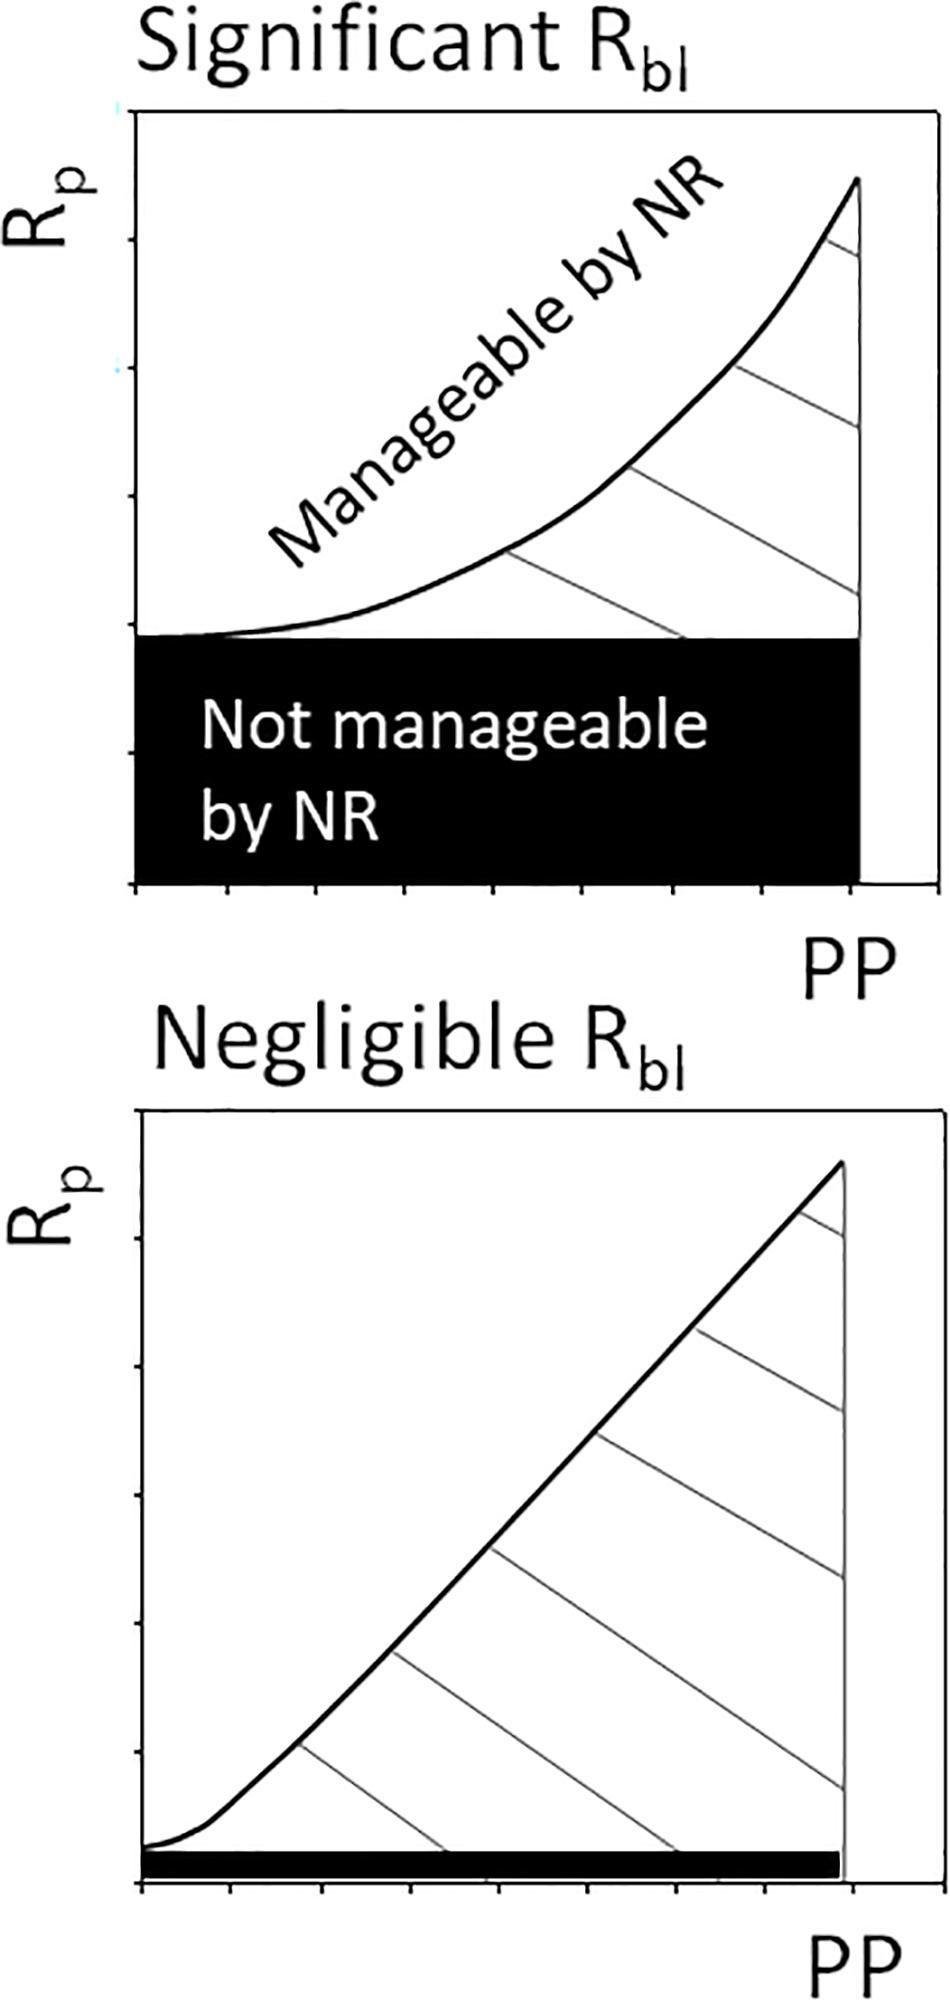
Figure 5. Conceptual figure depicting management of plankton respiration (Rp) indirectly through nutrient reductions (NR) affecting the level of primary production (PP). In ecosystems with significant baseline respiration (Rbl, e.g., with low productivity and high RTOC load), a limited share of oxygen consumption can be managed by nutrient reductions.
The current definition of Rbl excludes contemporary primary carbon production as a source but allows for latent primary production (CLat) and allochthonous carbon to support Rbl (del Giorgio and Williams, 2005). This definition is justified when the aim is to study the potential of primary production to supply respiration measured at a relatively short time scale (i.e., 24 h, c.f. Williams et al., 2004). For Rbl to be an applicable tool for environmental management, operating on longer time scales, baseline respiration should be free from the influence of autochthonous carbon manageable by nutrient reduction strategies. That CLat will drive Rbl at a longer time scale, according to the original concept, is irrelevant in the management context. Allochthonous organic carbon is thus the only source not related to autochthonous production within the system. For managing coastal zones, we therefore propose to set Rbl equal to respiration driven by allochthonous organic carbon. Accounting for Rbl driven by allochthonous organic carbon when assessing actions to counteract hypoxia, is therefore important for optimizing management strategies and applying reduction measures where they are most effective.
Data Availability Statement
All datasets presented in this study are included in the article/Supplementary Material.
Author Contributions
KV conducted respiration measurements and led the analysis of the data as well as the majority of the writing. IB conducted and analyzed the nitrification data and contributed to the relevant sections. JK contributed to writing the manuscript and advising on the statistical analyses. JW developed the experimental design, contributed to writing the manuscript, calculated the budget, and provided advice for the statistical analyses. All authors contributed to the article and approved the submitted version.
Funding
Financial support was provided by the EcoChange strategic project (JW) and the BONUS COCOA project (grant agreement 2112932-1) to IB, jointly funded by the EU and the German BMBF (grant number 03F0683A). KV was partly funded by the Leverhulme trust (grant number R204115).
Conflict of Interest
The authors declare that the research was conducted in the absence of any commercial or financial relationships that could be construed as a potential conflict of interest.
Acknowledgments
This study was dependent on technical and analytical support from the staff at Umeå Marine Sciences Center. Complementing variables from the Swedish environmental monitoring program funded by the Swedish Agency for Marine and Water Management was crucial for the study. GIS support was provided by Håkan Eriksson Umeå University.
Supplementary Material
The Supplementary Material for this article can be found online at: https://www.frontiersin.org/articles/10.3389/fmars.2020.572070/full#supplementary-material
Supplementary Figure 1 | Dissolved organic carbon (DOC) concentration in the Öre estuary integrated over depth and season. Line is based on a spline smoother.
Footnotes
References
Aarnos, H., Ylöstalo, P., and Vähätalo, A. V. (2012). Seasonal phototransformation of dissolved organic matter to ammonium, dissolved inorganic carbon, and labile substrates supporting bacterial biomass across the Baltic Sea. J. Geophys. Res. 117:G01004. doi: 10.1029/2010JG001633
Andersson, A., Hajdu, S., Haecky, P., Kuparinen, J., and Wikner, J. (1996). Succession and growth limitation of phytoplankton in the Gulf of Bothnia (Baltic Sea). Mar. Biol. 126, 791–801. doi: 10.1007/bf00351346
Apple, J. K., del Giorgio, P. A., and Michael Kemp, W. (2006). Temperature regulation of bacterial production, respiration, and growth efficiency in a temperate salt-marsh estuary. Aquat. Microb. Ecol. 43, 243–254. doi: 10.3354/ame043243
Ask, J., Rowe, O., Brugel, S., Strömgren, M., Byström, P., and Andersson, A. (2016). Importance of coastal primary production in the northern Baltic Sea. Ambio 45, 635–648. doi: 10.1007/s13280-016-0778-5
Bartl, I., Hellemann, D., Rabouille, C., Schulz, K., Tallberg, P., Hietanen, S., et al. (2019). Particulate organic matter controls benthic microbial N retention and N removal in contrasting estuaries of the Baltic Sea. Biogeosciences 16, 3543–3564. doi: 10.5194/bg-16-3543-2019
Bartl, I., Liskow, I., Schulz, K., Umlauf, L., and Voss, M. (2018). River plume and bottom boundary layer – Hotspots for nitrification in a coastal bay? Estuar. Coast. Shelf Sci. 208, 70–82. doi: 10.1016/j.ecss.2018.04.023
Bendtsen, J., and Hansen, J. L. S. (2013). Effects of global warming on hypoxia in the Baltic Sea–North Sea transition zone. Ecol. Modelling 264, 17–26. doi: 10.1016/j.ecolmodel.2012.06.018
Berounsky, V. M., and Nixon, S. W. (1993). Rates of nitrification along an estuarine gradient in Narragansett Bay. Estuaries 16, 718–730. doi: 10.2307/1352430
Bertilsson, S., Stepanauskas, R., Cuadros-Hansson, R., Granéli, W., Wikner, J., and Tranvik, L. (1999). Photochemically induced changes in bioavailable carbon and nitrogen pools in a boreal watershed. Aquat. Microb. Ecol. 19, 47–56. doi: 10.3354/ame019047
Brydsten, L. (1992). Wave-induced sediment resuspension in the Öre estuary, northern Sweden. Hydrobiologia 235, 71–83. doi: 10.1007/BF00026201
Caffrey, J. M., Murrell, M. C., Amacker, K. S., Harper, J. W., Phipps, S., and Woodrey, M. S. (2014). Seasonal and inter-annual patterns in primary production, respiration, and net ecosystem metabolism in three estuaries in the Northeast Gulf of Mexico. Estuar. Coast. 37, 222–241. doi: 10.1007/s12237-013-9701-5
Carvalho, M. C., Schulz, K. G., and Eyre, B. D. (2017). Respiration of new and old carbon in the surface ocean: implications for estimates of global oceanic gross primary productivity. Glob. Biogeochem. Cycles 31, 975–984. doi: 10.1002/2016GB005583
Conley, D. J., Carstensen, J., Aigars, J., Axe, P., Bonsdorff, E., Eremina, T., et al. (2011). Hypoxia is increasing in the coastal zone of the Baltic Sea. Environ. Sci. Technol. 45, 6777–6783. doi: 10.1021/es201212r
Cubasch, U., Meehl, G. A., Boer, G. J., Stouffer, R. J., Dix, M., Noda, A., et al. (2001). “Projections of future climate change,” in Climate Change 2001: The Scientific Basis: Contribution of Working Group I to the Third Assessment Report of the Intergovernmental Panel, eds J. T. Houghton, Y. Ding, D. J. Griggs, M. Noguer, P. van der Linden, X. Dai, et al. (Cambridge: Cambridge University Press), 526–582. doi: 10013/epic.15750.d001
del Giorgio, P. A., Cole, J. J., Caraco, N. F., and Peters, R. H. (1999). Linking planktonic biomass and metabolism to net gas fluxes in northern temperate lakes. Ecology 80, 1422–1431.
del Giorgio, P. A., Condon, R., Bouvier, T., Longnecker, K., Bouvier, C., Sherr, E., et al. (2011). Coherent patterns in bacterial growth, growth efficiency, and leucine metabolism along a northeastern Pacific inshore-offshore transect. Limnol. Oceanogr. 56, 1–16. doi: 10.4319/lo.2011.56.1.0001
del Giorgio, P. A., and Williams, P. J. L. B. (2005). Respiration in Aquatic Ecosystems: History and Background. Oxford: Oxford University Press, 198.
Diaz, R. J., and Rosenberg, R. (2008). Spreading dead zones and consequences for marine ecosystems. Science 321, 926–929. doi: 10.1126/science.1156401
Du, J., and Shen, J. (2015). Decoupling the influence of biological and physical processes on the dissolved oxygen in the Chesapeake Bay. J. Geophys. Res. Oceans 120, 78–93. doi: 10.1002/2014JC010422
Duarte, C. M., and Agustí, S. (1998). The CO2 balance of unproductive aquatic ecosystems. Science 281, 234–236. doi: 10.1126/science.281.5374.234
Forsgren, G., and Jansson, M. (1992). The turnover of river-transported iron, phosphorus and organic carbon in the Öre estuary, northern Sweden. Hydrobiologia 235, 585–596. doi: 10.1007/BF00026246
Forsgren, G., and Jansson, M. (1993). Sedimentation of phosphorus in limnetic and estuarine environments in the River Öre system, northern Sweden. Hydrobiol. 84, 233–248. doi: 10.1007/978-94-011-1598-8_28
Grundle, D. S., and Juniper, S. K. (2011). Nitrification from the lower euphotic zone to the sub-oxic waters of a highly productive British Columbia fjord. Mar. Chem. 126, 173–181. doi: 10.1016/j.marchem.2011.06.001
Hopkinson, C. S., and Smith, E. M. (2005). “Respiration in aquatic ecosystems: history and background,” in Respiration in Aquatic Ecosystems, eds P. del Giorgio and P. Williams, (Oxford: OUP Oxford), 1–17. doi: 10.1093/acprof:oso/9780198527084.003.0001
Hsiao, S. S.-Y., Hsu, T.-C., Liu, J.-W., Xie, X., Zhang, Y., Lin, J., et al. (2014). Nitrification and its oxygen consumption along the turbid Chang Jiang River plume. Biogeosciences 11, 2083–2098. doi: 10.5194/bg-11-2083-2014
Jassby, A. D., and Platt, T. (1976). Mathematical formulation of the relationship between photosynthesis and light for phytoplankton. Limnol. Oceanogr. 21, 540–547. doi: 10.4319/lo.1976.21.4.0540
Karlsson, J., Jansson, M., and Jonsson, A. (2007). Respiration of allochthonous organic carbon in unproductive forest lakes determined by the Keeling plot method. Limnol. Oceanogr. 52, 603–608. doi: 10.4319/lo.2007.52.2.0603
Kwon, E. Y., Kim, G., Primeau, F., Moore, W. S., Cho, H.-M., DeVries, T., et al. (2014). Global estimate of submarine groundwater discharge based on an observationally constrained radium isotope model. Geophys. Res. Lett. 41, 8438–8444. doi: 10.1002/2014gl061574
Lemee, R., Rochelle-Newall, E., Wambeke, F. V., Pizay, M. D., Rinaldi, P., and Gattuso, J. P. (2002). Seasonal variation of bacterial production, respiration and growth efficiency in the open NW Mediterranean Sea. Aquat. Microb. Ecol. 29, 227–237. doi: 10.3354/ame029227
Lindahl, O. (1986). “A dividable hose for phytoplankton sampling,” in Report of the ICES Working Group, (Hirtshals: Exceptional Algal Blooms).
Lipschultz, F., Wofsy Steven, C., and Fox Lewis, E. (1986). Nitrogen metabolism of the eutrophic Delaware River ecosystem1. Limnol. Oceanogr. 31, 701–716. doi: 10.4319/lo.1986.31.4.0701
McCallister, L. S., and del Giorgio, P. A. (2008). Direct measurement of the d13C signature of carbon respired by bacteria in lakes: linkages to potential carbon sources, ecosystem baseline metabolism, and CO2 fluxes. Limnol. Oceanogr. 53, 1204–1216. doi: 10.4319/lo.2008.53.4.1204
Navarro, N., Susana, A., and Carlos, M. D. (2004). Plankton metabolism and dissolved organic carbon use in the Bay of Palma. NW Mediterranean Sea. Aquat. Microb. Ecol. 37, 47–54. doi: 10.3354/ame037047
Norrman, B. (1993). Filtration of water samples for DOC studies. Mar. Chem. 41, 239–242. doi: 10.1016/0304-4203(93)90125-8
Oschlies, A., Brandt, P., Stramma, L., and Schmidtko, S. (2018). Drivers and mechanisms of ocean deoxygenation. Nat. Geosci. 11, 467–473. doi: 10.1038/s41561-018-0152-2
Pirt, S. J. (1982). Maintenance energy - A general-model for energy-limited and energy-sufficient growth. Arch. Microbiol. 133, 300–302. doi: 10.1007/bf00521294
Prairie, Y. T., Bird, D. F., and Cole, J. J. (2002). The summer metabolic balance in the epilimnion of southeastern Quebec lakes. Limnol. Oceanogr. 47, 316–321. doi: 10.4319/lo.2002.47.1.0316
Preen, K., and Kirchman, D. (2004). Microbial respiration and production in the Delaware Estuary. Aquat. Microb. Ecol. 37, 109–119. doi: 10.3354/ame037109
Richardson, K. (1991). Comparison of C-14 primary production determinations made by different laboratories. Mar. Ecol. Prog. Ser. 72, 189–201. doi: 10.3354/meps072189
Riegman, R., and Colijn, F. (1991). Evaluation of measurements and calculation of primary production in the Dogger bank area (North-Sea) in summer 1988. Mar. Ecol. Prog. Ser. 69, 125–132. doi: 10.3354/meps069125
Riegman, R., Malschaert, H., and Colijn, F. (1990). Primary production of phytoplankton at a frontal zone located at the northern slope of the dogger-bank (North Sea). Mar. Biol. 105, 329–336. doi: 10.1007/bf01344303
Riemann, B., Carstensen, J., Dahl, K., Fossing, H., Hansen, J. W., Jakobsen, H. H., et al. (2016). Recovery of danish coastal ecosystems after reductions in nutrient loading: a holistic ecosystem approach. Estuar. Coast. 39, 82–97. doi: 10.1007/s12237-015-9980-0
Robinson, C. (2000). Plankton gross production and respiration in the shallow water hydrothermal systems of Miles. Aegean Sea. J. Plankton Res. 22, 887–906. doi: 10.1093/plankt/22.5.887
Robinson, C. (2008). “Heterotrophic bacterial respiration,” in Microbial Ecology of the Oceans, 2nd Edn, ed. D. L. Kirchman, (New York, NY: Wiley-Liss), 299–334.
Robinson, C., and Williams, P. J. le B. (2005). “Respiration and it’s measurement in surface marine waters,” in Respiration in Aquatic Ecosystems, eds P. A. DelGiorgio and P. J. B. L. B. Williams, (Oxford: Oxford Univ Press), 198.
Sandberg, J., Andersson, A., Johansson, S., and Wikner, J. (2004). Pelagic food web structure and carbon budget in the northern Baltic Sea: potential importance of terrigenous carbon. Mar. Ecol. Prog. Ser. 268, 13–29. doi: 10.3354/meps268013
Sherr, E. B., and Sherr, B. F. (1996). Temporal offset in oceanic production and respiration processes implied by seasonal changes in atmospheric oxygen: the role of heterotrophic microbes. Aquat. Microb. Ecol. 11, 91–100. doi: 10.3354/ame011091
SMHI (2016). Swedish Meteorological and Hydrological Institute. Avaliable at: http://www.smhi.se/en/services/open-data/search-smhi-s-open-data-1.81004.
Smith, E. M., and Kemp, M. W. (2001). Size structure and the production/respiration balance in a coastal plankton community. Limnol. Oceanogr. 46, 473–485. doi: 10.4319/lo.2001.46.3.0473
Smith, E. M., and Kemp, W. M. (2003). Planktonic and bacterial respiration along an estuarine gradient: responses to carbon and nutrient enrichment. Aquat. Microb. Ecol. 30, 251–261. doi: 10.3354/ame030251
Sokal, R., and Rohlf, F. (2012). Biometry: The Principles and Practice of Statistics in Biological Research, 2nd Edn. New York, NY: W. H. Freeman.
Suzuki, Y., Tanoue, E., and Ito, H. (1992). A high-temperature catalytic oxidation method for the determination of dissolved organic carbon in seawater: analysis and improvement. Deep Sea Res. Part A Oceanogr. Res. Pap. 39, 185–198. doi: 10.1016/0198-0149(92)90104-2
Valiela, I. (1995). “Factors affecting primary production,” in Marine Ecological Processes, ed. I. Valiela, (New York, NY: Springer), 36–83.
Van Rossum, G. (1995). “Python tutorial, technical report CS-R9526,” in Python version 2.7, (Amsterdam: Centrum voor Wiskunde en Informatica CWI).
Vikström, K., Tengberg, A., and Wikner, J. (2018). Improved accuracy of optode-based oxygen consumption measurements by removal of system drift and nonlinear derivation. Limnol. Oceanogr. 17, 179–189. doi: 10.1002/lom3.10297
Vikström, K., and Wikner, J. (2018). Importance of bacterial maintenance respiration in a subarctic estuary: a proof of concept from the field. Microb. Ecol. 77, 574–586. doi: 10.1007/s00248-018-1244-7
Ward, B. (2008). Nitrification in Marine Systems. 30 Corporate Drive, Suite 400. Burlington, VT: Academic Press.
Wikner, J., and Andersson, A. (2012). Increased freshwater discharge shifts the trophic balance in the coastal zone of the northern Baltic Sea. Glob. Change Biol. 18, 2509–2519. doi: 10.1111/j.1365-2486.2012.02718.x
Wikner, J., Cuadros, R., and Jansson, M. (1999). Differences in consumption of allochthonous DOC under limnic and estuarine conditions in a watershed. Aquat. Microb. Ecol. 17, 289–299. doi: 10.3354/ame017289
Wikner, J., Panigrahi, S., Nydahl, A., Lundberg, E., Båmstedt, U., and Tengberg, A. (2013). Precise continuous measurements of pelagic respiration in coastal waters with Oxygen Optodes. Limnol. Oceanogr. 11, 1–15. doi: 10.4319/lom.2013.11.1
Williams, P. J. le B., Morris, P. J., and Karl, D. M. (2004). Net community production and metabolic balance at the oligotrophic ocean site: station ALOHA. Deep-Sea Research Part I 51, 1563–1578. doi: 10.1016/j.dsr.2004.07.001
Keywords: estuary, oligotrophic, planktonic, respiration, phytoplankton production, baseline respiration, allochthonous carbon, nitrification
Citation: Vikström K, Bartl I, Karlsson J and Wikner J (2020) Strong Influence of Baseline Respiration in an Oligotrophic Coastal Ecosystem. Front. Mar. Sci. 7:572070. doi: 10.3389/fmars.2020.572070
Received: 12 June 2020; Accepted: 14 September 2020;
Published: 15 October 2020.
Edited by:
Wolfgang Koeve, GEOMAR Helmholtz Centre for Ocean Research Kiel, GermanyReviewed by:
E. Elena Garcia-Martin, National Oceanography Centre, United KingdomMatheus Carvalho, Southern Cross University, Australia
Copyright © 2020 Vikström, Bartl, Karlsson and Wikner. This is an open-access article distributed under the terms of the Creative Commons Attribution License (CC BY). The use, distribution or reproduction in other forums is permitted, provided the original author(s) and the copyright owner(s) are credited and that the original publication in this journal is cited, in accordance with accepted academic practice. No use, distribution or reproduction is permitted which does not comply with these terms.
*Correspondence: Johan Wikner, johan.wikner@umu.se