 Qiwei Yang1,2†
 Weiwei Chu3†Wei Yang2†Yanqiong Cheng4†Chuanmin Chu2Xiuwu Pan1Jianqing Ye2Jianwei Cao2*Sishun Gan2*
 Xingang Cui1,2*
- 1Department of Urology, Gongli Hospital, Shanghai, China
- 2Department of Urology, The Third Affiliated Hospital of Naval Military Medical University (Eastern Hepatobiliary Surgery Hospital), Shanghai, China
- 3Laboratory of Nano Biomedicine and International Joint Cancer Institute, Second Military Medical University, Shanghai, China
- 4Department of Pharmaceutical College, Naval Military Medical University, Shanghai, China
Objective: This study aims to identify several RNA transcripts associated with the prognosis of kidney renal clear cell carcinoma (KIRC).
Methods: The differentially expressed mRNAs, lncRNAs, and miRNAs (DEmRNAs, DElncRNAs, and DEmiRNAs) between KIRC cases and controls were screened based on an RNA-seq dataset from The Cancer Genome Atlas (TCGA) database. Subsequently, miRcode, miRDB, and TargetScan database were used to predict interactions between lncRNAs, miRNAs and target mRNAs. Then, a ceRNA network was built using miRNAs-mRNAs and lncRNAs-miRNAs pairs. Functional analysis of mRNAs in ceRNA was performed. Finally, the survival analysis of RNA transcripts in ceRNA network and correlation analysis for key RNA regulators were carried out.
Results: There were 1527 DElncRNAs, 54 DEmiRNAs, and 2321 DEmRNAs. A ceRNA network was constructed among 81 lncRNAs, 9 miRNAs, and 197 mRNAs. Functional analysis showed that numerous mRNAs were significantly associated with regulation of cellular glucuronidation. In addition, 35 lncRNAs, 84 mRNAs and two miRNAs were significantly corelated to the survival of patients with KIRC (P < 0.05). Among them, miRNA-21 and miRNA-155 were negatively related to three lncRNAs (LINC00472, SLC25A5.AS1, and TCL6). Seven mRNA targets of miRNA-21 (FASLG, FGF1, TGFBI, ALX1, SLC30A10, ADCY2, and ABAT) and 12 mRNAs targets of miRNA-155 (STXBP5L, SCG2, SPI1, C12orf40, TYRP1, CTHRC1, TDO2, PTPRQ, TRPM8, ERMP1, CD36, and ST9SIA4) also acted as prognostic biomarkers for KIRC patients.
Conclusion: We screened numerous novel prognosis-related RNA markers for KIRC patients by a ceRNA network analysis, providing deeper understandings of prognostic values of RNA transcripts for KIRC.
Introduction
Kidney renal clear cell carcinoma (KIRC) is a major subtype of renal carcinoma and originated from renal epitheliums (Drucker, 2005). Numerous studies have estimated that the morbidity and mortality of KIRC have been gradually increasing in recent years, accounting for most cancer-related deaths (Hsieh et al., 2017; Wong et al., 2017). Clinically, surgical resection has been a powerful therapeutic option for localized KIRC. Unfortunately, approximately 30% patients with localized KIRC ultimately develop malignant metastases due to high recurrence and delayed diagnosis (Hutson and Figlin, 2007; Gupta et al., 2008). Moreover, metastatic KIRC is significantly resistant to radiotherapy and chemotherapy, resulting in a poor clinical prognosis (Zall et al., 2010; De Felice and Tombolini, 2018). Therefore, it is an urgent need to identify several novel prognostic makers, which will contribute to developing effective therapeutic strategies for improving the overall survival (OS) of patients undergoing KIRC.
Previous studies have reported that many non-coding RNA transcripts such as long non-coding RNAs (lncRNAs) and microRNAs (miRNAs) were involved in molecular pathogenesis of several types of cancer, including KIRC (Khadirnaikar et al., 2019; Ye et al., 2019). More remarkably, an increasingly large number of research groups revealed that the interplays among messenger RNAs (mRNAs), lncRNA and miRNAs played essential roles in coordinating numerous complicated molecular processes, however, the dysregulation of biological pathways will lead to pathological conditions (Karreth and Pandolfi, 2013). Specifically, lncRNAs as molecular sponges can bind to miRNAs by miRNA response elements (MREs) and consequently inhibit the expression of mRNAs. Accordingly, a competitive endogenous (ceRNA) network theory is proposed and discussed the interactions among these three types of RNA transcripts (Salmena et al., 2011). Recently, the researchers have screened many RNA transcripts targets associated with the clinical outcomes of various cancers by ceRNA regulatory network analyses. For example, Wang et al. (2019) constructed a mRNA-miRNA-lncRNA network, in which several RNA transcripts were associated with the prognosis of patients with pancreatic cancer. Similarly, Lin et al. (2018) also established a ceRNA network by a genome-wide analysis of lncRNAs, miRNAs and mRNAs, which were all related to the survival of hepatocellular carcinoma patients. Moreover, they found that this network was linked with a poor prognosis by regulating the cell cycle (Lin et al., 2018). However, few studies considered to identify prognostic RNA transcripts for KIRC patients based on a lncRNA-miRNA-mRNA ceRNA network analysis.
In this study, we conducted a differential expression analysis of three types of RNA transcripts (lncRNAs, mRNAs and miRNAs) between KIRC patients and normal controls using an RNA-seq dataset from The Cancer Genome Atlas (TCGA) database. Then, a lncRNA-miRNA-mRNA ceRNA regulatory network was established to the characterize RNA transcripts. Finally, a survival analysis was carried out to evaluate the relationships of RNA transcripts and KIRC prognosis, which will provide new insights into prognostic values of RNA transcripts for KIRC patients.
Materials and Methods
Acquisition of RNA-Sequencing (RNA-Seq) Data
RNA-seq raw data from patients with KIRC was downloaded from TCGA database1 (which consisted of three types of RNA (lncRNA, miRNA and mRNA). This dataset contained 611 samples (505 samples from KIRC patients and 106 sample from healthy individuals). Those KIRC patients with missing follow-up information were excluded from this study. Finally, RNA data and clinical data from 474 tumor samples and 106 normal samples were analyzed.
Data Pre-processing and Differential Expression Analysis
The EdgeR package in R software has been successfully used for differential expression analysis of RNA-seq based on a negative binomial distribution model 14. The raw read counts of all samples were merged in a single read count matrix. The matrix was normalized and standardized by TMM (Trimmed Mean of M-values) method before the differential expression analysis. The TMM normalization method is implemented in the edgeR package by means of the calcNormFactors function. Herein, we utilized the EdgeR package to identify the differentially expressed mRNAs (DEmRNAs), lncRNAs (DElncRNAs), and miRNAs (DEmiRNAs) between KIRC tissues and normal tissues. The corresponding P-value of differential gene expression was calculated by Student’s t-test and adjusted by Benjamini and Hochberg method. The screening criteria for statistical significance were set as adjusted P < 0.05 and |log2 fold change (FC)|>2. Besides, the Volcano plots were visualized to demonstrate the distribution of differential expression of DEmRNAs, DElncRNAs and DEmiRNAs using the ggplot2 packages in R.
Construction of lncRNA-miRNA-mRNA Network
Existing evidence has suggested that there were crosstalks among several types of RNA transcripts by MREs, including lncRNAs, miRNAs and mRNAs. Accordingly, numerous studied have demonstrated that lncRNAs act as ceRNAs sponge to bind to miRNAs through MREs, thereby regulating the expression level of mRNA (Tay et al., 2014). Therefore, a ceRNA regulatory network was established to investigate associations among DElncRNAs, DEmiRNAs, and DEmRNAs. LncRNA-miRNA-mRNA pairs should share the same miRNAs. Briefly, the miRcode2, a database including more than 10,000 lncRNAs and providing putative miRNA target sites on the basis of comprehensive GENCODE3 gene annotation, was employed to predict DElncRNA-DEmiRNA pairs (Jeggari et al., 2012). Meanwhile, the interactions between DEmiRNAs and mRNAs were assessed using experimentally validated miRTarBase4 and TargetScan5 database (Tan et al., 2009; Hsu et al., 2014). The interactions that matched with DElncRNAs and DE-mRNAs were screened. Also, miRNA-lncRNA and miRNA-mRNA interactions that did not contain the same miRNA were eliminated. Subsequently, the intersecting mRNAs between predicted mRNA targets for DEmiRNAs and DEmRNAs were obtained. Finally, we used Cytoscape software 3.5.16 to construct and visualize the ceRNA network.
Functional Enrichment Analysis of DEmRNAs in ceRNA Network
To explore the underlying biological functions of DEmRNAs from the ceRNA regulatory network, the Gene Ontology (GO) functional annotation analysis was carried out by an web-based functional annotation tool, Database for Annotation, Visualization and Integrated Discovery (DAVID)7 (Ashburner et al., 2000; Dennis et al., 2003). GO analysis involved in three categories of biological process (BP), cellular component (CC), and molecular function (MF). In addition, the clusterProfiler package in R was used for Kyoto Encyclopedia of Genes and Genomes (KEGG) enrichment analysis of DEmRNAs in ceRNA network (Yu et al., 2012; Kanehisa et al., 2017). The significant GO terms and KEGG pathways were selected according to the cut of P < 0.05.
Survival Analyses
The correlations between DEmRNAs, DElncRNAs and DEmiRNAs of the ceRNA regulatory network and OS of patients suffering from KIRC were, respectively, assessed by Kaplan-Meier (KM) method and log-rank test using R Survival package8. The P < 0.05 was regarded as statistically significantly different. The DElncRNAs, DEmiRNAs and DEmRNAs that showed close association with 5-year survival were considered as key prognostic markers for KIRC patients.
Correlation Analysis
Increasing studies have reported that lncRNAs-miRNAs signatures were predominately correlated with the clinical prognosis of cancer patients. Moreover, lncRNAs participate in development and progression of various diseases through negatively regulating the expression of corresponding miRNAs (Ge et al., 2015; Zhai et al., 2017; Tian et al., 2019). Here, the Pearson’s correlation analysis of prognostic factors (DElncRNAs and DEmiRNAs) was firstly conducted. Next, those DElncRNAs-DEmiRNAs pairs that exhibited negative relationships were retained for following analysis.
Univariate and Multivariate Cox Regression Analysis
The significantly negatively regulated DElncRNAs-DEmiRNAs pairs were selected. The clinical data from 474 KIRC patients was collected and used for univariate and multivariate Cox hazards regression analysis to confirm the correlations of selected DElncRNA or DEmiRNA and the survival outcomes of patients undergoing KIRC. The correlations between the expression of key RNA transcript and different pathologic stages was evaluated. Besides, we also assessed the associations between the risk of KIRC and multiple clinical characteristics, including age, gender, pathologic stage, cancer status, neoplasm type and tumor volume. The hazard ratios (HR) with 95% confidence intervals (CI) were estimated to predict KIRC risk.
SiRNA Transfection
Small interfering RNAs (siRNA) targeting SLC25A5-AS1, LINC00472, and TCL6 (si-lnc#1 and si-lnc#2 respectively) and control siRNAs were all subscribed from Sangong Biological corporation (Songjiang, Shanghai, China). The cell transfection was carried out by the utilizing of Lipofectamine 3000 reagent kits (Invitrogen, Waltham, MA, United States) according to the protocols in the kits.
Quantitative Real Time-PCR
KIRC cells transfected with siRNAs or corresponding vectors were gathering 48 h later after incubation. Subsequently, the total RNAs were extracted from cultured cells utilizing TRIzol reagent (TaKaRa Bio Inc., Otsu Prince Hotel, Japan) for Real Time-PCR analyses. Reverse transcription of converting purified RNA to complementary DNA (cDNA) was carried out by applying the BeyoRT II cDNA synthesis kits (Beyotime Biotechnology, shanghai, China). The cDNAs were confirmed to qPCR experiments with utilizing the SYBR Green qRCR kits (TaKaRa Bio Inc., Otsu Prince Hotel, Japan) according to the manufacturer’s recommendations.
Cell Proliferation Assays
The cell growth was detected in accordance with CCK-8 kit (DOJINDO, kyushu, Japan). Briefly, 786O cells were placed into ninety-six well plates (2000 cells per well). At assigned timepoint, CCK8 reagents were added into the wells (10 μl per well). After incubated at 37°C in 5c/o CO2 for 3.5 h, the absorbance was detected at 450 nm on a microplate spectrophotometer.
Results
Identification of DElncRNAs, DEmiRNAs, and DEmRNAs,
Totally, 1527 DElncRNAs (1068 up-regulated lncRNAs and 459 down-regulated lncRNAs; Table 1), 54 DEmiRNAs (33 up-regulated miRNAs and 21 down-regulated miRNAs; Table 2), and 2321 DEmRNAs (1557 up-regulated mRNAs and 764 down-regulated mRNAs; Table 3) between KIRC group and control group were extracted according to pre-determined screening criteria. Volcano plots for DElncRNAs, DEmiRNAs, and DEmRNAs were visualized and showed their distributions (Figure 1). All of DElncRNAs, DEmiRNAs, and DEmRNAs were list in Supplementary Table S1.
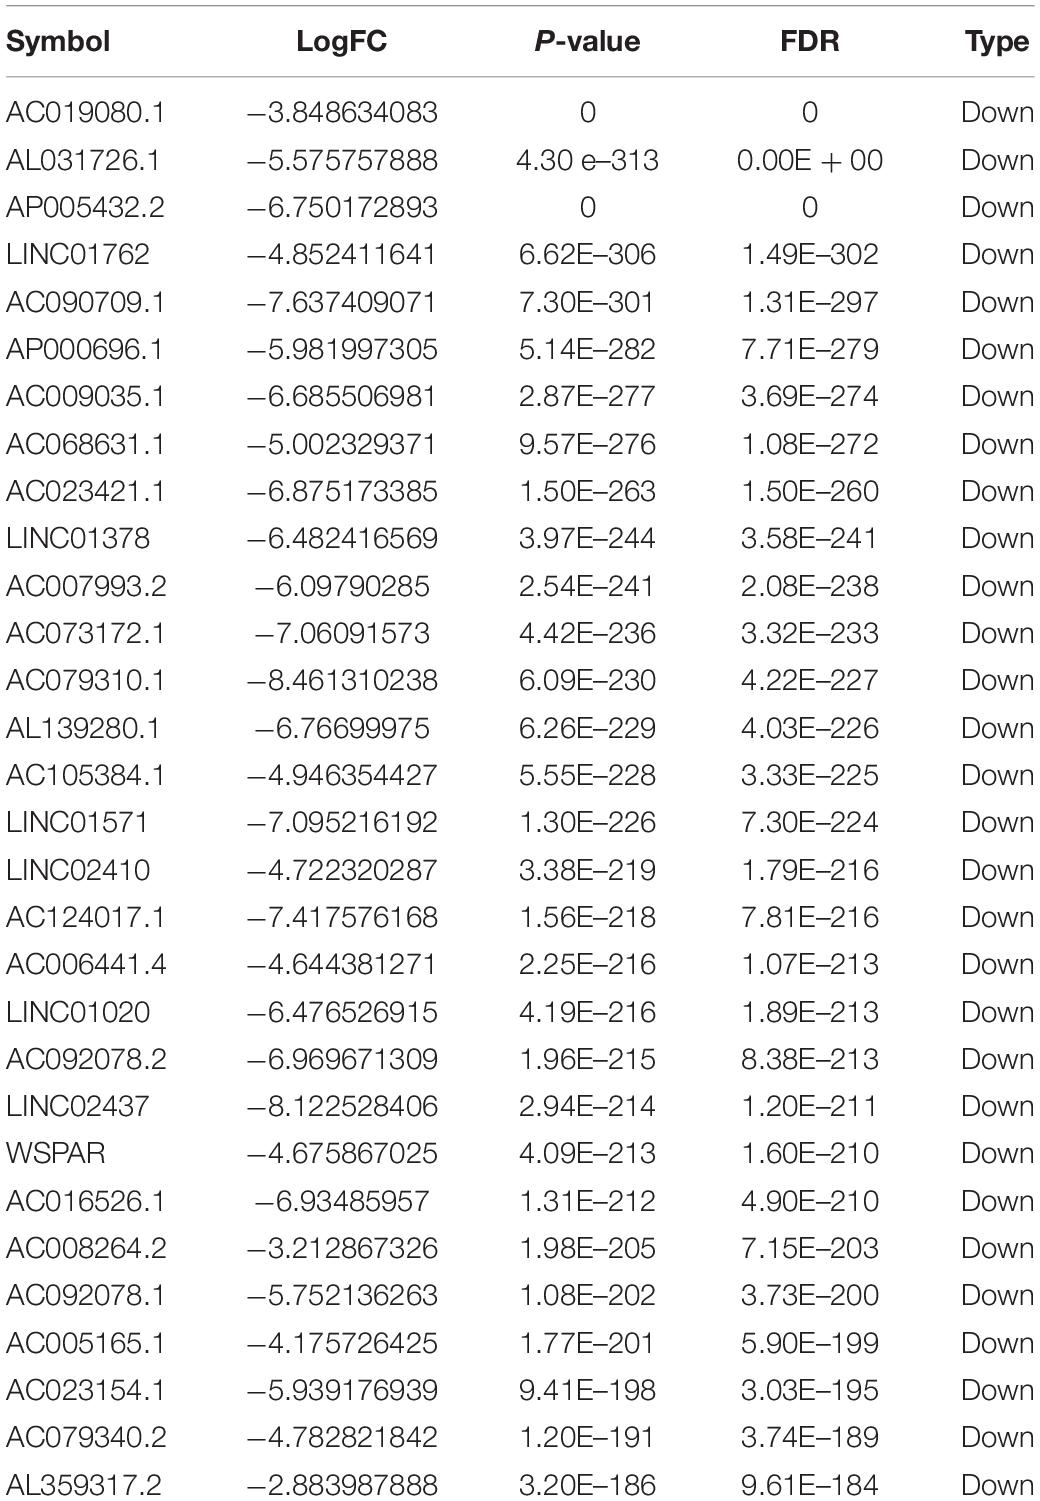
Table 1. Top 30 DElncRNAs between tumor and normal tissues in KIRC.
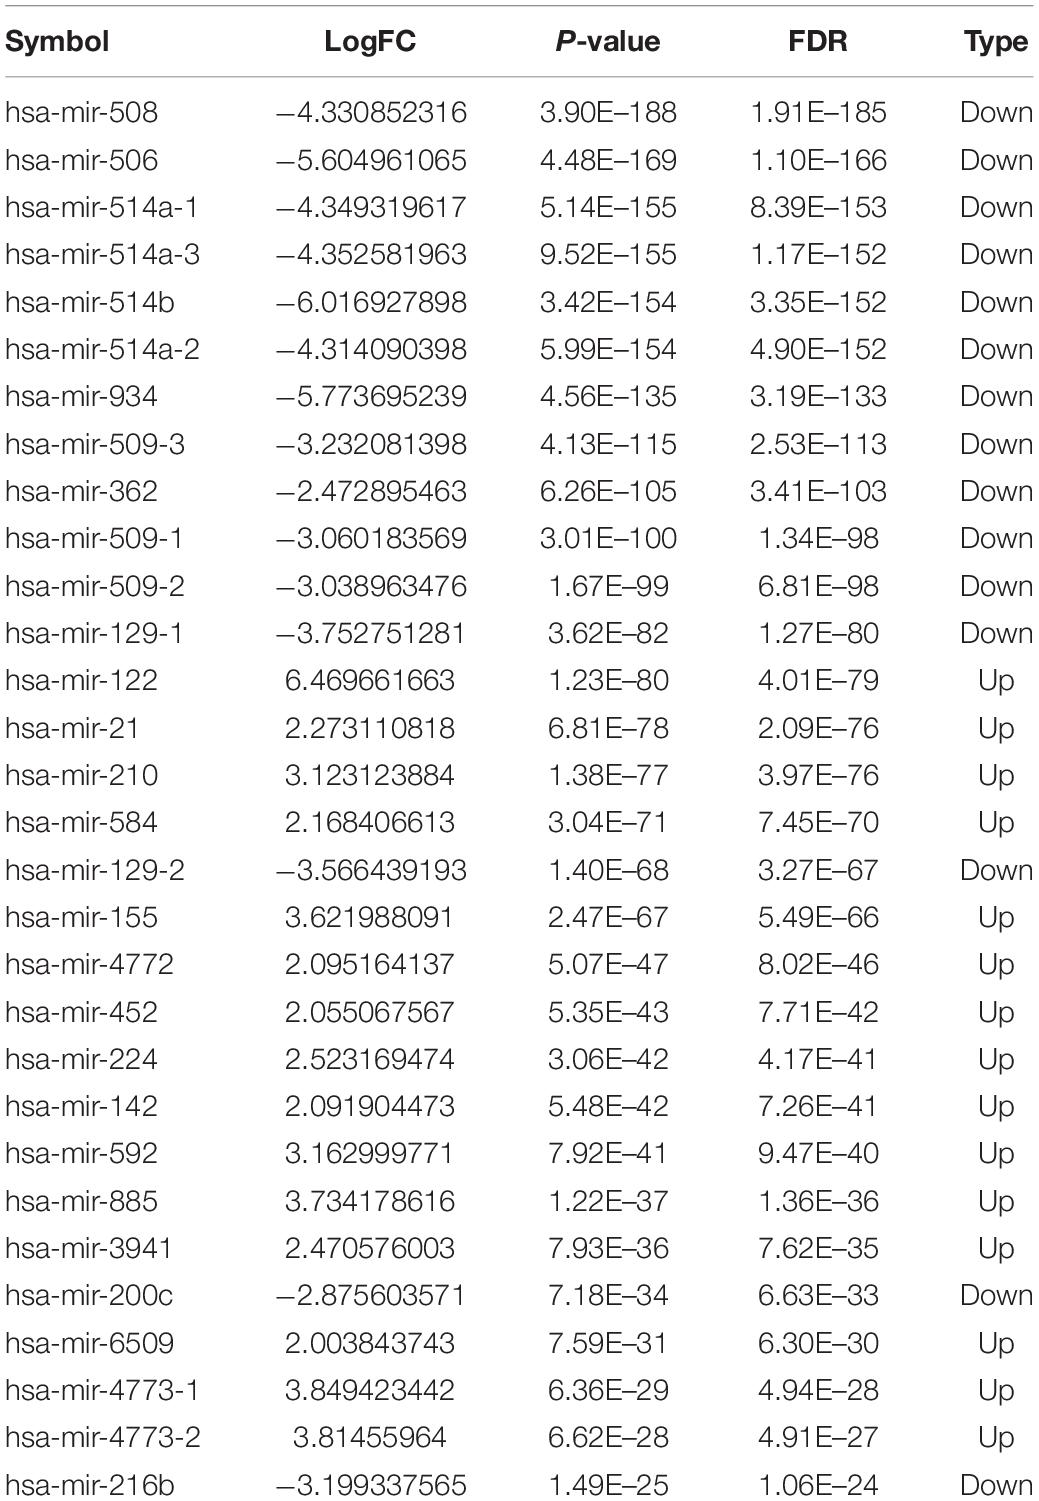
Table 2. Top 30 DEmiRNAs between tumor and normal tissues in KIRC.
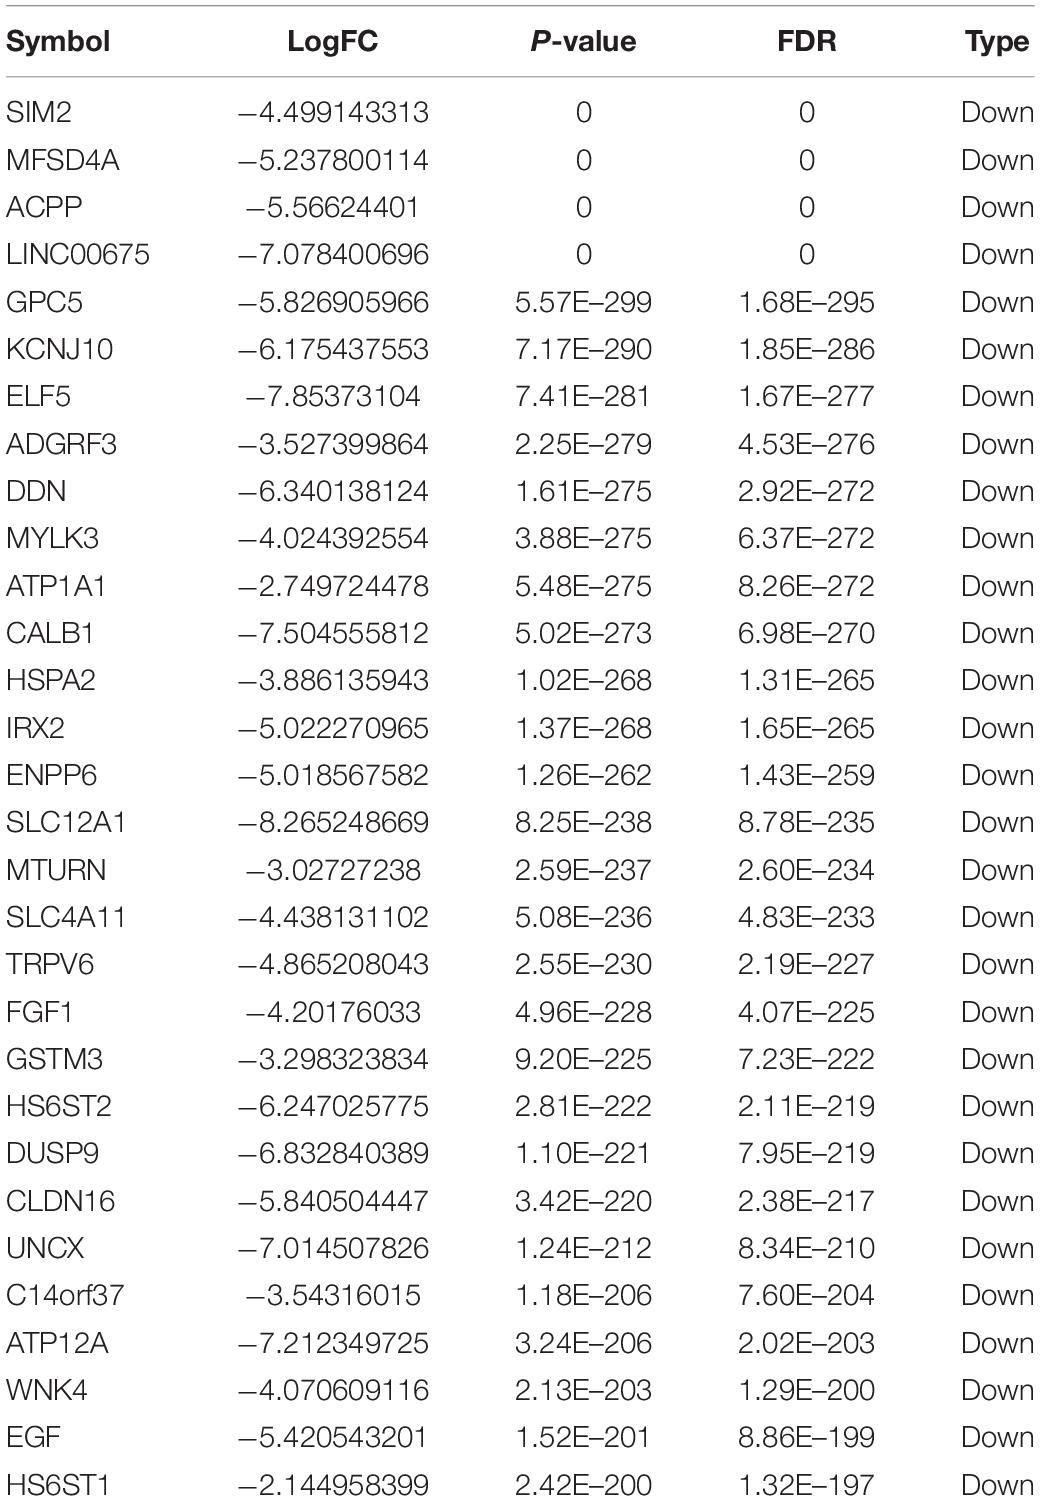
Table 3. Top 30 DEmRNAs between tumor and normal tissues in KIRC.
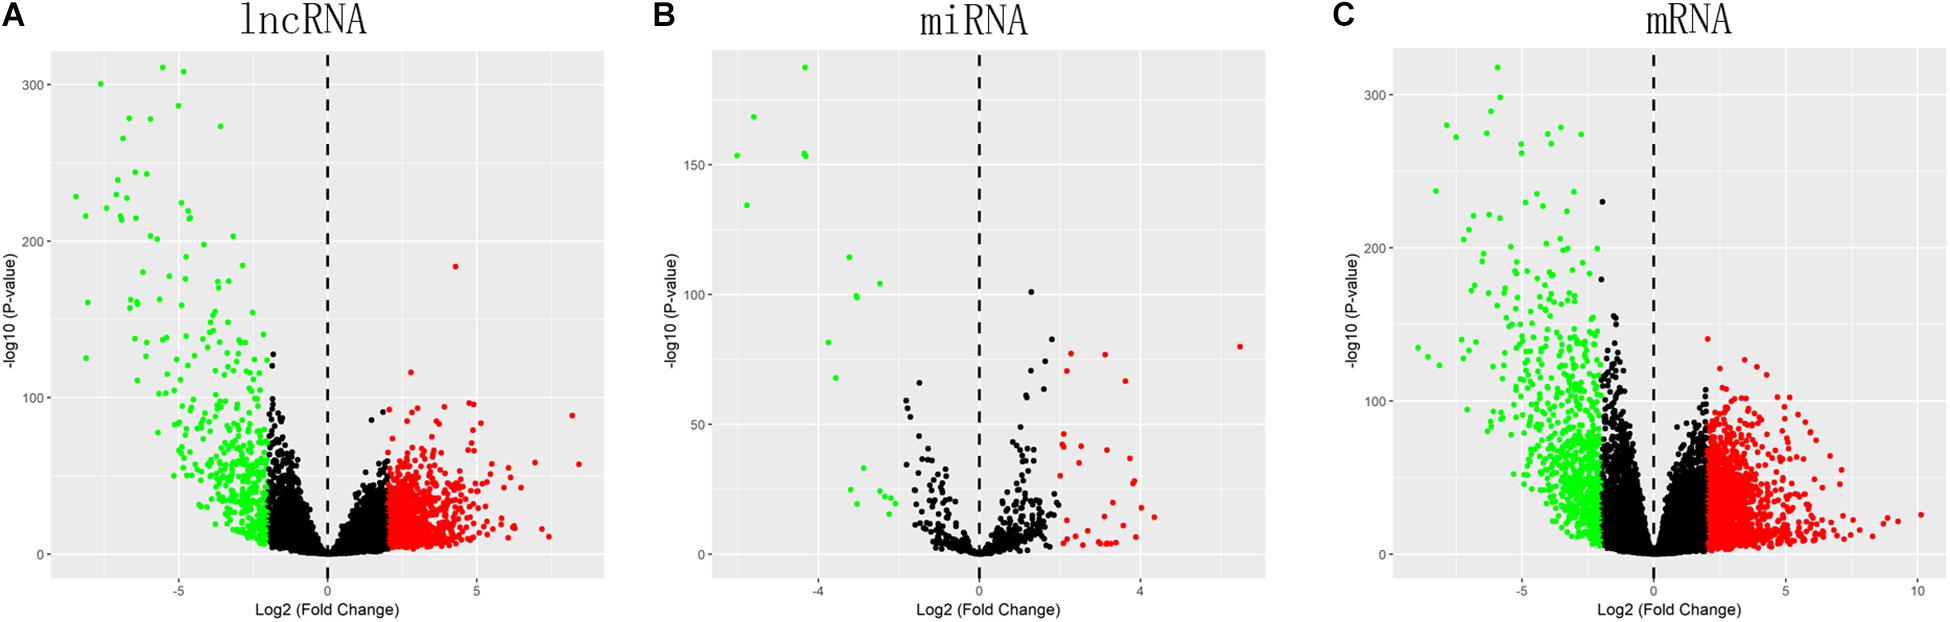
Figure 1. Volcano plots show differential expression of RNAs between KIRC group and control group. (A) DElncRNAs; (B) DEmiRNAs; (C) DEmRNAs. The red color shows the up-regulated lncRNAs, miRNAs, and mRNAs while the green color represents down-regulated lncRNAs, miRNAs, and mRNAs. KIRC: kidney renal clear cell carcinoma. DElncRNAs: differentially expressed lncRNAs; DEmiRNAs: differentially expressed miRNAs; DEmRNAs: differentially expressed mRNAs.
Construction of ceRNA Network
The predictive analysis for interactions between DElncRNAs and DEmiRNAs revealed that there were 174 DElncRNAs-DEmiRNAs pairs, including 81 DElncRNAs and 9 DEmiRNAs. Furthermore, two databases (miRTarBase and TargetScan) were utilized to predict the mRNA targets of 9 DEmiRNAs and a total of 197 DEmRNAs were intersected with predicted mRNAs. Afterward, 212 pairs of DEmiRNAs and DEmRNAs were determined, including 197 DEmRNAs and 9 DEmiRNAs. Ultimately, the DElncRNAs-DEmiRNAs-DEmRNAs ceRNA network was constructed using Cytoscape 3.5.1, which contained 81 DElncRNAs, 9 DEmiRNAs and 197 DEmRNAs (Supplementary Table S2 and Figure 2).
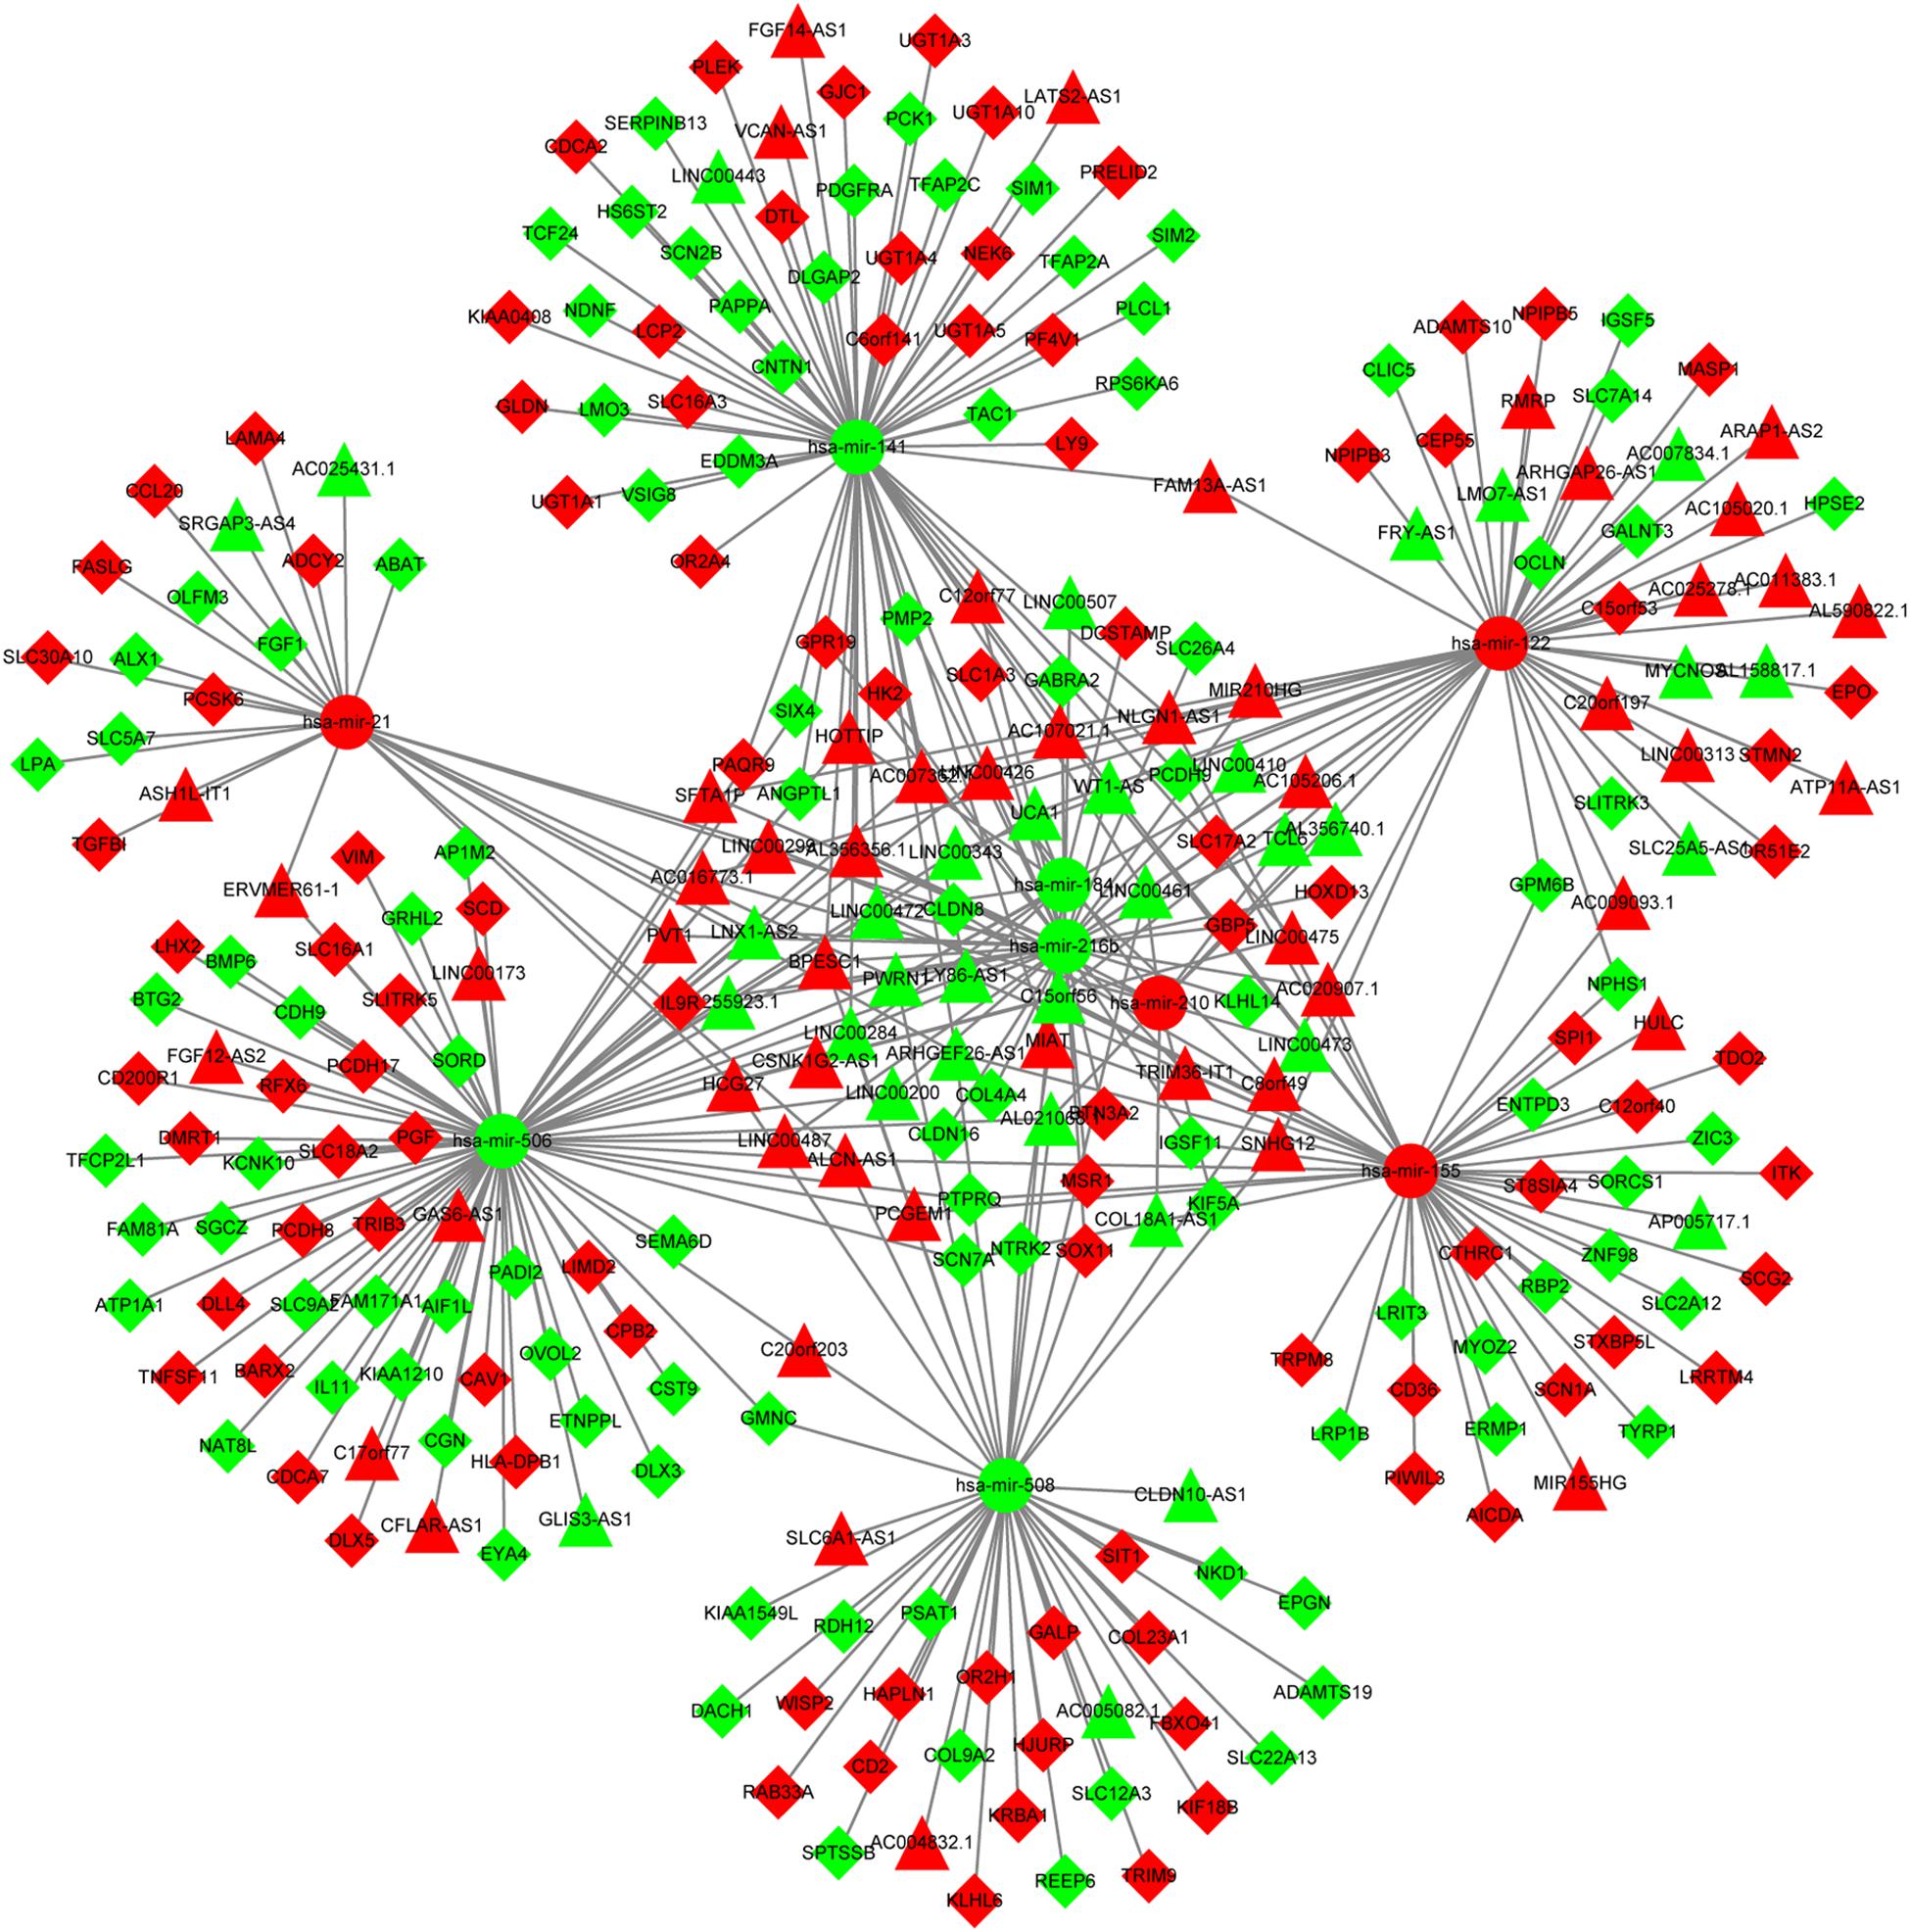
Figure 2. The ceRNA network of lncRNA-miRNA-mRNA. The circles represent miRNAs. The triangles show lncRNAs. The rhombuses represent mRNAs. The red nodes show up-regulated expression while the green nodes represent down-regulated expression. ceRNA, competing endogenous RNA; lncRNA, long non-coding RNA; miRNA, microRNA.
Functional Analyses
The GO and KEGG functional analysis were carried out to understand potential roles of DEmRNAs on KIRC. We found that these mRNAs were involved in 64 GO-BP terms, 17 GO-CC terms and 19 GO-MF terms. Specifically, the top three GO-BP terms were xenobiotic glucuronidation, flavonoid biosynthetic process and negative regulation of cellular glucuronidation (Supplementary Table S3). Meanwhile, the overwhelming majority of mRNAs were predominately correlated with three GO-CC terms, including integral component of membrane, proteinaceous extracellular matrix and extracellular space (Supplementary Table S3). For GO-MF analysis, the mRNAs played essential roles in multiple significantly enriched terms, such as glucuronosyltransferase activity and retinoic acid binding (Supplementary Table S3). In addition, KEGG enrichment analysis suggested that the mRNAs were markedly enriched in 16 KEGG pathways, including pentose and glucuronate interconversions, ascorbate and aldarate metabolism and retinol metabolism pathway (Supplementary Table S3).
Survival Analysis
To further assess the potential prognostic values of lncRNAs, miRNAs, and mRNAs in ceRNA, the corresponding KM survival analyses were conducted. The results indicated that 35 lncRNAs, 84 mRNAs and two miRNAs (up-regulated miRNA-21 and miRNA-155) were dramatically related to 5-year survival of patients undergoing KIRC (P < 0.05). More notably, lncRNAs participate in molecular mechanisms of cancerogenesis through sponging miRNAs, in which lncRNAs are generally negatively associated with miRNAs. Herein, we performed a Pearson’s correlation coefficient analysis between prognosis-related lncRNAs and miRNAs. The results revealed that there were significantly negative correlations between miRNA-21 and 14 lncRNAs. Moreover, miRNA-21-LINC00472 (P = −0.337), miRNA-21-SLC25A5.AS1 (P = −0.330) and miRNA-21-TCL6 (P = −0.284) were top three pairs with the strongest relationships (Supplementary Table S4 and Figure 3). For miRNA-155, we noted that it was inversely related to 10 lncRNAs (Supplementary Table S4). Interestingly, there were also the most dramatical interactions between miRNA-155 and LINC00472, SLC25A5.AS1, and TCL6 (miRNA-155-LINC00472, P = −0.212; miRNA-21-SLC25A5.AS1, P = −0.193; and miRNA-21-TCL6, P = −0.154; Supplementary Table S4 and Figure 3). Moreover, we noted that higher expression of miRNA-21 and miRNA-155 exhibited better clinical outcomes while decreased levels of three lncRNAS (LINC00472, SLC25A5.AS1, and TCL6) were strongly associated with good prognosis by the survival analysis, which implied that these RNA transcripts may act as pivotal risk factors in KIRC progression (Figure 4). In addition, there were close relationships between miRNA-21 and seven prognosis-related mRNAs in ceRNA regulatory network, including adenylate cyclase 2 (ADCY2), down-regulated 4-aminobutyrate aminotransferase (ABAT), fibroblast growth factor 1 (FGF1), up-regulated fas ligand (FASLG), transforming growth factor beta induced (TGFBI), ALX homeobox 1 (ALX1), and solute carrier family 30 member 10 (SLC30A10). Moreover, we discovered that increased expression of FASLG, FGF1, TGFBI, ALX1, and SLC30A10 showed favorable clinical survival but raised levels of ADCY2 and ABAT indicated worse outcomes (Figures 5A–G). Similarly, miRNA-155 strongly interacted with 12 prognosis-associated mRNAs according to ceRNA analysis, including syntaxin binding protein 5 like (STXBP5L), secretogranin II (SCG2), endoplasmic reticulum metallopeptidase 1 (ERMP1), Spi-1 proto-oncogene (SPI1), chromosome 12 open reading frame 40 (C12orf40), tyrosinase related protein 1 (TYRP1), collagen triple helix repeat containing 1 (CTHRC1), tryptophan 2,3-dioxygenase (TDO2), CD36 molecule (CD36; up-regulation), ST8 alpha-N-acetyl-neuraminide alpha-2,8-sialyltransferase 4 (ST8SIA4), protein tyrosine phosphatase receptor type Q (PTPRQ), and transient receptor potential cation channel subfamily M member 8 (TRPM8). Higher expressions of nine mRNAs (STXBP5L, SCG2, SPI1, C12orf40, TYRP1, CTHRC1, TDO2, PTPRQ, and TRPM8) were correlated with better survival (Figures 5H–P). However, elevated expression levels of ERMP1, CD36 and ST8SIA4 were linked with poor prognosis (Figures 5Q–T).
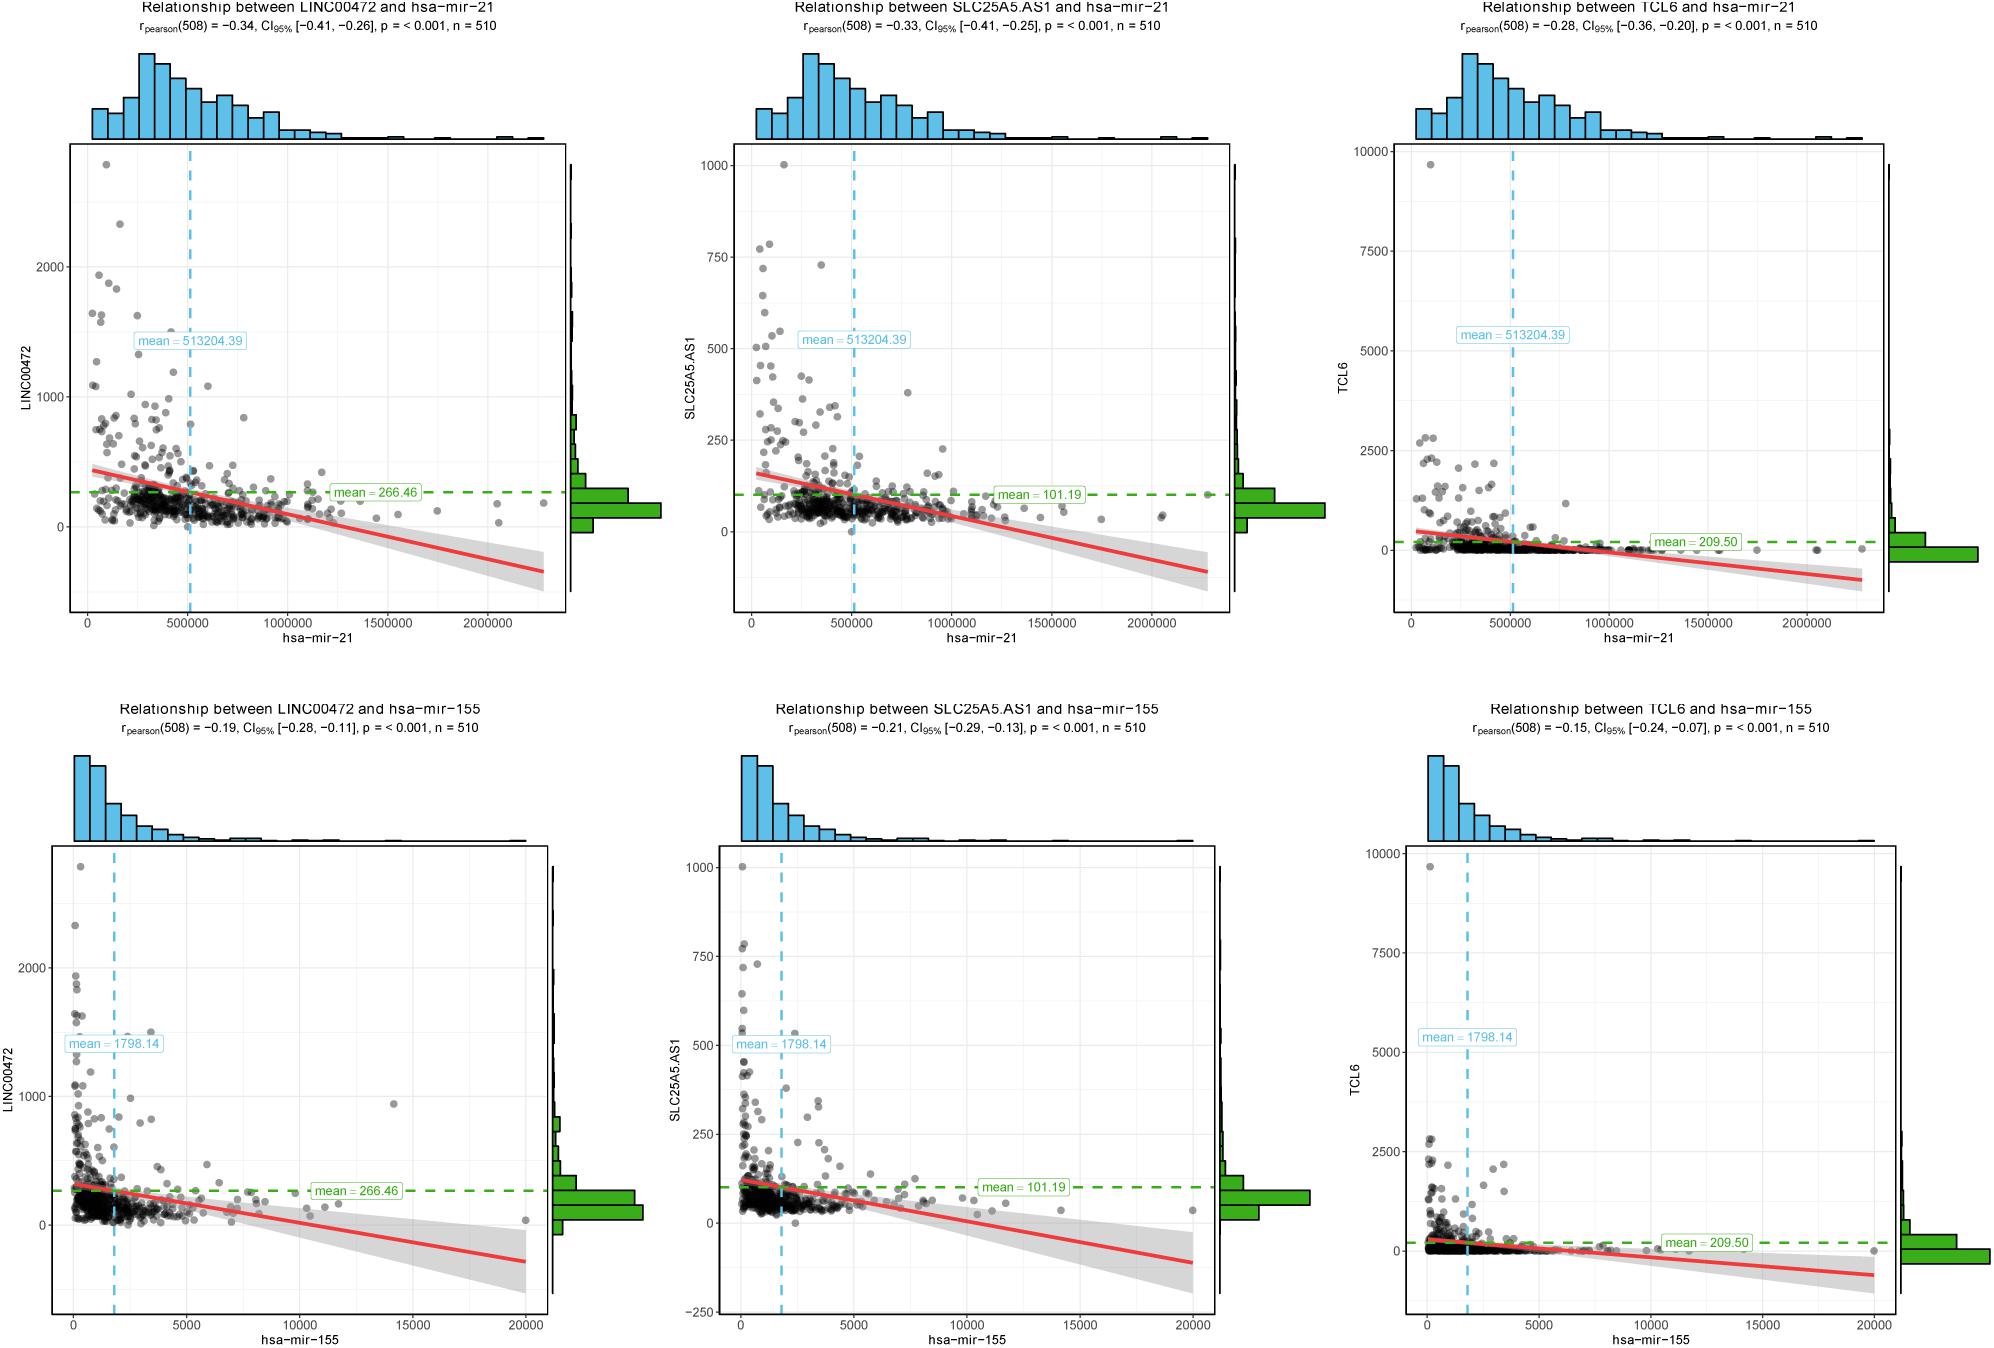
Figure 3. The correlation analysis of two miRNAs and corresponding negatively related lncRNAs. Two miRNAs (miRNA-21 and miRNA-155) negatively interacted with three lncRNAs (LINC00472, SLC25A5.AS1, and TCL6). The horizontal axis represents miRNAs and vertical axis represents lncRNAs.

Figure 4. Kaplan–Meier survival curves for two miRNAs and three lncRNAs. (A) LINC00472, (B) SLC25A5.AS1, (C) TCL6, (D) miRNA-21, and (E) miRNA-155. The horizontal axis presents the survival time while the vertical axis presents the survival rate. The green curve represents the low expression group while black curve shows high expression group. MiRNAs, microRNAs; lncRNAs, long non-coding RNAs.
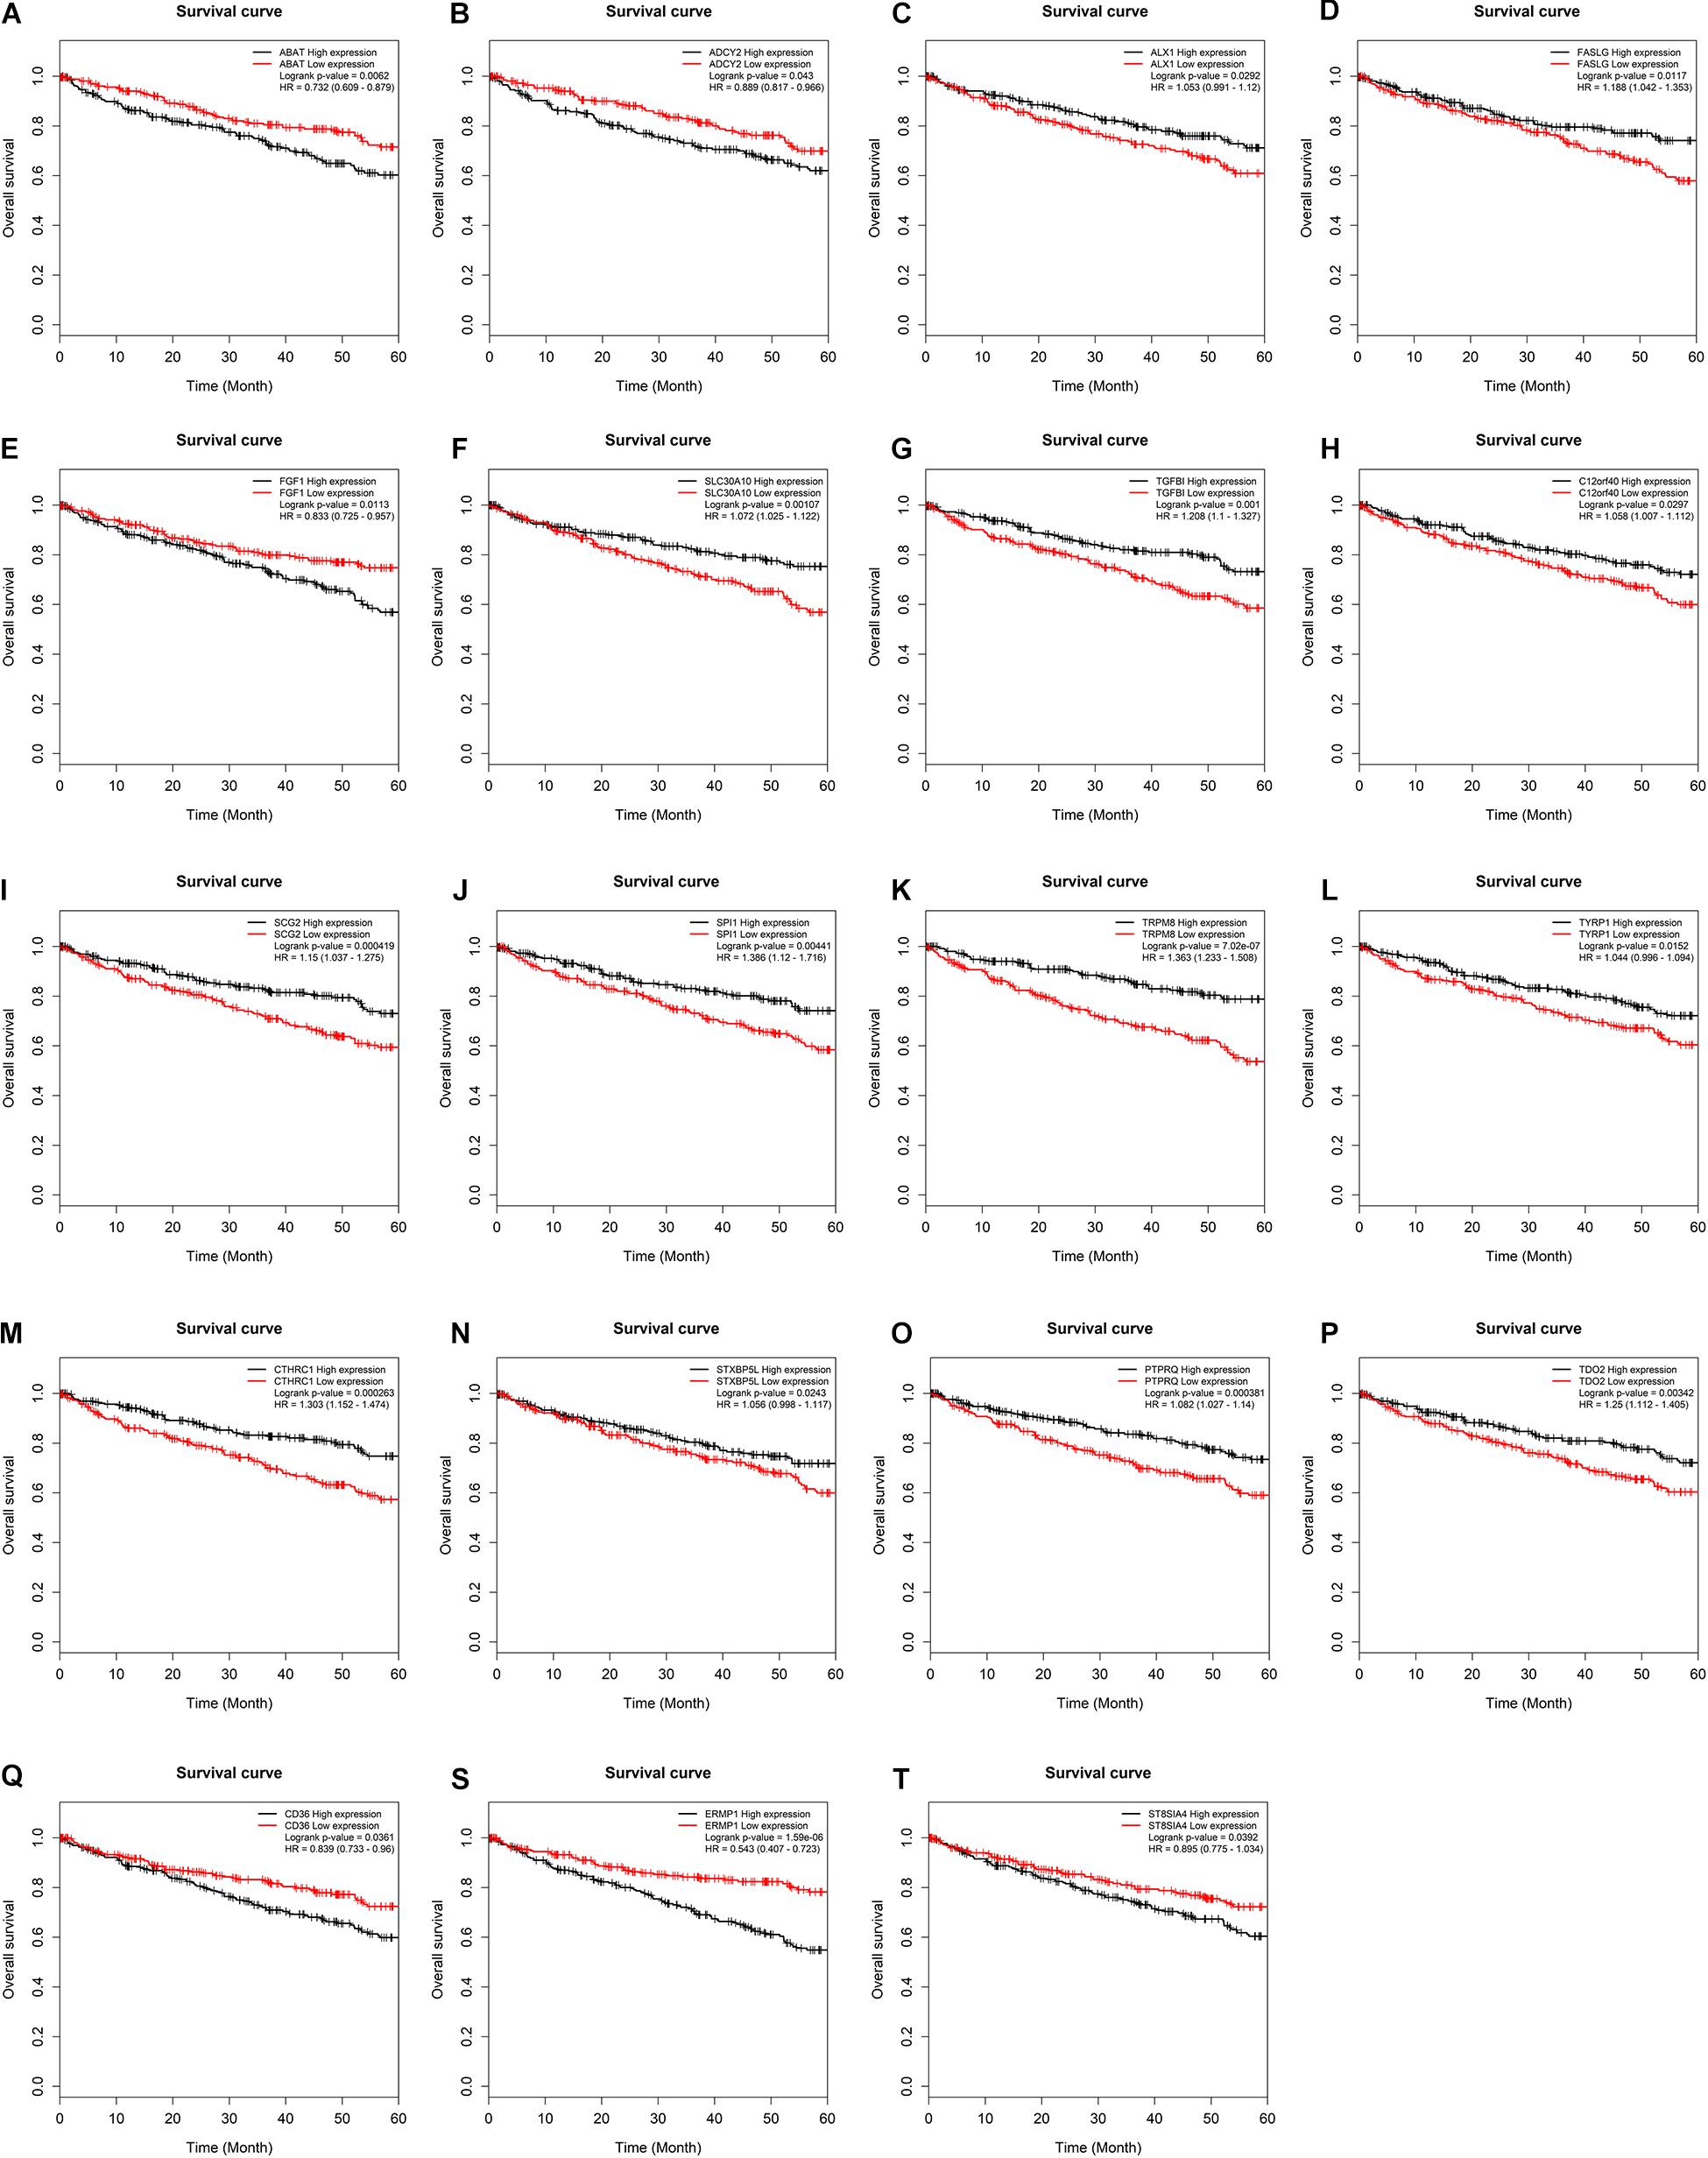
Figure 5. Kaplan–Meier survival curves for key mRNAs. (A) ABAT, (B) ADCY2, (C) ALX1, (D) FASLG, (E) FGF1, (F) SLC30A10, (G) TGFBI, (H) C12orf40, (I) SCG2, (J) SPI1, (K) TRPM8, (L) TYRP1, (M) CTHRC1, (N) STXBP5L, (O) PTPRQ, (P) TDO2, (Q) CD36, (S) ERMP1, (T) ST8SIA4. The horizontal axis presents the survival time while the vertical axis presents the survival rate. The green curve represents the low expression group while black curve shows high expression group.
Risk Evaluation of the Key lncRNA and miRNA With Overall Survival of KIRC Patients
Many previous studies suggested that LINC00472 and miRNA-21 served as significant predictors for the survival of KIRC patients (Zaman et al., 2012; Yang et al., 2018; Yu et al., 2018). We assessed the associations between key RNA transcripts (SLC25A5-AS1 and miRNA-21) and the clinical survival of patients with KIRC. The corresponding P-values with 95% CI were calculated to predict patients’ survival risk. We found that SLC25A5-AS1 and miRNA-21 were strongly related to the risk of KIRC occurrence according to the univariate Cox analysis (SLC25A5-AS1, HR = 0.610, 95% CI: 0.438–0.848, P = 0.003; miRNA-21, HR = 1.908, 95% CI: 1.37–2.657, P < 0.001; Table 4). Furthermore, the multivariate Cox analysis indicated that SLC25A5-AS1 was the independent prognostic factor of KIRC (HR = 0.836, 95% CI: 0.587–1.190, P = 0.032; Table 4). Besides, the relationships between clinicopathological features and KIRC risk were also evaluated. Our findings showed that age, pathological stage and cancer status were dramatically associated with the risk of KIRC patients (Table 4). Afterward, the correlations between SLC25A5-AS1 and the clinical features of patients with KIRC were also evaluated. The results showed that SLC25A5-AS1 was related to clinical stage, pathological stage and tumor volume (Table 5). Accordingly, we observed that there was the highest expression of SLC25A5-AS1 in KIRC patients under pathological stage IV, suggesting that SLC25A5-AS1 may be a key target for predicting KIRC progression (Figure 6).
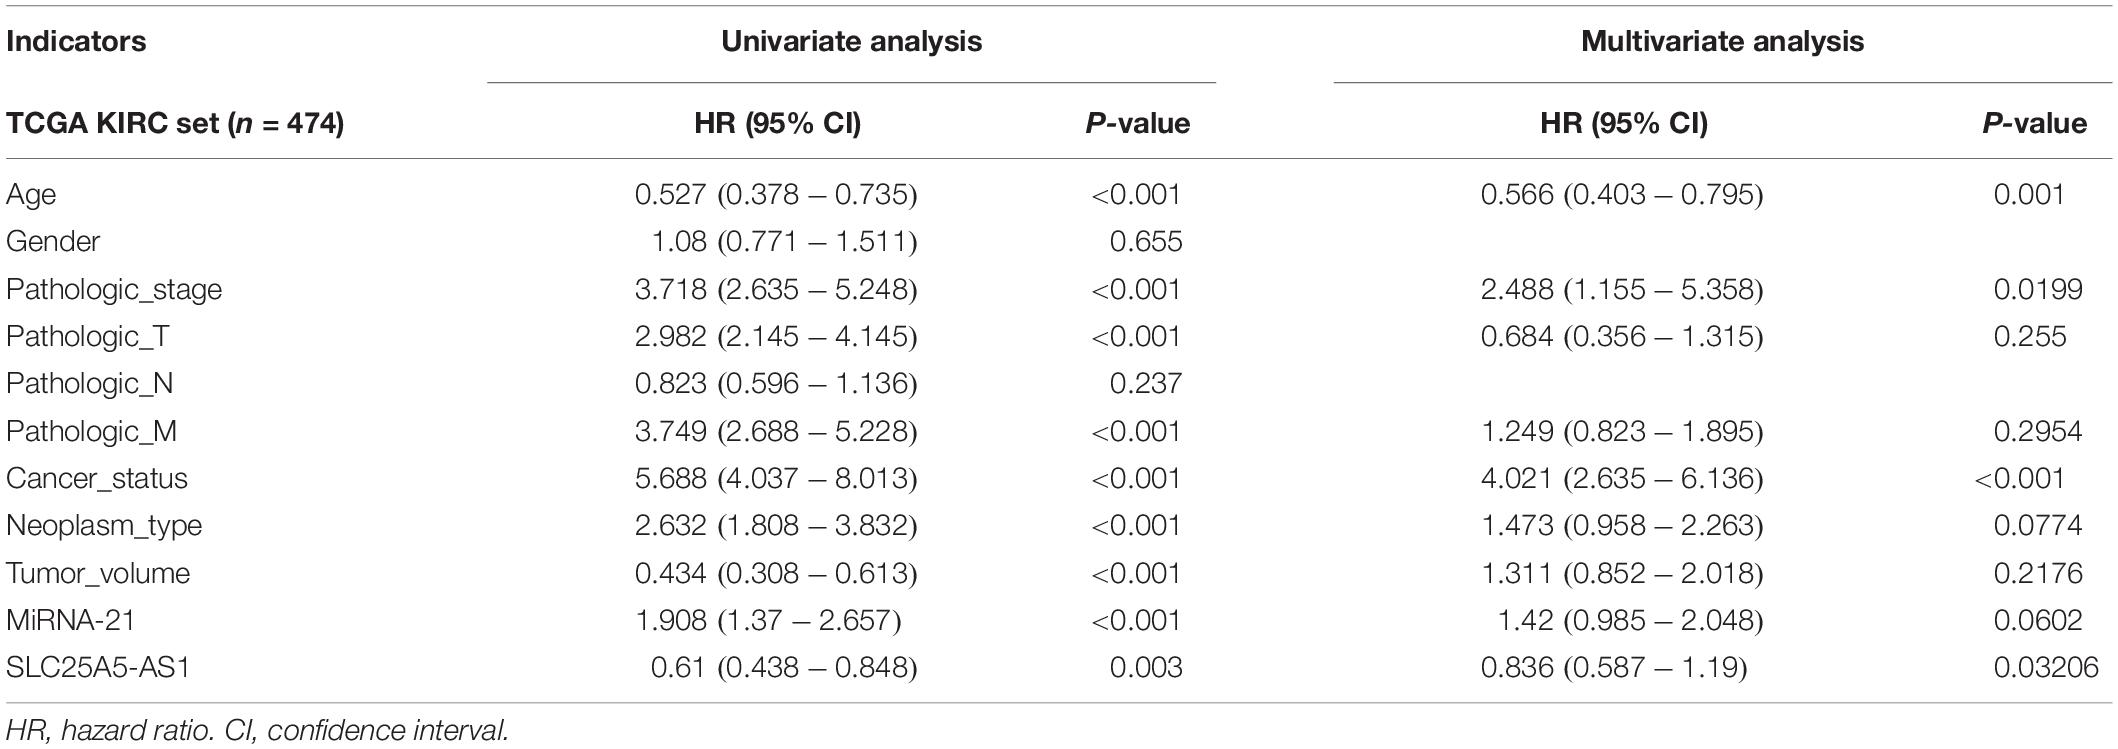
Table 4. Univariate and multivariate analyses of clinicopathological characteristics, SLC25A5-AS1 and miRNA-21 with overall survival in TCGA KIRC cohort.
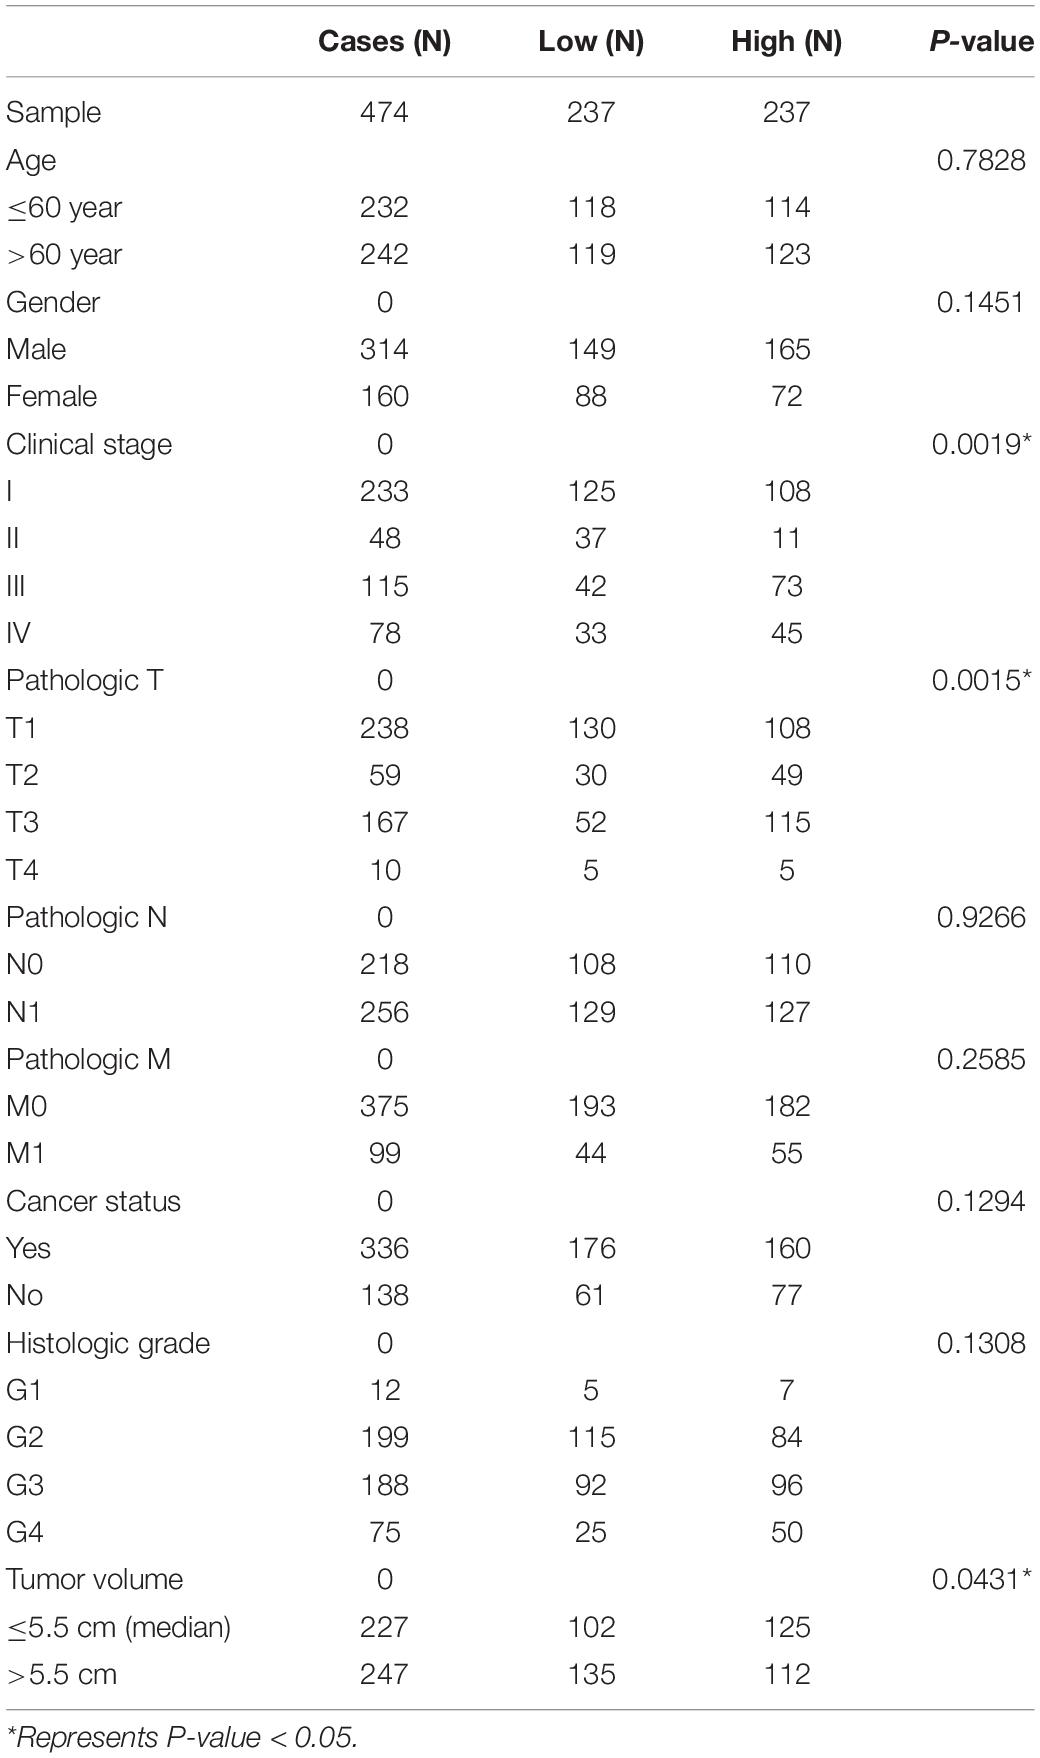
Table 5. The relationship between CRHBP and clinical features with KIRC patients in TCGA.
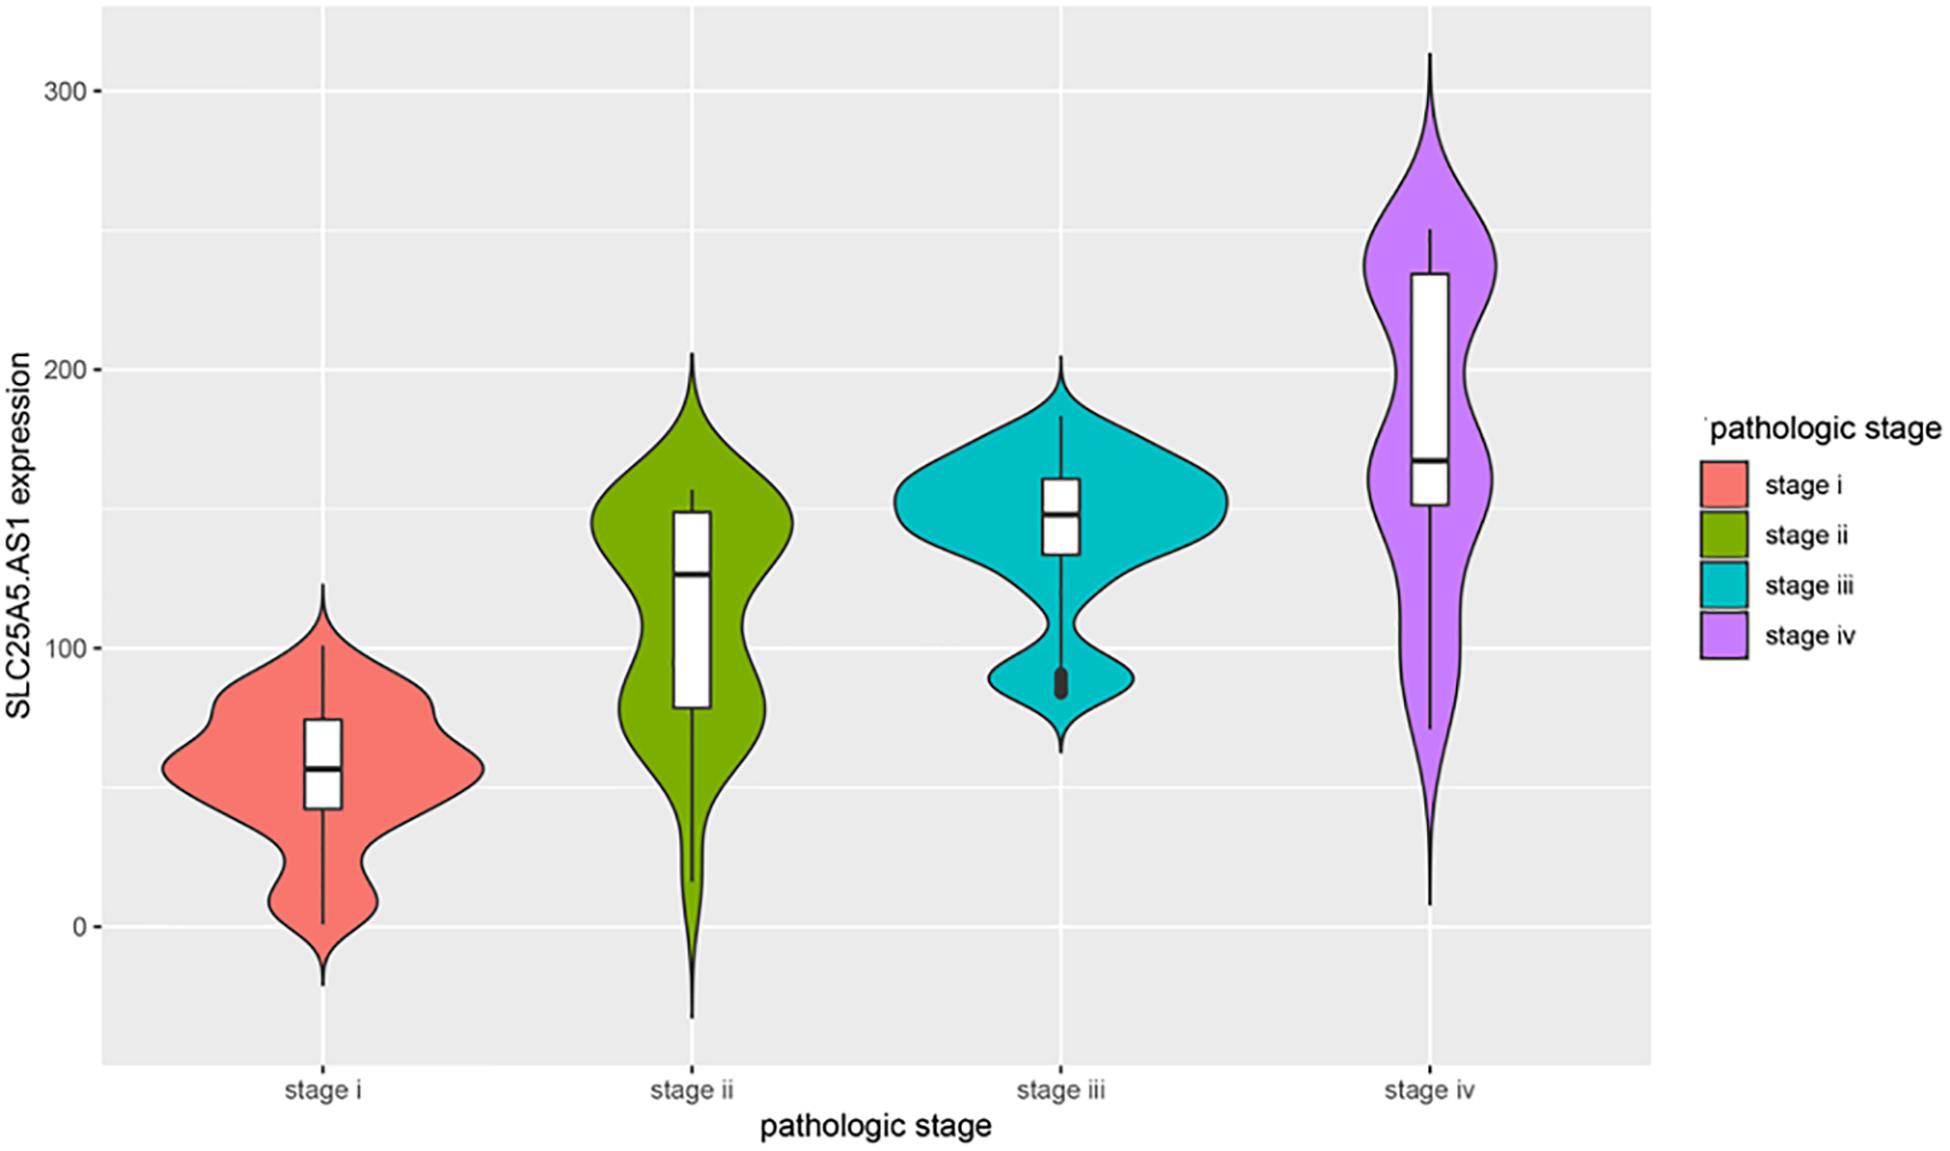
Figure 6. The violin plot of the relationships between SLC25A5.AS1 expression and pathological stages. The correlations between four pathological stages and the expression level of SLC25A5.AS1 were evaluated. The horizontal axis presents the different pathological stage while the vertical axis presents the expression level of SLC25A5.AS1.
The Expression of SLC25A5-AS1, LINC00472, and TCL6 in KIRC Specimens
To verify the bioinformatics analysis, we performed qRT-PCR assays to evaluate the SLC25A5-AS1, LINC00472, and TCL6 levels in KIRC samples and adjacent normal tissues. The results illuminated that the SLC25A5-AS1 levels were down-regulated in KIRC samples in comparison to the adjacent normal tissues (Figure 7A). Nevertheless, LINC00472 and TCL6 were up-regulated in KIRC samples compared with adjacent normal tissues (Figures 7B,C).
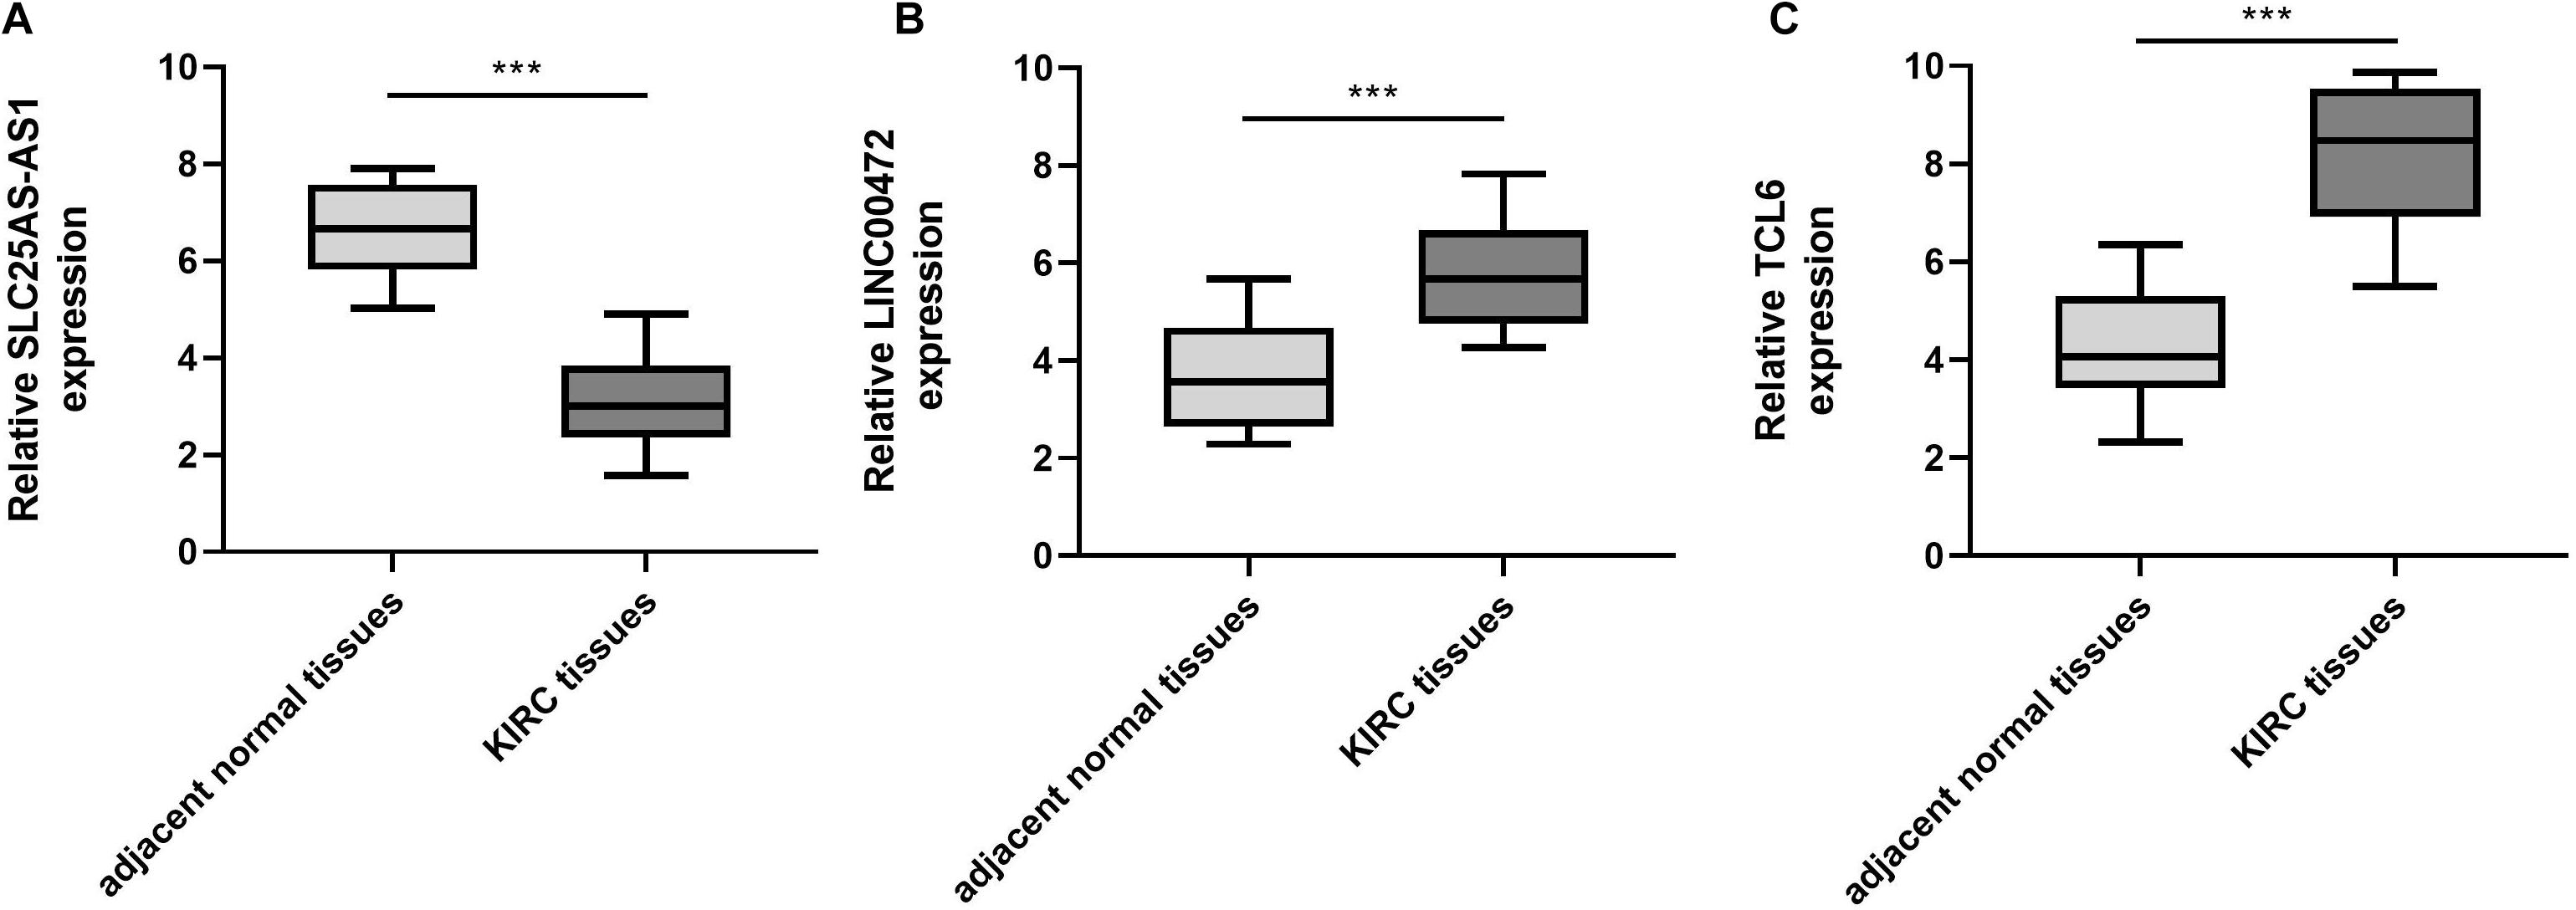
Figure 7. SLC25A5-AS1 was under-expressed, LINC00472 and TCL6 was highly expressed, in KIRC tissues in comparison to adjacent normal tissues. (A–C) qRT-PCR was performed for the examination of SLC25A5-AS1, LINC00472 and TCL6 levels in KIRC tissues and adjacent normal tissues. *p < 0.05, **p < 0.01, ***p < 0.001. KIRC, kidney renal clear cell carcinoma.
Knocking Out SLC25A5-AS1, LINC00472, and TCL6 Will Inhibit or Promote the Proliferation of KIRC Cells
To demonstrate the effect of SLC25A5-AS1, LINC00472, and TCL6 on cellular growth of KIRC cells, we carried out loss of function studies using SLC25A5-AS1, LINC00472, and TCL6 siRNAs. Real Time-PCR analysis showed that SLC25A5-AS1 siRNAs, LINC00472 siRNAs, and TCL6 siRNAs, which constructed si-lnc#1 and si-lnc#2 respectively, successfully knocked out the expression of SLC25A5-AS1, LINC00472, and TCL6 in KIRC cells (Figure 8A). Subsequently, the results from CCK-8 experiments uncovered that the proliferation of KIRC cells were obviously suppressed by silencing SLC25A5-AS1 expression. Nonetheless, the growth of KIRC cells were notably promoted by depressing LINC00472 and TCL6 expression (Figure 8B).

Figure 8. SLC25A5-AS1 promoted, LINC00472 and TCL6 inhibited, proliferation of 786O cells. (A) SLC25A5-AS1, LINC00472, and TCL6 levels in 786O cells were measured by qRT-PCR analyses. (B) CCK8 assays detected the cellular growth of 786O cells when SLC25A5-AS1, LINC00472, and TCL6 were knocked out. *p < 0.05, **p < 0.01, ***p < 0.001.
Discussion
In the present study, we performed a comprehensive bioinformatics analysis using RNA-seq data from TCGA database to identify key RNA transcript signatures associated with the clinical survival of KIRC patients. Totally, 1527 DElncRNAs, 54 DEmiRNAs, and 2321 DEmRNAs were screened between KIRC group and control group. Subsequently, a lncRNA-mediated ceRNA network was built among 81 DElncRNAs, 9 DEmiRNAs and 197 DEmRNAs. Moreover, 35 lncRNAs, 84 mRNAs, and two miRNAs (up-regulated miRNA-21 and miRNA-155) were significantly associated with OS of patients with KIRC. Moreover, there were the strongest negative interactions between miRNA-21/miRNA-155 and three prognosis-related lncRNAs (LINC00472, SLC25A5.AS1, and TCL6). Accordingly, the Cox regression analysis also revealed that SLC25A5-AS1 and miRNA-21 were dramatically linked with KIRC risk.
SLC25A5-AS1 is an anti-sense lncRNA and located in X chromosome q24. Our result suggested SLC25A5-AS1 was down-regulated in KIRC patients compared to those healthy individuals. Moreover, SLC25A5-AS1 was closely related to the risk of KIRC Consistent with this, Yang et al. (2018) previously also constructed a ceRNA network based on a TCGA dataset and evaluated prognostic values of significant lncRNAs. They emphasized that SLC25A5-AS1 was under-expressed in KIRC tissues in comparison to adjacent normal tissues and associated with OS of KIRC patients. Notably, their finding showed an increased expression SLC25A5-AS1 was related to a favorable prognosis. However, our survival analysis indicated that a lower expression of SLC25A5-AS1 exhibited a better clinical outcome for patients suffering from KIRC. Possible explanations were the differences from sample size and the duration of follow-up. Interestingly, we also noted that SLC25A5-AS1 expression was positively correlated with pathogenic stage. There was the highest level of SLC25A5-AS1 in KIRC patients under pathogenic IV. Additionally, Li et al. (2019) pointed out SLC25A5-AS1 sponging miR-19a-3p restrained gastric cancer cell growth but increased apoptosis through PTEN/PI3K/AKT signaling pathway. We noted that SLC25A5-AS1 negatively interacted with miRNA-21. Differential expression analysis suggested that there was a higher level of miRNA-21 in KIRC samples than normal controls. Moreover, elevated expression of miRNA-21 was correlated with good survival outcomes. A growing body of research has demonstrated that miRNA-21 acted as a key predictor for KIRC. For example, Szabó et al. (2016) revealed that miRNA-21 was over-expressed in KIRC and strongly linked with metastasis and survival of KIRC patients. Later on, Xie et al. (2018) argued that a four-miRNA (miRNA-21-5p, miRNA-9-5p, miR-149-5p, and miRNA-30b-5p) axis could predict the clinical outcomes of patients undergoing KIRC. These studies provided direct evidence for our conclusion that miRNA-21 was a promising prognostic factor for KIRC. We also found that miRNA-21 closely interacted with seven mRNAs (ADCY2, ABAT, FGF1, FASLG, TGFBI, ALX1, and SLC30A10) in ceRNA regulatory network. Accumulating evidence demonstrated that FASLG, a member of the tumor necrosis factor superfamily, participated in the pathogenetic mechanisms of KIRC (Elsässer-Beile et al., 2003; Donskov et al., 2004; Xu T.R. et al., 2019).
Sejima et al. (2012) highlighted that there was a remarkable worse survival for renal cell carcinomas (RCC) patients with FASLG mRNA-positive expression after radical nephrectomy in comparison to those with FASLG mRNA-negative expression, which was similar to our finding that FASLG expression was increased in KIRC patients and decreased level of FASLG exhibited good clinical prognosis. ABAT is central to the catabolism of gamma-aminobutyric acid, an inhibitory neurotransmitter in the mammalian central nervous system (Owens and Kriegstein, 2002). Chen et al. (2018) firstly discovered ABAT was dysregulated in patients with RCC compared with healthy controls and involved in the propanoate metabolism pathway by analyzing two microarray datasets (GSE53757 and GSE40435). Herein, our analysis showed that ABAT was down-regulated and its under-expression of ABAT was related to favorable prognosis of KIRC patients. TGFBI is located on chromosome 5q31.1, which played pivotal roles in pathologic responses of various cancers including RCC (Matsuda et al., 2008; Boguslawska et al., 2016; Pan et al., 2018). We found that higher TGFBI expression showed a better clinical prognosis for patients with KIRC. Moreover, elevated levels of FGF1, ALX1, and SLC30A10 were correlated with oncogenic outcomes while decreased level of ADCY2 was linked with good outcomes for KIRC patients. However, few groups considered the potential associations between these gene makers and survival prognosis of patients suffering from KIRC patients.
Our results also revealed that other two key lncRNAs (up-regulated LINC00472 and TCL6) may be underlying prognostic makers for the KIRC patient survival. The KIRC patients with lower expression of LINC00472 and TCL6 had better prognosis. Similarly, Wang et al. also argued that LINC00472 and TCL6 acted as independent prognostic factors for predicting clinical outcomes of KIRC patients (Wang et al., 2018). Interestingly, these two lncRNAs were strongly associated with miRNA-21 and miRNA-155. Previous studies suggested that miRNA-155 was implicated with pathogenesis of renal carcinogenesis (Klimczak et al., 2017; Shiomi et al., 2019). Chen et al. conducted an integrative bioinformatics analysis based on a Gene Expression Omnibus dataset and indicated that miRNA-15 was involved in initiation and development of KIRC (Chen et al., 2016). Our analysis showed that the over-expression of miRNA-15 was significantly linked with good prognosis. More remarkably, there was close relationships between miRNA-15 and 12 mRNAs (STXBP5L, SCG2, SPI1, C12orf40, TYRP1, CTHRC1, TDO2, PTPRQ, TRPM8, ERMP1, CD36, and ST9SIA4). Interestingly, increased expressions of STXBP5L, SCG2, SPI1, C12orf40, TYRP1, CTHRC1, TDO2, PTPRQ, and TRPM8 were correlated with good survival outcomes but elevated expressions of ERMP1, CD36, and ST9SIA4 were associated with poor prognosis. Xu et al. previously reported that CD36 mRNA expression was elevated and the high expression of CD36 represented poor prognosis in KIRC patients, which was consistent with our finding (Xu W.H. et al., 2019). However, the relevant investigations regarding the relationships between survival outcomes of KIRC patients and other gene prognostic makers are lacking. Therefore, additional analyses still need to be performed to verify our conclusion.
Although our study has identified several RNA makers for the prognostic prediction of KIRC patients, there are still some limitations. Firstly, a comprehensive bioinformatics analysis with a larger sample size is still required to carried out to validate our results. Secondly, the relevant experimental evidence was also provided for our findings. Thirdly, the more detailed clinical information needed to be integrated into a large-scale prognosis analysis in the following research.
Conclusion
In summary, we identified 1527 DElncRNAs, 54 DEmiRNAs, and 2321 DEmRNAs between KIRC group and control group. Furthermore, a lncRNA-mediated ceRNA network was constructed. Besides, two miRNAs (miRNA-21 and miRNA-155) and corresponding three negatively correlated lncRNAs (LINC00472, SLC25A5.AS1, and TCL6) were associated with OS of patients with KIRC. Finally, seven mRNA targets of miRNA-21 and 12 mRNAs targeted by miRNA-155 were also pivotal prognostic makers for KIRC patients. Collectively, this study revealed several novel prognosis-related RNA makers for KIRC based on a ceRNA regulatory network, which provided deeper insights into developing promising therapeutic strategies for KIRC treatment.
Data Availability Statement
The datasets generated for this study can be found in the TCGA database (https://cancergenome.nih.gov/), the miRcode (http://www.mircode.org/), the miRcode (http://www.mircode.org/), comprehensive GENCODE (http://www.gencodegenes.org/), experimentally validated miRTarBase (http://mirtarbase.mbc.nctu.edu.tw), TargetScan (http://www.targetscan.org/) database.
Author Contributions
QY and WC designed the study strategy and prepared the draft of the manuscript. WY and YC acquired the data and interpreted the data. JC and JY analyzed the data and prepared the figures and tables. XP and CC managed the data and collected the references. SG and XC revised the draft of the manuscript. All authors have agreed to the final content.
Funding
The Shanghai Sailing Program of Young Talents of Science and Technology (No. 19YF1459700); Clinical Peak Discipline Construction Project of Pudong New Area Government (No. PWYgf2018-03); and the Technology Project of Jiading District Science and Technology Committee (JDKW-2017-W13).
Conflict of Interest
The authors declare that the research was conducted in the absence of any commercial or financial relationships that could be construed as a potential conflict of interest.
Supplementary Material
The Supplementary Material for this article can be found online at: https://www.frontiersin.org/articles/10.3389/fgene.2020.540094/full#supplementary-material
Supplementary Table 1 | All of DELncRNAs, DEmiRNA, DEmRNAs between tumor and normal tissue in KIRC.
Supplementary Table 2 | Interactions of the ceRNA network in KIRC.
Supplementary Table 3 | The functional enrichment analysis of differentially expressed mRNAs in ceRNA network.
Supplementary Table 4 | The relationships of miRNA-21/miRNA-155 and corresponding lncRNAs.
Footnotes
- ^ https://cancergenome.nih.gov/
- ^ http://www.mircode.org/
- ^ http://www.gencodegenes.org/
- ^ http://mirtarbase.mbc.nctu.edu.tw
- ^ http://www.targetscan.org/
- ^ https://cytoscape.org/
- ^ https://david.ncifcrf.gov/
- ^ http://CRAN.R-project.org/package=survival/
References
Ashburner, M., Ball, C. A., Blake, J. A., Botstein, D., Butler, H., Cherry, J. M., et al. (2000). Gene ontology: tool for the unification of biology. the gene ontology consortium. Nat. Genet. 25, 25–29.
Boguslawska, J., Kedzierska, H., Poplawski, P., Rybicka, B., Tanski, Z., and Piekielko-Witkowska, A. (2016). Expression of genes involved in cellular adhesion and extracellular matrix remodeling correlates with poor survival of patients with renal cancer. J. Urol. 195, 1892–1902. doi: 10.1016/j.juro.2015.11.050
Chen, B., Jiao, Z., Yin, X., Qian, Z., Gu, J., and Sun, H. (2018). Novel insights into biomarkers associated with renal cell carcinoma. Oncol. Lett. 16, 83–90.
Chen, Y., Teng, L., Liu, W., Cao, Y., Ding, D., Wang, W., et al. (2016). Identification of biological targets of therapeutic intervention for clear cell renal cell carcinoma based on bioinformatics approach. Cancer Cell Int. 16:16.
De Felice, F., and Tombolini, V. (2018). Radiation therapy in renal cell carcinoma. Crit. Rev. Oncol. Hematol. 128, 82–87. doi: 10.1016/j.critrevonc.2018.06.002
Dennis, G. Jr., Sherman, B., Hosack, D. A., Yang, J., Gao, W., Lane, H. C., et al. (2003). DAVID: database for annotation, visualization, and integrated discovery. Genome Biol. 4:3.
Donskov, F., von, der Maase, H., Marcussen, N., Hamilton-Dutoit, S., Madsen, H. H., et al. (2004). Fas ligand expression in metastatic renal cell carcinoma during interleukin-2 based immunotherapy: no in vivo effect of Fas ligand tumor counterattack. Clin. Cancer Res. 10, 7911–7916. doi: 10.1158/1078-0432.ccr-04-1111
Drucker, B. J. (2005). Renal cell carcinoma: current status and future prospects. Cancer Treat Rev. 31, 536–545. doi: 10.1016/j.ctrv.2005.07.009
Elsässer-Beile, U., Gierschner, D., Welchner, T., and Wetterauer, U. (2003). Different expression of Fas and Fas ligand in tumor infiltrating and peripheral lymphocytes of patients with renal cell carcinomas. Anticancer Res. 23, 433–437.
Ge, Y., Yan, X., Jin, Y., Yang, X., Yu, X., Zhou, L., et al. (2015). MiRNA-192 [corrected] and miRNA-204 directly suppress lncRNA HOTTIP and interrupt GLS1-mediated glutaminolysis in hepatocellular carcinoma. PLoS Genet. 11:e1005726. doi: 10.1371/journal.pgen.1005726
Gupta, K., Miller, J. D., Li, J. Z., Russell, M. W., and Charbonneau, C. (2008). Epidemiologic and socioeconomic burden of metastatic renal cell carcinoma (mRCC): a literature review. Cancer Treat Rev. 34, 193–205. doi: 10.1016/j.ctrv.2007.12.001
Hsieh, J. J., Purdue, M. P., Signoretti, S., Swanton, C., Albiges, L., Schmidinger, M., et al. (2017). Renal cell carcinoma. Nat. Rev. Dis. Primers. 3:17009.
Hsu, S. D., Tseng, Y. T., Shrestha, S., Lin, Y. L., Khaleel, A., Chou, C. H., et al. (2014). miRTarBase update 2014: an information resource for experimentally validated miRNA-target interactions. Nucleic Acids Res. 42, D78–D85.
Jeggari, A., Marks, D. S., and Larsson, E. (2012). miRcode: a map of putative microRNA target sites in the long non-coding transcriptome. Bioinformatics 28, 2062–2063. doi: 10.1093/bioinformatics/bts344
Kanehisa, M., Furumichi, M., Tanabe, M., Sato, Y., and Morishima, K. (2017). KEGG: New perspectives on genomes, pathways, diseases and drugs. Nucleic Acids Res. 45, D353–D361.
Karreth, F. A., and Pandolfi, P. P. (2013). ceRNA cross-talk in cancer: when ce-bling rivalries go awry. Cancer Discov. 3, 1113–1121. doi: 10.1158/2159-8290.cd-13-0202
Khadirnaikar, S., Kumar, P., Pandi, S. N., Malik, R., Dhanasekaran, S. M., and Shukla, S. K. (2019). Immune associated LncRNAs identify novel prognostic subtypes of renal clear cell carcinoma. Mol. Carcinog. 58, 544–553. doi: 10.1002/mc.22949
Klimczak, D., Kuch, M., Pilecki, T., Żochowska, D., Wirkowska, A., and Pączek, L. (2017). Plasma microRNA-155-5p is increased among patients with chronic kidney disease and nocturnal hypertension. J. Am. Soc. Hypertens. 11, 831–841. doi: 10.1016/j.jash.2017.10.008
Li, X., Yan, X., Wang, F., Yang, Q., Luo, X., Kong, J., et al. (2019). Down-regulated lncRNA SLC25A5-AS1 facilitates cell growth and inhibits apoptosis via miR-19a-3p/PTEN/PI3K/AKT signalling pathway in gastric cancer. J. Cell Mol. Med. 23, 2920–2932. doi: 10.1111/jcmm.14200
Lin, P., Wen, D., Li, Q., He, Y., Yang, H., and Chen, G. (2018). Genome-Wide analysis of prognostic lncRNAs, miRNAs, and mRNAs forming a competing endogenous RNA network in hepatocellular carcinoma. Cell Physiol. Biochem. 48, 1953–1967. doi: 10.1159/000492519
Matsuda, D., Khoo, S. K., Massie, A., Iwamura, M., Chen, J., Petillo, D., et al. (2008). Identification of copy number alterations and its association with pathological features in clear cell and papillary RCC. Cancer Lett. 272, 260–267. doi: 10.1016/j.canlet.2008.06.015
Owens, D. F., and Kriegstein, A. R. (2002). Is there more to GABA than synaptic inhibition? Nat. Rev. Neurosci. 3, 715–727. doi: 10.1038/nrn919
Pan, T., Lin, S. C., Yu, K. J., Yu, G., Song, J. H., Lewis, V. O., et al. (2018). BIGH3 promotes osteolytic lesions in renal cell carcinoma bone metastasis by inhibiting osteoblast differentiation. Neoplasia 20, 32–43. doi: 10.1016/j.neo.2017.11.002
Salmena, L., Poliseno, L., Tay, Y., Kats, L., and Pandolfi, P. P. (2011). A ceRNA hypothesis: the rosetta stone of a hidden RNA language? Cell 146, 353–358. doi: 10.1016/j.cell.2011.07.014
Sejima, T., Morizane, S., Hinata, N., Yao, A., Isoyama, T., Saito, M., et al. (2012). Fas expression in renal cell carcinoma accurately predicts patient survival after radical nephrectomy. Urol. Int. 88, 263–270. doi: 10.1159/000334453
Shiomi, E., Sugai, T., Ishida, K., Osakabe, M., Tsuyukubo, T., Kato, Y., et al. (2019). Analysis of expression patterns of micrornas that are closely associated with renal carcinogenesis. Front. Oncol. 9:431. doi: 10.3389/fonc.2019.00431
Szabó, Z., Szegedi, K., Gombos, K., Mahua, C., Flaskó, T., Harda, K., et al. (2016). Expression of miRNA-21 and miRNA-221 in clear cell renal cell carcinoma (ccRCC) and their possible role in the development of ccRCC. Urol. Oncol. 34, .e521–.e533.
Tan, L. P., Seinen, E., Duns, G., de Jong, D., Sibon, O. C., Poppema, S., et al. (2009). A high throughput experimental approach to identify miRNA targets in human cells. Nucleic Acids Res. 37:e137. doi: 10.1093/nar/gkp715
Tay, Y., Rinn, J., and Pandolfi, P. P. (2014). The multilayered complexity of ceRNA crosstalk and competition. Nature 505, 344–352. doi: 10.1038/nature12986
Tian, W., Du, Y., Ma, Y., Gu, L., Zhou, J., and Deng, D. (2019). MALAT1-miR663a negative feedback loop in colon cancer cell functions through direct miRNA-lncRNA binding. Cell Death Dis. 9:857. doi: 10.1038/s41419-018-0925-y
Wang, J., Zhang, C., He, W., and Gou, X. (2018). Construction and comprehensive analysis of dysregulated long non-coding RNA-associated competing endogenous RNA network in clear cell renal cell carcinoma. J. Cell Biochem. Online ahead of print. doi: 10.1002/jcb.27557
Wang, W., Lou, W., Ding, B., Yang, B., Lu, H., Kong, Q., et al. (2019). A novel mRNA-miRNA-lncRNA competing endogenous RNA triple sub-network associated with prognosis of pancreatic cancer. Aging (Albany NY) 11, 2610–2627. doi: 10.18632/aging.101933
Wong, M. C. S., Goggins, W. B., Yip, B. H. K., Fung, F. D. H., Leung, C., Fang, Y., et al. (2017). Incidence and mortality of kidney cancer: temporal patterns and global trends in 39 countries. Sci. Rep. 7:15698. doi: 10.1038/s41598-017-15922-4
Xie, M., Lv, Y., Liu, Z., Zhang, J., Liang, C., Liao, X., et al. (2018). Identification and validation of a four-miRNA (miRNA-21-5p, miRNA-9-5p, miR-149-5p, and miRNA-30b-5p) prognosis signature in clear cell renal cell carcinoma. Cancer Manag. Res. 10, 5759–5766. doi: 10.2147/CMAR.S187109
Xu, T. R., Ruan, H., Song, Z., Cao, Q., Wang, K., Bao, L., et al. (2019). Identification of CXCL13 as a potential biomarker in clear cell renal cell carcinoma via comprehensive bioinformatics analysis. Biomed. Pharmacother. 118:109264. doi: 10.1016/j.biopha.2019.109264
Xu, W. H., Qu, Y., Wang, J., Wang, H. K., Wan, F. N., Zhao, J. Y., et al. (2019). Elevated CD36 expression correlates with increased visceral adipose tissue and predicts poor prognosis in ccRCC patients. J. Cancer 10, 4522–4531. doi: 10.7150/jca.30989
Yang, K., Lu, X., Luo, P. C., and Zhang, J. (2018). Identification of six potentially long noncoding RNAs as biomarkers involved competitive endogenous RNA in clear cell renal cell carcinoma. Biomed. Res. Int. 2018:9303486. doi: 10.1155/2018/9303486
Ye, B., Shi, J., Kang, H., Oyebamiji, O., Hill, D., Yu, H., et al. (2019). Advancing pan-cancer gene expression survial analysis by inclusion of non-coding RNA. RNA Biol. 18, 1–8. doi: 10.1080/15476286.2019.1679585
Yu, G., Wang, L. G., Han, Y., and He, Q. Y. (2012). clusterProfiler: an R package for comparing biological themes among gene clusters. OMICS. 16, 284–287. doi: 10.1089/omi.2011.0118
Yu, L., Xiang, L., Feng, J., Li, B., Zhou, Z., Li, J., et al. (2018). miRNA-21 and miRNA-223 expression signature as a predictor for lymph node metastasis, distant metastasis and survival in kidney renal clear cell carcinoma. J. Cancer. 9, 3651–3659. doi: 10.7150/jca.27117
Zall, H., Weber, A., Besch, R., Zantl, N., and Häcker, G. (2010). Chemotherapeutic drugs sensitize human renal cell carcinoma cells to ABT-737 by a mechanism involving the Noxa-dependent inactivation of Mcl-1 or A1. Mol. Cancer 9:164. doi: 10.1186/1476-4598-9-164
Zaman, M. S., Shahryari, V., Deng, G., Thamminana, S., Saini, S., Majid, S., et al. (2012). Up-regulation of microRNA-21 correlates with lower kidney cancer survival. PLoS One 7:e31060. doi: 10.1371/journal.pone.0031060
Keywords: kidney renal clear cell carcinoma, microRNAs, long non-coding RNAs, competing endogenous RNA network, survival prognosis
Citation: Yang Q, Chu W, Yang W, Cheng Y, Chu C, Pan X, Ye J, Cao J, Gan S and Cui X (2020) Identification of RNA Transcript Makers Associated With Prognosis of Kidney Renal Clear Cell Carcinoma by a Competing Endogenous RNA Network Analysis. Front. Genet. 11:540094. doi: 10.3389/fgene.2020.540094
Received: 17 June 2020; Accepted: 04 September 2020;
Published: 15 October 2020.
Edited by:
Claudia Ghigna, Institute of Molecular Genetics, ItalyReviewed by:
Emanuele Buratti, International Centre for Genetic Engineering and Biotechnology, ItalyRoberta Alfieri, Institute of Molecular Genetics, Italy
Copyright © 2020 Yang, Chu, Yang, Cheng, Chu, Pan, Ye, Cao, Gan and Cui. This is an open-access article distributed under the terms of the Creative Commons Attribution License (CC BY). The use, distribution or reproduction in other forums is permitted, provided the original author(s) and the copyright owner(s) are credited and that the original publication in this journal is cited, in accordance with accepted academic practice. No use, distribution or reproduction is permitted which does not comply with these terms.
*Correspondence: Xingang Cui, cuixingang@smmu.edu.cn; Sishun Gan, gansishun@smmu.edu.cn; Jianwei Cao, 1063432617@qq.com
†These authors have contributed equally to this work