Electric Field-Driven Direct Interspecies Electron Transfer for Bioelectrochemical Methane Production from Fermentable and Non-Fermentable Substrates


Abstract
:
1. Introduction
2. Materials and Methods
2.1. Anaerobic Medium, Seed Sludge and Electrode
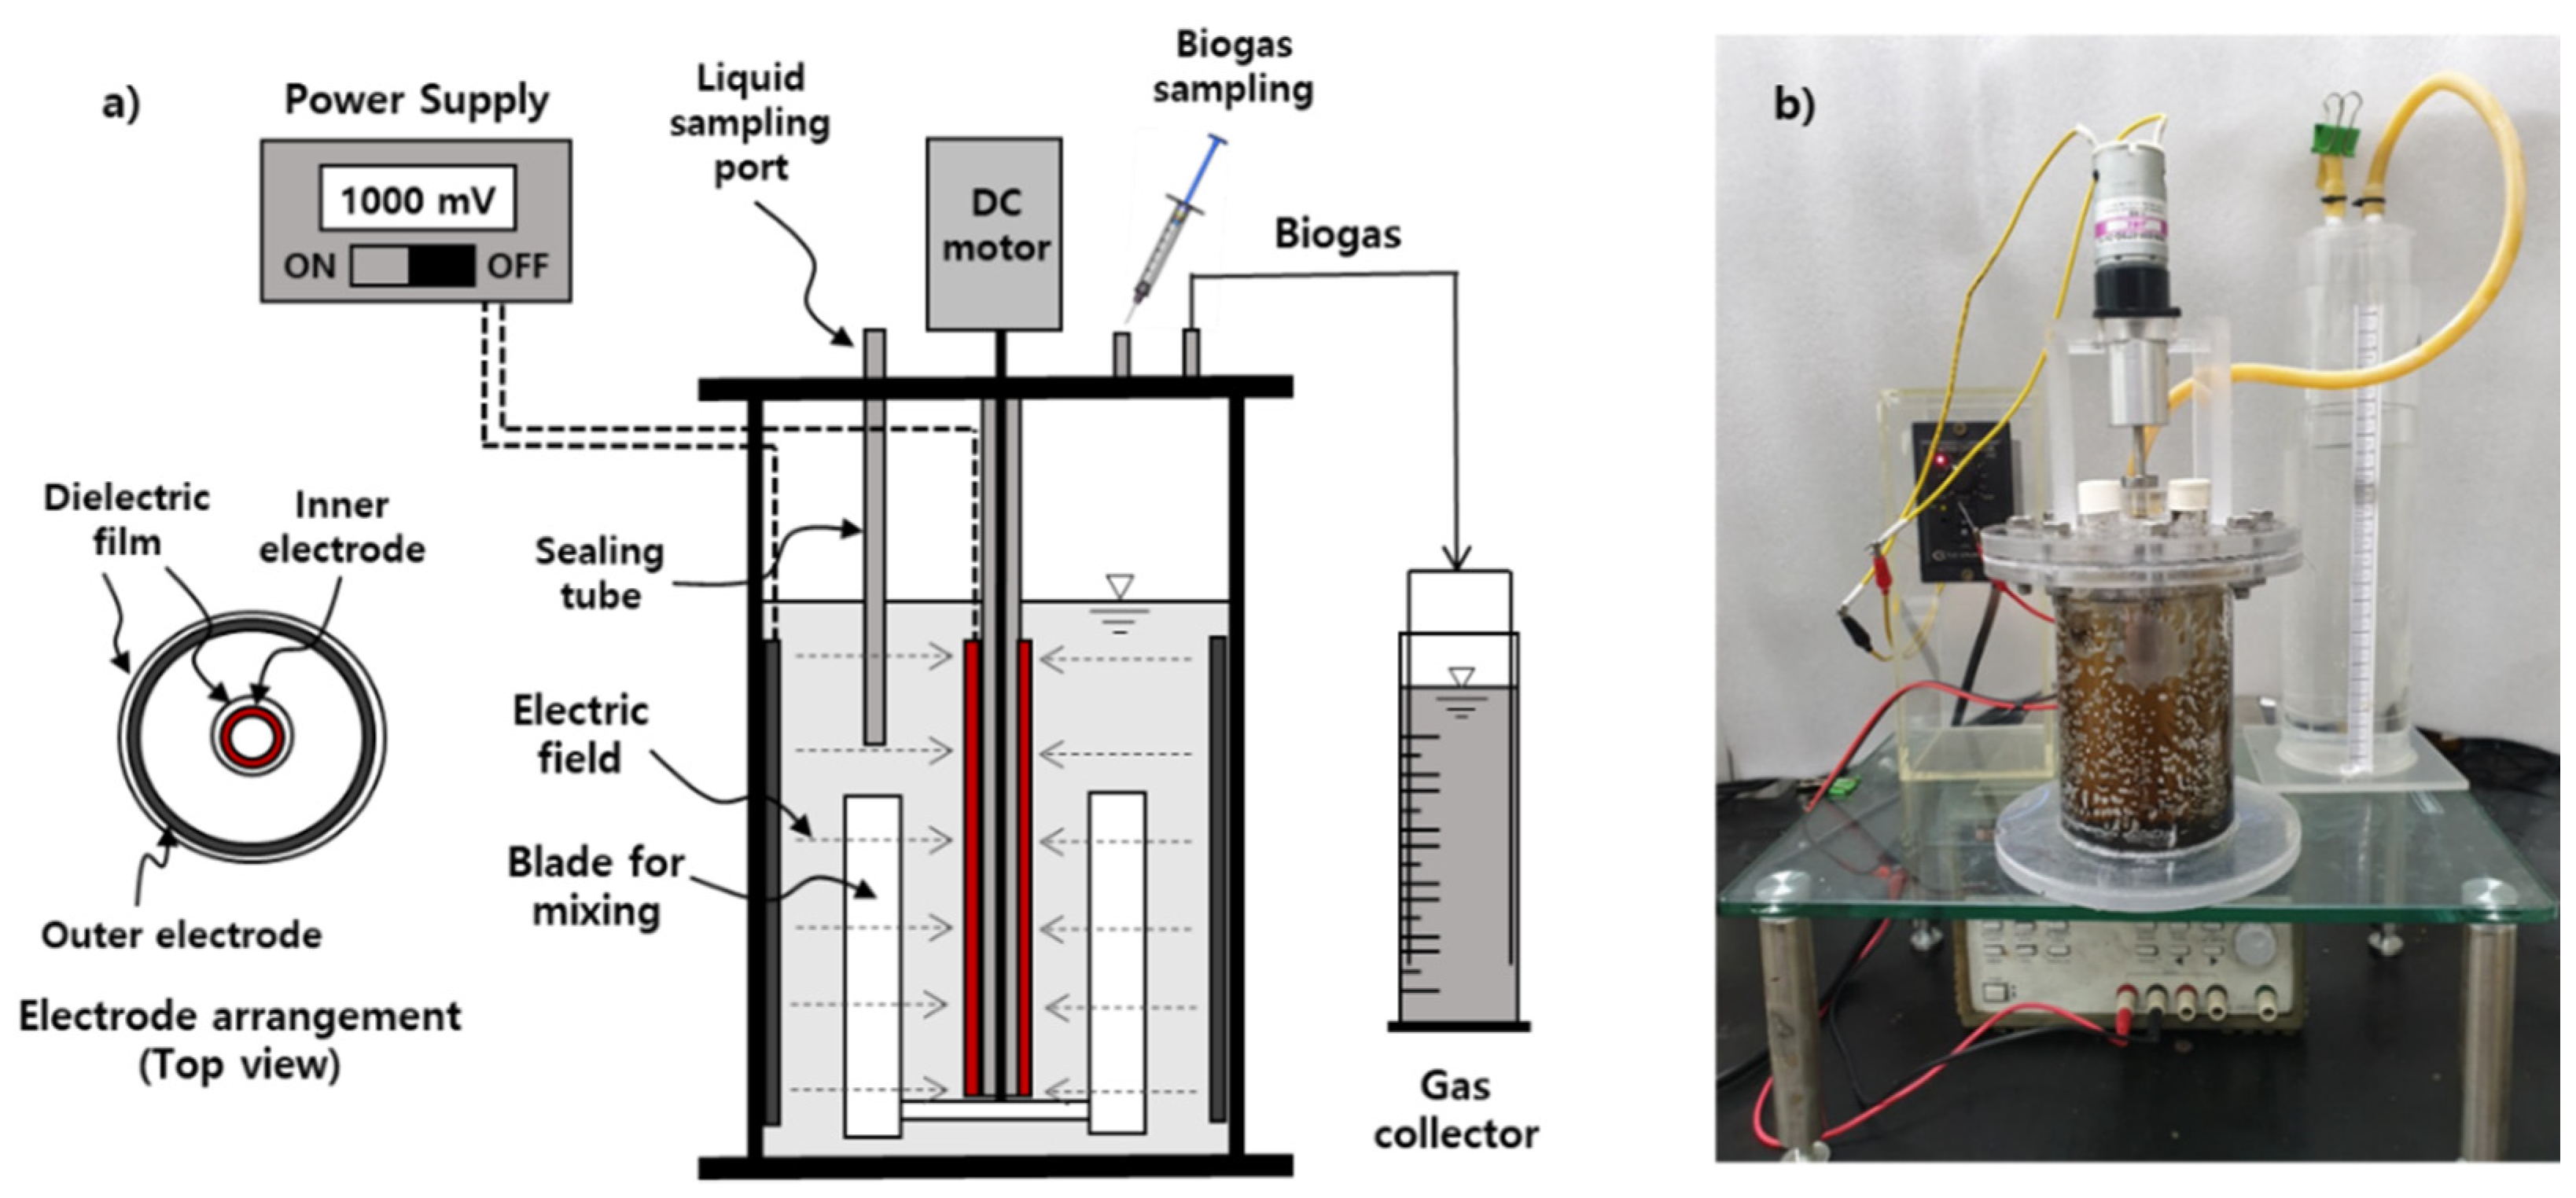
2.2. Set-up for Bioelectrochemical Anaerobic Batch Reactor
2.3. Analysis and Calculations
2.4. Microbial Community Analysis
3. Results and Discussion
3.1. Bioelectrocemical Methane Production
3.2. Methane Yield and Electron Balance
3.3. Bioelectrochemical Activity of the Suspended Microorganisms
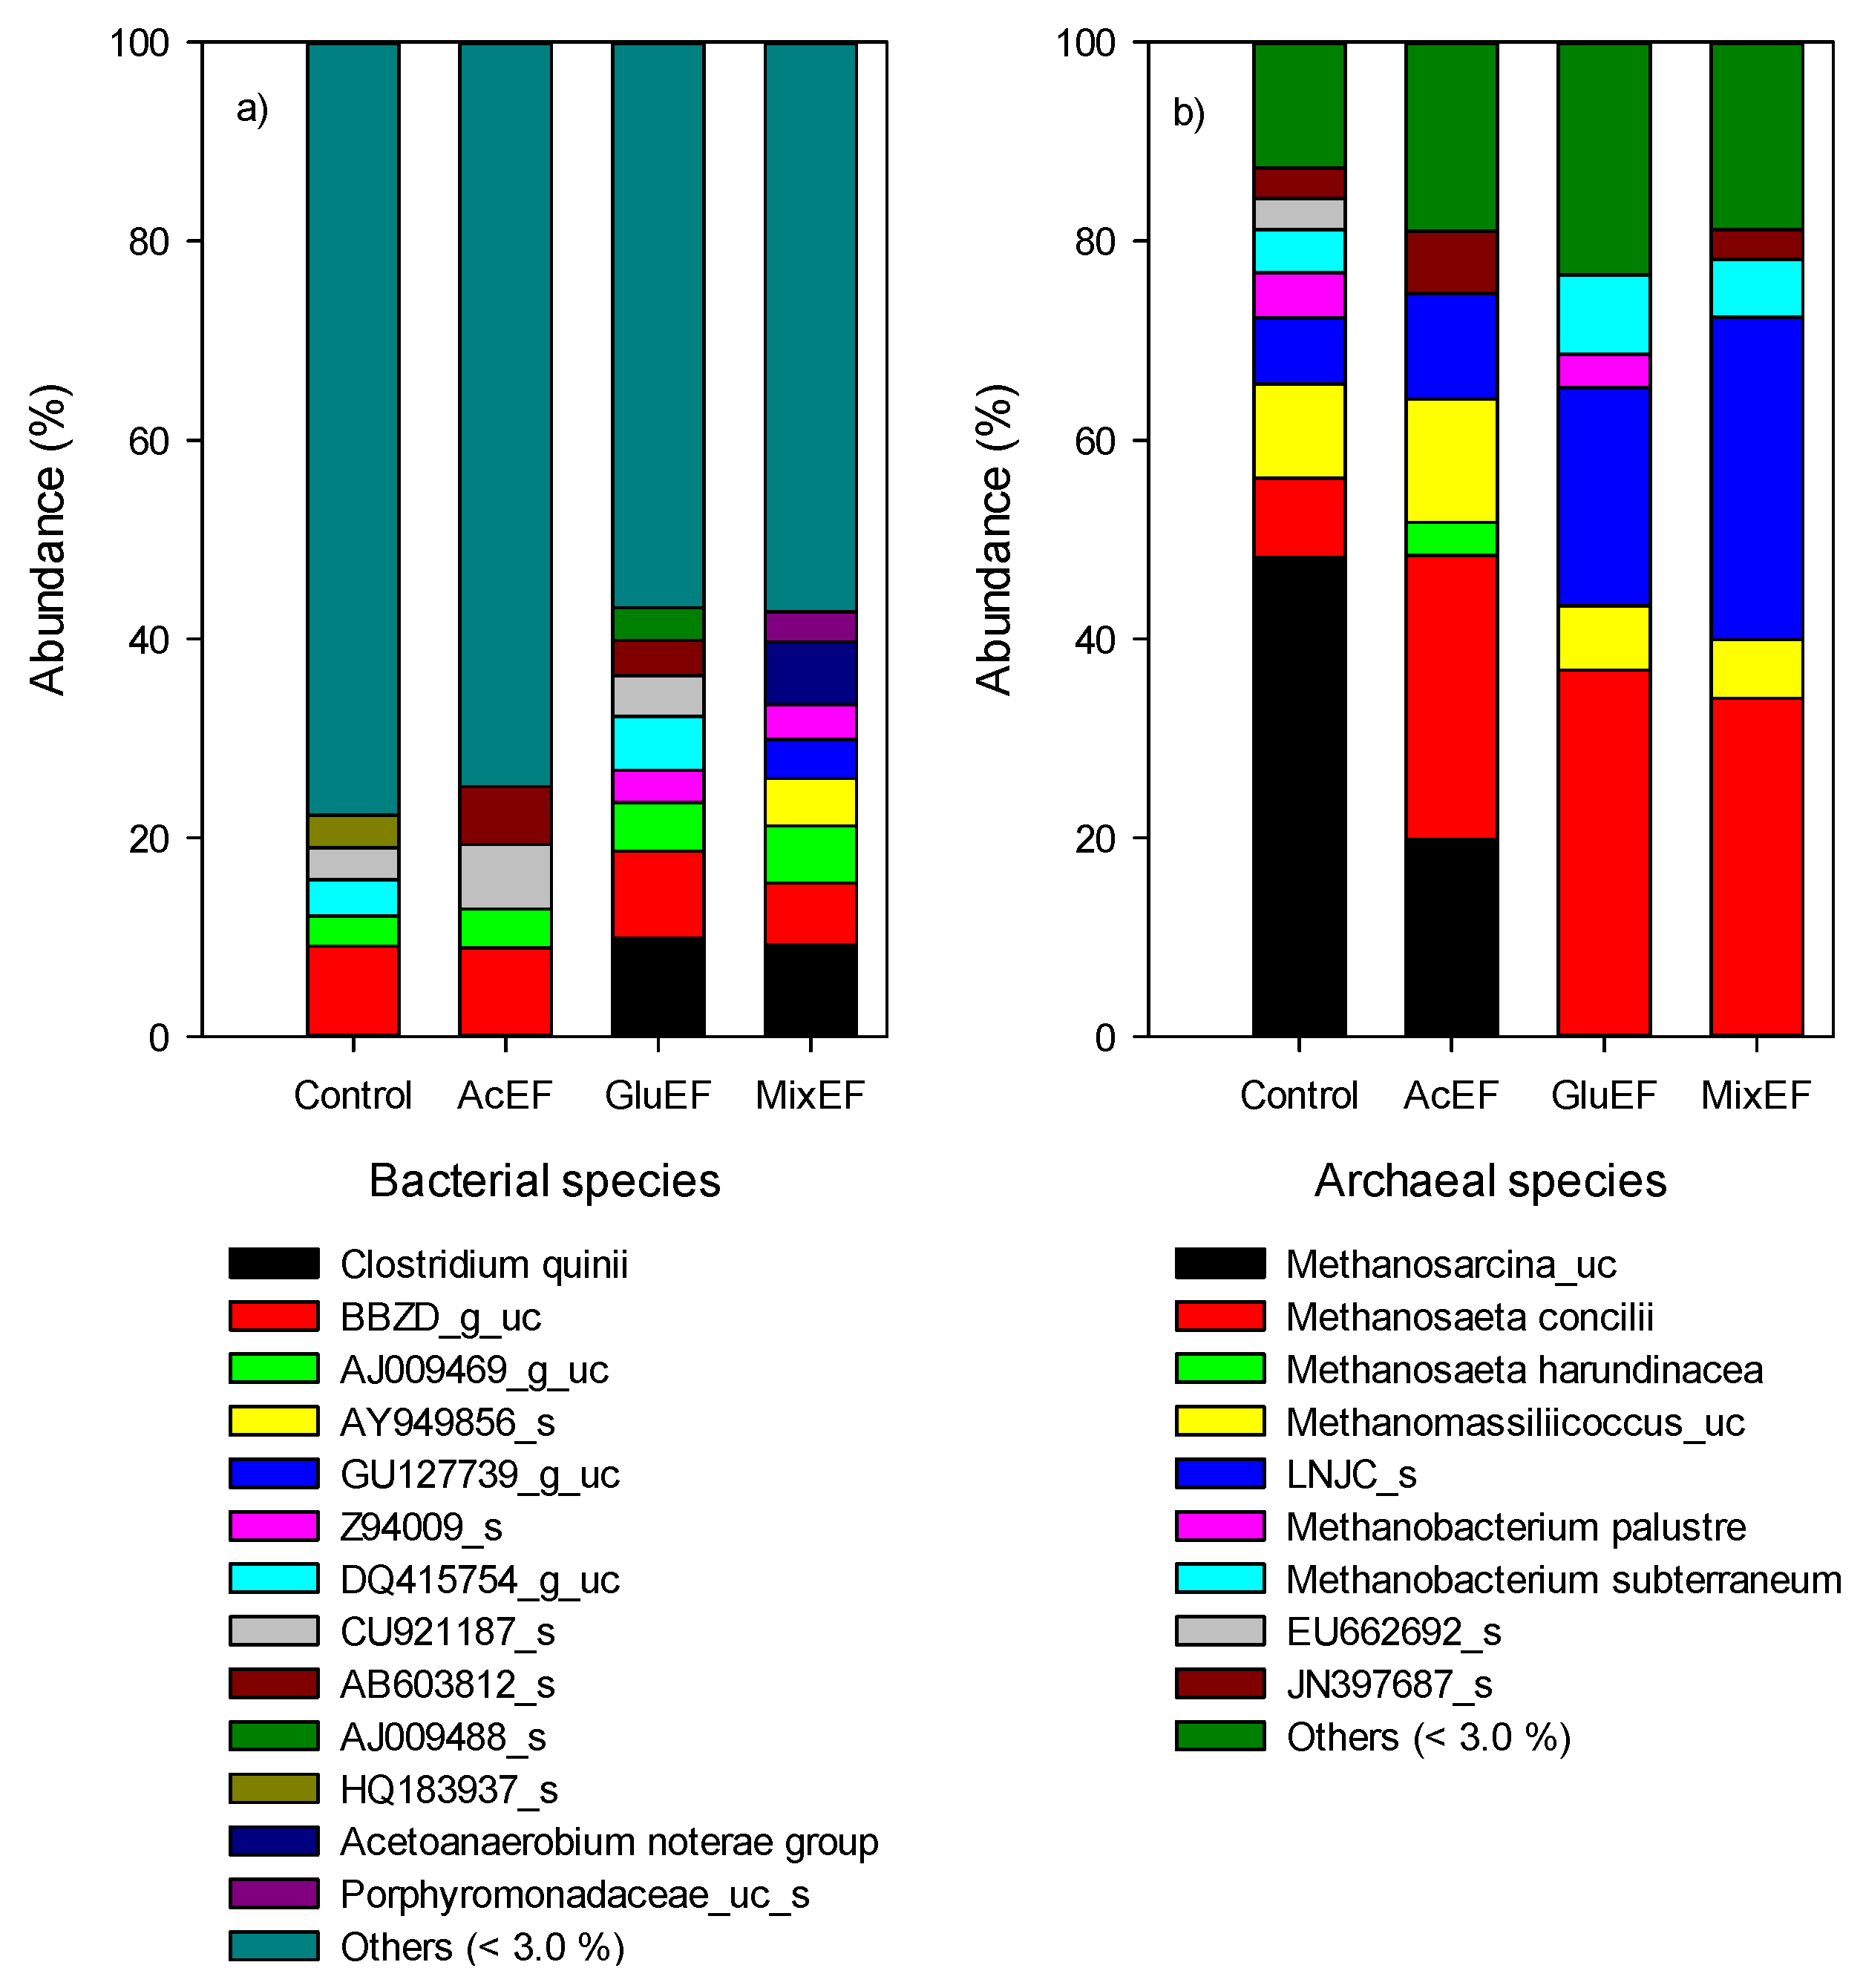
3.4. Microbial Communities
4. Conclusions
Author Contributions
Funding
Conflicts of Interest
References
- Enzmann, F.; Mayer, F.; Rother, M.; Holtmann, D. Methanogens: Biochemical background and biotechnological applications. AMB Express 2018, 8, 1. [Google Scholar] [CrossRef] [PubMed]
- Feng, Q.; Song, Y.C.; Yoo, K.; Kuppanan, N.; Subudhi, S.; Lal, B. Bioelectrochemical enhancement of direct interspecies electron transfer in upflow anaerobic reactor with effluent recirculation for acidic distillery wastewater. Bioresour. Technol. 2017, 241, 171–180. [Google Scholar] [CrossRef] [PubMed]
- Shrestha, P.M.; Erotaru, A.E. Plugging in or going wireless: Strategies for interspecies electron transfer. Front. Microbiol. 2014, 5, 237. [Google Scholar] [CrossRef] [PubMed]
- Feng, Q.; Song, Y.C.; Ahn, Y. Electroactive microorganisms in bulk solution contribute significantly to methane production in bioelectrochemical anaerobic reactor. Bioresour. Technol. 2018, 259, 119–127. [Google Scholar] [CrossRef] [PubMed]
- Lovley, D.R. Live wires: Direct extracellular electron exchange for bioenergy and the bioremediation of energy-related contamination. Energy Environ. Sci. 2011, 4, 4896–4906. [Google Scholar] [CrossRef] [Green Version]
- Shen, L.; Zhao, Q.; Wu, X.; Li, X.; Li, Q.; Wang, Y. Interspecies electron transfer in syntrophic methanogenic consortia: From cultures to bioreactors. Renew. Sustain. Energy Rev. 2016, 54, 1358–1367. [Google Scholar] [CrossRef]
- Song, Y.C.; Feng, Q.; Ahn, Y. Performance of the bio-electrochemical anaerobic digestion of sewage sludge at different hydraulic retention times. Energy Fuels 2016, 30, 352–359. [Google Scholar] [CrossRef]
- Padilla-Gasca, E.; López-López, A.; Gallardo-Valdez, J. Evaluation of stability factors in the anaerobic treatment of slaughterhouse wastewater. J. Bioremed. Biodegrad. 2011, 2, 1000114. [Google Scholar] [CrossRef]
- Baek, G.; Kim, J.; Kim, J.; Lee, C. Role and potential of direct interspecies electron transfer in anaerobic digestion. Energies 2018, 11, 107. [Google Scholar] [CrossRef] [Green Version]
- Leang, C.; Qian, X.; Mester, T.; Lovley, D.R. Alignment of the c-Type Cytochrome OmcS along Pili of Geobacter sulfurreducens. Appl. Environ. Microbiol. 2010, 76, 4080–4084. [Google Scholar] [CrossRef] [Green Version]
- Blasco-Gómez, R.; Batlle-Vilanova, P.; Villano, M.; Balaguer, M.D.; Colprim, J.; Puig, S. On the edge of research and technological application: A critical review of electromethanogenesis. Int. J. Mol. Sci. 2017, 18, 874. [Google Scholar] [CrossRef] [PubMed]
- Dubé, C.D.; Guiot, S.R. Direct interspecies electron transfer in anaerobic digestion: A review. Adv. Biochem. Eng. Biotechnol. 2015, 151, 101–115. [Google Scholar] [CrossRef] [PubMed]
- Kato, S.; Hashimoto, K.; Watanabe, K. Methanogenesis facilitated by electric syntrophy via (semi)conductive iron-oxide minerals. Environ. Microbiol. 2011, 14, 1646–1654. [Google Scholar] [CrossRef]
- Rotaru, A.-E.; Shrestha, P.M.; Liu, F.; Markovaite, B.; Chen, S.; Nevin, K.P.; Lovley, D.R. Direct Interspecies Electron Transfer between Geobacter metallireducens and Methanosarcina barkeri. Appl. Environ. Microbiol. 2014, 80, 4599–4605. [Google Scholar] [CrossRef] [PubMed] [Green Version]
- Piao, D.M.; Song, Y.C.; Oh, G.G.; Kim, D.H.; Bae, B.U. Contribution of yeast extract, activated carbon, and an electrostatic field to interspecies electron transfer for the bioelectrochemical conversion of coal to methane. Energies 2019, 12, 4051. [Google Scholar] [CrossRef] [Green Version]
- Feng, Q.; Song, Y.C.; Yoo, K.; Kuppanan, N.; Subudhi, S.; Lal, B. Polarized electrode enhances biological direct interspecies electron transfer for methane production in upflow anaerobic bioelectrochemical reactor. Chemosphere 2018, 204, 186–192. [Google Scholar] [CrossRef] [PubMed]
- Joicy, A.; Song, Y.C.; Li, J.; Oh, S.E.; Jang, S.H.; Ahn, Y. Effect of electrostatic field strength on bioelectrochemical nitrogen removal from nitrogen-rich wastewater. Energies 2020, 13, 3218. [Google Scholar] [CrossRef]
- Feng, Q.; Song, Y.C.; Li, J.; Wang, Z.; Wu, Q. Influence of electrostatic field and conductive material on the direct interspecies electron transfer for methane production. Environ. Res. 2020, 188, 109867. [Google Scholar] [CrossRef]
- Belderbos, A.; Valkaert, T.; Bruninx, K.; Delarue, E.; D’Haeseleer, W. Facilitating renewables and power-to-gas via integrated electrical power-gas system scheduling. Appl. Energy 2020, 275, 115082. [Google Scholar] [CrossRef]
- Götz, M.; Lefebvre, J.; Mörs, F.; Koch, A.M.; Graf, F.; Bajohr, S.; Reimert, R.; Kolb, T. Renewable Power-to-Gas: A technological and economic review. Renew. Energy 2016, 85, 1371–1390. [Google Scholar] [CrossRef] [Green Version]
- Lee, H.-S.; Parameswaran, P.; Kato-Marcus, A.; Torres, C.I.; Rittmann, B.E. Evaluation of energy-conversion efficiencies in microbial fuel cells (MFCs) utilizing fermentable and non-fermentable substrates. Water Res. 2008, 42, 1501–1510. [Google Scholar] [CrossRef] [PubMed]
- Rozendal, R.A.; Jeremiasse, A.W.; Hamelers, H.V.M.; Buisman, C.J.N. Hydrogen production with a microbial biocathode. Environ. Sci. Technol. 2008, 42, 629–634. [Google Scholar] [CrossRef]
- Wisseroth, K.; Braune, H. Thermodynamic equilibrium in strong electric fields and field chemistry consequences. J. Phys. 1977, 38, 1249–1255. [Google Scholar] [CrossRef]
- Karakashev, D.B.; Batstone, D.J.; Trably, E.; Angelidaki, I. Acetate oxidation is the dominant methanogenic pathway from acetate in the absence of methanosaetaceae. Appl. Environ. Microbiol. 2006, 72, 5138–5141. [Google Scholar] [CrossRef] [PubMed] [Green Version]
- Pant, D.; Van Bogaert, G.; Diels, L.; Vanbroekhoven, K. A review of the substrates used in microbial fuel cells (MFCs) for sustainable energy production. Bioresour. Technol. 2010, 101, 1533–1543. [Google Scholar] [CrossRef] [PubMed]
- Chaudhuri, S.K.; Lovley, D.R. Electricity generation by direct oxidation of glucose in mediatorless microbial fuel cells. Nat. Biotechnol. 2003, 21, 1229–1232. [Google Scholar] [CrossRef] [PubMed]
- Xu, S.; Liu, H. New exoelectrogen Citrobacter sp. SX-1 isolated from a microbial fuel cell. J. Appl. Microbiol. 2011, 111, 1108–1115. [Google Scholar] [CrossRef]
- Feng, Q.; Song, Y.C. Surface modification of a graphite fiber fabric anode for enhanced bioelectrochemical methane production. Energy Fuels 2016, 30, 6467–6474. [Google Scholar] [CrossRef]
- APHA; AWWA; WEF. Standard Methods for the Examination of Water and Wastewater, 21st ed.; American Public Health Association/American Water Works Association/Water Environmental Federation: Washington, DC, USA, 2005. [Google Scholar]
- Piao, D.M.; Song, Y.C.; Kim, D.H. Bioelectrochemical enhancement of biogenic methane conversion of coal. Energies 2018, 11, 2577. [Google Scholar] [CrossRef] [Green Version]
- Khan, N.; Khan, M.D.; Nizami, A.; Rehan, M.; Shaida, A.; Ahmad, A.; Khan, M.Z. Energy generation through bioelectrochemical degradation of pentachlorophenol in microbial fuel cell. RSC Adv. 2018, 8, 20726–20736. [Google Scholar] [CrossRef] [Green Version]
- Villano, M.; Aulenta, F.; Ciucci, C.; Ferri, T.; Giuliano, A.; Majone, M. Bioelectrochemical reduction of CO2 to CH4 via direct and indirect extracellular electron transfer by a hydrogenophilic methanogenic culture. Bioresour. Technol. 2010, 101, 3085–3090. [Google Scholar] [CrossRef]
- Yoon, S.H.; Ha, S.M.; Kwon, S.; Lim, J.; Kim, Y.; Seo, H.; Chun, J. Introducing EzBioCloud: A taxonomically united database of 16S rRNA gene sequences and whole-genome assemblies. Int. J. Syst. Evol. Microbiol. 2017, 67, 1613–1617. [Google Scholar] [CrossRef]
- Ferry, J.G. Fundamentals of methanogenic pathways that are key to the biomethanation of complex biomass. Curr. Opin. Biotechnol. 2011, 22, 351–357. [Google Scholar] [CrossRef] [Green Version]
- Pivrikas, A.; Ullah, M.; Sitter, H.; Sariciftci, N.S. Electric field dependent activation energy of electron transport in fullerene diodes and field effect transistors: Gill’s law. Appl. Phys. Lett. 2011, 98, 92114. [Google Scholar] [CrossRef] [Green Version]
- Lin, C.Y.; Sato, K.; Noike, T.; Matsumoto, J. Methanogenic digestion using mixed substrate of acetic, propionic and butyric acids. Water Res. 1986, 20, 385–394. [Google Scholar] [CrossRef]
- Jia, X.S.; Furumai, H.; Fang, H.H.P. Yields of biomass and extracellular polymers in four anaerobic sludges. Environ. Technol. 1996, 17, 283–291. [Google Scholar] [CrossRef]
- Yang, Y.; Chen, Q.; Guo, J.; Hu, Z. Kinetics and methane gas yields of selected C1 to C5 organic acids in anaerobic digestion. Water Res. 2015, 87, 112–118. [Google Scholar] [CrossRef]
- Hattori, S. Syntrophic acetate-oxidizing microbes in methanogenic environments. Microbes Environ. 2008, 23, 118–127. [Google Scholar] [CrossRef] [Green Version]
- Burton, F.L.; Tchobanoglous, G.; Tsuchihashi, R.; Stensel, H.D. Wastewater Engineering: Treatment and Resource Recovery, 5th ed.; McGraw-Hill Education: New York, NY, USA, 2014; pp. 579–587. [Google Scholar]
- Kimura, Z.I.; Okabe, S. Hydrogenophaga electricum sp. nov., isolated from anodic biofilms of an acetate-fed microbial fuel cell. J. Gen. Appl. Microbiol. 2013, 59, 261–266. [Google Scholar] [CrossRef] [Green Version]
- Mateo, S.; Cañizares, P.; Rodrigo, M.A.; Fernandez-Morales, F.J. Driving force behind electrochemical performance of microbial fuel cells fed with different substrates. Chemosphere 2018, 207, 313–319. [Google Scholar] [CrossRef]
- Feng, Q.; Song, Y.C.; Bae, B.U. Influence of applied voltage on the performance of bioelectrochemical anaerobic digestion of sewage sludge and planktonic microbial communities at ambient temperature. Bioresour. Technol. 2016, 220, 500–508. [Google Scholar] [CrossRef] [PubMed]
- Xafenias, N.; Mapelli, V. Performance and bacterial enrichment of bioelectrochemical systems during methane and acetate production. Int. J. Hydrog. Energy 2014, 39, 21864–21875. [Google Scholar] [CrossRef] [Green Version]
- Carmona-Martinez, A.A.; Harnisch, F.; Fitzgerald, L.A.; Biffinger, J.C.; Ringeisen, B.R.; Schröder, U. Cyclic voltammetric analysis of the electron transfer of Shewanella oneidensis MR-1 and nanofilament and cytochrome knock-out mutants. Bioelectrochemistry 2011, 81, 74–80. [Google Scholar] [CrossRef] [PubMed]
- Feng, C.; Li, J.; Qin, D.; Chen, L.; Zhao, F.; Chen, S.; Hu, H.; Yu, C.P. Characterization of exoelectrogenic bacteria enterobacter strains isolated from a microbial fuel cell exposed to copper shock load. PLoS ONE 2014, 9, e113379. [Google Scholar] [CrossRef]
- Sharma, S.C.D.; Feng, C.; Li, J.; Hu, A.; Wang, H.; Qin, D.; Yu, C.P. Electrochemical characterization of a novel exoelectrogenic bacterium strain SCS5, isolated from a mediator-less microbial fuel cell and phylogenetically related to aeromonas jandaei. Microbes Environ. 2016, 31, 213–225. [Google Scholar] [CrossRef]
- Rivière, D.; Desvignes, V.; Pelletier, E.; Chaussonnerie, S.; Guermazi, S.; Weissenbach, J.; Li, T.; Camacho, P.; Sghir, A. Towards the definition of a core of microorganisms involved in anaerobic digestion of sludge. ISME J. 2009, 3, 700–714. [Google Scholar] [CrossRef] [Green Version]
- Svensson, B.G.; Nise, G.; Erfurth, E.M.; Olsson, H. Neuroendocrine effects in printing workers exposed to toluene. Br. J. Ind. 1992, 49, 402–408. [Google Scholar] [CrossRef] [Green Version]
- Snaidr, J.; Amann, R.; Huber, I.; Ludwig, W.; Schleifer, K.H. Phylogenetic analysis and in situ identification of bacteria in activated sludge. Appl. Environ. Microbiol. 1997, 63, 2884–2896. [Google Scholar] [CrossRef] [Green Version]


| Contents | AcEF | GluEF | MixEF | Control | |
|---|---|---|---|---|---|
| Pu (mL CH4) | 407.1 ± 3.7 | 345.6 ± 1.1 | 325.7 ± 1.0 | 156.7 ± 1.2 | |
| μm (mL CH4/d) | 74.9 ± 0.8 | 58.0 ± 1.3 | 64.4 ± 1.2 | 44.9 ± 1.9 | |
| λ (d) | 0.23 ± 0.03 | 0.02± 0.01 | 0.05 ± 0.05 | 0.32 ± 0.04 | |
| CH4 yield (mL/gCODr) | 305.1 ± 6.2 | 288.0 ± 4.9 | 276.1 ± 4.2 | 172.1 ± 5.1 | |
| SCOD (mg/L) | Initial | 3392 ± 24 | 3787 ± 33 | 3565 ± 50 | 3643 ± 11 |
| Final | 922 ± 51 | 1467 ± 17 | 1345 ± 29 | 1574 ± 35 | |
| TCOD (mg/L) | Initial | 9473 ± 48 | 9398 ± 38 | 9184 ± 67 | 9426 ± 53 |
| Final | 6276 ± 37 | 6452 ± 43 | 6175 ± 56 | 6675 ± 105 | |
| VSS (mg/L) | Initial | 8578 ± 176 | 8764 ± 69 | 8755 ± 191 | 8560 ± 121 |
| Final | 9235 ± 29 | 9157 ± 97 | 9328 ± 143 | 8732 ± 46 | |
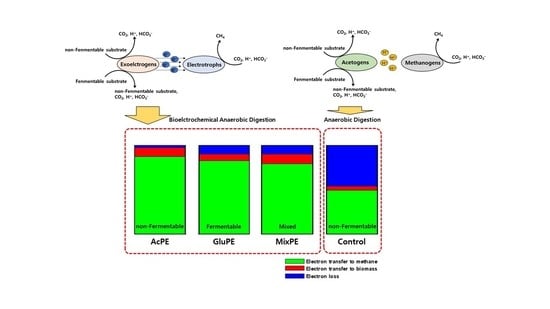
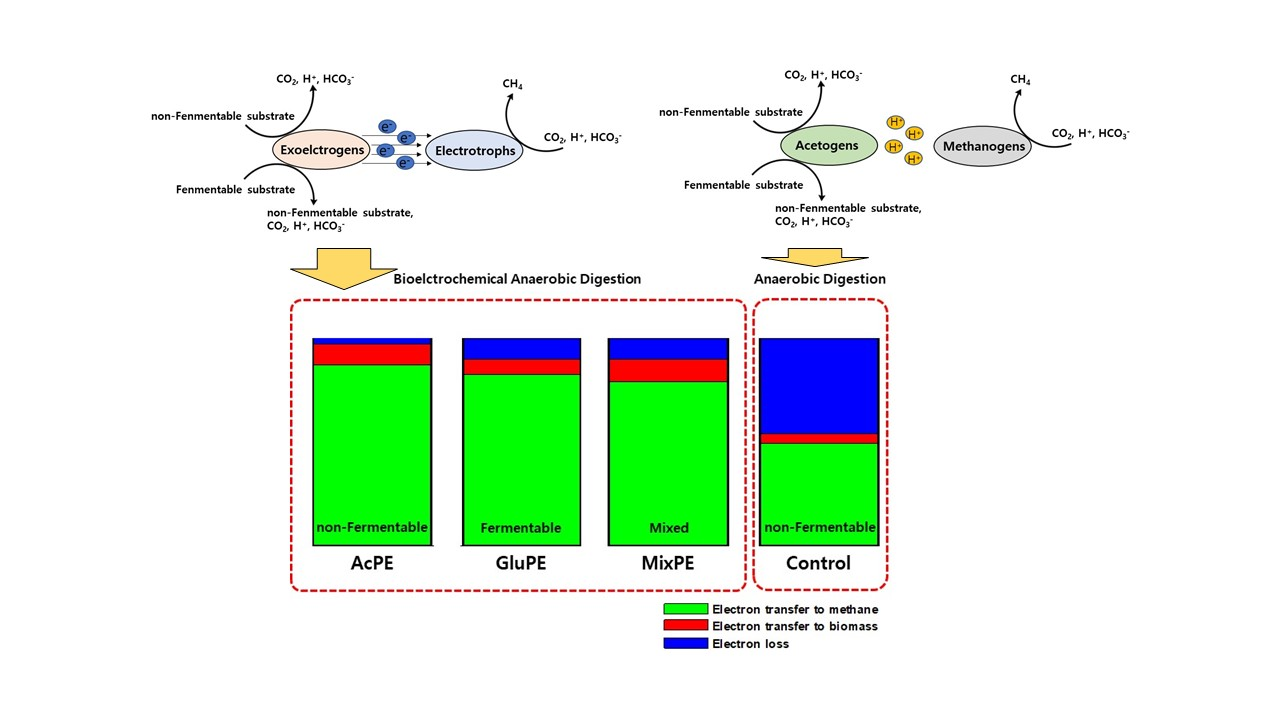
| Electron Balance | CH4 (%) | 87.2 ± 1.8 | 82.3 ± 1.4 | 78.9 ± 1.2 | 49.2 ± 1.5 |
| Biomass (%) | 9.8 ± 4.0 | 7.5 ± 0.8 | 11.0 ± 1.4 | 4.7 ± 2.1 | |
| Losses (%) | 3.1 ± 2.3 | 10.2 ± 2.2 | 10.1 ± 2.6 | 46.1 ± 0.6 | |
| AcEF | GluEF | MixEF | Control | |
|---|---|---|---|---|
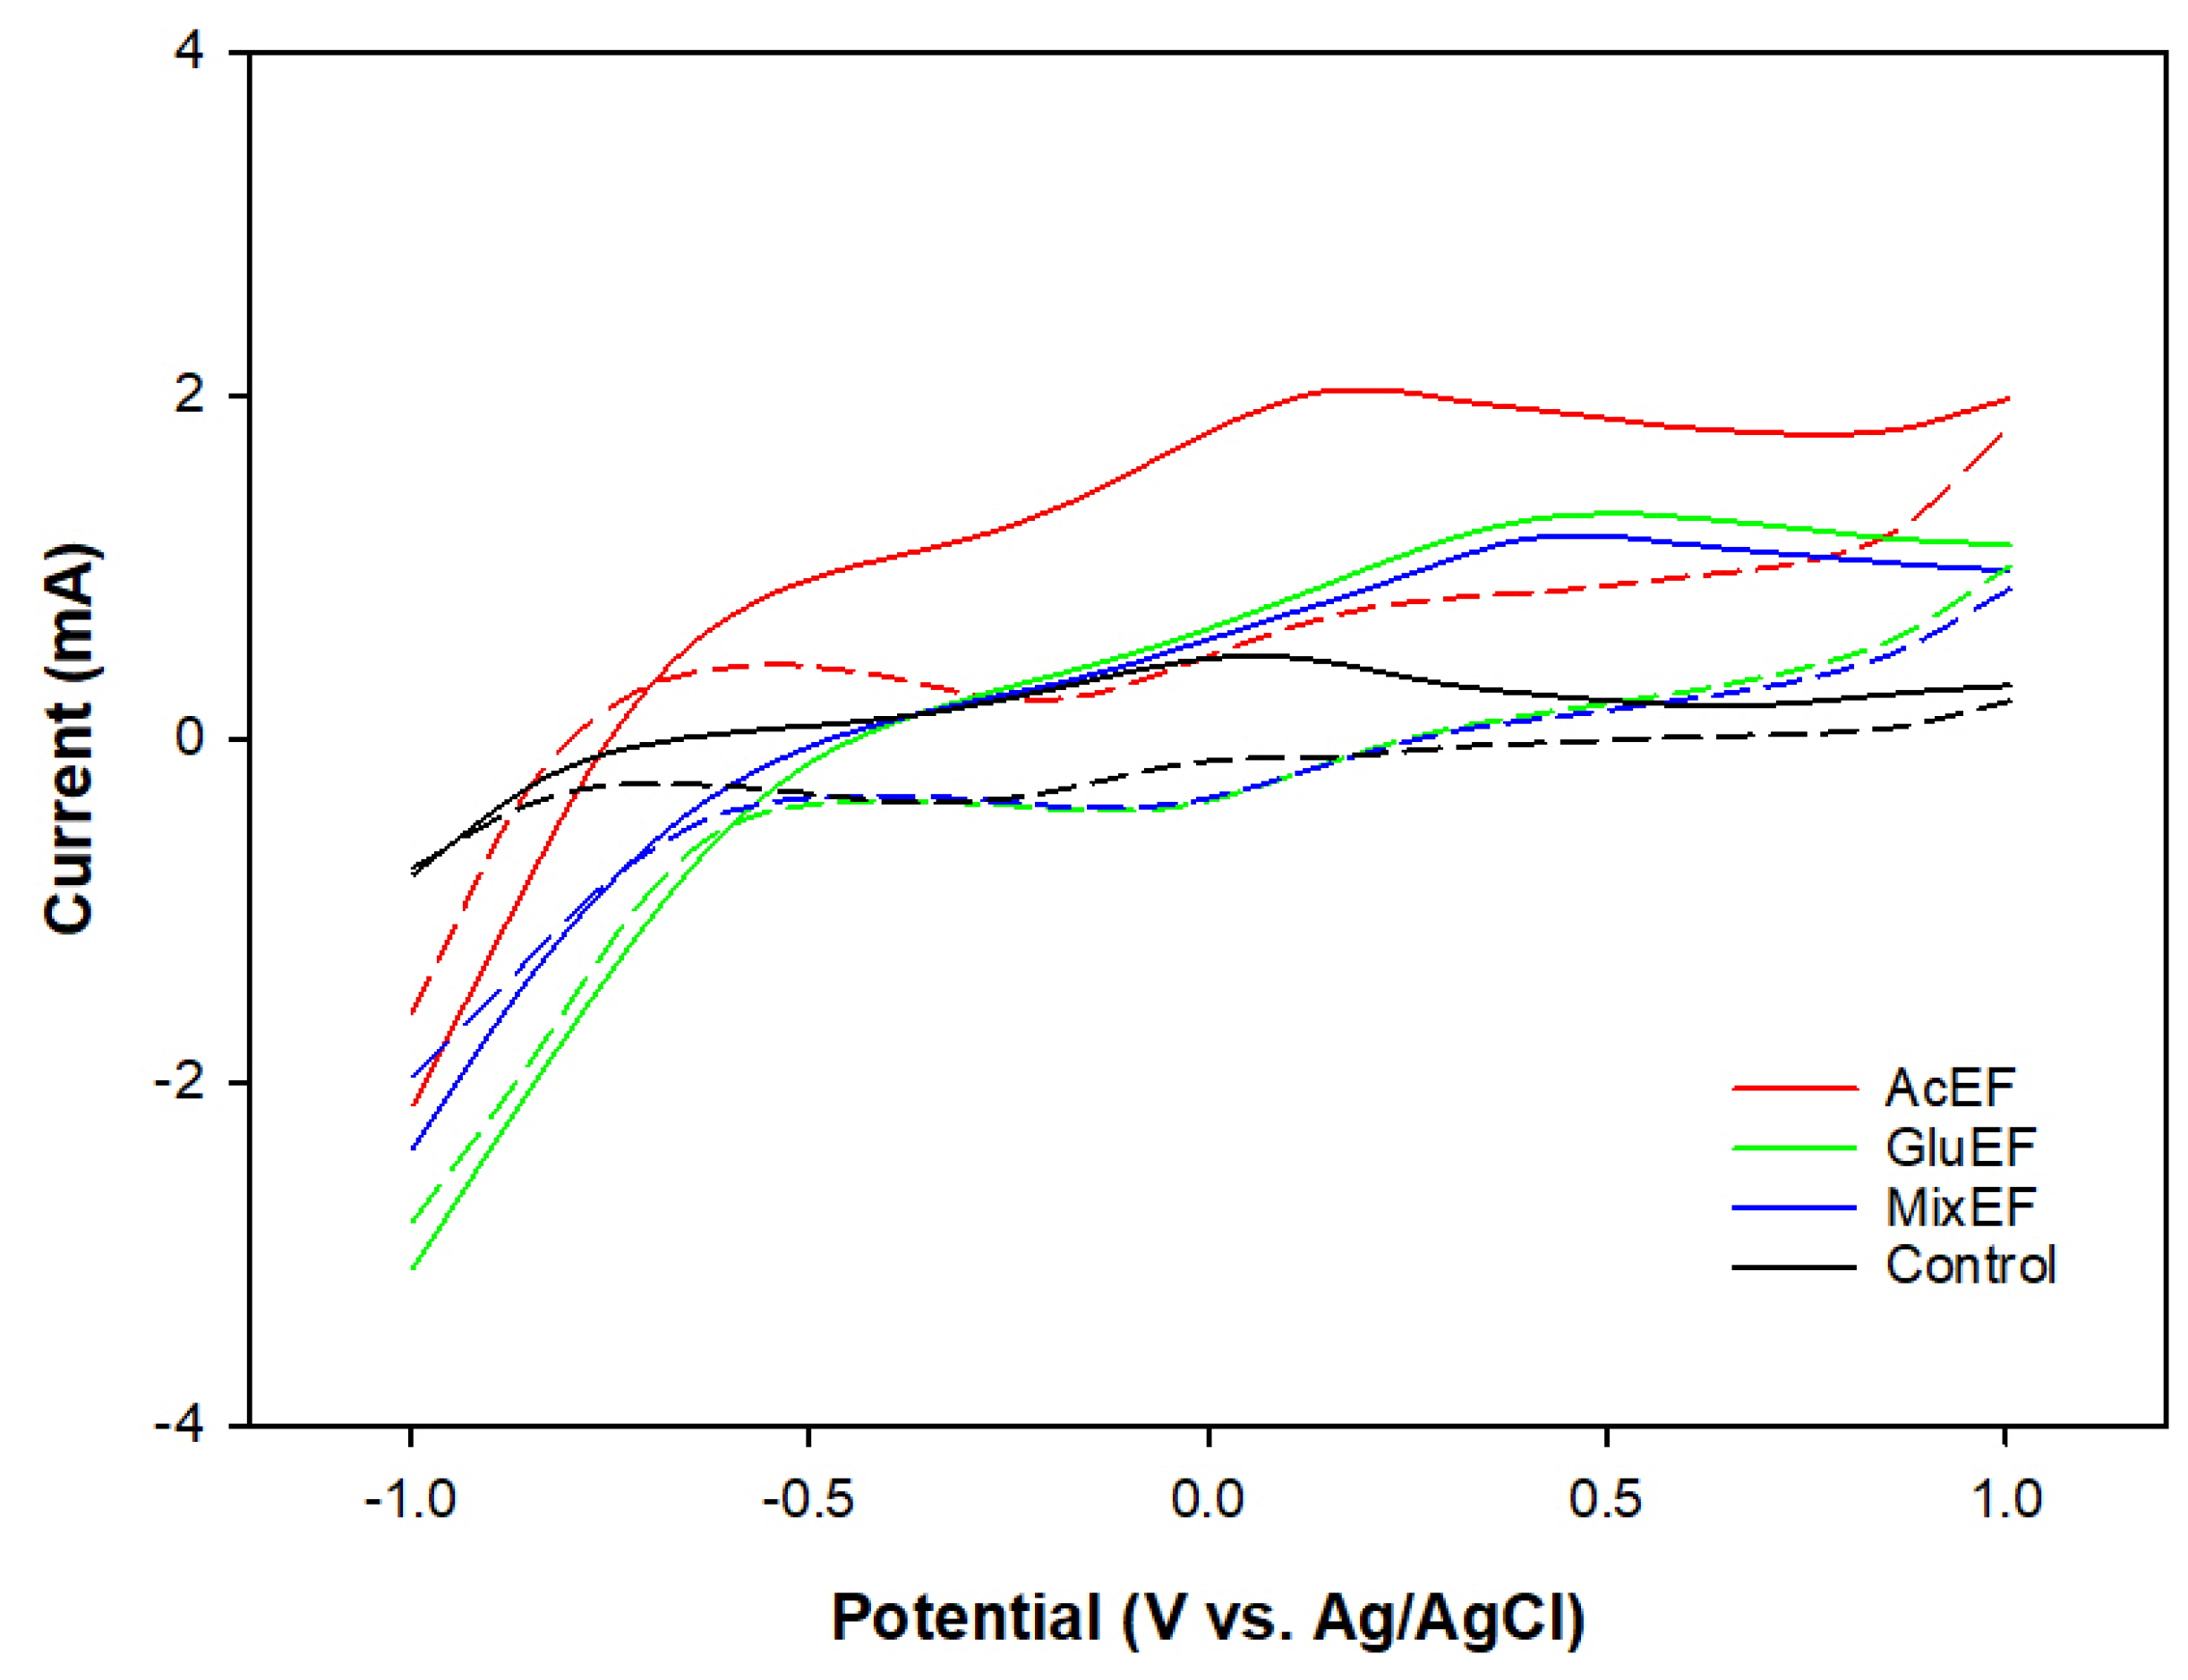
| Ep,o (V) vs. Ag/AgCl | 0.17 | 0.41 | 0.40 | 0.07 |
| Ep,r (V) vs. Ag/AgCl | −0.23 | −0.08 | −0.07 | −0.35 |
| Ef(V) vs. Ag/AgCl | −0.03 | 0.17 | 0.17 | −0.14 |
| Ip,o (mA) | 0.41 | 0.29 | 0.21 | 0.19 |
| Ip,r (mA) | 0.41 | 0.29 | 0.23 | 0.20 |
Publisher’s Note: MDPI stays neutral with regard to jurisdictional claims in published maps and institutional affiliations. |
© 2020 by the authors. Licensee MDPI, Basel, Switzerland. This article is an open access article distributed under the terms and conditions of the Creative Commons Attribution (CC BY) license (http://creativecommons.org/licenses/by/4.0/).
Share and Cite
Oh, G.-G.; Song, Y.-C.; Bae, B.-U.; Lee, C.-Y. Electric Field-Driven Direct Interspecies Electron Transfer for Bioelectrochemical Methane Production from Fermentable and Non-Fermentable Substrates. Processes 2020, 8, 1293. https://doi.org/10.3390/pr8101293
Oh G-G, Song Y-C, Bae B-U, Lee C-Y. Electric Field-Driven Direct Interspecies Electron Transfer for Bioelectrochemical Methane Production from Fermentable and Non-Fermentable Substrates. Processes. 2020; 8(10):1293. https://doi.org/10.3390/pr8101293
Chicago/Turabian StyleOh, Gyung-Geun, Young-Chae Song, Byung-Uk Bae, and Chae-Young Lee. 2020. "Electric Field-Driven Direct Interspecies Electron Transfer for Bioelectrochemical Methane Production from Fermentable and Non-Fermentable Substrates" Processes 8, no. 10: 1293. https://doi.org/10.3390/pr8101293