Shape Characteristics of Coral Sand from the South China Sea


1
School of Civil Engineering, Guangzhou University, Guangzhou 510006, China
2
Guangdong Provincial Engineering and Technology Research Center of Geo-Structure Safety and Protection, Guangzhou University, Guangzhou 510006, China
3
State Key Laboratory of Geotechnical Mechanics and Engineering, Institute of Rock and Soil Mechanics, Chinese Academy of Sciences, Wuhan 430071, China
*
Authors to whom correspondence should be addressed.
J. Mar. Sci. Eng. 2020, 8(10), 803; https://doi.org/10.3390/jmse8100803
Submission received: 1 September 2020
/
Revised: 11 October 2020
/
Accepted: 14 October 2020
/
Published: 15 October 2020
(This article belongs to the Section Physical Oceanography)
Abstract
:The particle shape of coral sand is a crucial factor that affects its accumulation characteristics. Two-dimensional particle images of coral sand with different particle sizes were obtained through optical imaging, and the basic size parameters of particles were measured by digital image processing. The particle shape parameters were created, and on this basis, the variation of shape parameters with size, the distribution characteristics, and the sensitivity of shape parameters were analyzed by mathematical statistics and the fractal theory. In addition, a comparative analysis was conducted for the particle shape and bulk density of coral sand and quartz sand with the same particle size. The results show that (1) for coral sand with particle size ranging from 0.5 to 5.0 mm, as the particle size augments, its overall profile coefficient grows, while the flatness, angularity, and roughness diminish and the particle shape deviates more from the regular circle. (2) The shape of coral sand particles exhibits good fractal characteristics, and the particle shape gets more complex as the particle size grows as evidenced by the fact that the fractal dimension enlarges. (3) All the shape parameters obey a skewed distribution. Concerning the sensitivity to the change in particle shape, the flatness occupies the first place, the overall profile coefficient and angularity come second, and the roughness ranks third, accordingly. It is suggested that flatness should be preferred as the evaluation parameter of the particle shape. (4) Compared with that of quartz sand, the particle shape of coral sand is more irregular, and the intergranular pores are larger under the same accumulation conditions, which is the primary reason why the specific gravity of coral sand is greater than that of quartz sand while the bulk density is smaller than that of quartz sand.
1. Introduction
Recent years have seen large-scale hydraulic reclamation projects launched by China in the South China Sea. For these projects, the coral sand deposited in reefs and lagoons is the only reclaimed material [1,2]. Originated from marine organisms (corals, seaweeds, shells, etc.), coral sand is a special geotechnical material that is abundant in insoluble carbonates, such as calcium carbonate and magnesium carbonate [3,4]. Particle size, gradation, and shape are essential attribute parameters of sandy granular materials. Numerous studies have been conducted on the influence mechanism of the first two attribute parameters (i.e., particle size, gradation) on the engineering properties of sand [5,6,7,8,9,10,11,12,13,14,15,16,17,18]. However, relatively few studies were conducted on particle shape and its influence on the physical and mechanical properties of sand. The results of relevant studies [19,20,21,22,23,24,25] indicate that a change in the particle shape of sand may lead to a change in the particle arrangement and intergranular pores, thereby exerting a remarkable impact on its physical and mechanical properties. Therefore, the study on the morphological characteristics of particles of coral sand serves not only to understand its physical and mechanical properties but also to explore the micro mechanism of its macro physical and mechanical behavior.
The relationship between the shape characteristics and physical and mechanical parameters of granular materials has been systematically studied from the perspectives of theoretical research and experimental testing technology by previous researchers. In terms of theoretical research, computational geometry theory [26], Fourier series description method [27,28], and fractal theory [29] have been proposed to quantitatively describe the particle shape. However, due to the complexity of computational geometry theory and Fourier series description method, they have not been widely used in practical engineering. On the contrary, the calculation method of fractal theory is relatively simple, and it can reflect the shape distribution characteristics of granular materials to a large extent [29]. Therefore, researchers often establish the relationship between particle shape and physical and mechanical parameters of granular materials by fractal theory on the basis of quantitative acquirement of particle shape parameters. For example, Chan and Page [30] studied the influence of the particle shape of copper powder on its internal friction angle, and found that there was a good correlation between fractal dimension of particle shape complexity and coefficient of internal friction. Gori and Mari [31] studied the relationship between the internal friction angle of sandy materials and particle shape, and concluded that there was a linear relationship between the internal friction angle of sandy materials and fractal dimension. Rausch et al. [32] studied the fractal characteristics of particle shape of the volcanic ash based on the fractal theory to conclude that the particle shape of volcanic ash bore multifractal characteristics. In terms of experimental testing technology, two-dimensional particle shape scanning equipment and digital image processing technology are widely used to obtain the basic two-dimensional size parameters of particle materials. Compared with two-dimensional particle shape, three-dimensional particle shape can more truly reflect the shape characteristics of granular materials, especially in the thickness direction of granular materials. However, the testers for extracting the basic three-dimensional size parameters of granular materials require high costs, and the construction process of three-dimensional particle shape parameters is relatively complex. More scholars tend to use two-dimensional particle shape scanner and digital image processing technology to study the two-dimensional shape of granular materials and its impact on the physical and mechanical properties, achieving abundant research results. For example, based on the comparative analyses about the effectiveness of convexity, roundness, and shape factor in describing particle edges and corners, Mora and Kwan [33] believed that convexity could better reflect the convexity degree of the edges and corners around the particles. Sukumaran and Ashmawy [34] proposed two parameters to describe the particle shape and angularity of granular materials, and on this basis found that drained friction angle and pluviated void ratio of granular materials increased with the increase of the two parameters. Cho et al. [35] studied the relationship between the shape parameters of sand particles and its bulk density and believed that the increase of angularity or eccentricity of sand particles would lead to the minimum and maximum void ratio increases. Cox and Budhu [36] measured the particle shape parameters of eight kinds of sand and found that circularity, roundness, compactness, sphericity, aspect ratio, and modratio were the key shape parameters for distinguishing the different sand. With the aid of the digital image processing technology, Felekoglu [37] and Altuhafi et al. [38] proposed the quantitative approaches of particle shape parameters such as length-to-width ratio, roundness, and convexity. Shin and Santamarina [39] studied the mechanical response of sand particles made of round and angular grains, and pointed out that the void ratio and internal friction angle of mixed sand increased in addition to the mass fraction of angular particles. Yang and Luo [40] performed multiple sets of dynamic triaxial shear tests on quartz sand with different particle shapes and found that the more regular the particle shape was, the more likely it was to liquefy. A comparative study on the particle shape of manufactured sand and river sand was conducted by Shen et al. [41] who noted that the roundness and aspect ratio of manufactured sand were higher than those of river sand and its distribution range was also wider than that of river sand, but its roughness was smaller. After conducting multiple triaxial compression tests on geotechnical materials with different particle shapes, Keramatikerman and Chegenizadeh [42] pointed out that critical friction angle (ϕcs) of the sample decreased with the increase of its roundness, sphericity, and regularity. Xu et al. [43] revealed the micro mechanism of the mechanical behavior of a sand–gravel mixture in a single shear test from the perspective of particle shape. Ren et al. [44] analyzed the influence of the particle shape of manufactured sand on the diffusion coefficient of manufactured mortar, which proved that the more regular the particle shape of manufactured sand, the higher the diffusion coefficient. Sarkar et al. [45] carried out a series of triaxial shear tests and direct shear tests on granular materials with different particle shapes (i.e., crushed glass, Rhein sand, and round glass beads) and found that the particle shape had a significant effect on the shear strength, peak friction and dilation angle of granular materials. Zhang et al. [46] made a quantitatively analysis of particle breakage and compressibility behavior of calcareous sand and completely decomposed granite under one-dimensional compression test condition, and pointed out that carbonate sand was stronger than completely decomposed although carbonate sand had extremely irregular particle shape.
In summary, a series of studies on the relationship between the shape characteristics of granular materials and their physical and mechanical properties that have been made by the previous researchers generally used quartz sand, volcanic ash, and other terrigenous geotechnical materials as the objects. Meanwhile, studies on the particle shape of coral sand are reported minimally. Owing to its special marine biological origin, coral sand, which is often accompanied with cementation [47,48], features high porosity ratio [49,50], easy breakage [51,52], and other physical and mechanical properties that are significantly different from those of terrigenous sediments. However, it has not been confirmed by experimental data whether the above research results are applicable to coral sand. Therefore, based on the basic size parameters of coral sand particles extracted by the digital image processing technology and construction of particle shape parameters, a quantitative study on the impact of particle size on the shape of coral sand particles was conducted, and the sensitivity and distribution characteristics of particle shape parameters were analyzed through mathematical statistics and fractal theory. Further, a comparative study of the particle shape of coral sand and quartz sand was performed to reveal the microscopic and microscopic mechanisms of their difference in bulk density from the perspective of particle shape. The research results provide a deep understanding of the sedimentation characteristics of coral sand from microscopic and mesoscopic level.
2. Materials and Methods
2.1. Experimental Material
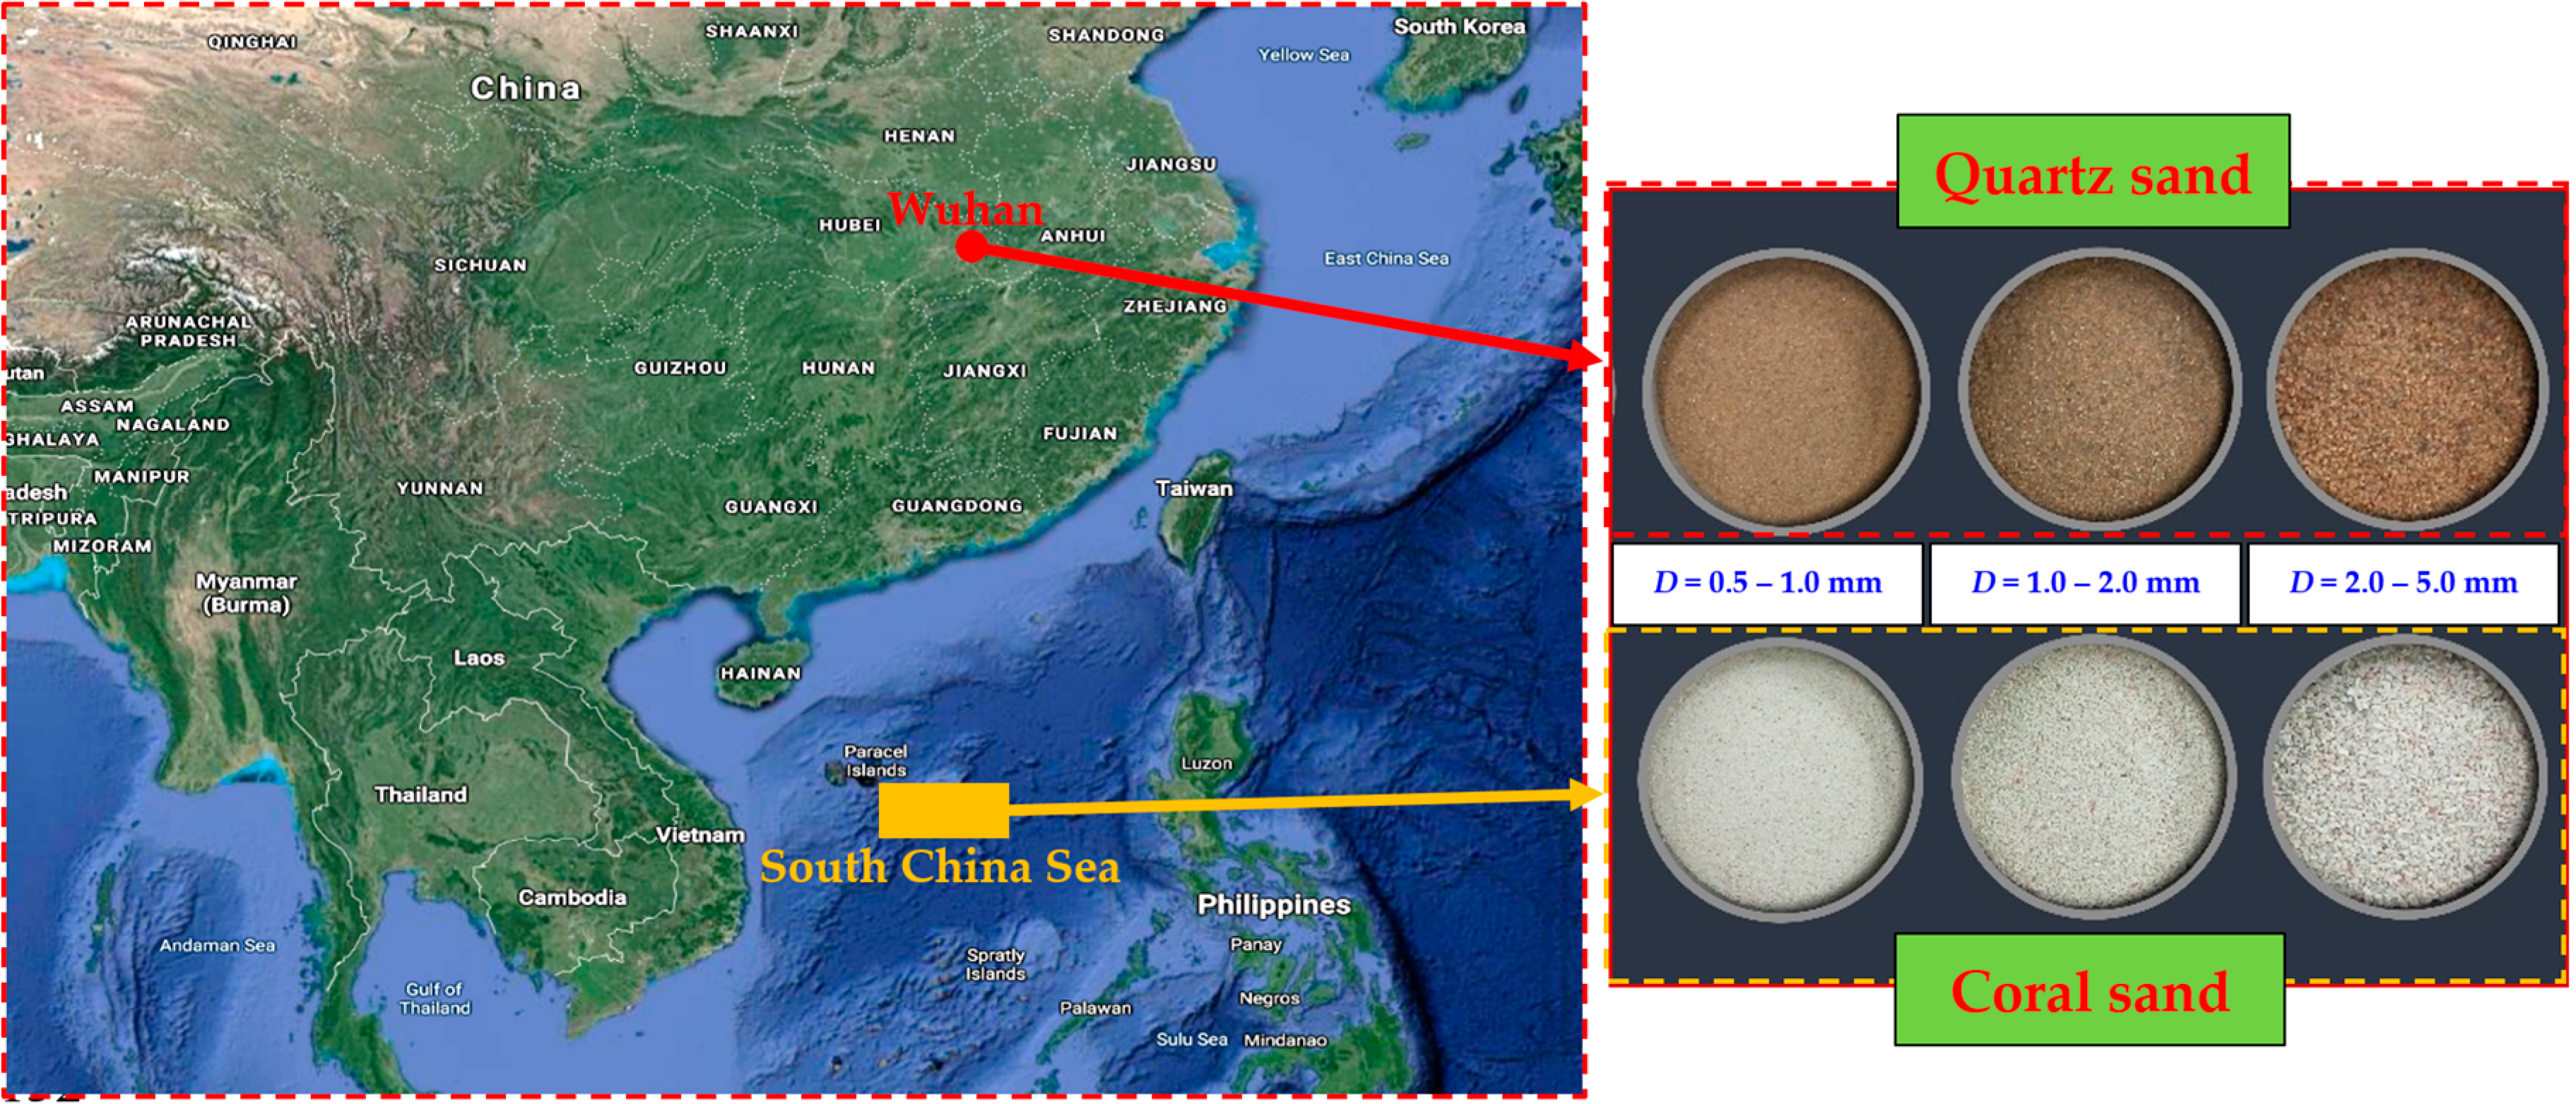
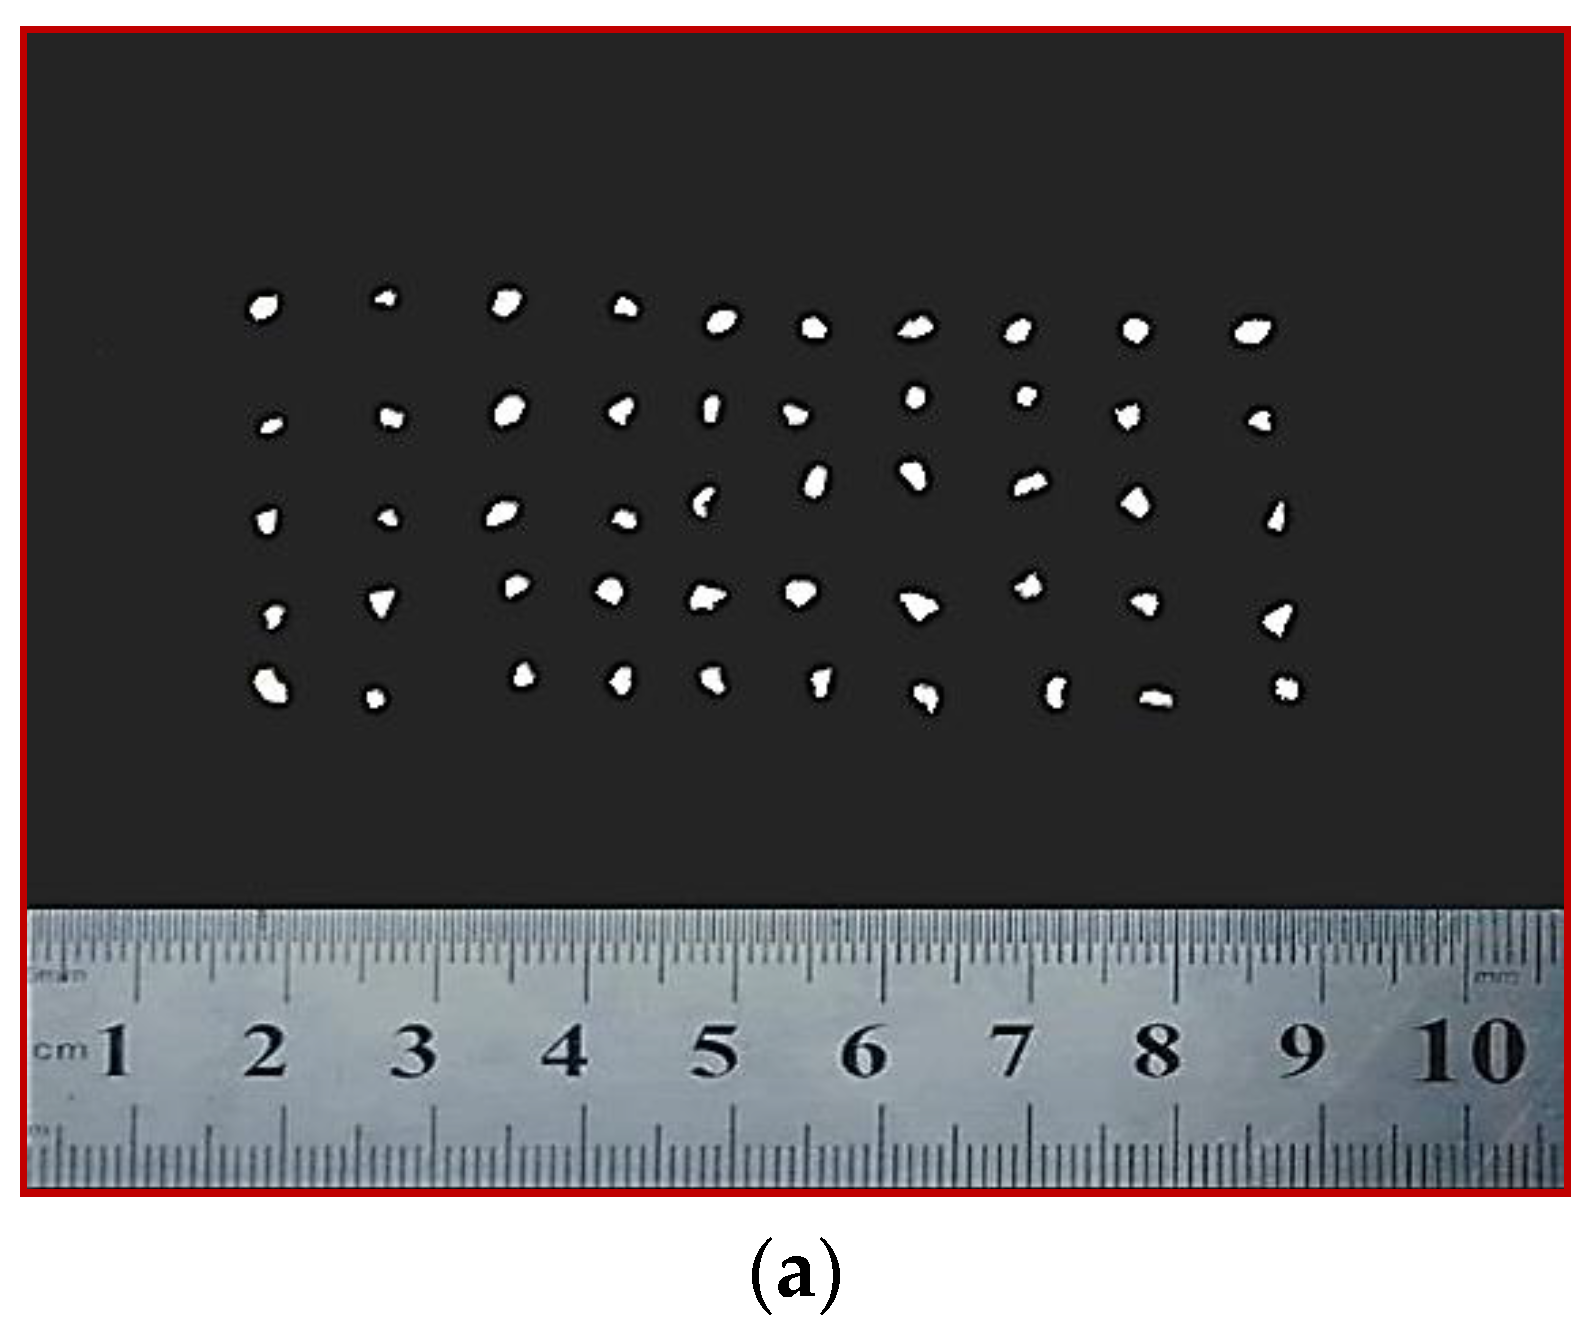
The on-site geological survey of a reclamation island reef in the South China Sea found that the most abundant sediment possessed by the reclamation layer is sand, whose particle size is mostly distributed within 0.5–5.0 mm [1]. To better serve the engineering practice, in this study, the coral sand from the island reclamation site was screened to be used as research objective with particle sizes of 0.5–1.0 mm (coral medium sand), 1.0–2.0 mm (coral coarse sand), and 2.0–5.0 mm (coral gravel sand). Meanwhile, for a comparative analysis of the particle shape of coral sand and quartz sand, the same screening test was performed on quartz sand from the Yangtze River in Wuhan, China, and quartz sand with different particle sizes ranging from 0.5 to 5.0 mm were obtained (Figure 1).
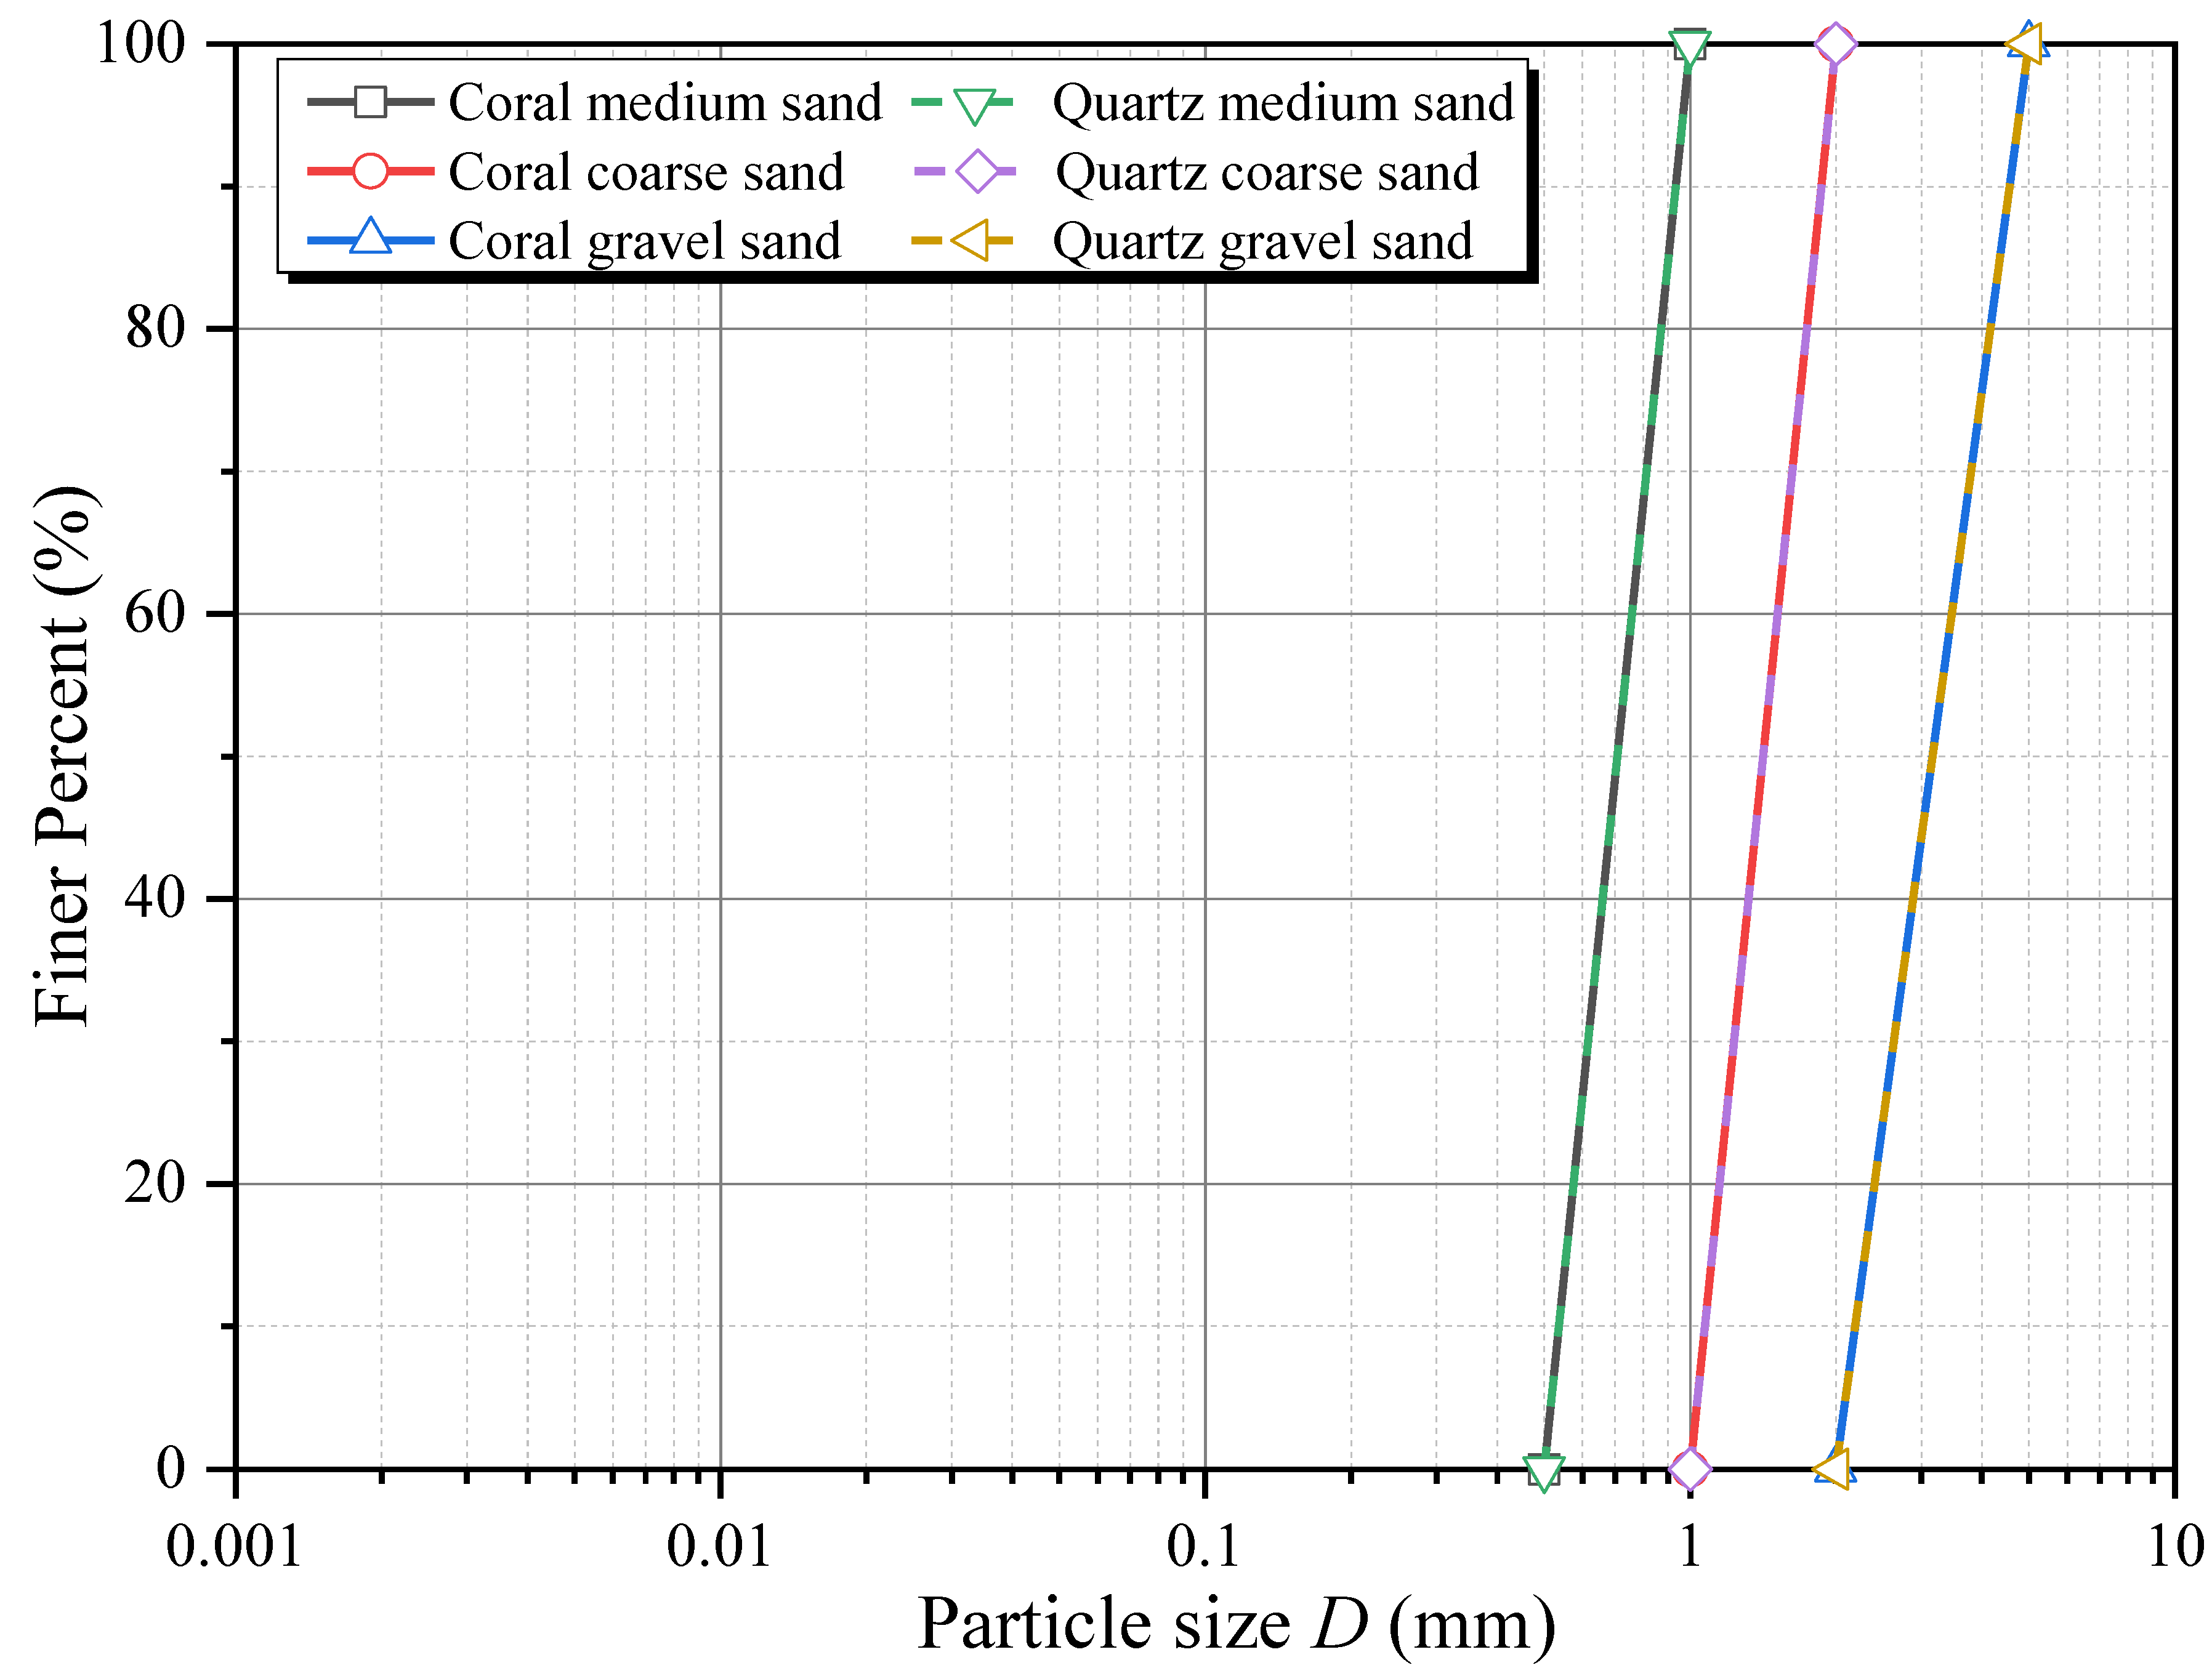
Figure 2 shows the particle size distribution curves of coral sand and quartz sand with different grain groups. Table 1 lists the particle gradation parameters of the tested material. It can be seen from Figure 2 and Table 1 that within each grain group, the particle size distribution curves of coral sand and quartz sand are completely coincident, and the corresponding particle gradation parameters are also identical.
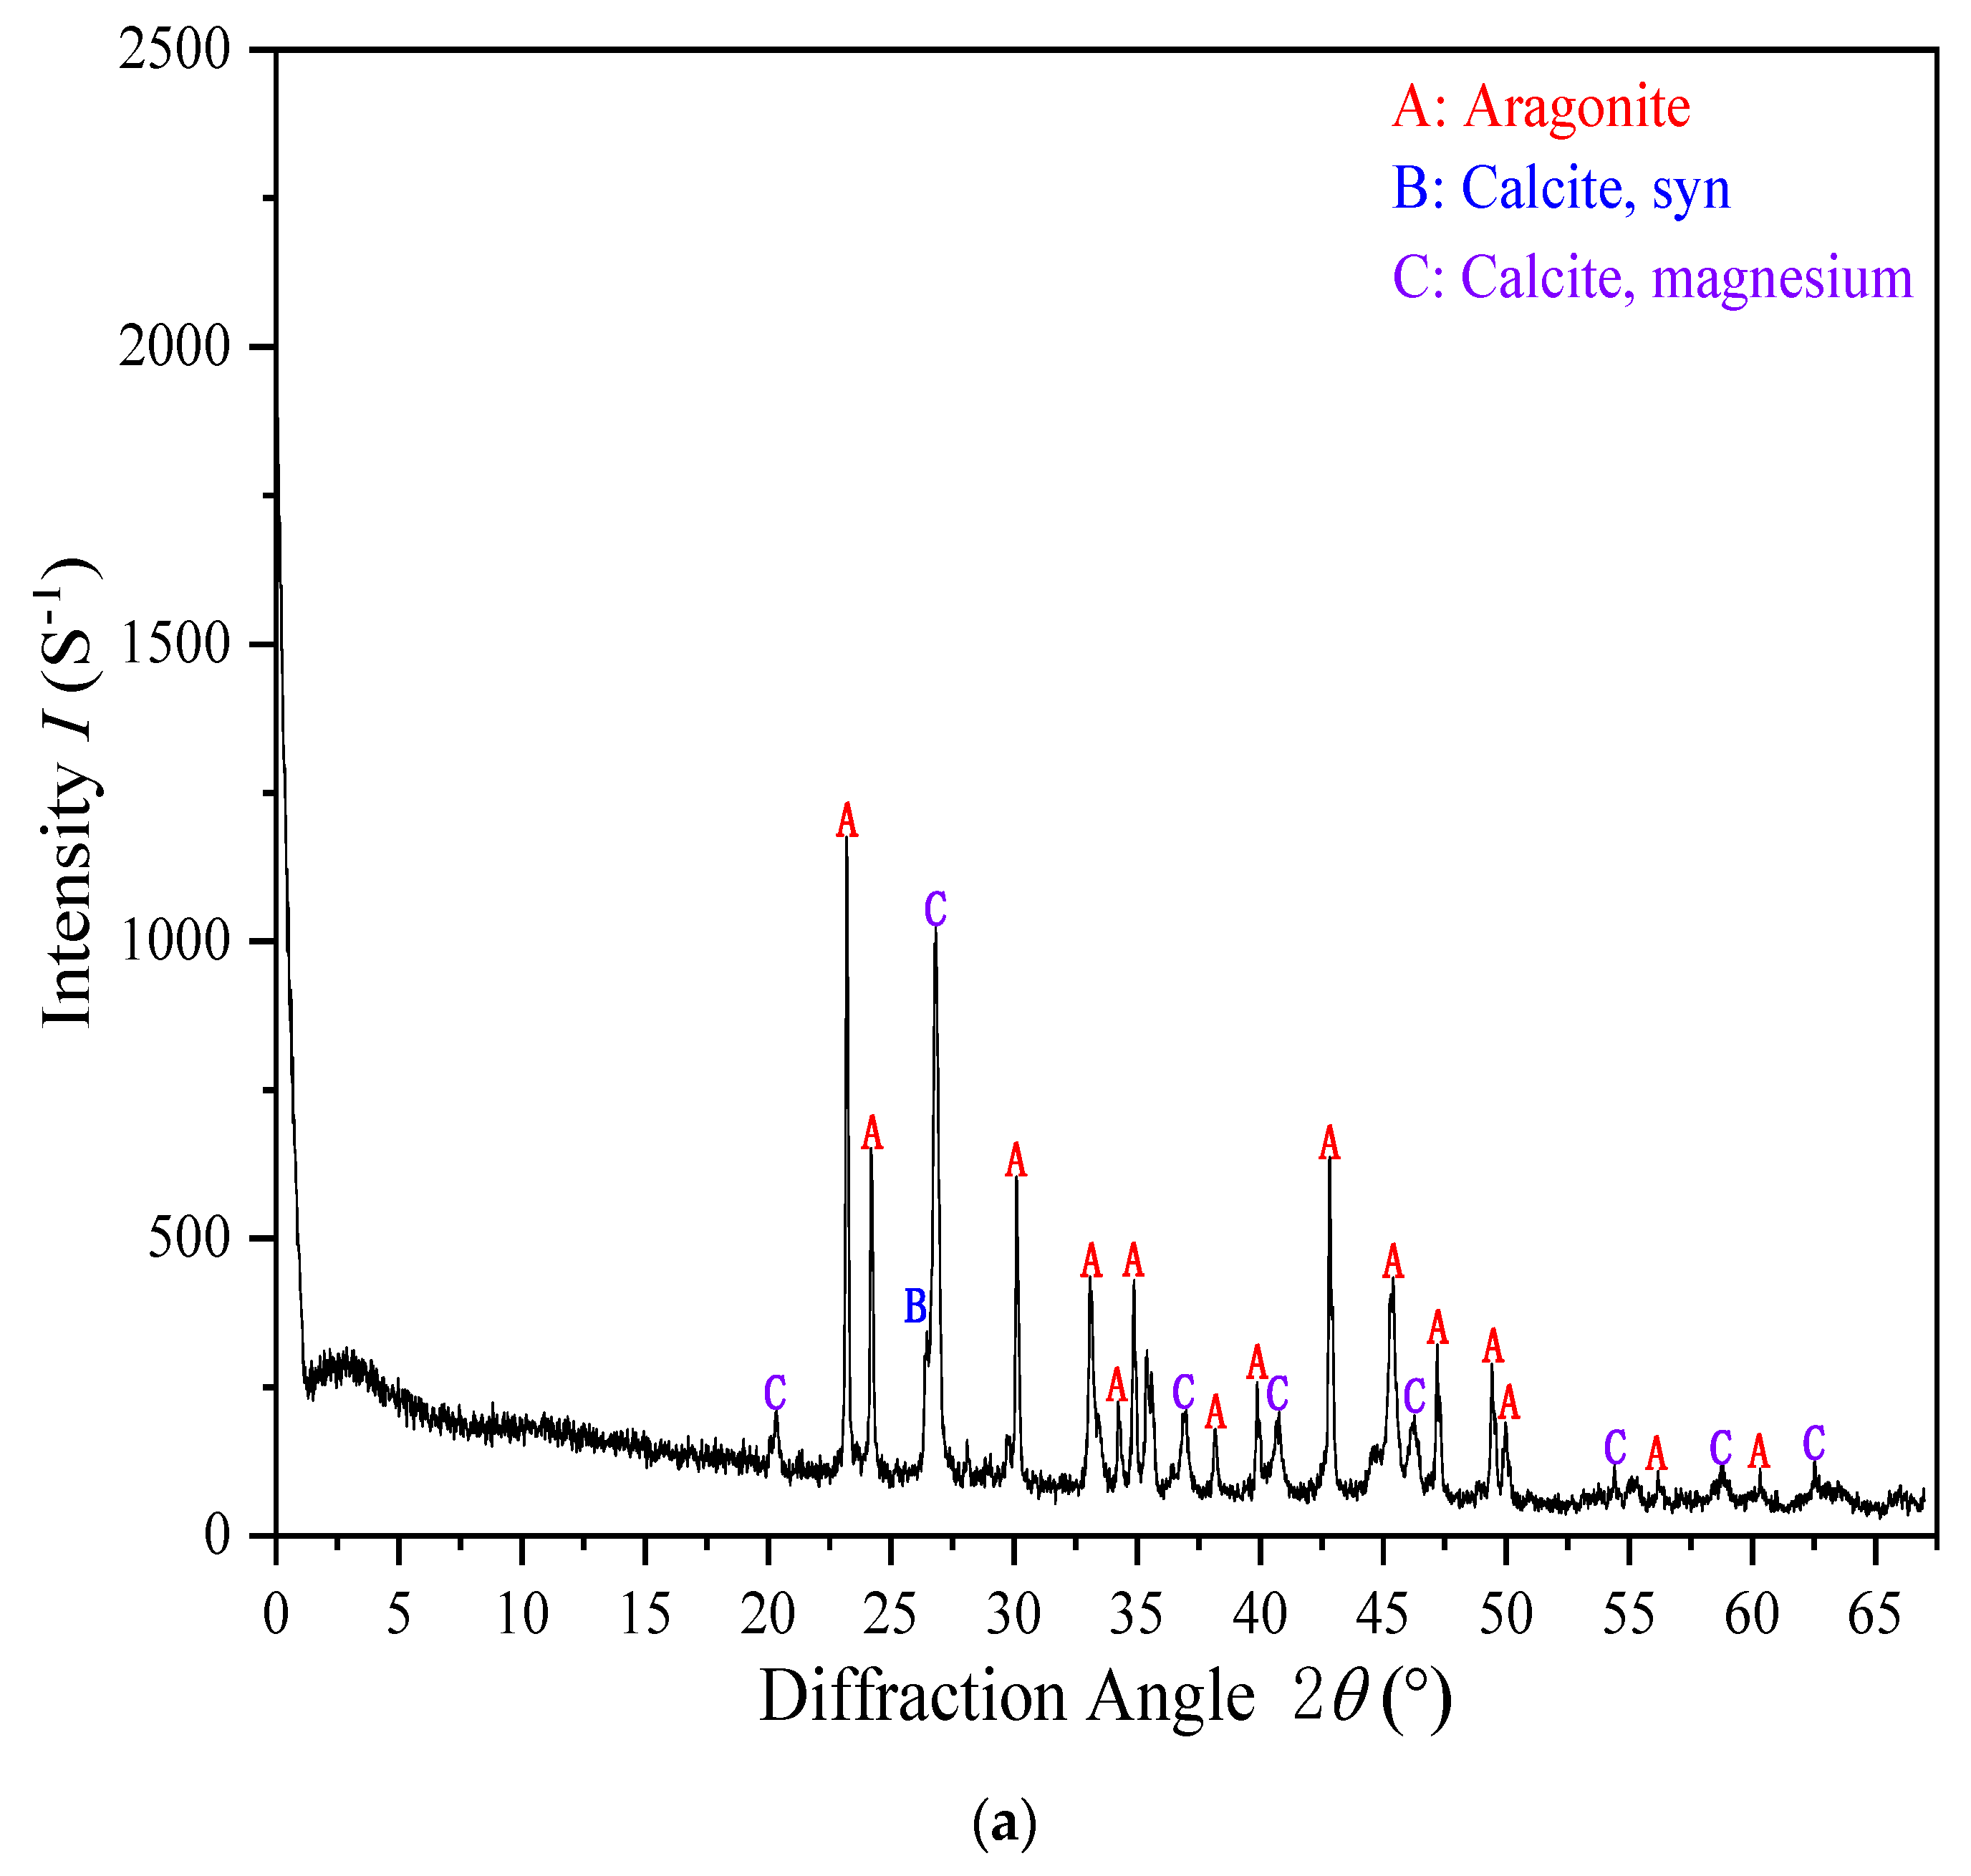
The coral sand and quartz sand presented in Figure 1 were tested by X-ray diffraction, and the difference in their mineral composition was quantitatively analyzed. Figure 3 shows the X-ray diffraction patterns of coral sand and quartz sand. It is seen from Figure 3 that the mineral composition of coral sand is relatively simple, which is composed of aragonite, calcite, and magnesium calcite. Specifically, the chemical composition of aragonite or calcite is CaCO3, and magnesium calcite also harbors CaCO3. From the calculation, the content of CaCO3 in the coral sand tested amounts to approximately 99%, confirming that this is a type of special geotechnical material with extremely high content of CaCO3. Conversely, the mineral composition of quartz sand is relatively complex, which is composed of quartzite, albite, plagioclase, mica, montmorillonite clay minerals, and actinolite carbonate minerals, along with SiO2, which is the main chemical constituent of quartz sand. The difference in mineral composition between coral sand and quartz sand renders the color and single particle strength of coral sand distinct from those of quartz sand, and the specific gravity of coral sand (2.78–2.84) is also higher than that of quartz sand (2.65).
2.2. Experiment Apparatus and Operations
The entire experiment process can be divided into three steps: preparation before experiment, acquisition of particle images, and extraction of basic size parameters of particles.
(1) Prior to the experiment, coral sand and quartz sand with different particle sizes were washed with clean water and then dried to prevent measurement error of particle shape caused by fine particles adhering to the surface of coarse particles. Meanwhile, to remove the influence of sample quantity on the test results, for each grain group of coral sand and quartz sand, 200 particles were randomly selected as the samples of this experiment.
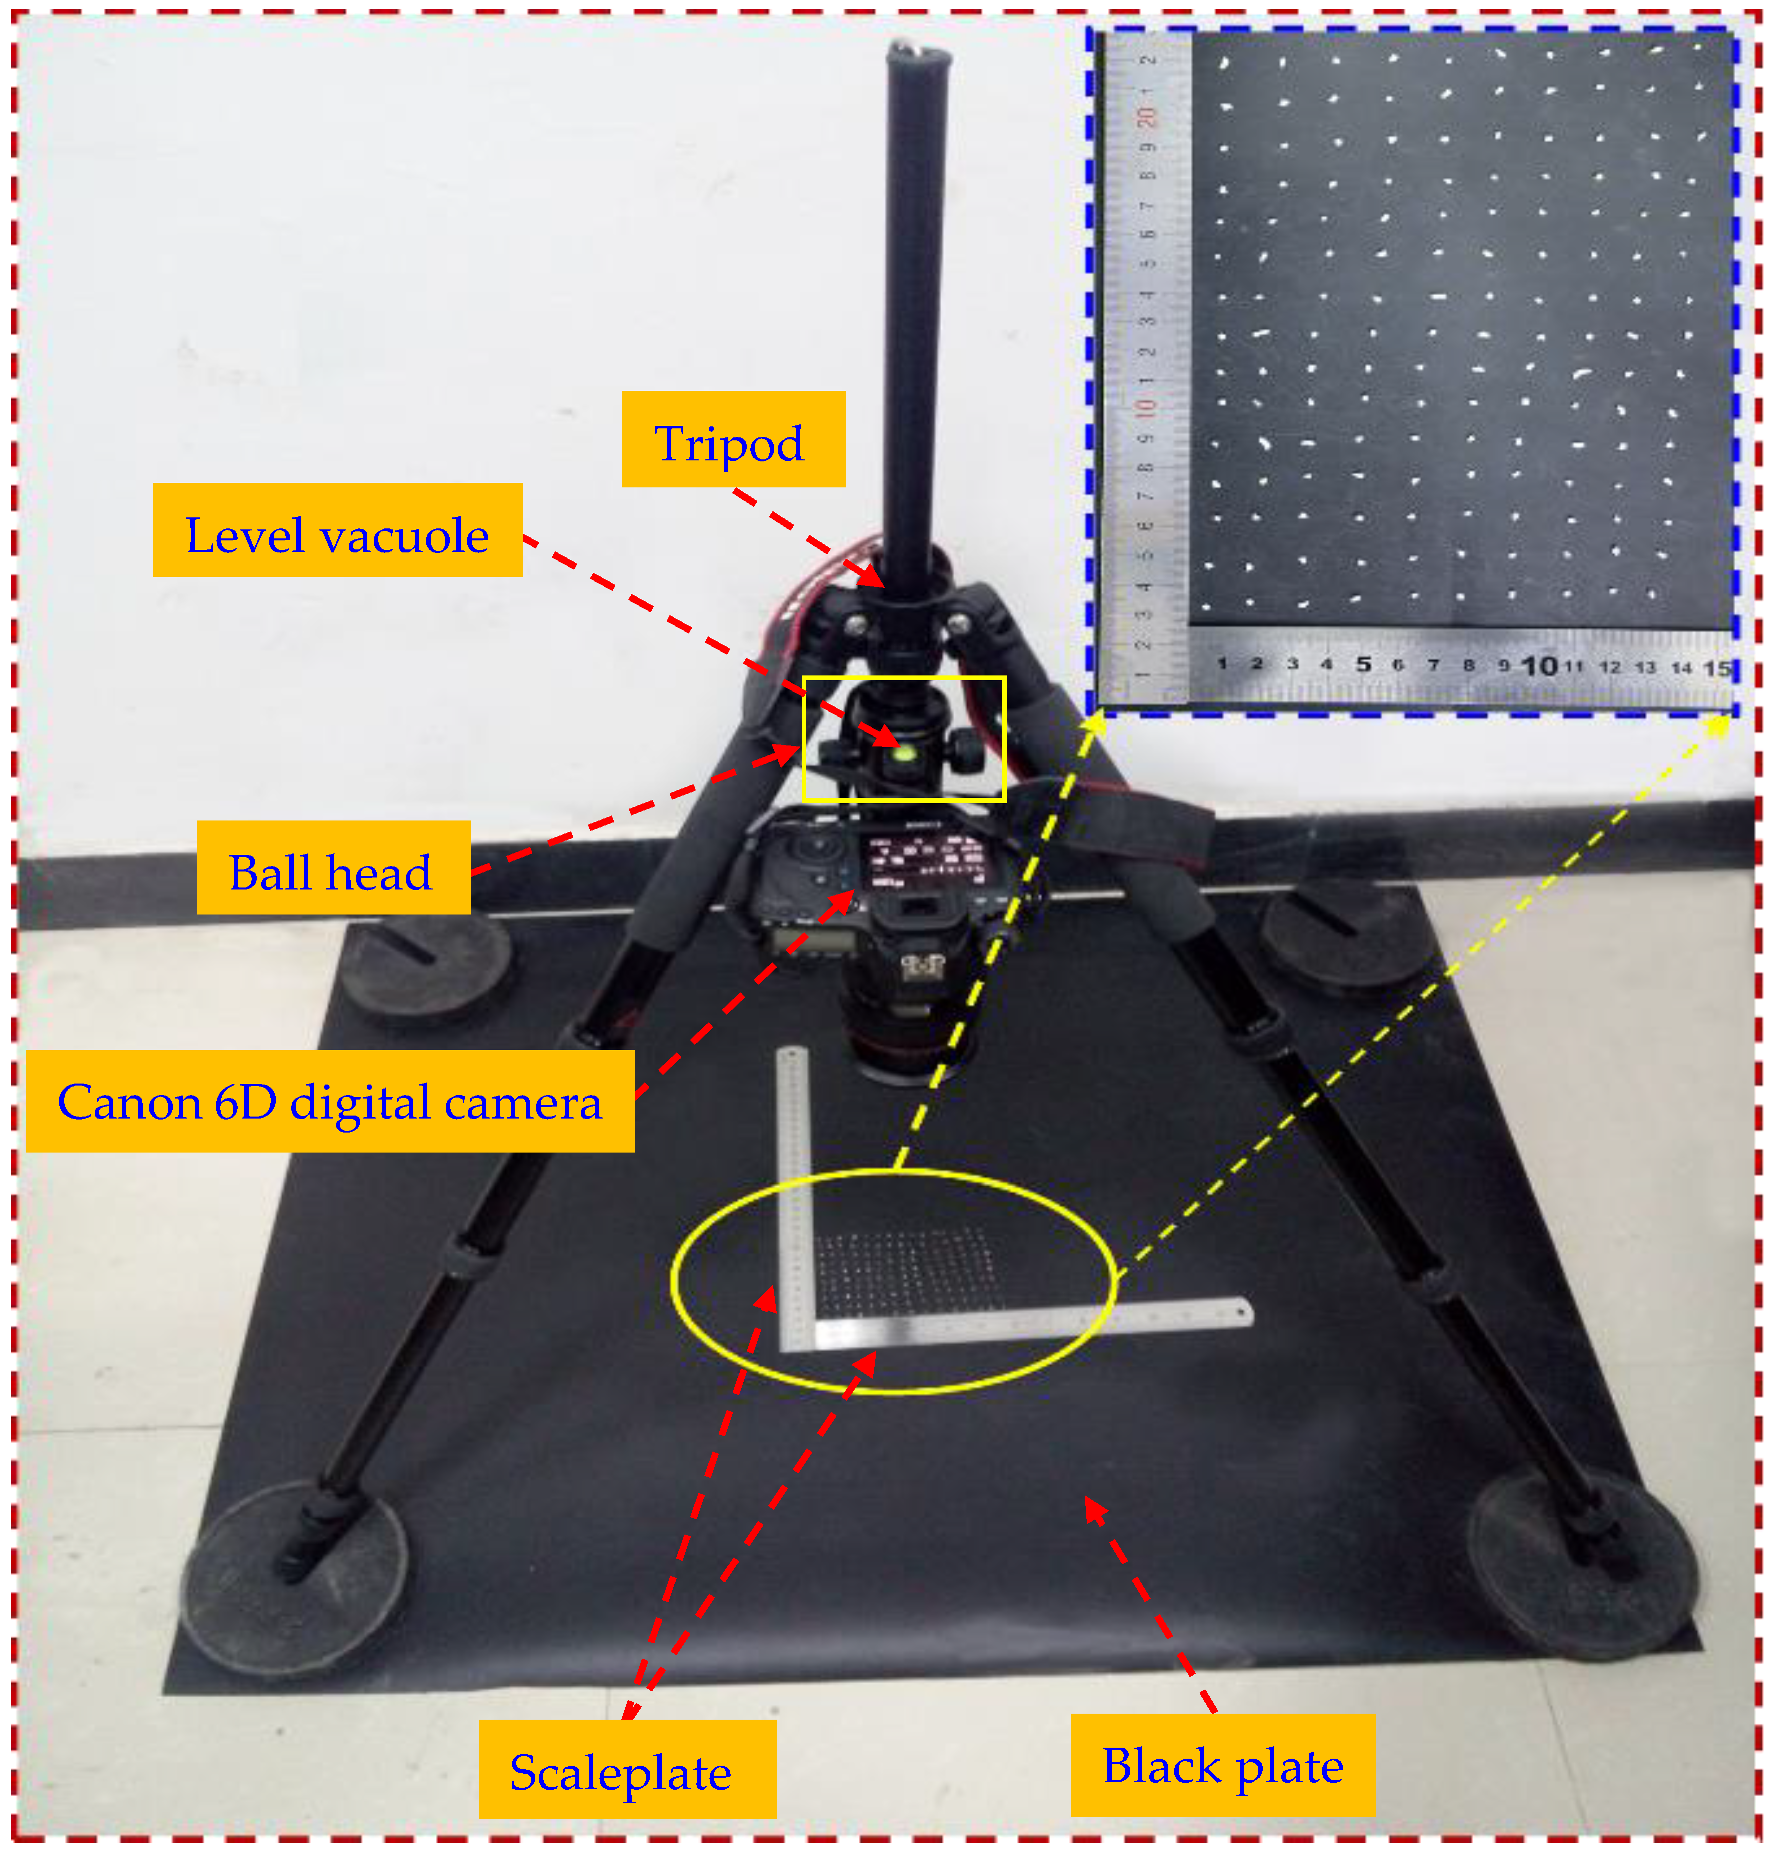
(2) Under the condition of ample light, sand particles of the different grain groups were pictured with the digital camera to acquire clear particle images. It is worth noting that as both coral sand and quartz sand are geotechnical materials with uniform and bright color, a black plate was laid under the sand particles to be measured during the shooting process to eliminate the influence of image background color on the measurement results. To facilitate the subsequent image processing to calibrate the particle size, two scaleplates with clear scale were placed within the lens coverage (Figure 4).
The test apparatus (Figure 4) is a Canon 6D digital camera manufactured by Canon Inc. with as many as 20.2 million pixels and image resolution of 5472 × 3648 pixels per inch (PPI). The tripod, which can be inverted, is provided with a ball head on which the camera can be fixed through a quick mounting plate. Based on the level vacuole on the ball head, the camera can shoot vertically by adjusting the relative positions of the three legs of the tripod. The pixel value of the digital camera determines that the particle image of geotechnical materials with particle size more than 0.25 mm can be obtained by using this device. Zhang et al. [53] studied the particle shape of gravel soil with a similar experimental device and obtained good experimental results, indicating this method can be used to measure the particle shape of geotechnical materials and the test accuracy can meet the test requirements.
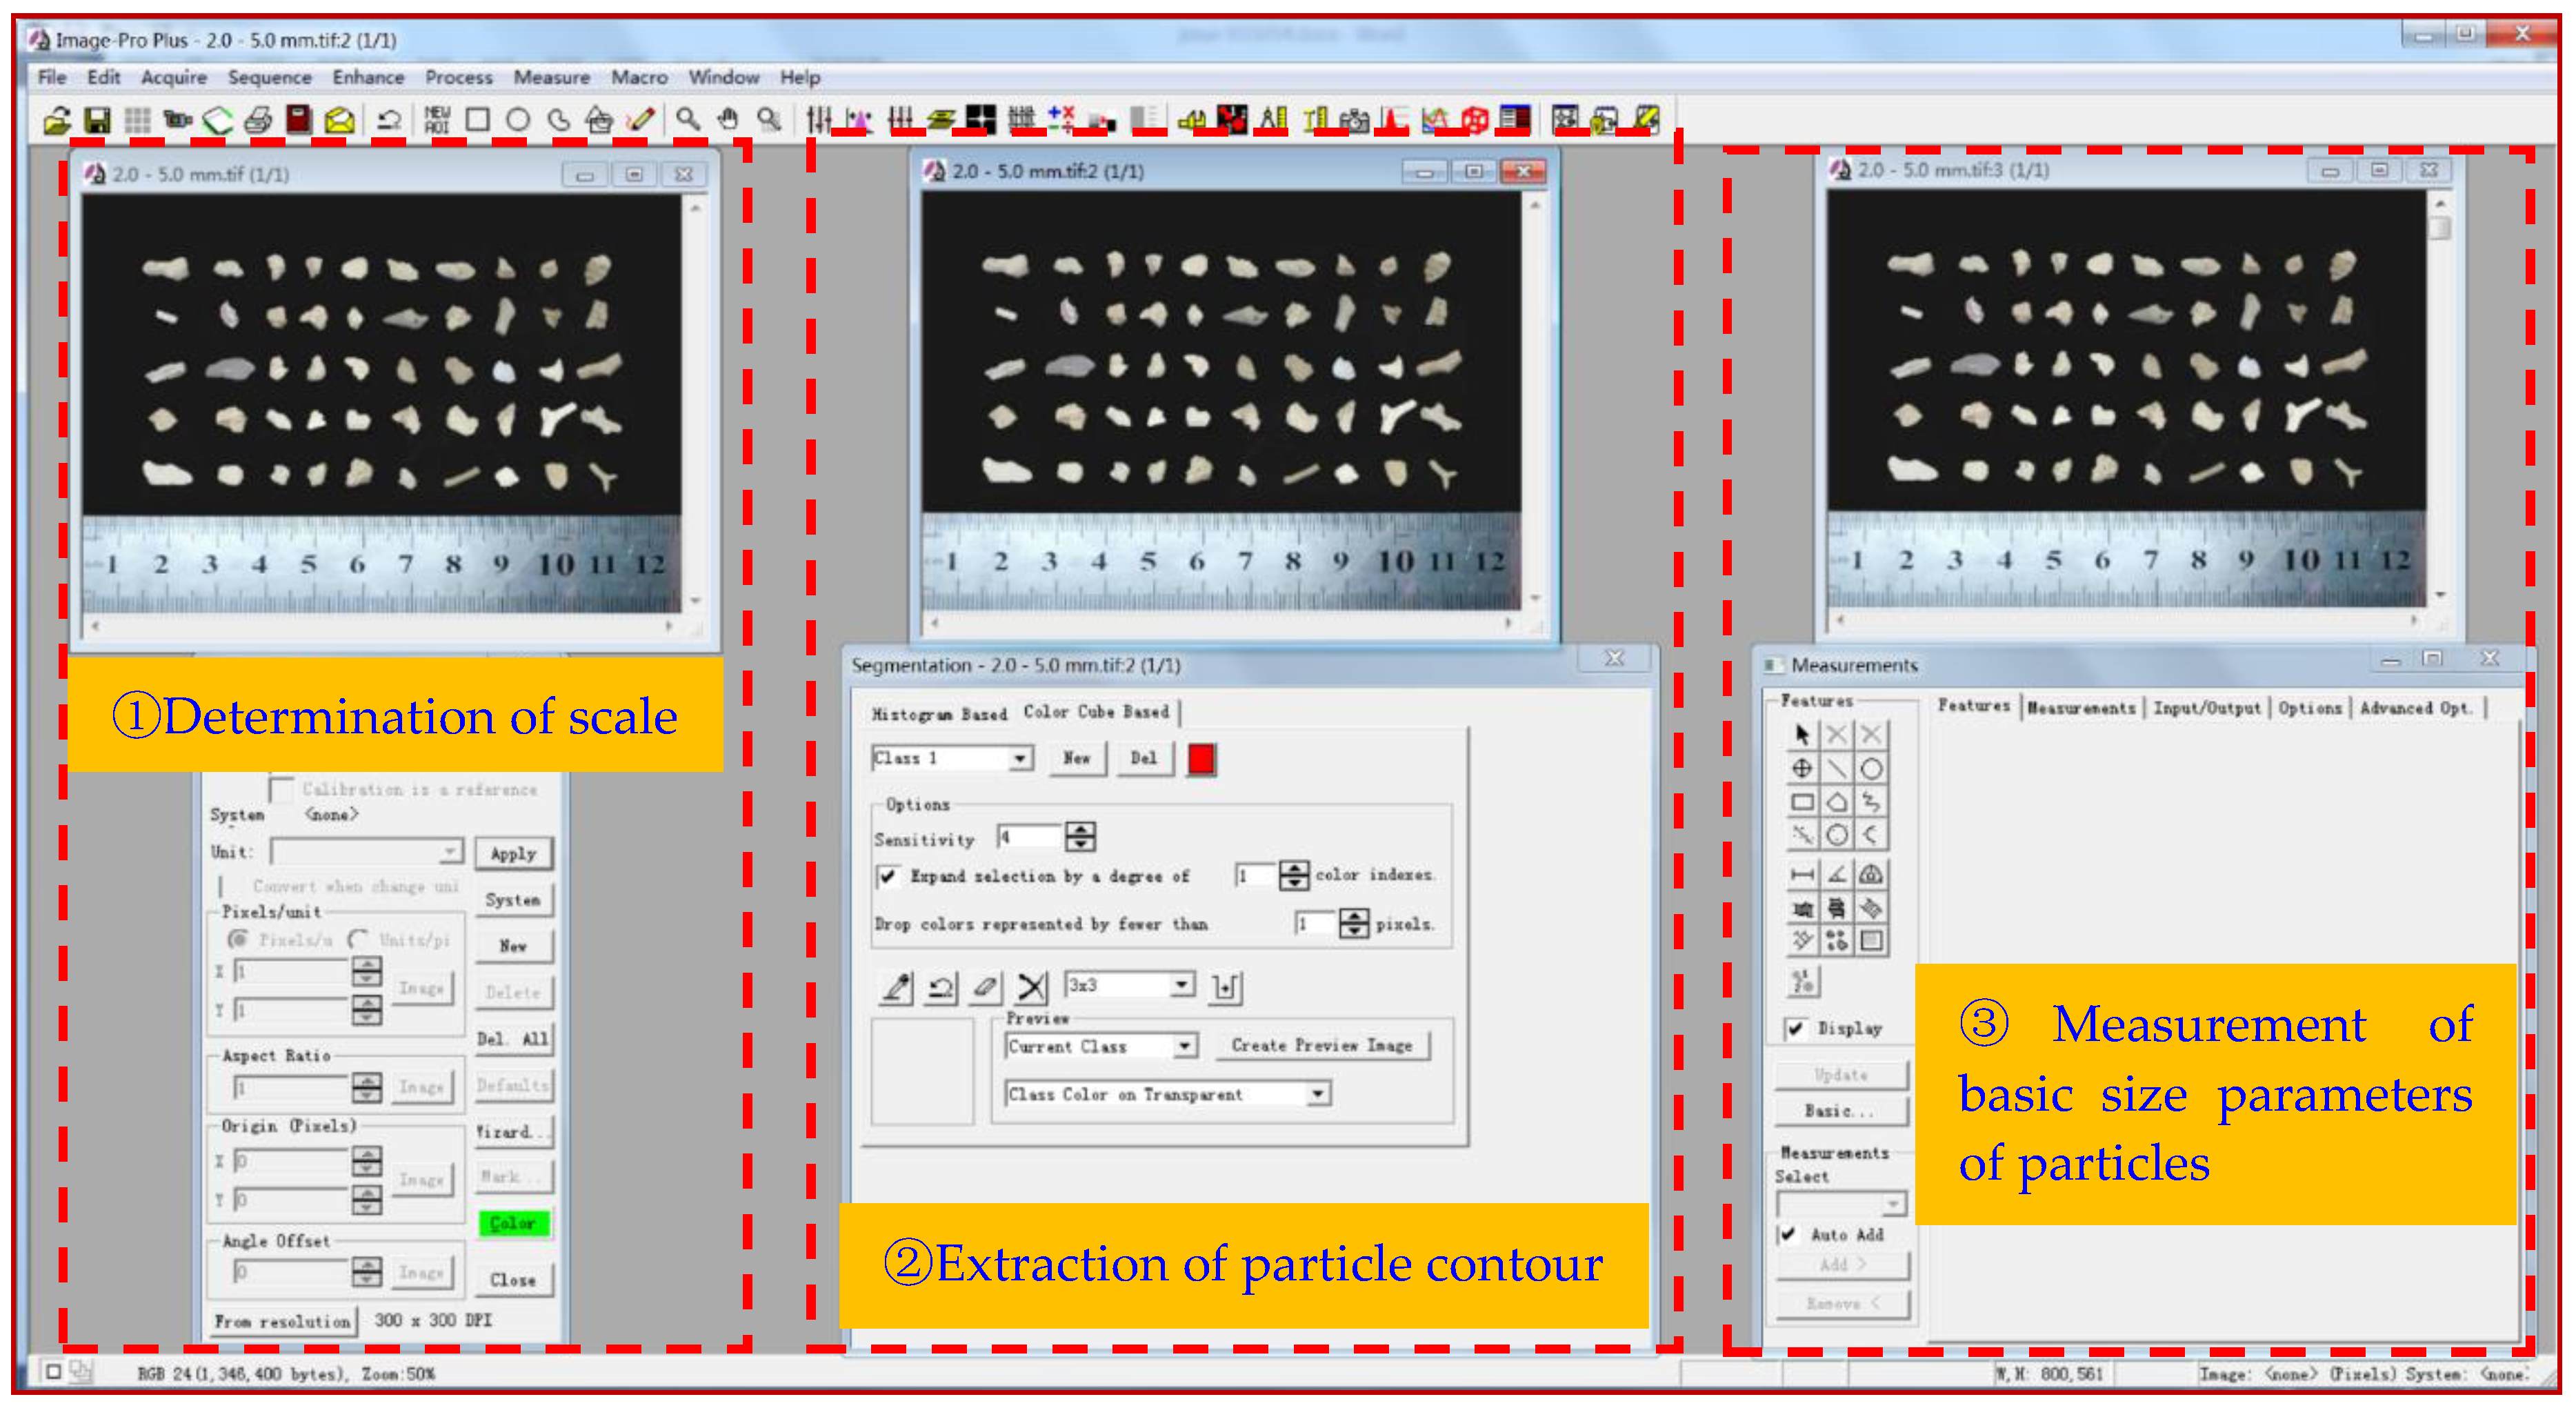
(3) The basic size parameters of the particle were extracted using Image Pro Plus (IPP), which is a powerful image processing, enhancement, and analysis software complete with various image measurement tools, analysis plates, and macro and plug-ins for specific applications that allow users to write their own code (Figure 5).
In the subsequent analysis, the quantification of particle basic size parameters was completed using the built-in measurement tools and analysis plates of IPP. First, the plotting scale (pixel value: physical length) was determined based on the pixel value and real physical length of the scaleplate in the image so that the pixel value used to describe the particle shape could be converted into the actual geometric size in the subsequent parameter extraction process. Note that adjusting the vertical distance between the digital camera and the particles during the shooting process is not allowed to avoid frequent verification of the scale of each image during extraction of the basic siz11e parameters of the particle; otherwise, the scale of the images obtained after the adjustment should be corrected again. Second, the black-and-white binarization was performed on the captured image (Figure 6) to extract the two-dimensional projection contour of the particles. Relevant research results [54] show that pixel count has a significant effect on the calculation of particle shape parameters. In order to obtain the accurate values of particle shape parameters after converting raw images to binary images, the raw images taken should have enough high pixel value.
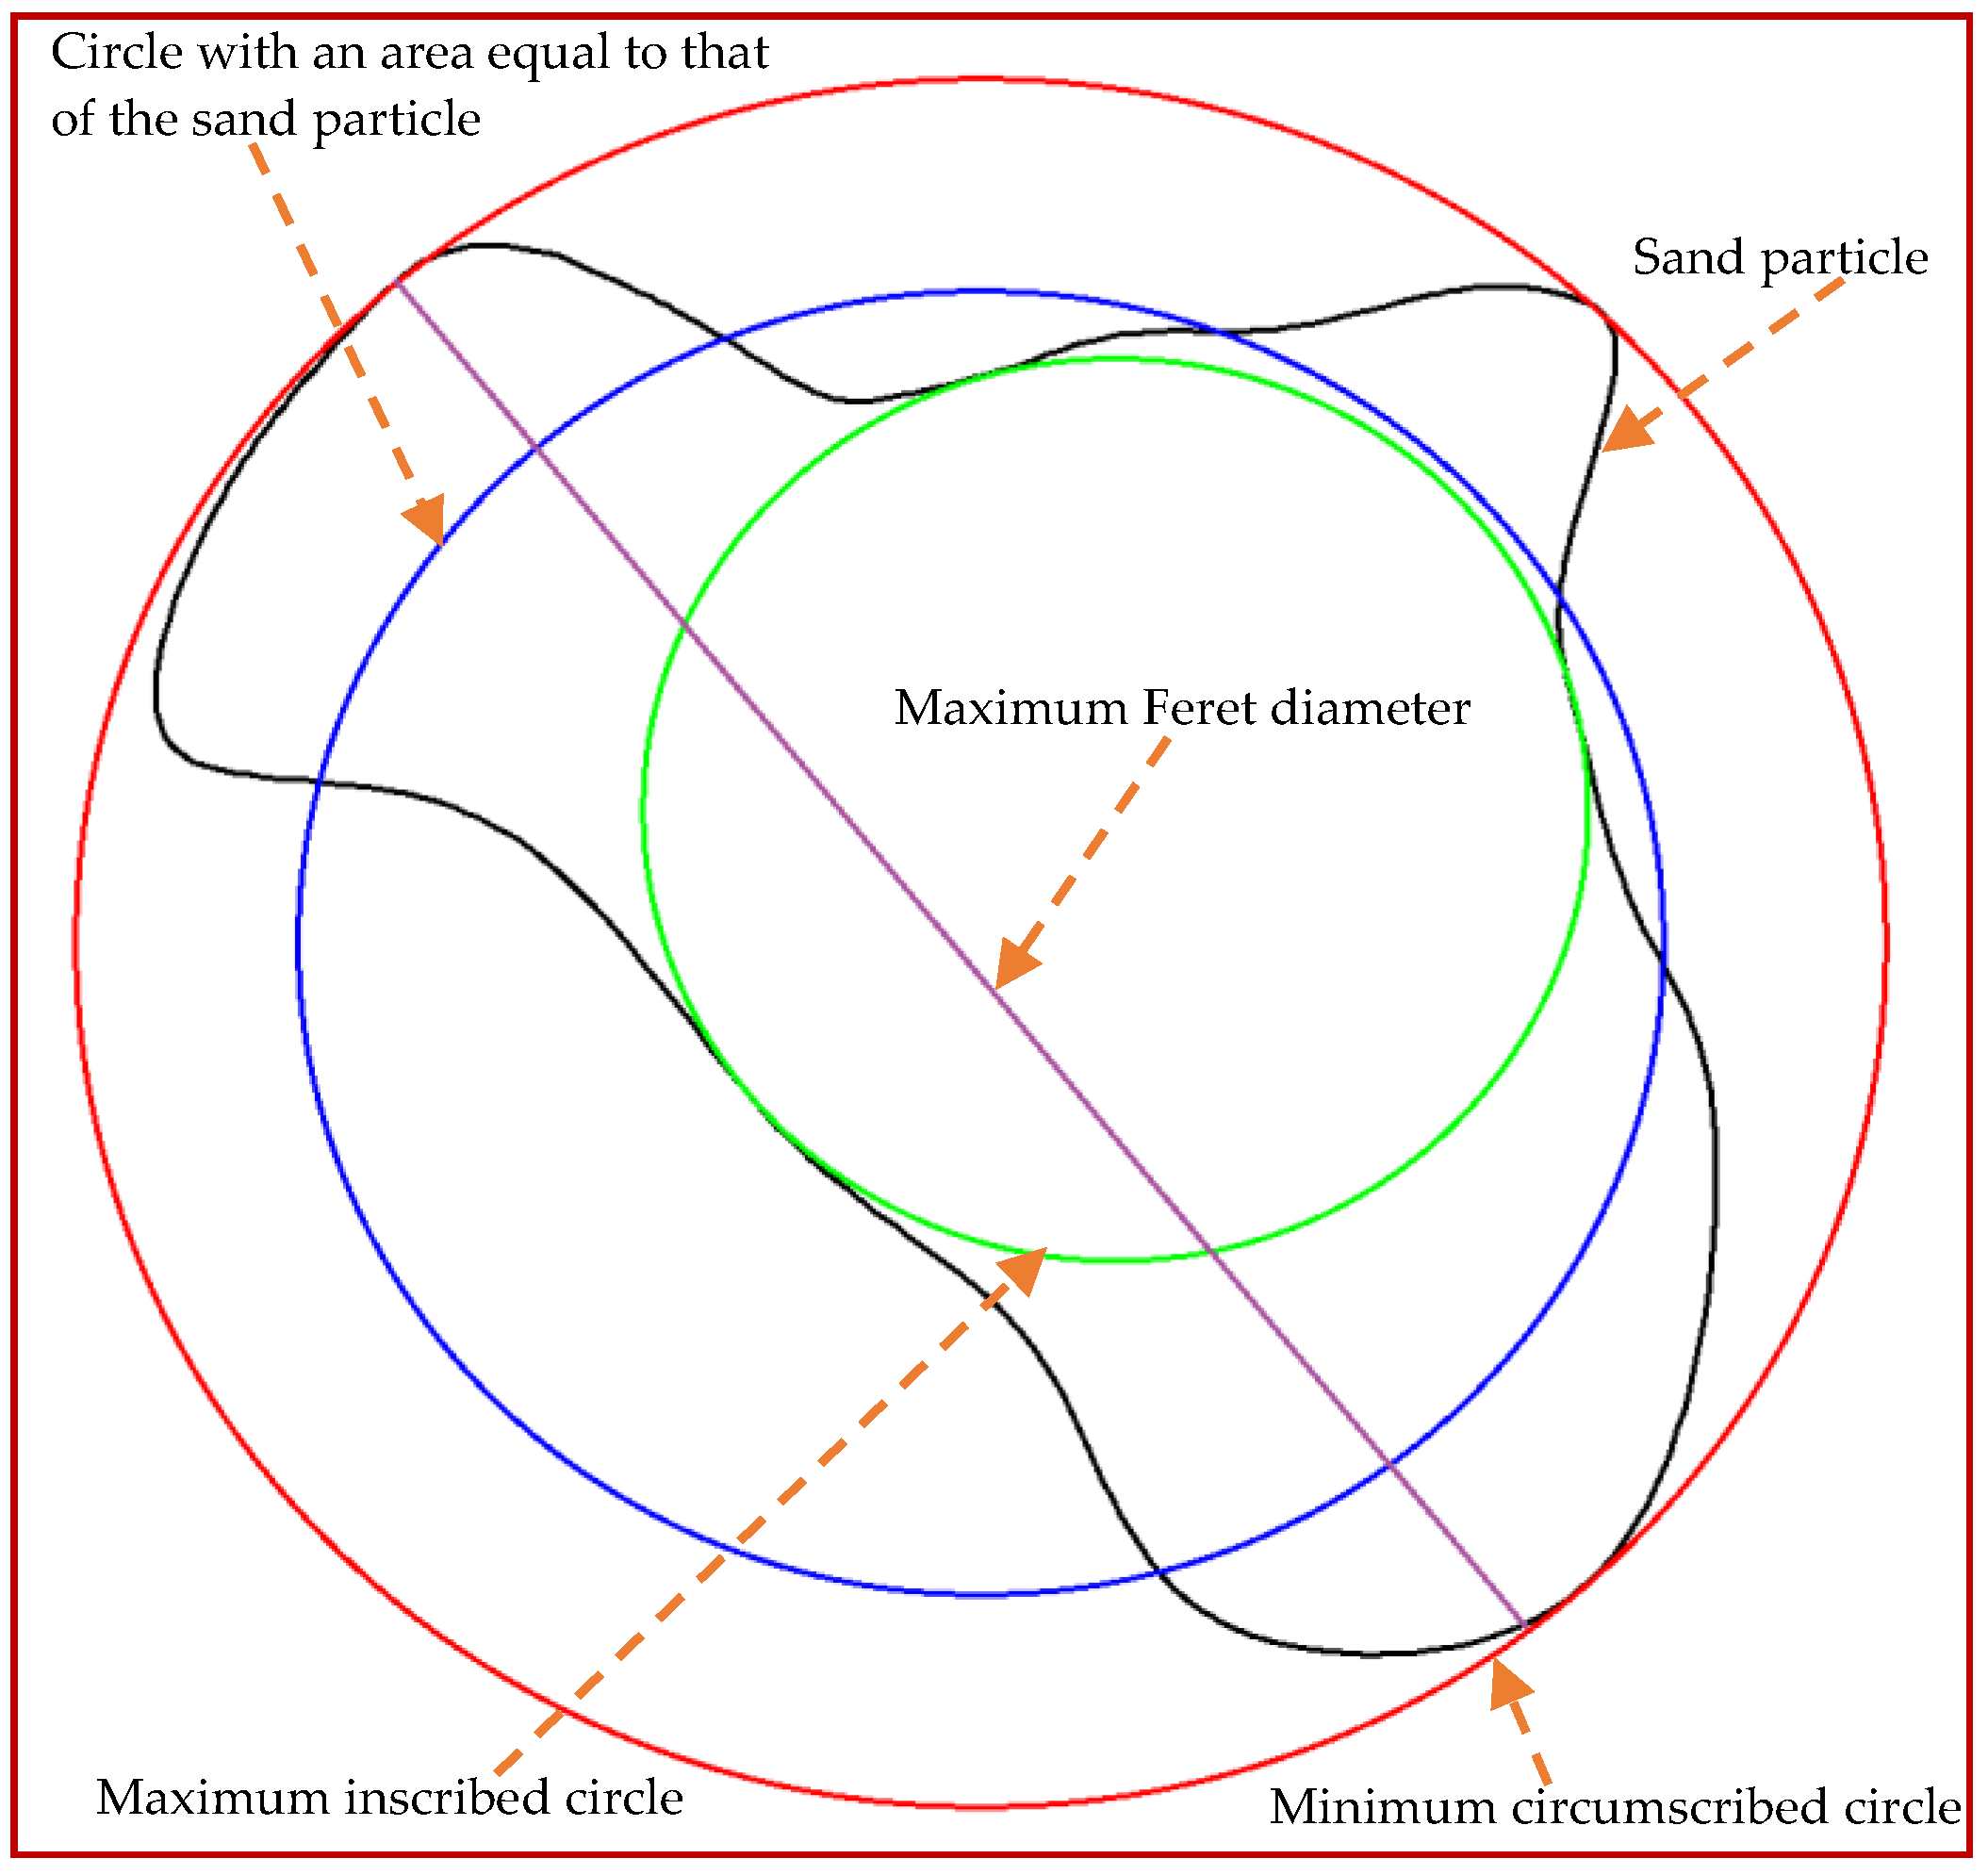
Finally, the basic size parameters, such as particle area, perimeter, Feret diameter, and radius of the circumscribed and inscribed circles, of the particle to be extracted were selected in the analysis plate of the IPP software. Table 2 presents the basic size parameters of the particle and their descriptions; Figure 7 displays a schematic view of the basic size parameters of the particle.
2.3. Construction of Particle Shape Parameters
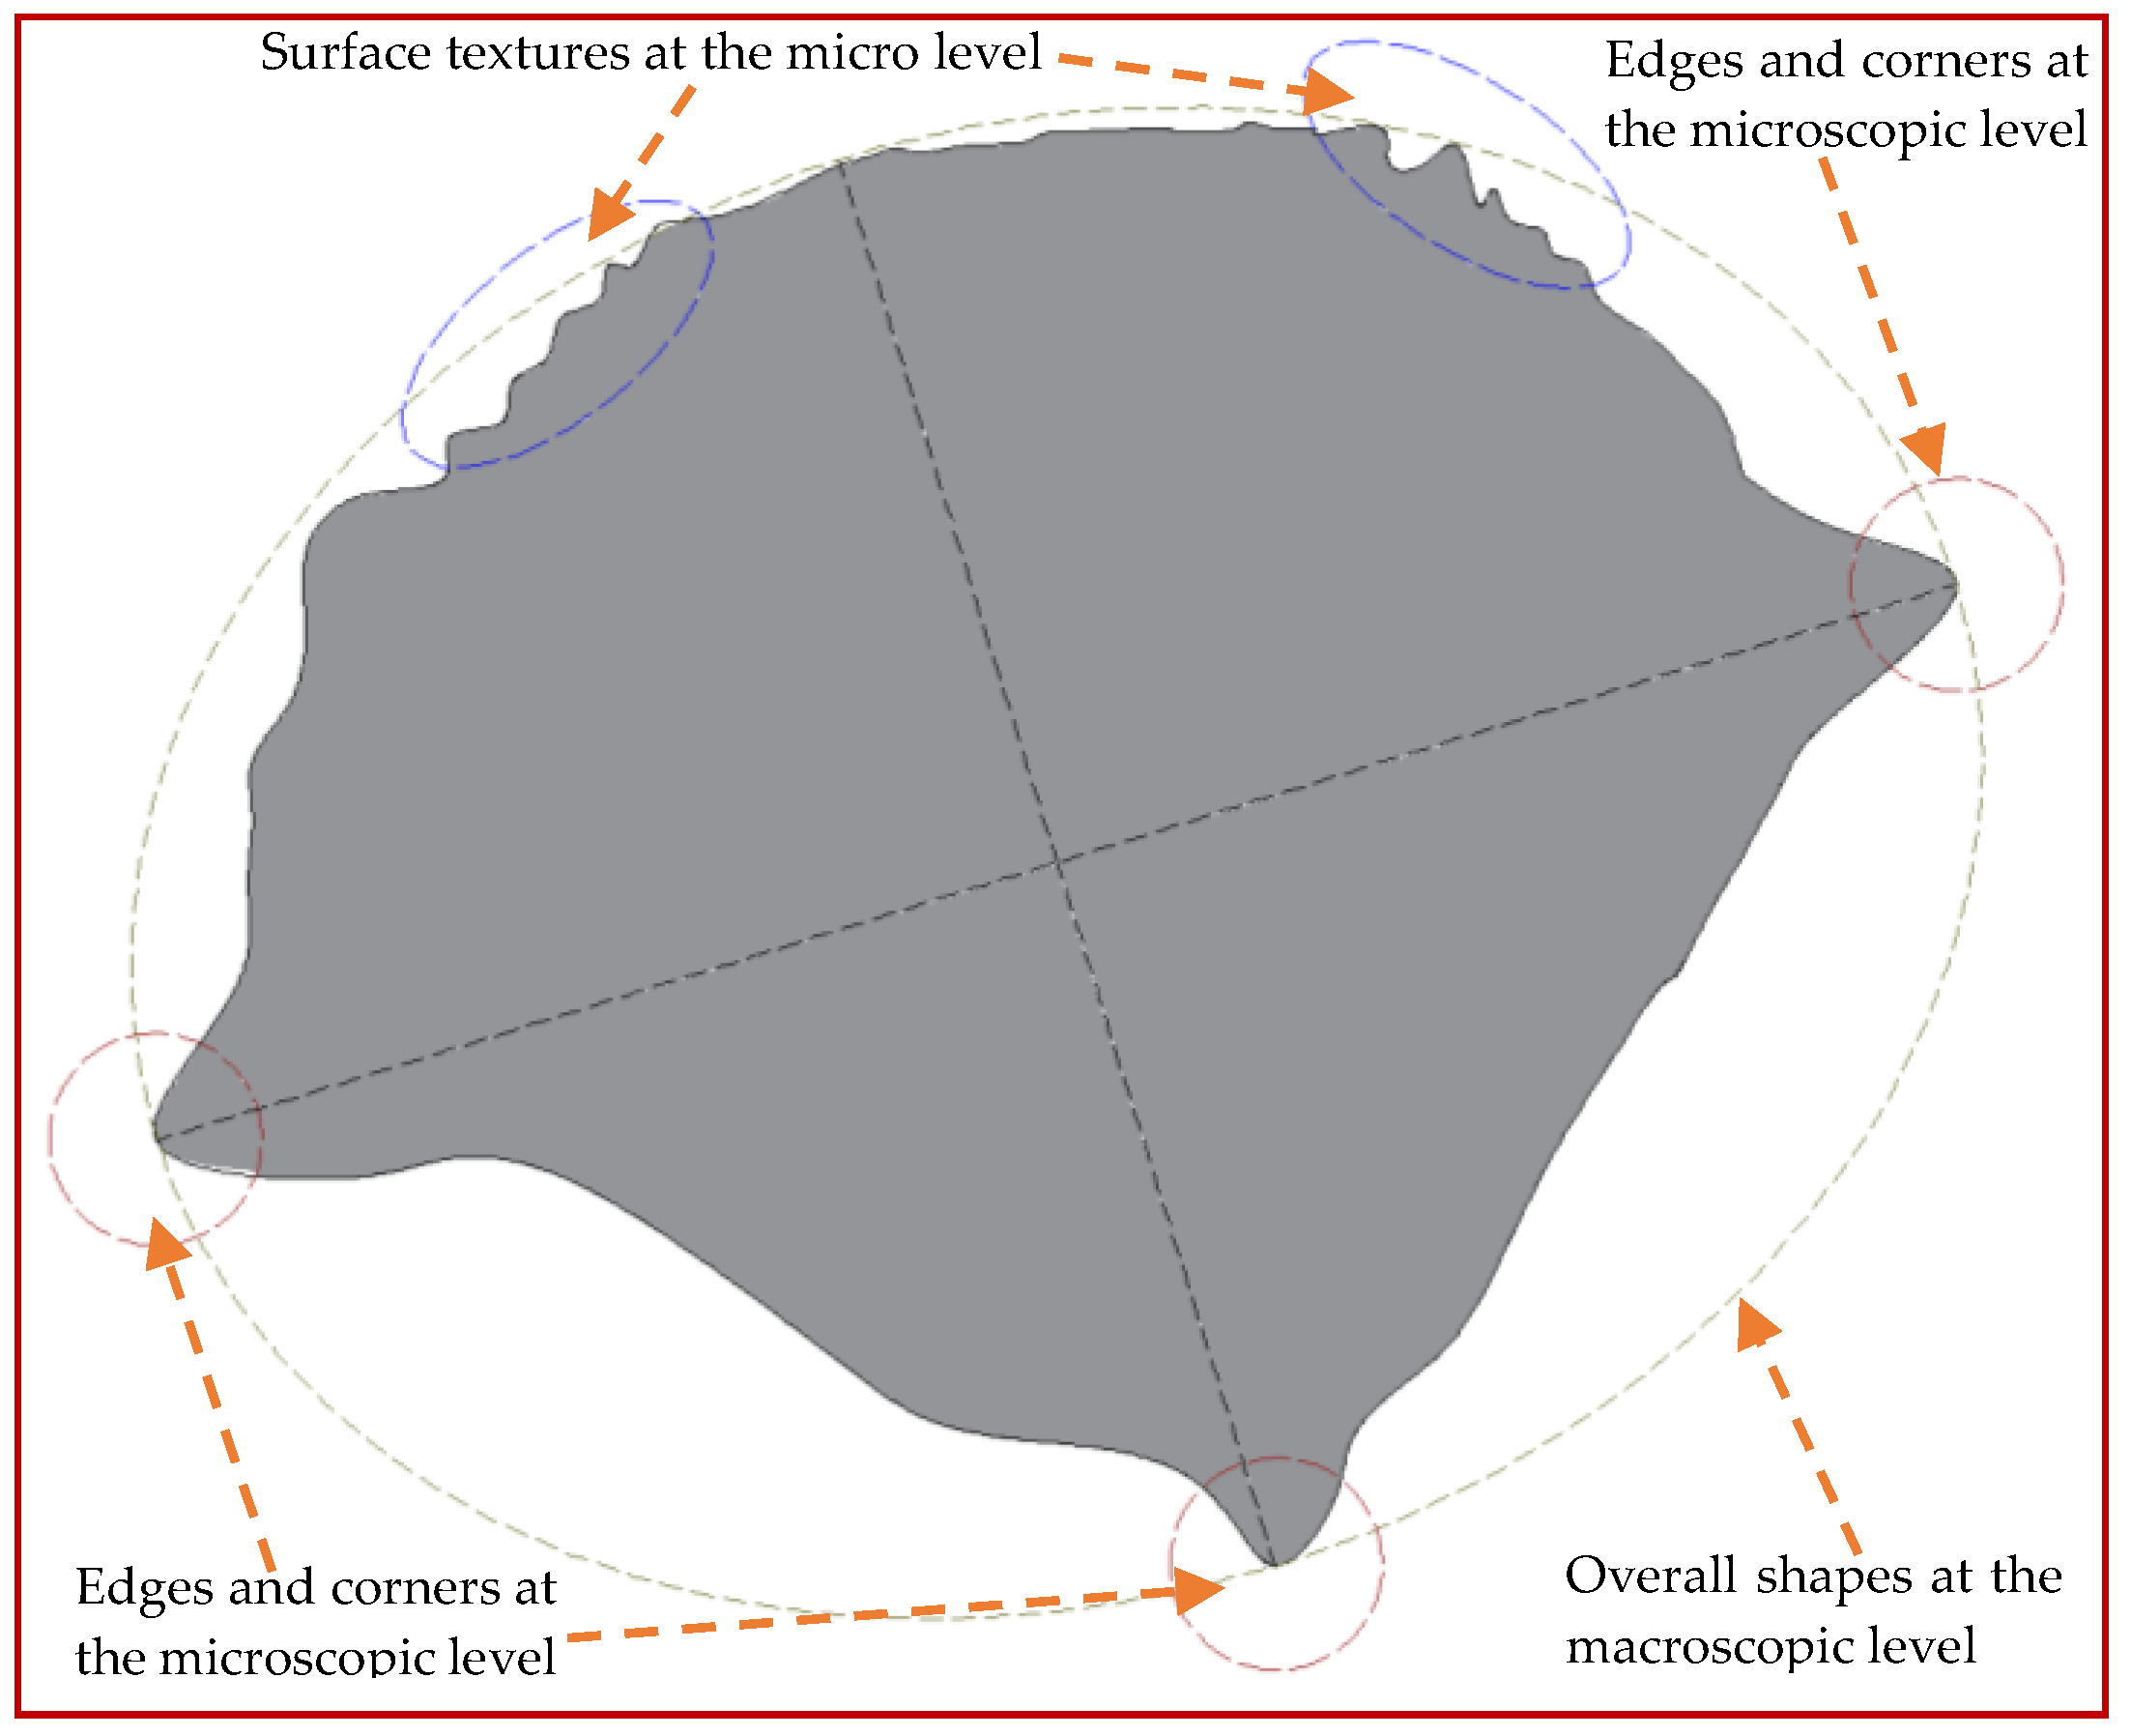
For particle shape analysis, selecting and constructing the proper shape parameters are crucial. The building parameters that can reflect the real shape of particles are not necessarily calculated using a sophisticated formula but can describe the overall shape at the macroscopic level, edges and corners at the microscopic level, and surface texture at the microscopic level of the particles to the greatest extent (Figure 8). Among them, as the first-level description of the particle shape, the overall shape at the macroscopic level represents the overall appearance of the particle contour, which is generally described as a block, sheet, branch, rod, spindle, etc. As the second-level description of the particle shape, the angularity reflects the number of edges and corners around the particle contour and the degree of prominence, which can be classified into the mesoscopic category. As the third-level description of the particle shape, the texture structure of the particle surface mirrors the roughness (or smoothness) of the particle surface.
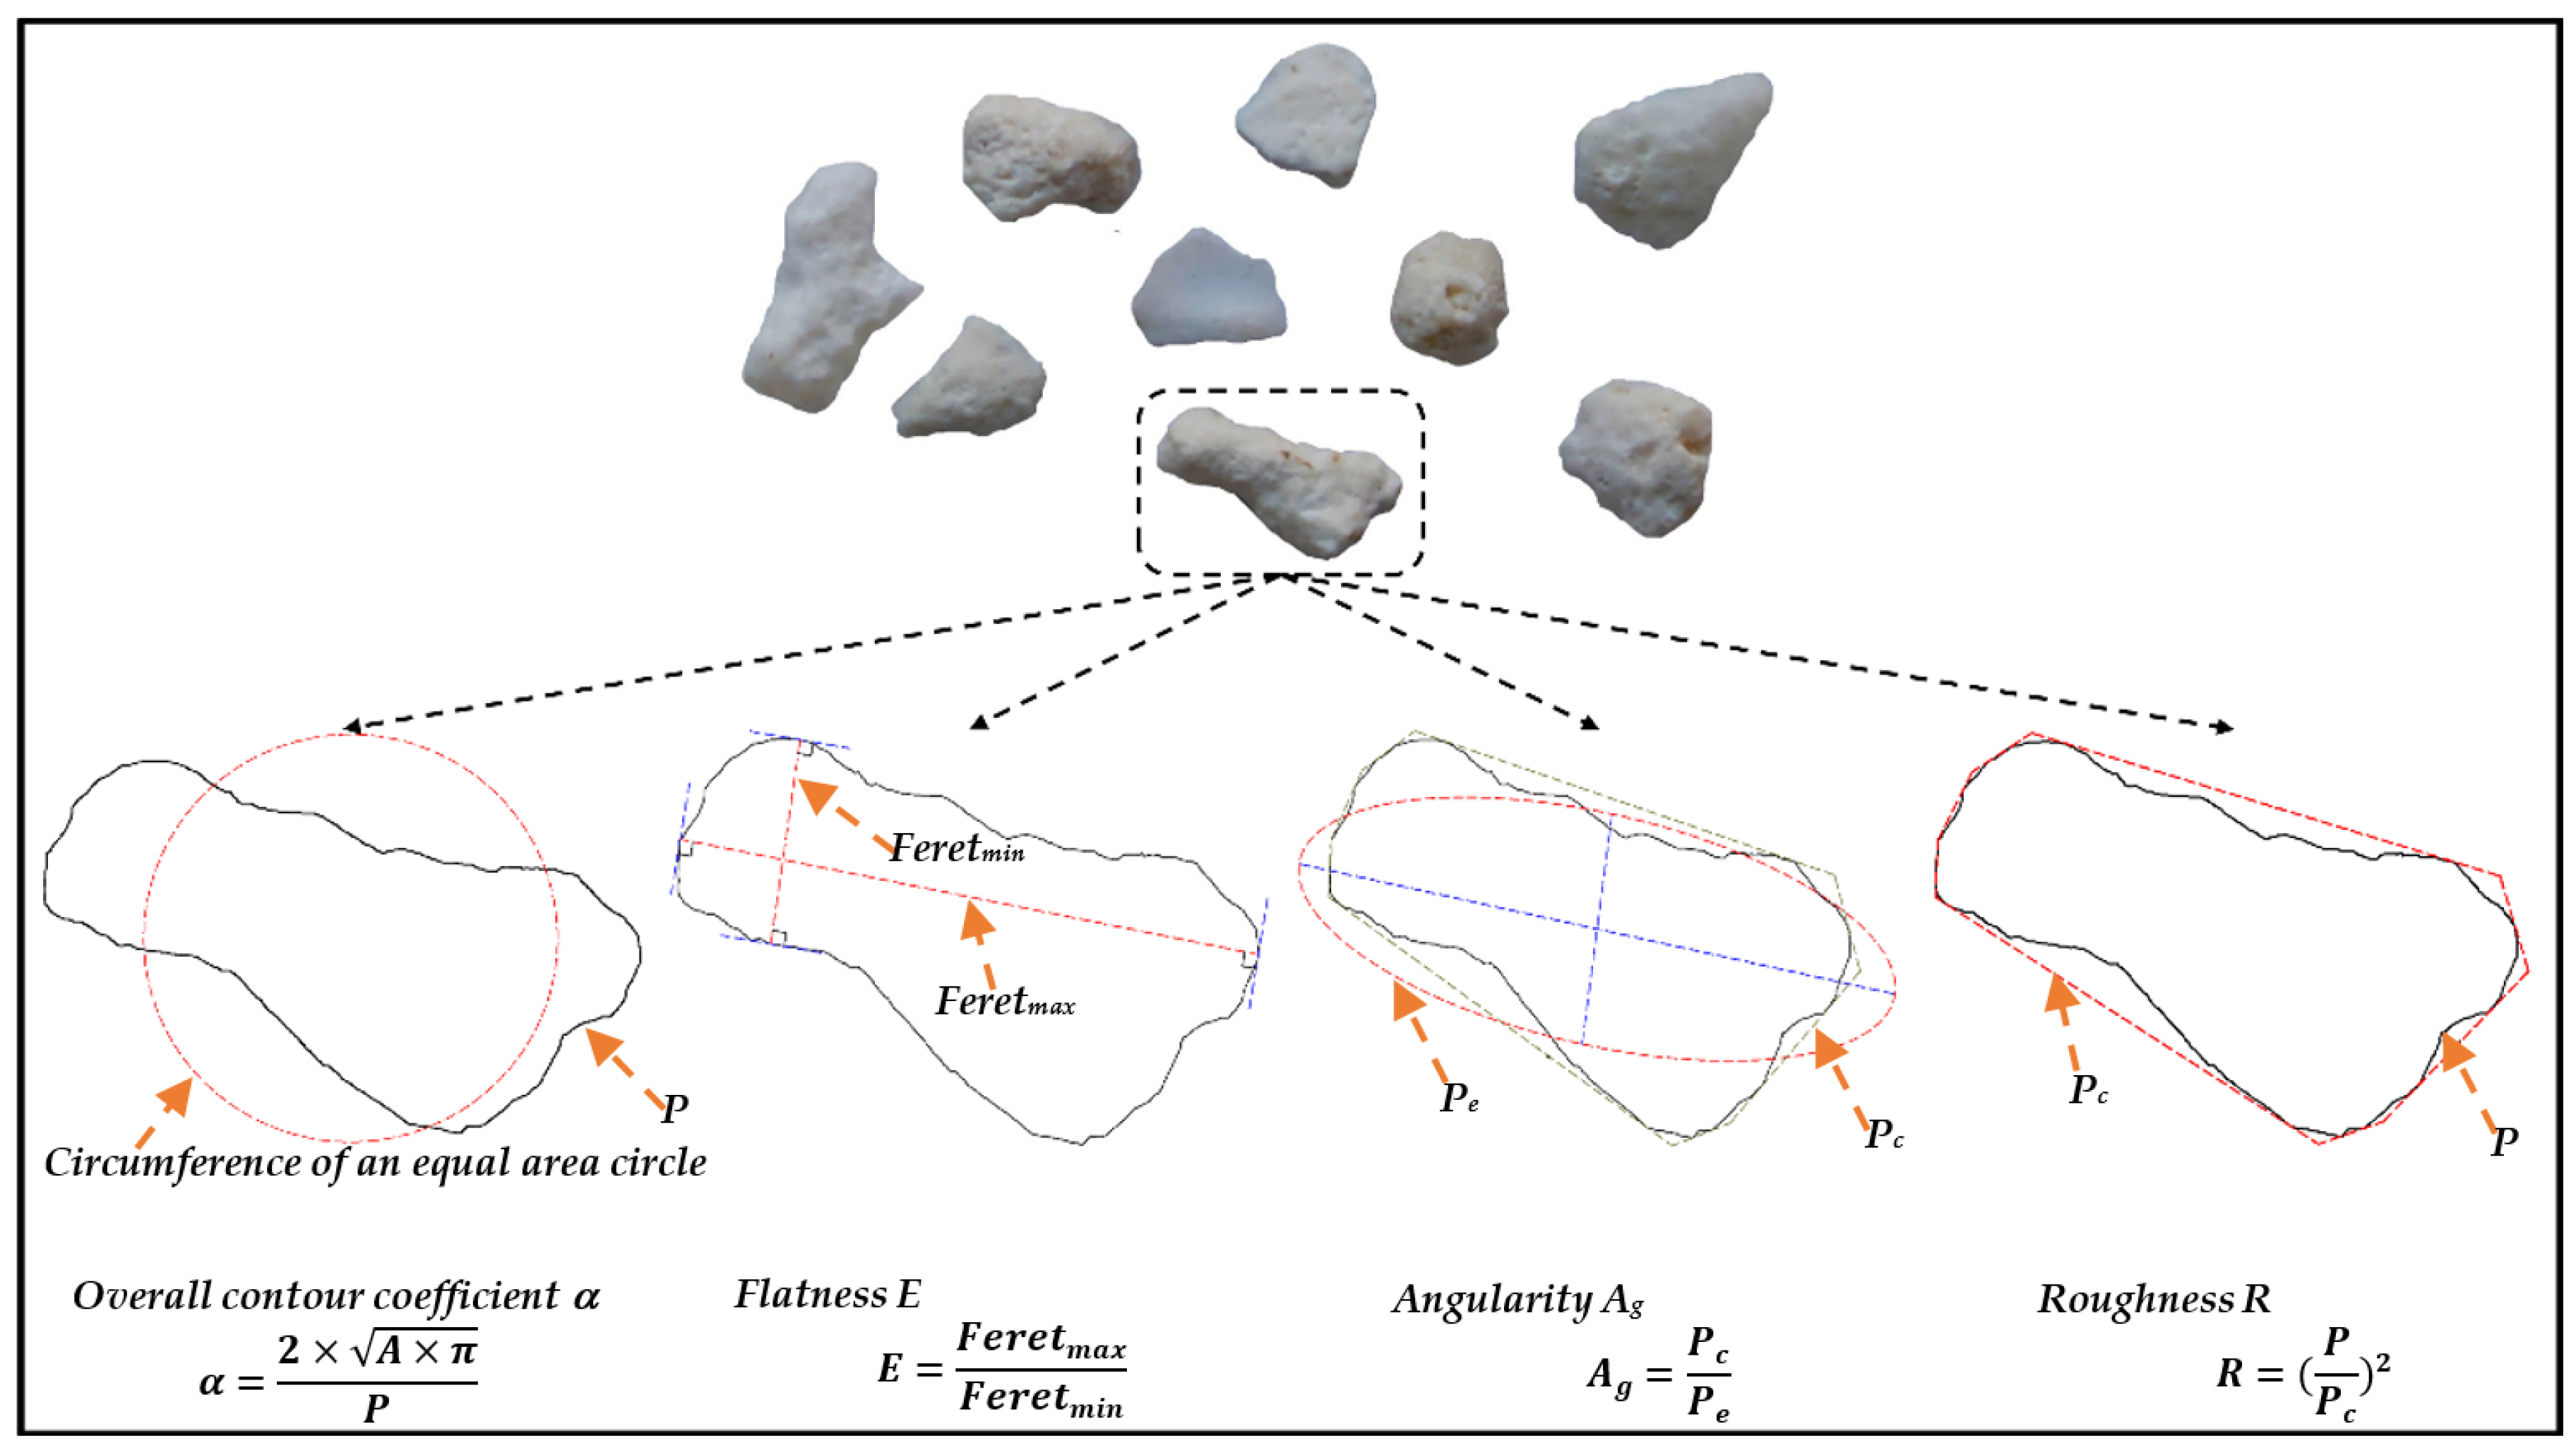
Based on the research findings of Liu et al. [22], Zhang et al. [53], Mark and Neil [55], and Chen et al. [56], the following four particle shape parameters are constructed (Figure 9).
(1) The overall contour coefficient , a rough description of the particle shape at the macroscopic level, is the ratio of the circumference of an equal area circle to the circumference of the particle. As the circumference of a circle is the smallest in the context of a certain area, the overall profile coefficient of sand particles is generally less than 1.0, and the closer the particle shape to the circle, the closer the overall contour coefficient to 1.0.
(2) Flatness , which represents the elongation property of the particles, is the ratio of the maximum Feret diameter to the minimum Feret diameter. The flatter and narrower the particles, the larger the value; conversely, the closer the particle contour to the circle, the closer the value to 1.0.
(3) Angularity , defined as the ratio of the minimum perimeter of a circumscribed polygon to the perimeter of an ellipse with the same area and flatness, is an important shape parameter to characterize the number and protrusion degree of the edges and corners of the particles. The larger the number of edges and corners and the greater the distance of the protruding particle edge, the greater the angularity.
(4) Roughness refers to the square of the ratio of the perimeter of the particle to the minimum perimeter of the circumscribed polygon. The more complex the grain boundary curve, the greater the roughness; conversely, the smoother the particle surface, the smaller the roughness.
Based on the physical meaning of each shape parameter, it can be observed that the overall contour coefficient (α) and flatness (E) are part of the first-level particle shape parameters, and the angularity (Ag) and roughness (R) are the second- and third-level particle shape parameters, respectively.
Subsequently, the fractal dimensions of coral sand and quartz sand with different particle sizes were calculated using the perimeter–area method based on the fractal theory to evaluate quantitatively the variation of sand particle shape with particle size and mineral composition. For irregular sand particles, the expression of the perimeter–area method [56] is as follows:
where Dp is the fractal dimension of particle shape. Equation (1) can also be expressed as
Equation (3) shows that the fractal dimension (Dp), which reflects the curvature degree of the particle profile, is twice the slope of the straight line in the lgP–lgA plane. The more complex the particle profile, the larger the fractal dimension, and the more irregular the particle shape.
3. Shape Analysis of Coral Sand Particles
3.1. Effect of Particle Size
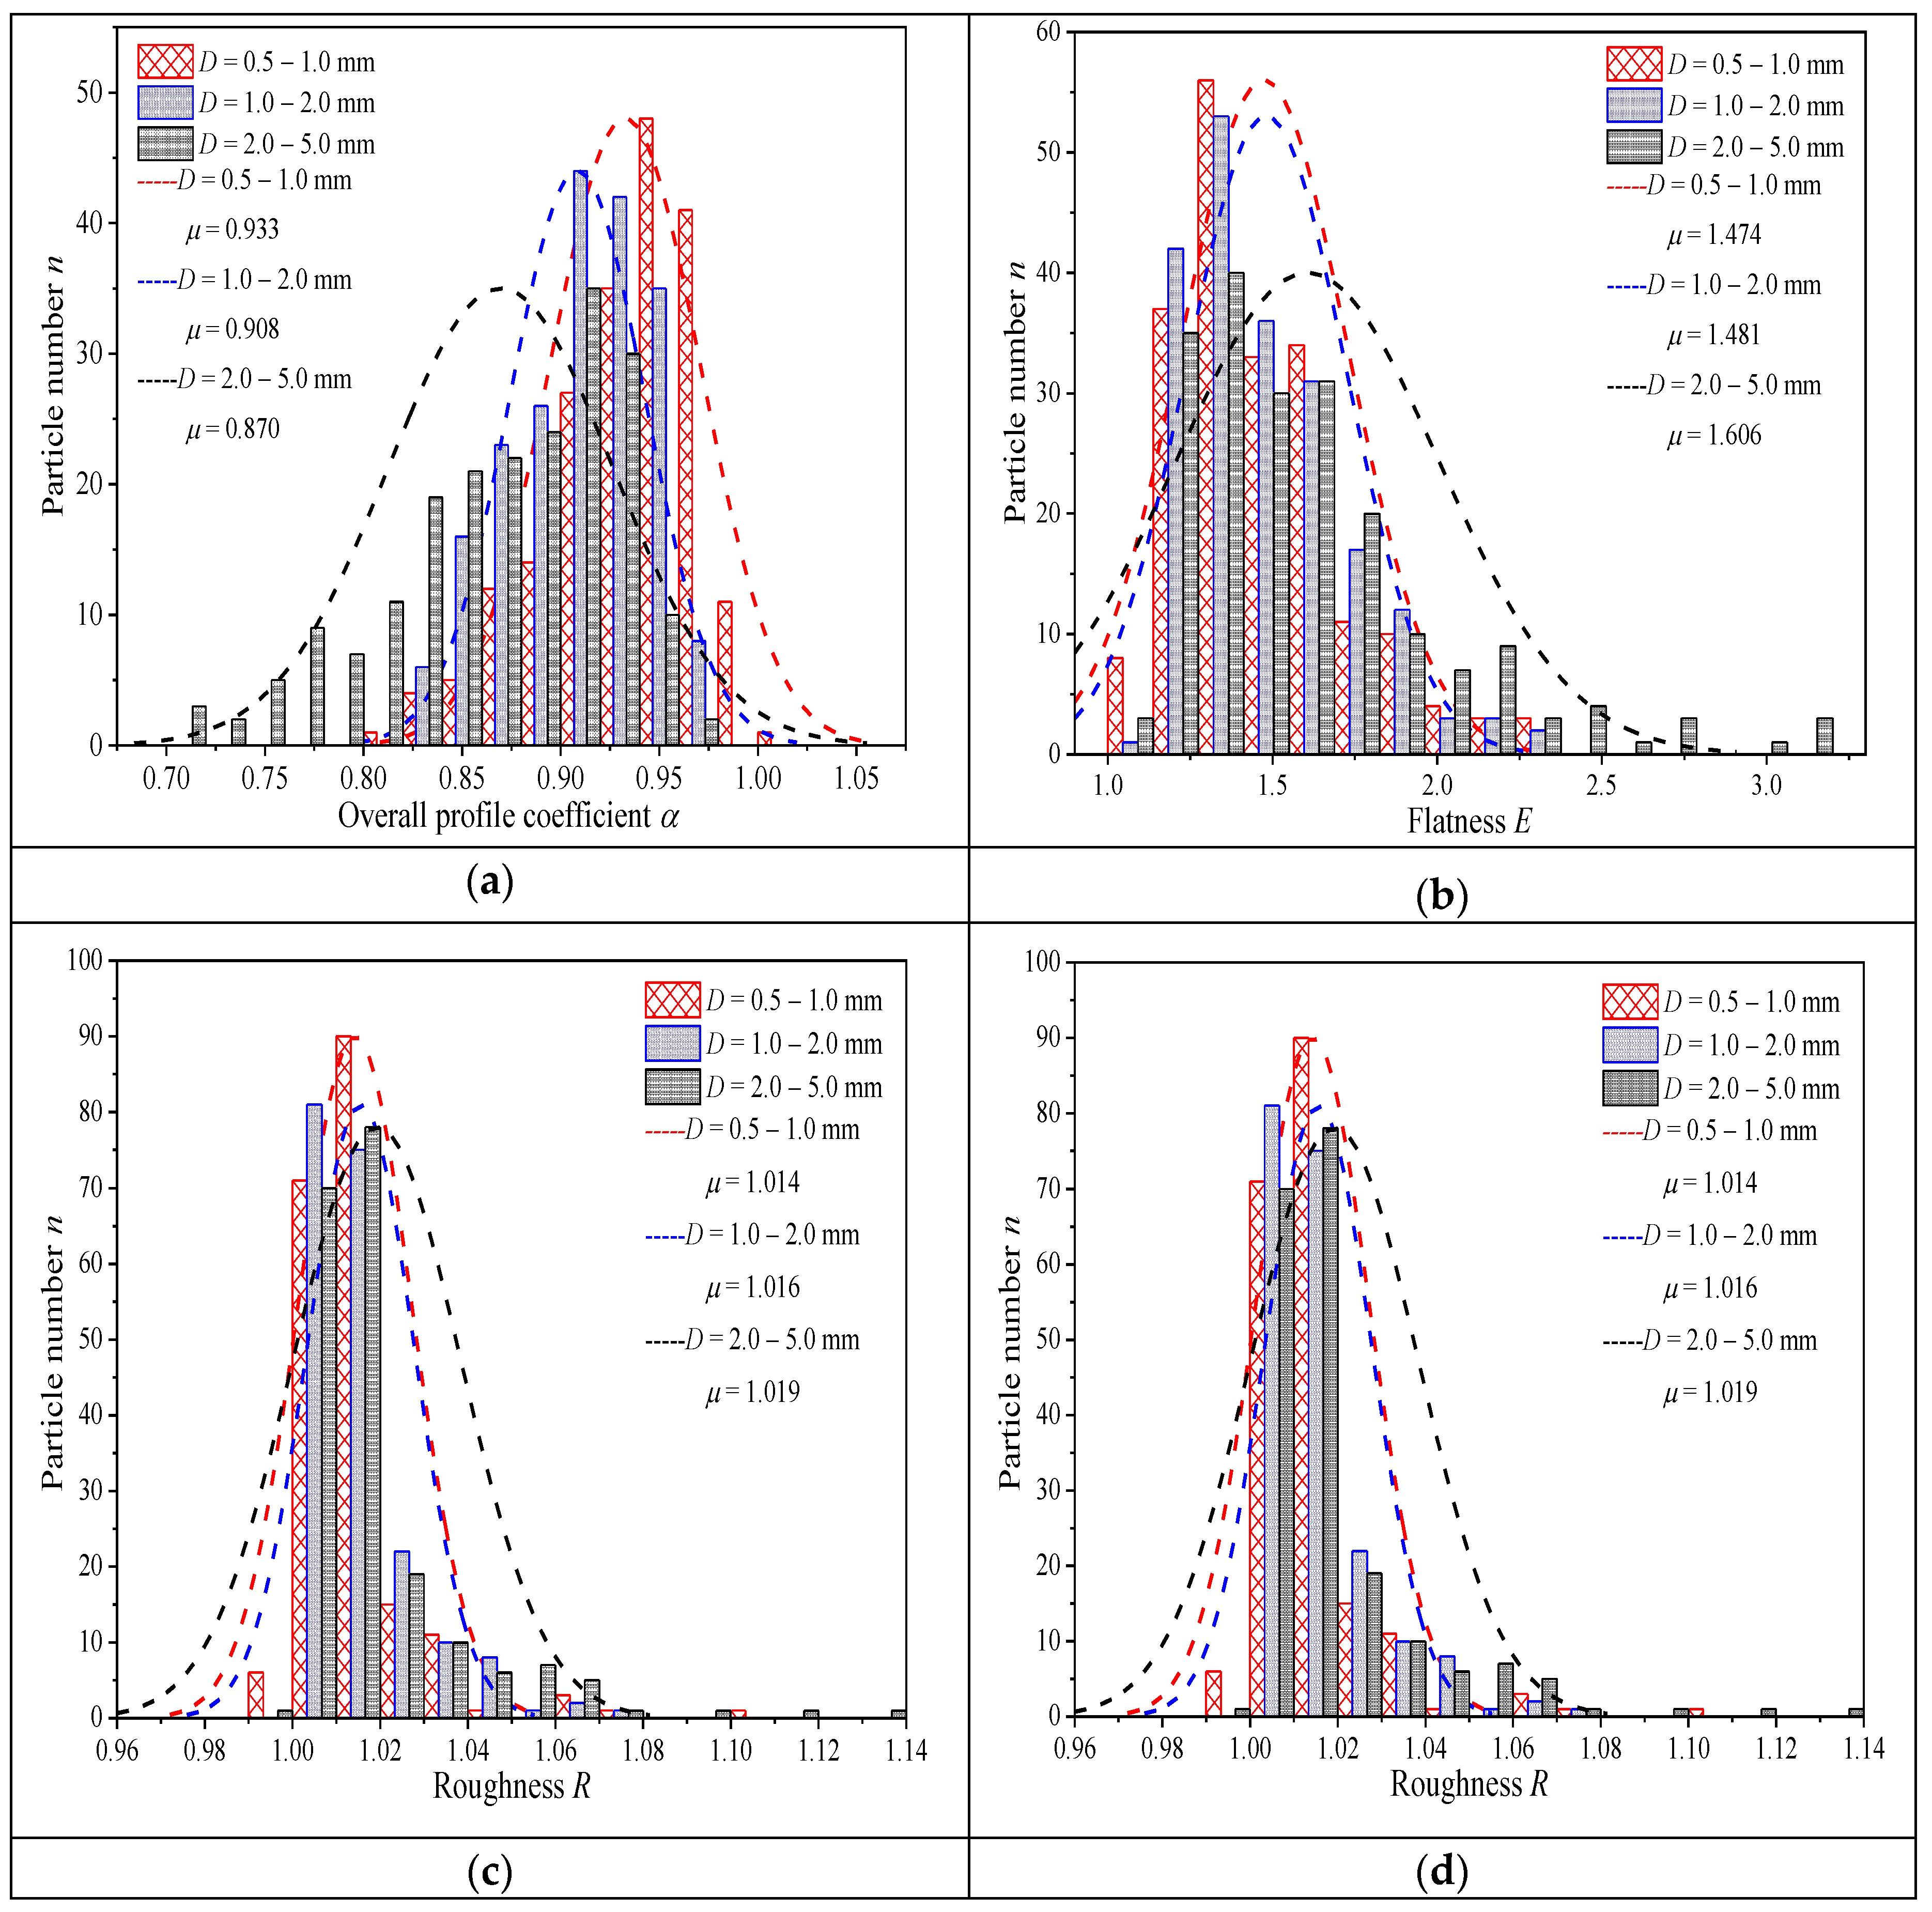
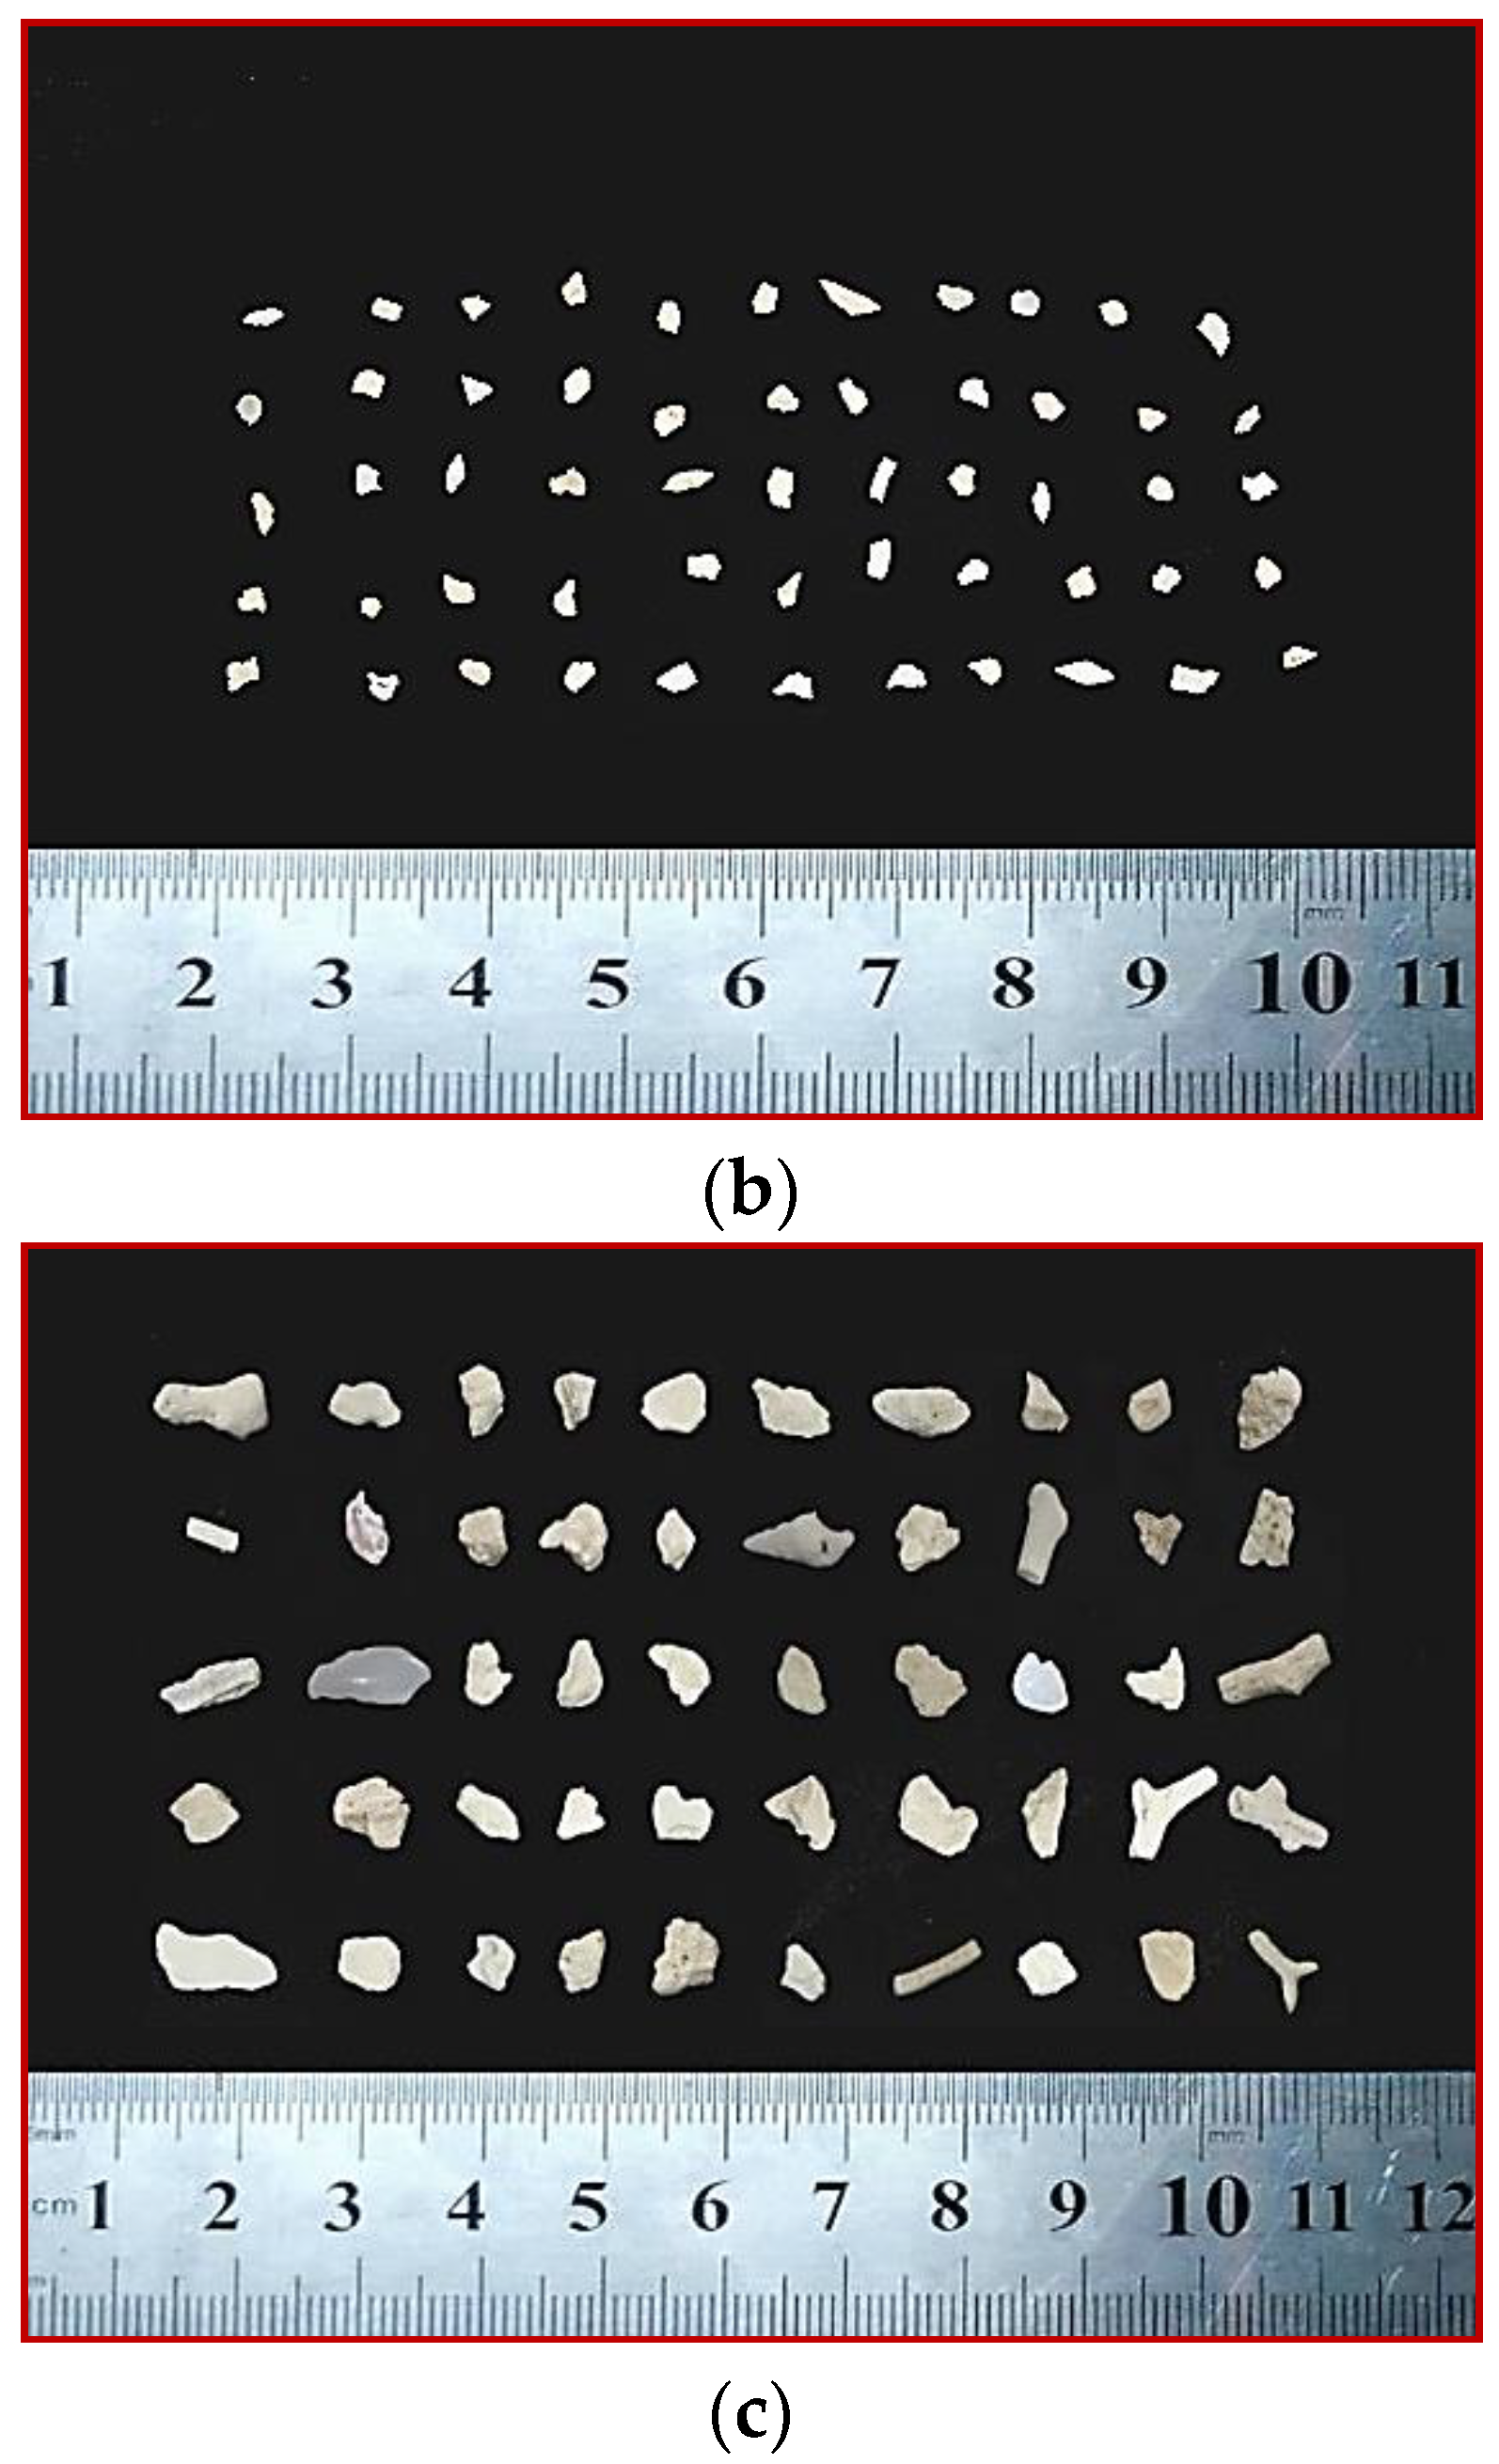
To investigate the influence of particle size on the shape of coral sand particles, the frequency distribution histograms of the overall profile coefficient (α), flatness (E), angularity (Ag), and roughness (R) of coral sand with different particle sizes were drawn, as shown in Figure 10. This figure shows that the particle shape parameters of coral sand with different particle sizes only satisfies some characteristics of normal distribution, but not strictly normal distribution, and they change regularly with the increase in particle size. We analyzed the evolution law of the particle shape with the particle size through the change of the arithmetic mean value (μ) of the particle shape parameter with the particle size. From the perspective of statistics, the arithmetic mean value of a group of data is equal to the expected value under the condition of normal distribution. That is, the abscissa corresponding to the peak value in the normal distribution fitting curve in Figure 10 is not only the expected value when the particle shape parameter distribution meets the normal distribution, but also the arithmetic average value of the particle shape parameter. In combination with the position of the peak value of the normal distribution curve and the arithmetic mean value (μ) of the particle shape parameters of coral sand with different particle sizes in Figure 10, we can clearly see that (1) the overall profile coefficient (α) of coral sand decreases as the particle size becomes larger; that is, with the enlargement in particle size, the ratio of the circumference of an equal area circle to the perimeter of the particle grows smaller, indicating that the deviation between the particle shape of large-size coral sand and the circle is larger than that of small-size coral sand, and the shape is more irregular. (2) The flatness (E) of coral sand grows with the increment in particle size. The arithmetic mean value of flatness (E) of coral medium sand with particle size of 0.5–1.0 mm and coral coarse sand with particle size of 1.0–2.0 mm are 1.474 and 1.481, respectively, while the arithmetic mean value of flatness (E) of coral gravel sand with particle size of 2.0–5.0 mm can reach 1.606. The flatness (E) of coral medium sand and coarse sand is less than 2.5, while there are particles with flatness (E) greater than 2.5 in coral gravel sand. The findings of Li et al. (2001) and Lv et al. (2001) demonstrate that the flatness (E) of 2.5 is the boundary to distinguish particles with different shapes; the flatness (E) of massive, flaky, and spindle particles is generally between 1.0 and 2.5, while that of dendritic and rod-shaped particles is greater than 2.5. It can be observed that the grain shapes in coral medium sand and coarse sand are mainly massive, flaky, and spindle, while those in coral gravel sand are branched and rod-shaped (Figure 11). (3) The angularity (Ag) rises as the particle size increases, indicating that the surface of large-size coral sand particles exhibits higher angularity protrusion; that is, the particle sphericity is poor and the shape is irregular. (4) The roughness (R) mounts with the increase in particle size, indicating that the complexity of surface roughness, irregularity, and boundary curve fluctuation of large-size coral sand are greater than that of coral sand with small particle size, and the particle surface is more unsmooth. In summary, the change trend of the four shape parameters with particle size reveals that the smaller the particle size, the more regular the particle shape, the less edges and corners, the lower the protruding degree around the particle contour, and the smoother the particle surface. This is because coral sand is a special sediment of marine origin. The large-size coral sand retains some structural characteristics of the protozoa (i.e., hermatypic coral, seaweeds, and shells), resulting in highly irregular grain shapes. Unlike large-size coral sand, most of the small-size coral sand, as the product of particle breakage of large-size coral sand, experienced more particle breakage in the process of deposition. The particle breakage that is often accompanied by the interaction between particles reduces the coral sand particle size. Meanwhile, the surrounding corners and edges are frequently broken and ground, which renders the particle shape more regular and reduces the intergranular resistance in relative motion. Therefore, the small-size coral sand is more regular than large-size coral sand.
3.2. Analysis of Particle Fractal Dimension
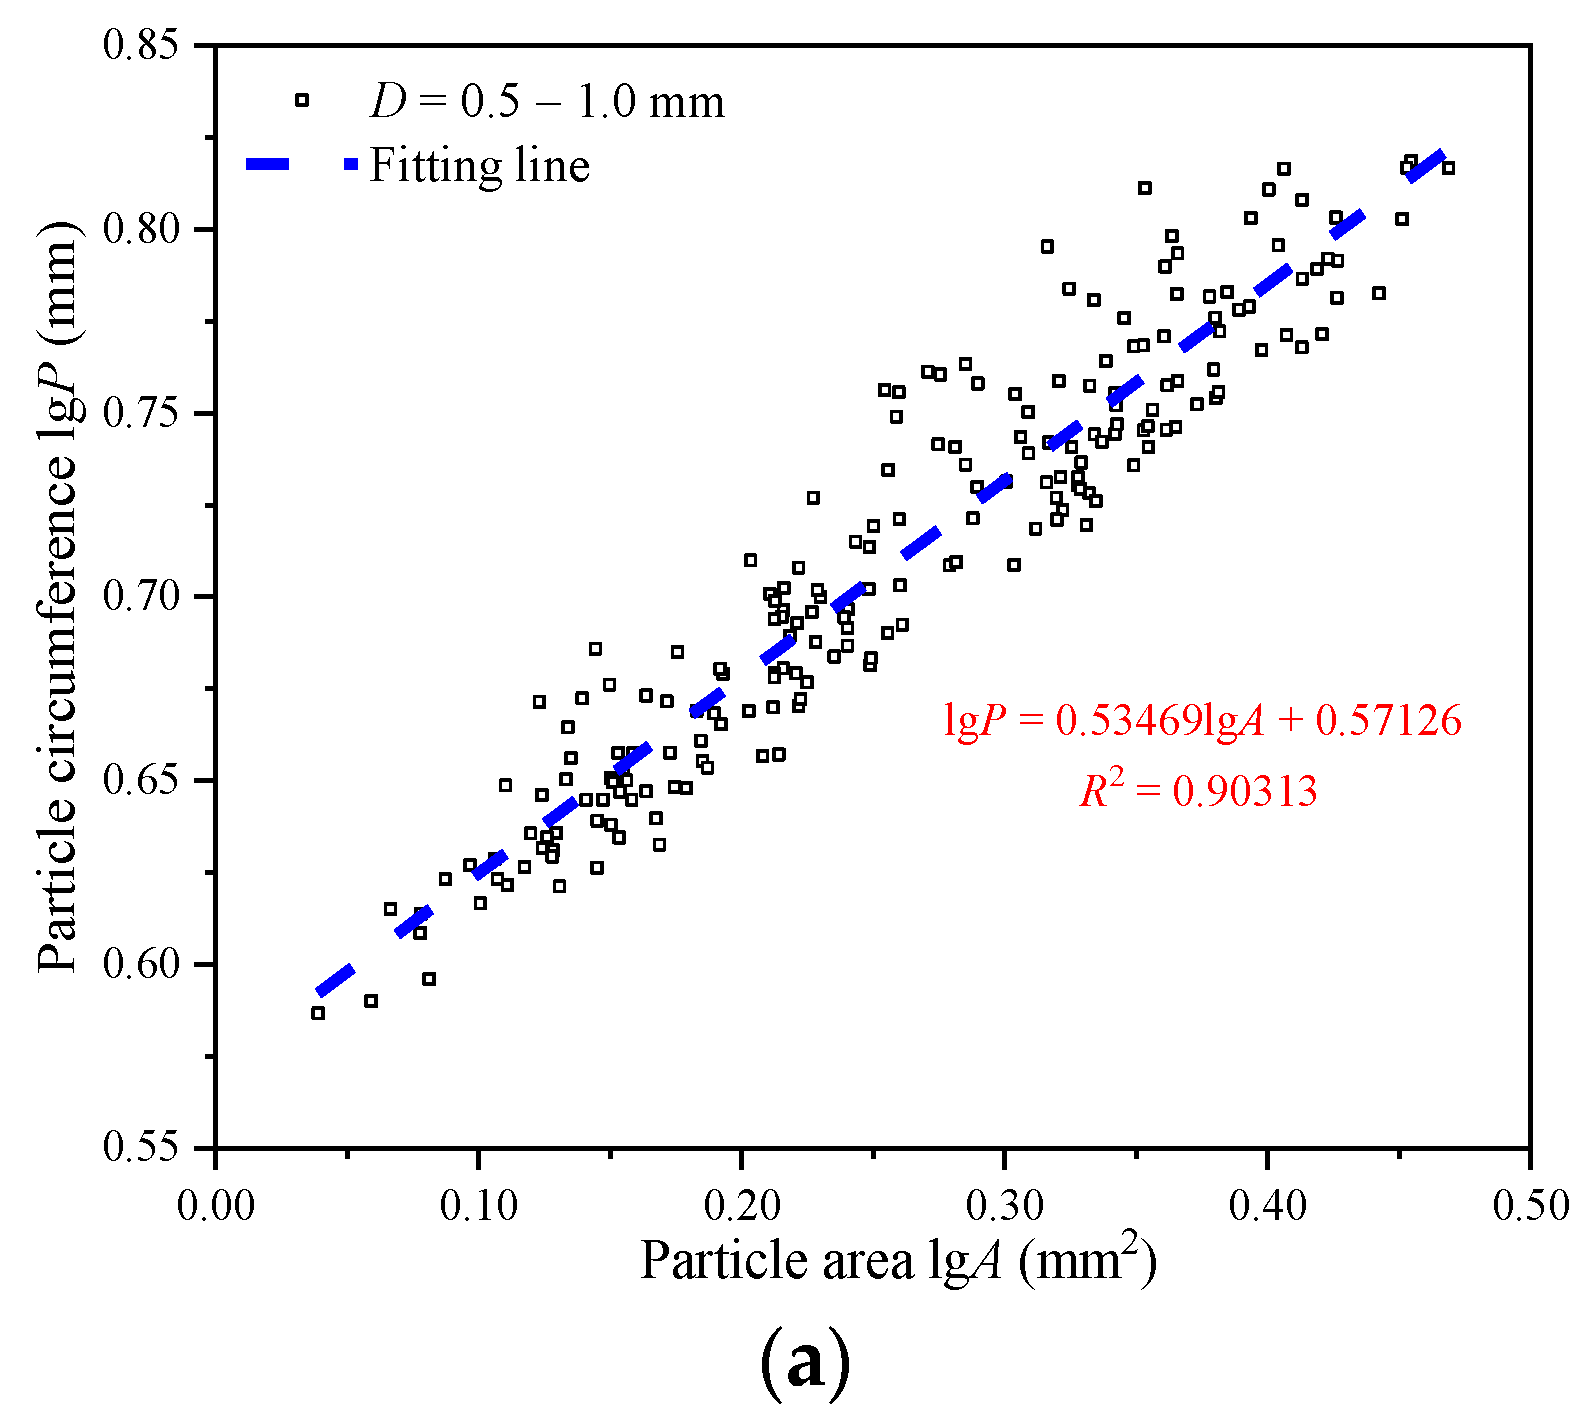
The perimeter and area of the two-dimensional projection contour of coral sand particles were calculated using the image analysis software IPP, and the lgP–lgA fitting curves for the three grain groups of coral sand were drawn, as shown in Figure 12. The figure shows that the perimeter and area of the experimental coral sand present a linear relationship in the double logarithmic coordinate system with a correlation coefficient of approximately 0.9, indicating that coral sand with particle sizes in the range of 0.5–1.0 mm, 1.0–2.0 mm, and 2.0–5.0 mm features good fractal characteristics.
Using Equation (3), the fractal dimension of coral sand with different particle sizes was calculated, as presented in Table 3.
As presented in the table, the fractal dimension of coral sand with different particle sizes ranges from 1.07 to 1.10, and as particle size grows, the fractal dimension of coral sand increases. According to the physical meaning of fractal dimension, the larger the fractal dimension, the more complex the particle shape. Furthermore, the particle shape of coral sand becomes more irregular with the increase in particle size, which is consistent with the results of the statistical analysis of particle shape parameters of coral sand with different particle sizes.
3.3. Distribution Characteristics and Sensitivity Analysis of Particle Shape Parameters
Preliminary analysis of the distribution characteristics of each particle shape parameter of three grain groups of coral sand found that the shape parameters are concentrated in a specific range, although discrete in numerical value. To uncover the distribution characteristics of the coral sand particle shape, the mean value, standard variance, coefficient of variation, concentrated distribution interval, and interval length of various shape parameters of coral sand with different particle sizes were statistically analyzed, as presented in Table 4.
The distribution interval of the shape parameters of particles accounting for 95% of the total particles is also displayed in the table. The interval length, referring to the value range of shape parameters under certain probability, and the coefficient of variation, meaning the dispersion degree of shape parameters, can simultaneously reflect the sensitivity of shape parameters. The larger the coefficient of variation and the longer the interval length, the stronger the sensitivity of the corresponding shape parameters. As also presented in Table 4, (1) although the particle sizes in the three grain groups of coral sand are different, the sensitivity of shape parameters to the change in particle shape is completely consistent. Regarding the coefficient of variation and interval length, together with the sensitivity to the change in particle shape, flatness ranks first, the overall profile coefficient and angularity are second, and roughness is third. In other words, compared with the other three shape parameters in this study, flatness can better distinguish the particle shape of coral sand. (2) Except for individual scattered points, as the particle size increases, the variation coefficient and interval length of each shape parameter of coral sand also increase, indicating that as the particle size grows, the shape parameters of coral sand are more widely distributed and more discrete. That is, as the particle size grows, the shape of coral sand is more diversified, the odd-shaped particles in the sample augments, and the overall shape is more irregular, which also verifies the conclusion drawn from the above analysis in terms of coefficient of variation and interval length that the larger the particle size, the more irregular its shape.
Furthermore, in the process of statistical analysis of particle shape parameters, it was found that although several characteristics of normal distribution are met, the shape parameters are not strictly subject to a normal distribution (Table 4). Using Equation (4) [57] and the distribution range of various shape parameters, the three grain groups of coral sand with 200 particles in each grain group were divided into 16 groups.
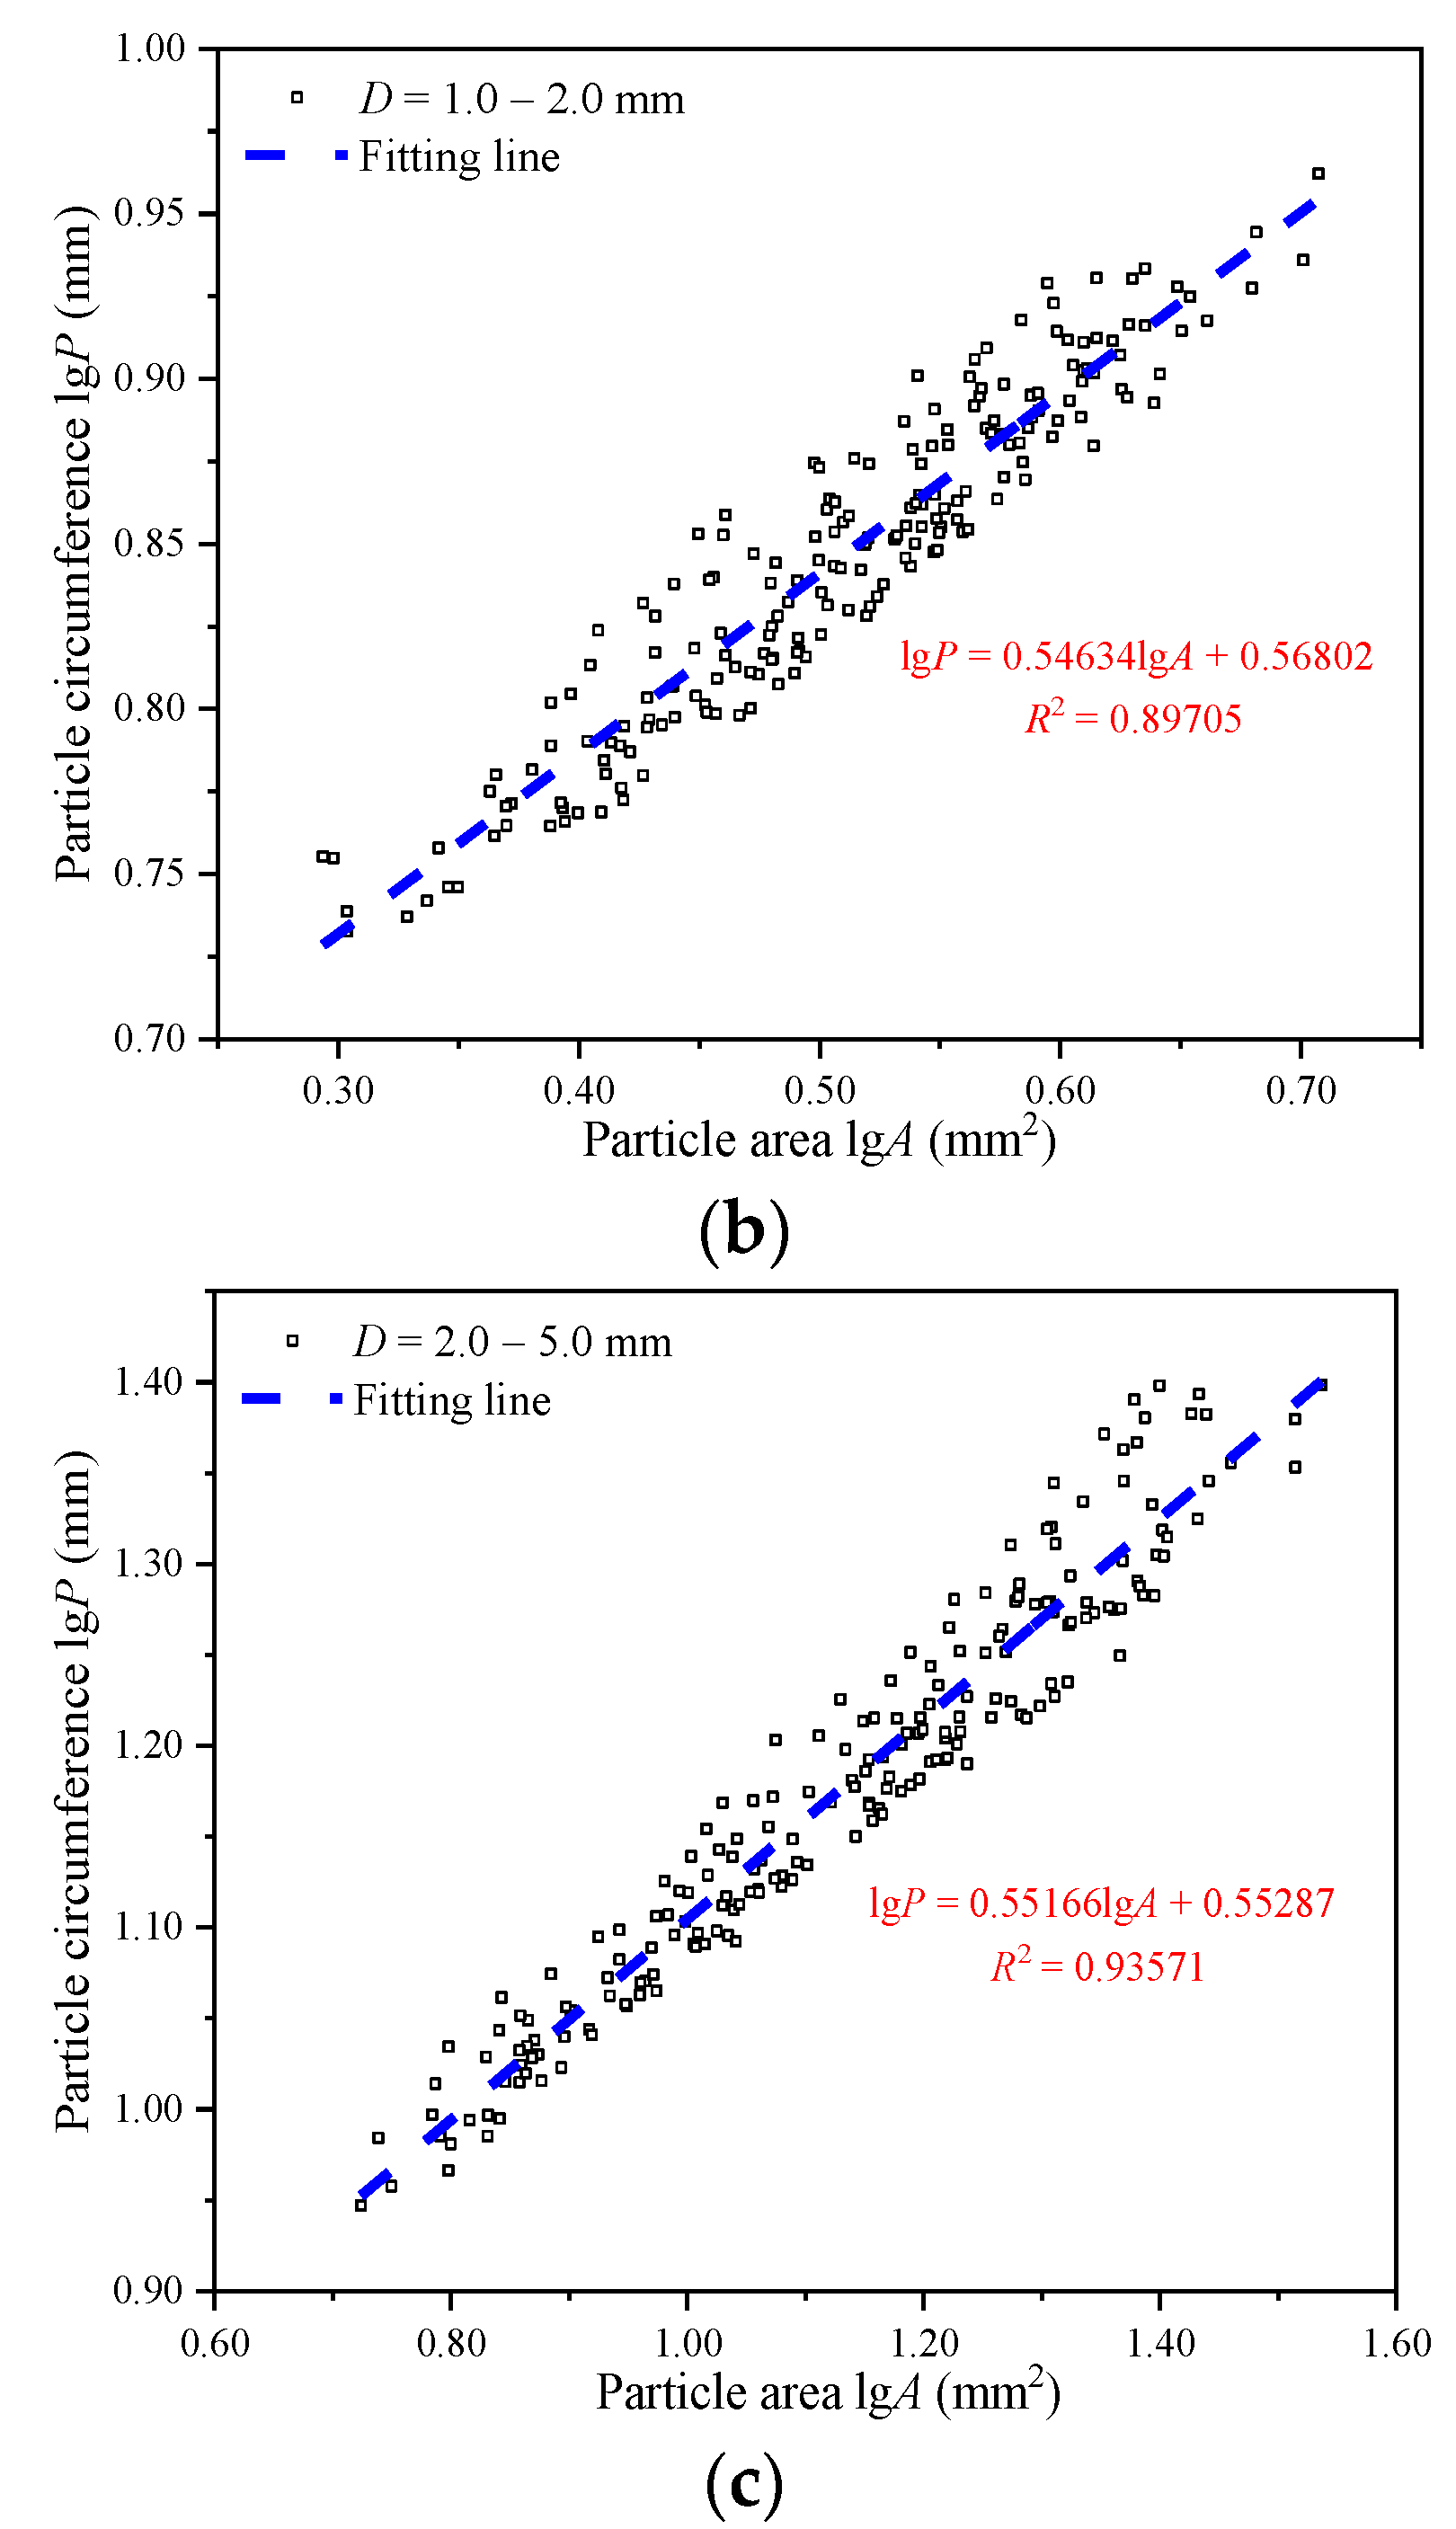
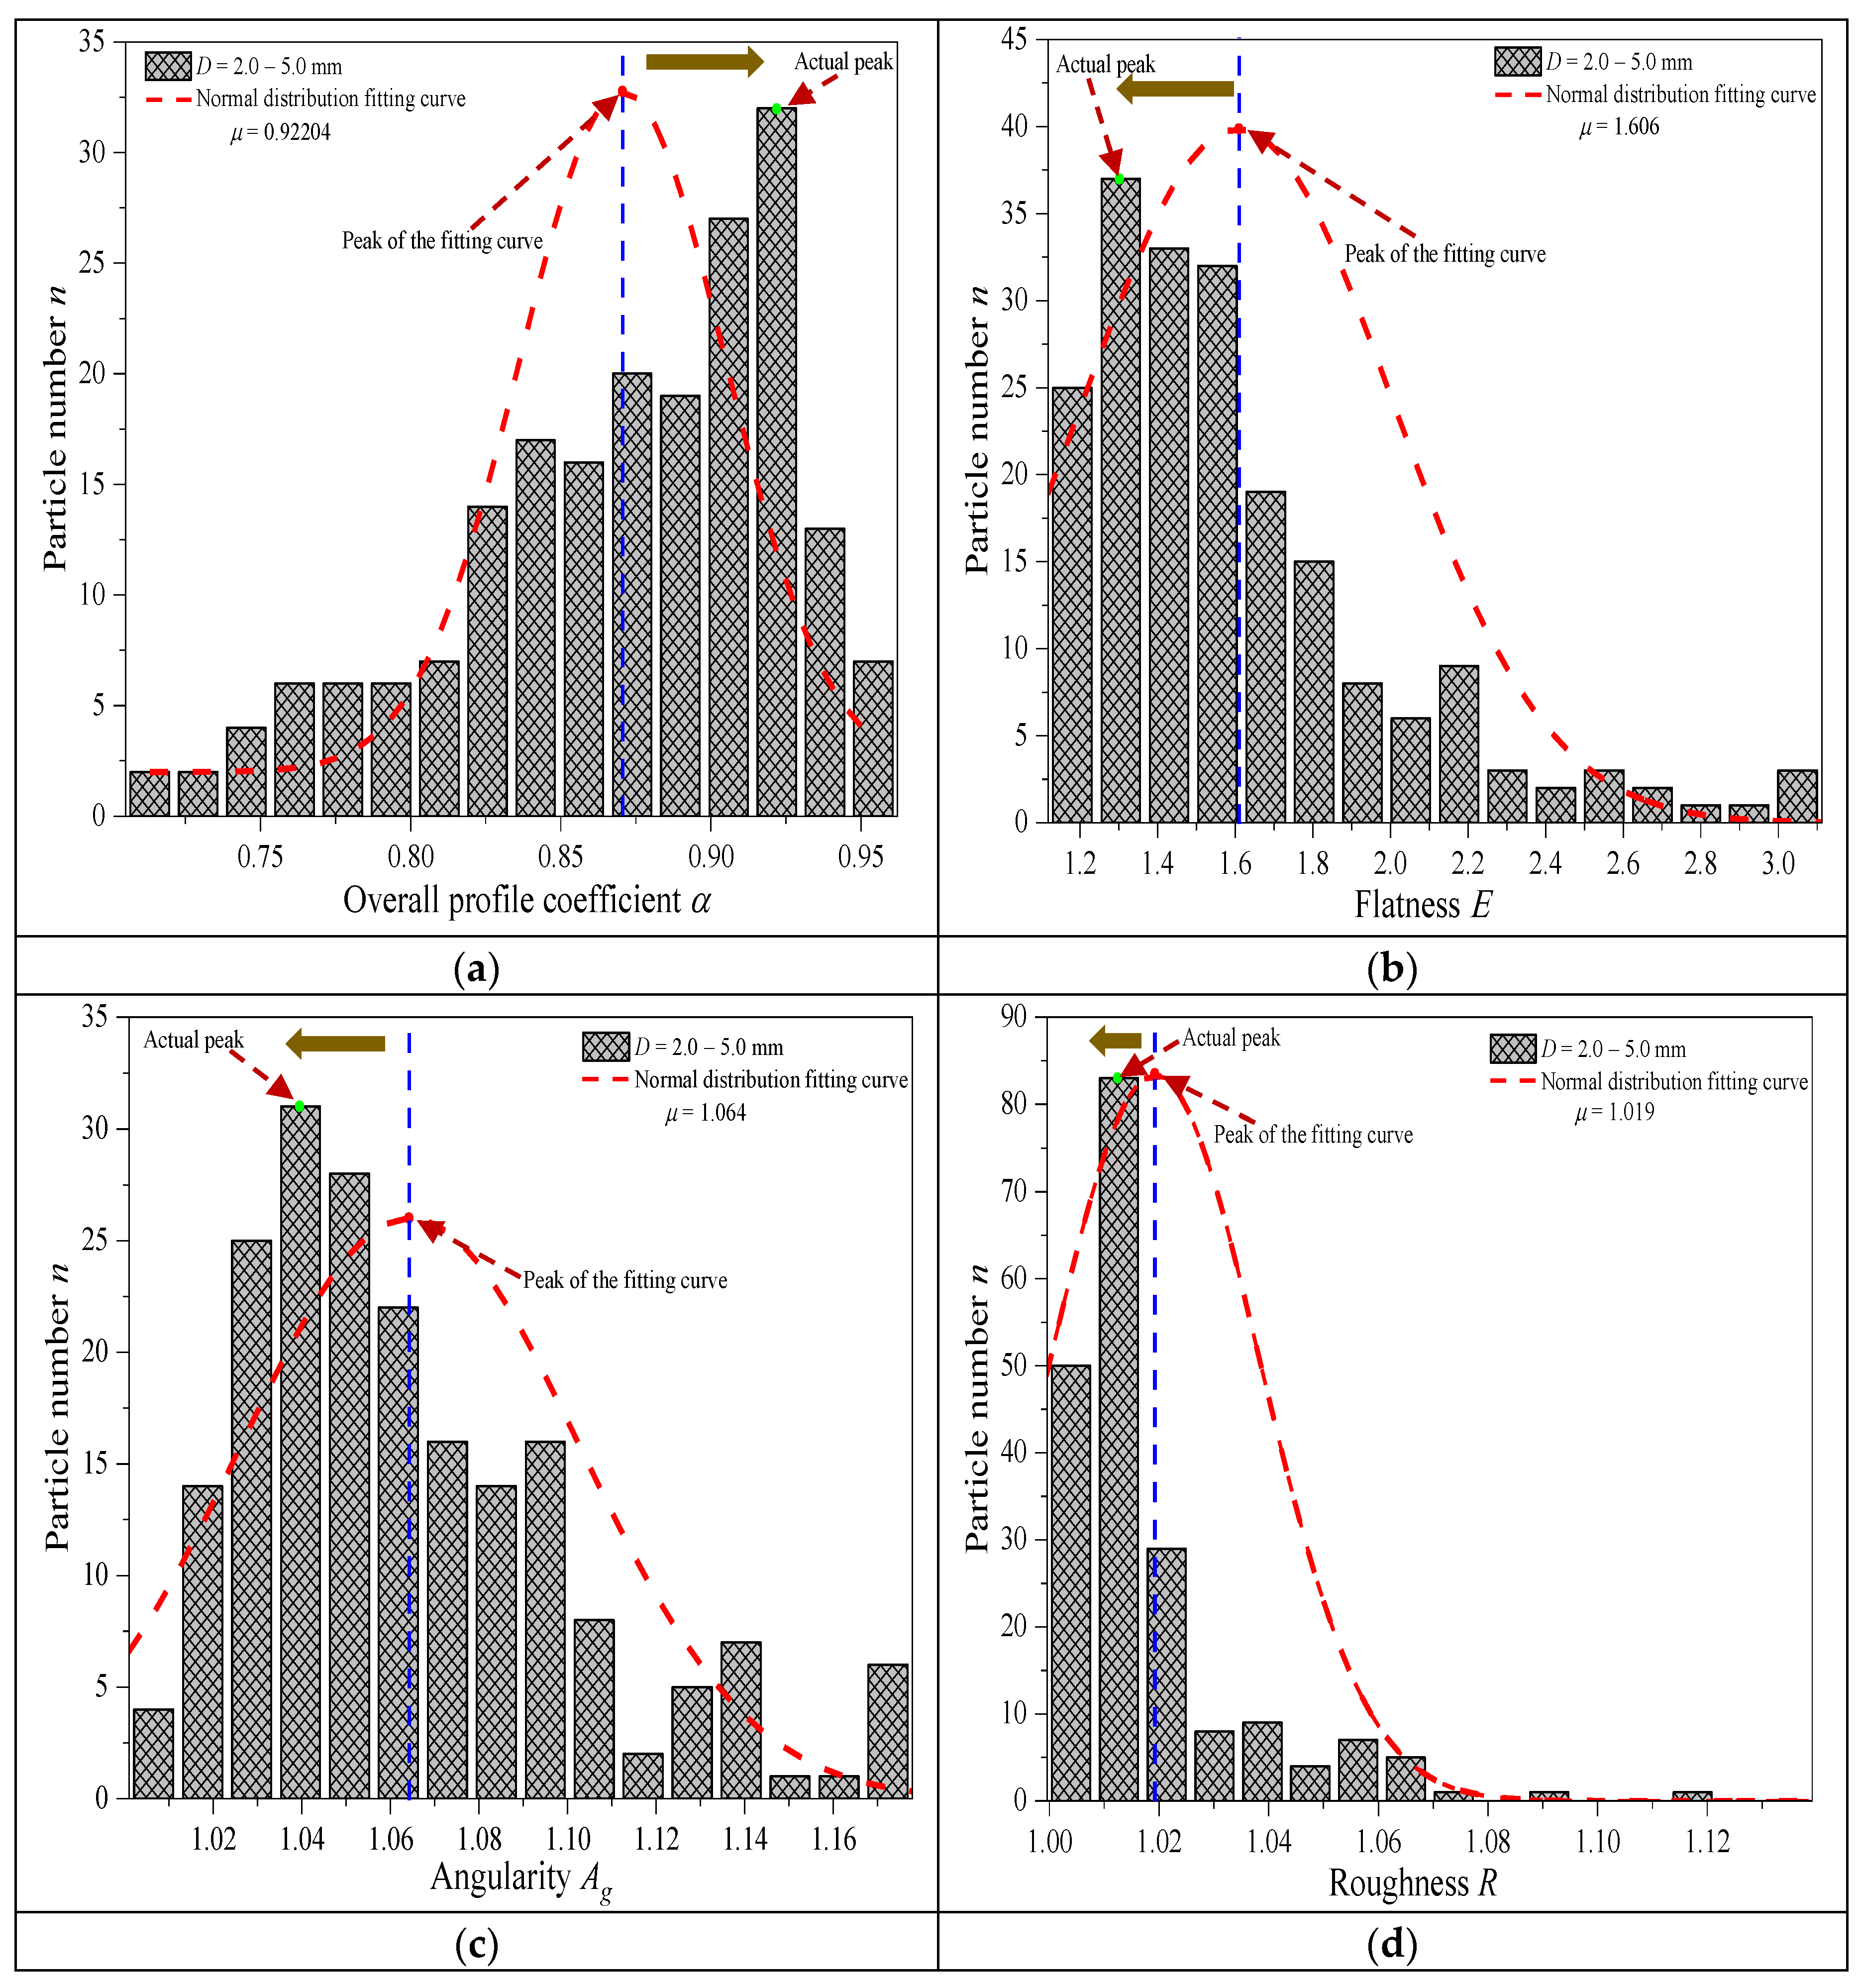
where k is the number of groups and n is the total amount of samples. The frequency distribution histograms of each particle shape parameter of coral sand were drawn. Owing to space limitation, the statistical results of four shape parameters of coral gravel sand with particle size between 2.0 and 5.0 mm were plotted in Figure 13, in which a comparative analysis was conducted for the peak value corresponding to the average value of particle shape parameters in the fitting curve of the normal distribution and the actual peak value. The figure demonstrates that in the frequency distribution histograms of the shape parameters of coral sand particles, the fitting peak value of the normal distribution curve corresponding to the average value does not coincide with the actual peak value, and the parameter distribution is skewed. The skewness coefficient (SK) represents the deviation degree between the particle shape parameter value corresponding to the actual peak value and the particle shape parameter value corresponding to the normal distribution fitting peak value (i.e., mean value of the particle shape parameter), which is often adopted to reflect the symmetry degree of the probability density curve of the actual particle shape parameter distribution. The actual peak value of the overall contour coefficient (α) is on the right side of the fitting peak value, and the long tail extends to the left side of the coordinate axis; therefore, the SK is less than 0 (Table 4), showing a negative skew distribution. Conversely, the SK of flatness (E), angularity (Ag), and roughness (R) is greater than 0 (Table 4), showing a positive skew distribution. According to the physical meaning of each shape parameter, the overall contour coefficient (α) of non-standard sphere particles is less than 1.0, whereas their flatness (E), angularity (Ag), and roughness (R) are all greater than 1.0; that is, the closer the shape parameter to 1.0, the closer the particle shape to the standard sphere. The statistical results show that the distribution of the overall profile coefficient (α) of the particles tends to the right, that is, to 1.0, whereas the distributions of flatness (E), angularity (Ag), and roughness (R) tend to the left, that is, to 1.0. This indicates that, although characterized by heterogeneous particles, coral sand still tends to be composed of spherical particles in the overall distribution. The same results were obtained from the statistical analysis of the particle shape parameters of other sizes of coral sand, which will not be repeated here.
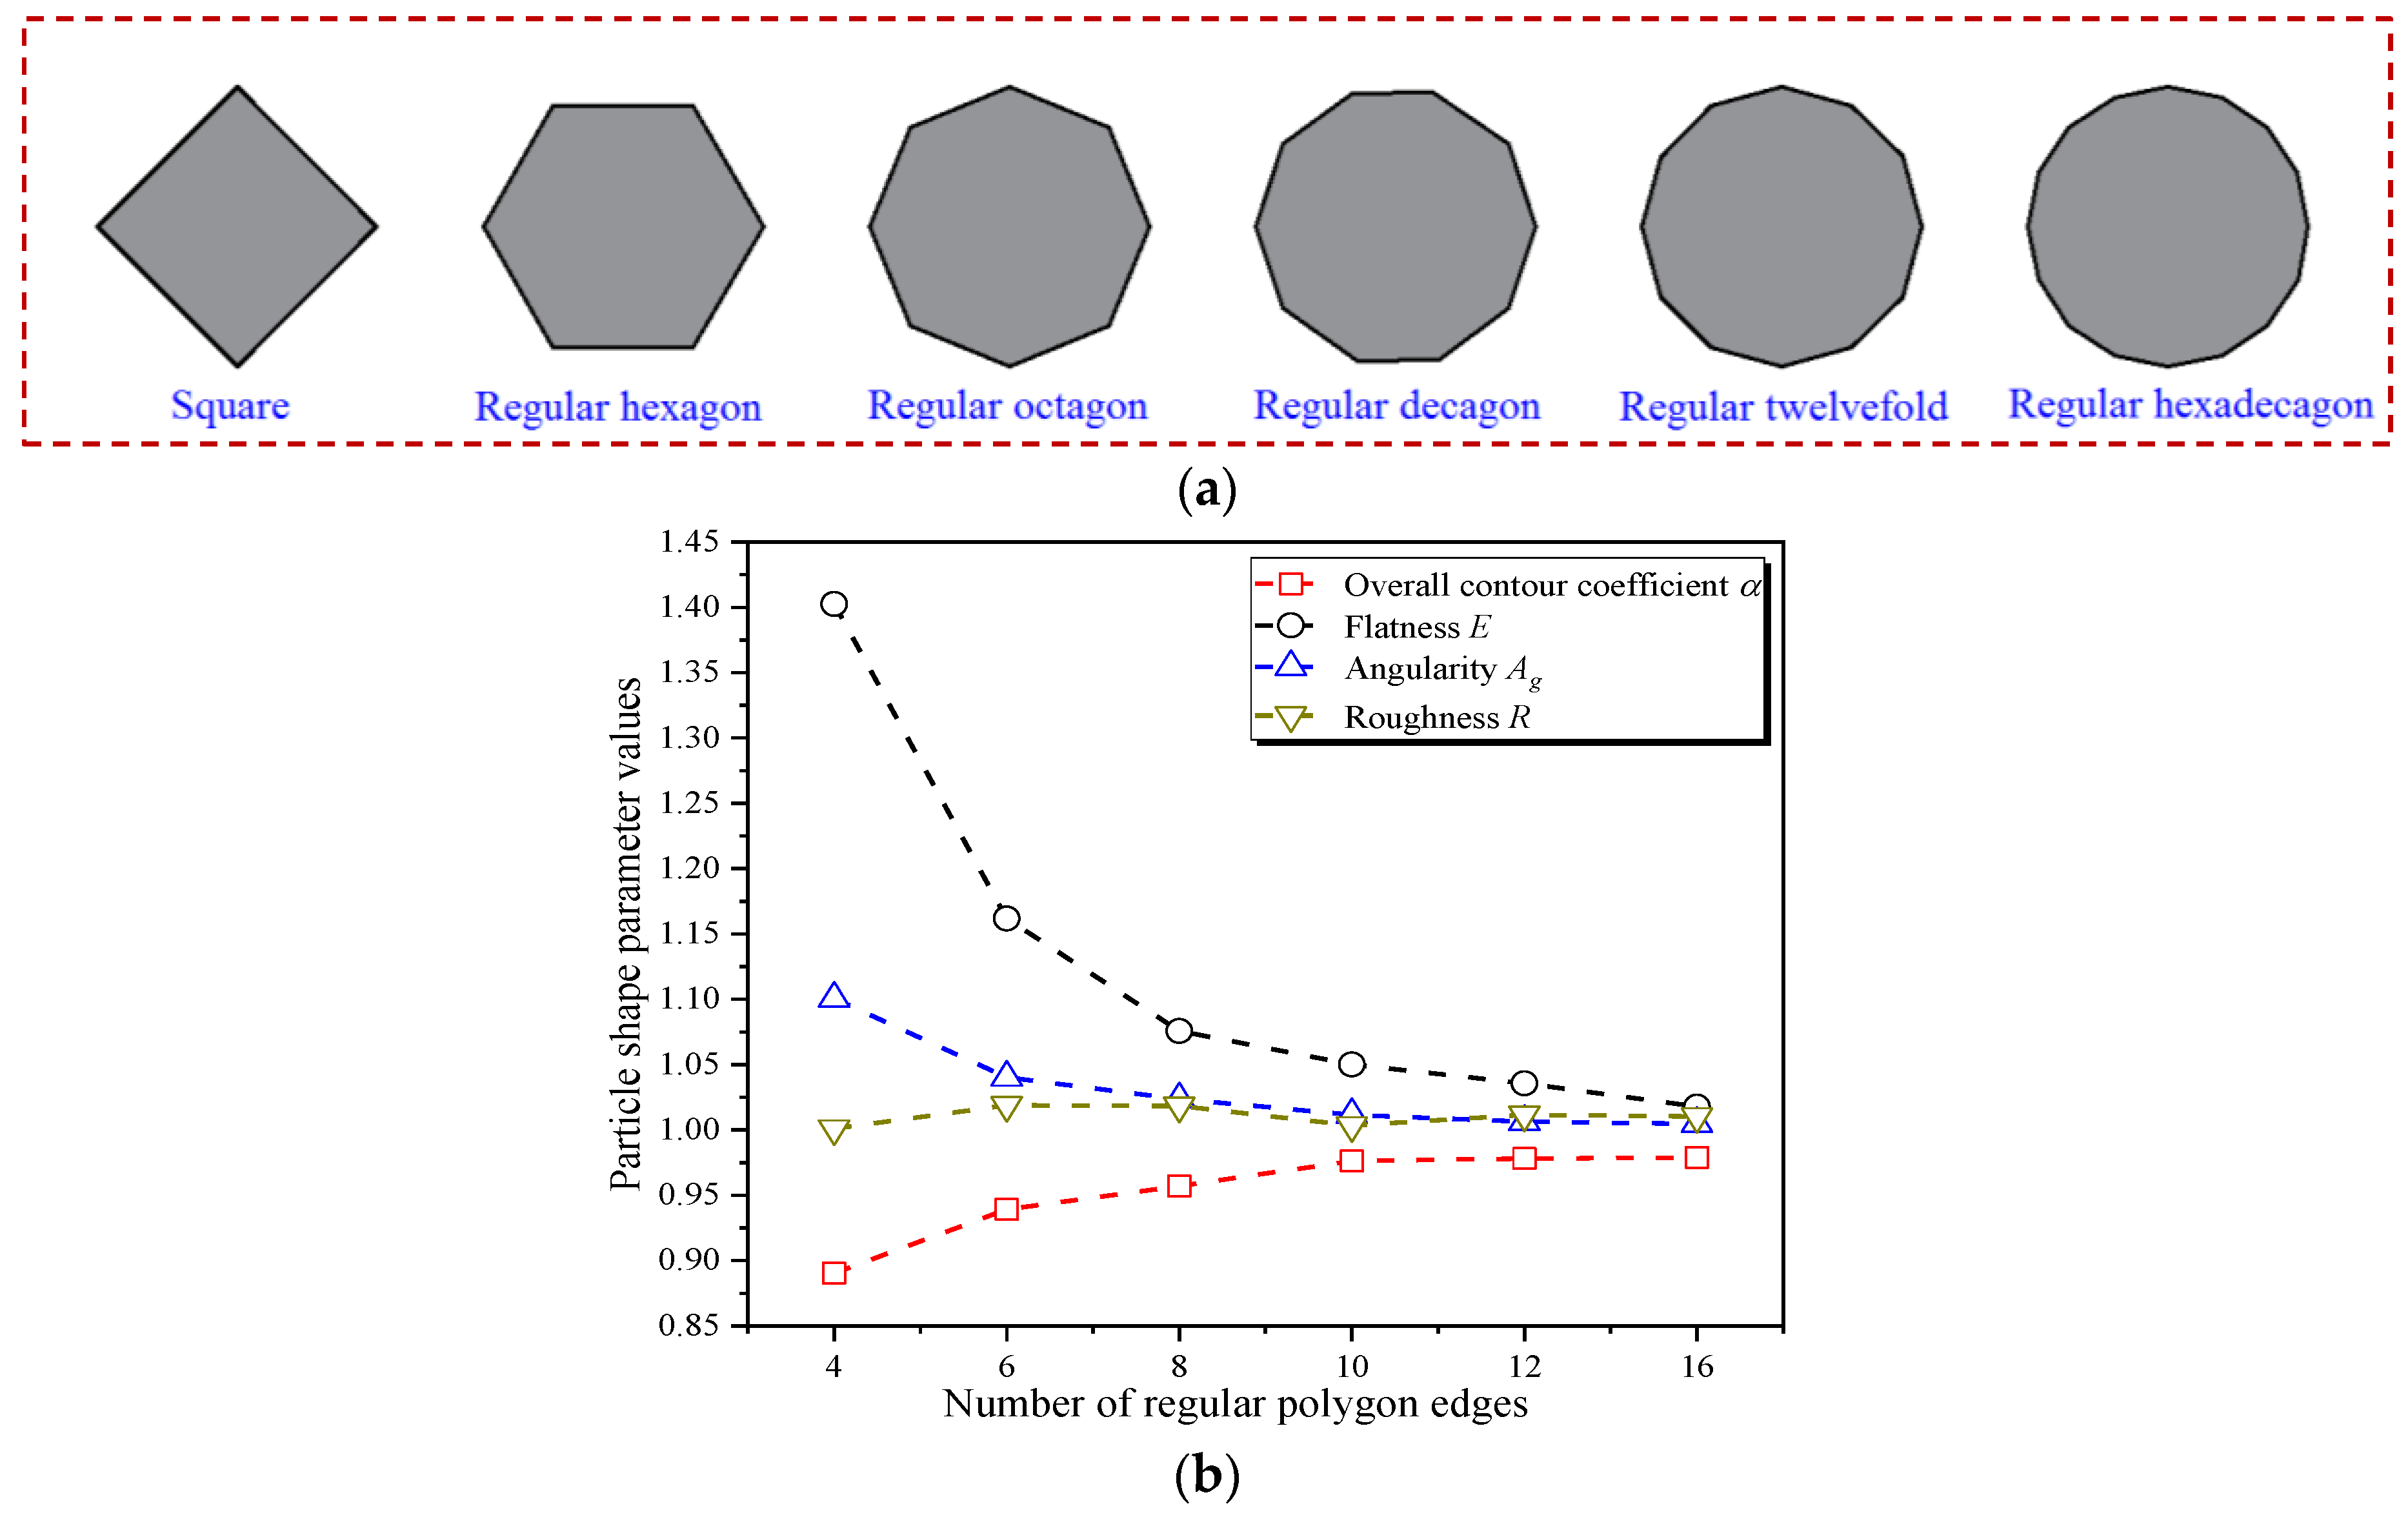
By introducing the basic size parameters of a regular polygon into the particle shape parameters defined above, the sensitivity of the regular polygon to the change of particle shape is further explored. Figure 14a shows the shape sketch of a regular quadrilateral, regular hexagon, regular octagon, regular decagon, regular dodecagon, and regular hexagon. Figure 14b shows the comparison diagram of the shape parameter of the regular polygons. It can be observed from Figure 14 that (1) as the number of regular polygon edges increases, the overall contour coefficient (α) increases gradually, and the flatness (E) and angularity (Ag) gradually decrease, which can be explained by the fact that the higher the number of regular polygon edges, the closer it is to the circle. However, the roughness (R) fluctuates with the increase in number of regular polygon edges. The roughness (R) is related to the undulating complexity of the contour line of the two-dimensional projection image. Although the regular polygon tends to be a regular circle with the increase in number of edges, the wrinkle degree of its contour line will enter the course of constant increase and decrease, and when it evolves into a smooth circle, the roughness (R) reaches the minimum value. (2) To quantitatively evaluate the sensitivity of various shape parameters, a statistical magnitude (δ) was defined, which can be calculated by
where αmax and αmin are the maximum and minimum values of a particle shape parameter, respectively. The sensitivity of each shape parameter is analyzed by comparing the δ values of different shape parameters under the same conditions. After substituting the data in Figure 14 into Equation (5), it is found that the δ values of the overall contour coefficient (α), flatness (E), angularity (Ag), and roughness (R) are 9.03%, 27.44%, 8.71%, and 1.76%, respectively. It can also be observed that the sensitivity of flatness (E) is the strongest, the overall profile coefficient (α) and angularity (Ag) are the second, and the sensitivity of roughness (R) is the weakest, which is consistent with the conclusion of the above analysis.
4. Comparative Analysis of the Particle Shape of Coral Sand and Quartz Sand
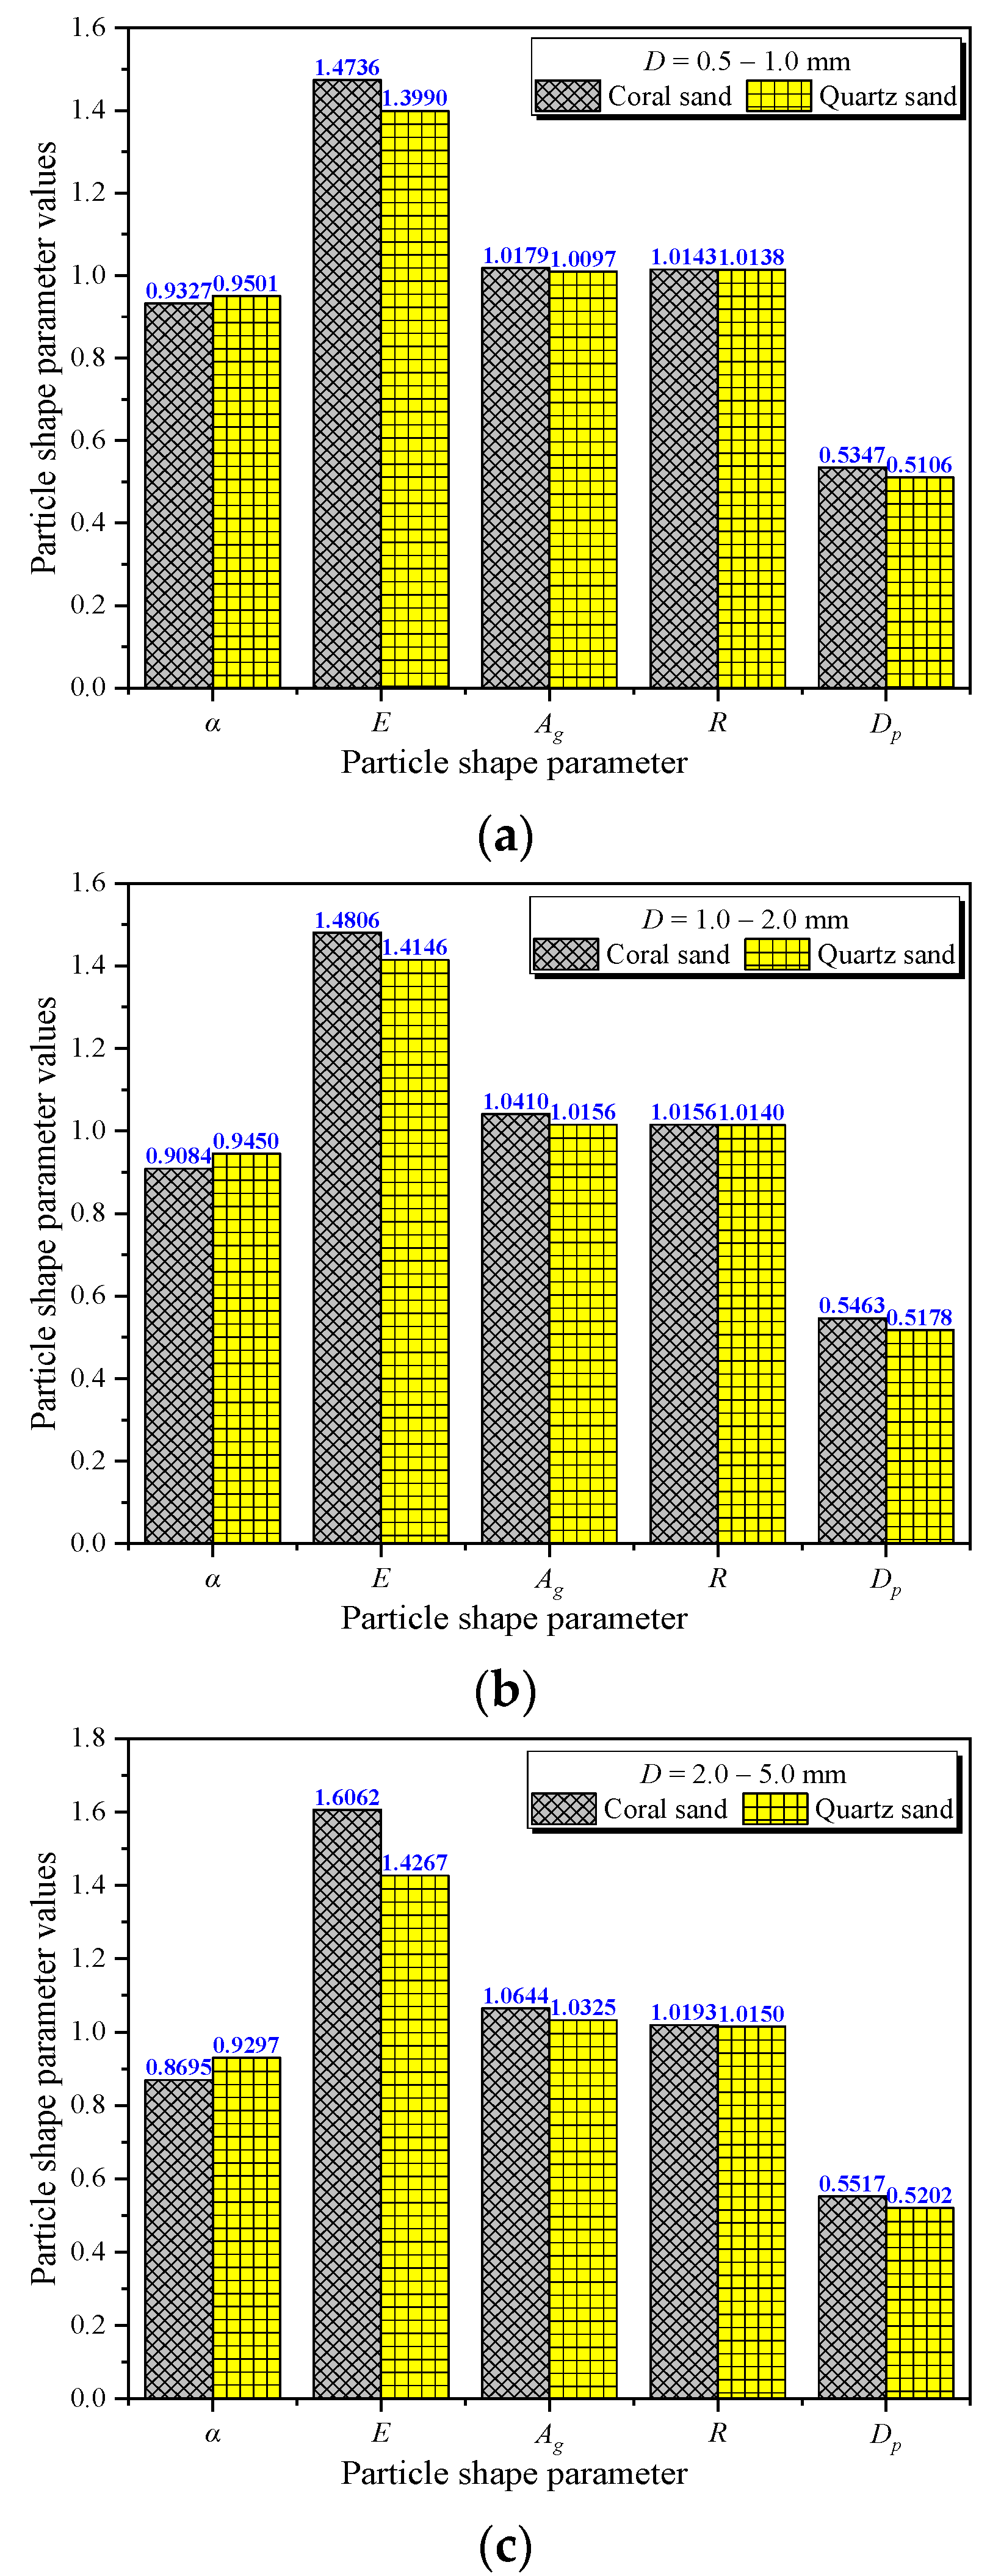
The basic size parameters of coral sand particles and quartz sand particles with different particle sizes that were extracted using IPP were implemented the particle shape parameters constructed above. The overall contour coefficient (α), flatness (E), angularity (Ag), roughness (R), and fractal dimension (Dp) and their arithmetic mean values (i.e., the expected value (μ) under normal distribution) were statistically analyzed, as shown in Figure 15. It can be observed from the figure that, under the same particle size, the overall profile coefficient (α) of coral sand is smaller than that of quartz sand. According to the physical meaning of the overall profile coefficient (α), in the case of the same projection area, the edges and corners around coral sand particles are prominent and its number is also higher, rendering a larger perimeter value. Therefore, the value of the overall contour coefficient (α) of coral sand is smaller. This is consistent with the result that the angularity (Ag) of coral sand of each grain group is greater than that of quartz sand. The flatness (E) of coral sand in each grain group is greater than that of quartz sand, indicating that the content of rod- and branch-shaped particles in coral sand is higher than that in quartz sand and the overall shape deviates more from the circle. The roughness (R) of coral sand in each grain group is also higher than that of quartz sand with the same particle size, implying that the surface of coral sand is more undulating and less smooth. The fractal dimension of coral sand is larger than that of quartz sand, which indicates that the grain profile of coral sand is more complex than that of quartz sand.
In summary, coral sand possesses more rod- and branch-shaped particles than quartz sand with the same particle size, and the particle surface has more edges and corners, the angular protrusion grain edge distance is larger, and the particle surface has more undulation and is rougher than those of quartz sand. The grain shape of coral sand is very different from that of quartz sand, which is closely related to its genesis and sedimentary environment. Quartz sand from the Yangtze River, which migrates continuously with the flow during the deposition process, often collides and rubs with other particles, and this is coupled with the scouring action of the flow, which makes its particle surface smooth and round with less edges and corners. The special marine biological origin of coral sand, formed by the biological remains after the death of the hermatypic coral group through a long geological process, leads to the irregular shape of coral sand in the initial formation and to the low possibility of large-scale and long-distance migration in the seabed. In addition, it still retains a certain angularity after particle breakage under the action of external forces. Meanwhile, the river sand, which is hard and may not be subjected to large-scale particle breakage, is mainly composed of SiO2. When interacting with the external world, the edges and corners of quartz sand are polished to make itself more regular.
5. Influence of Particle Shape on Accumulation Characteristics
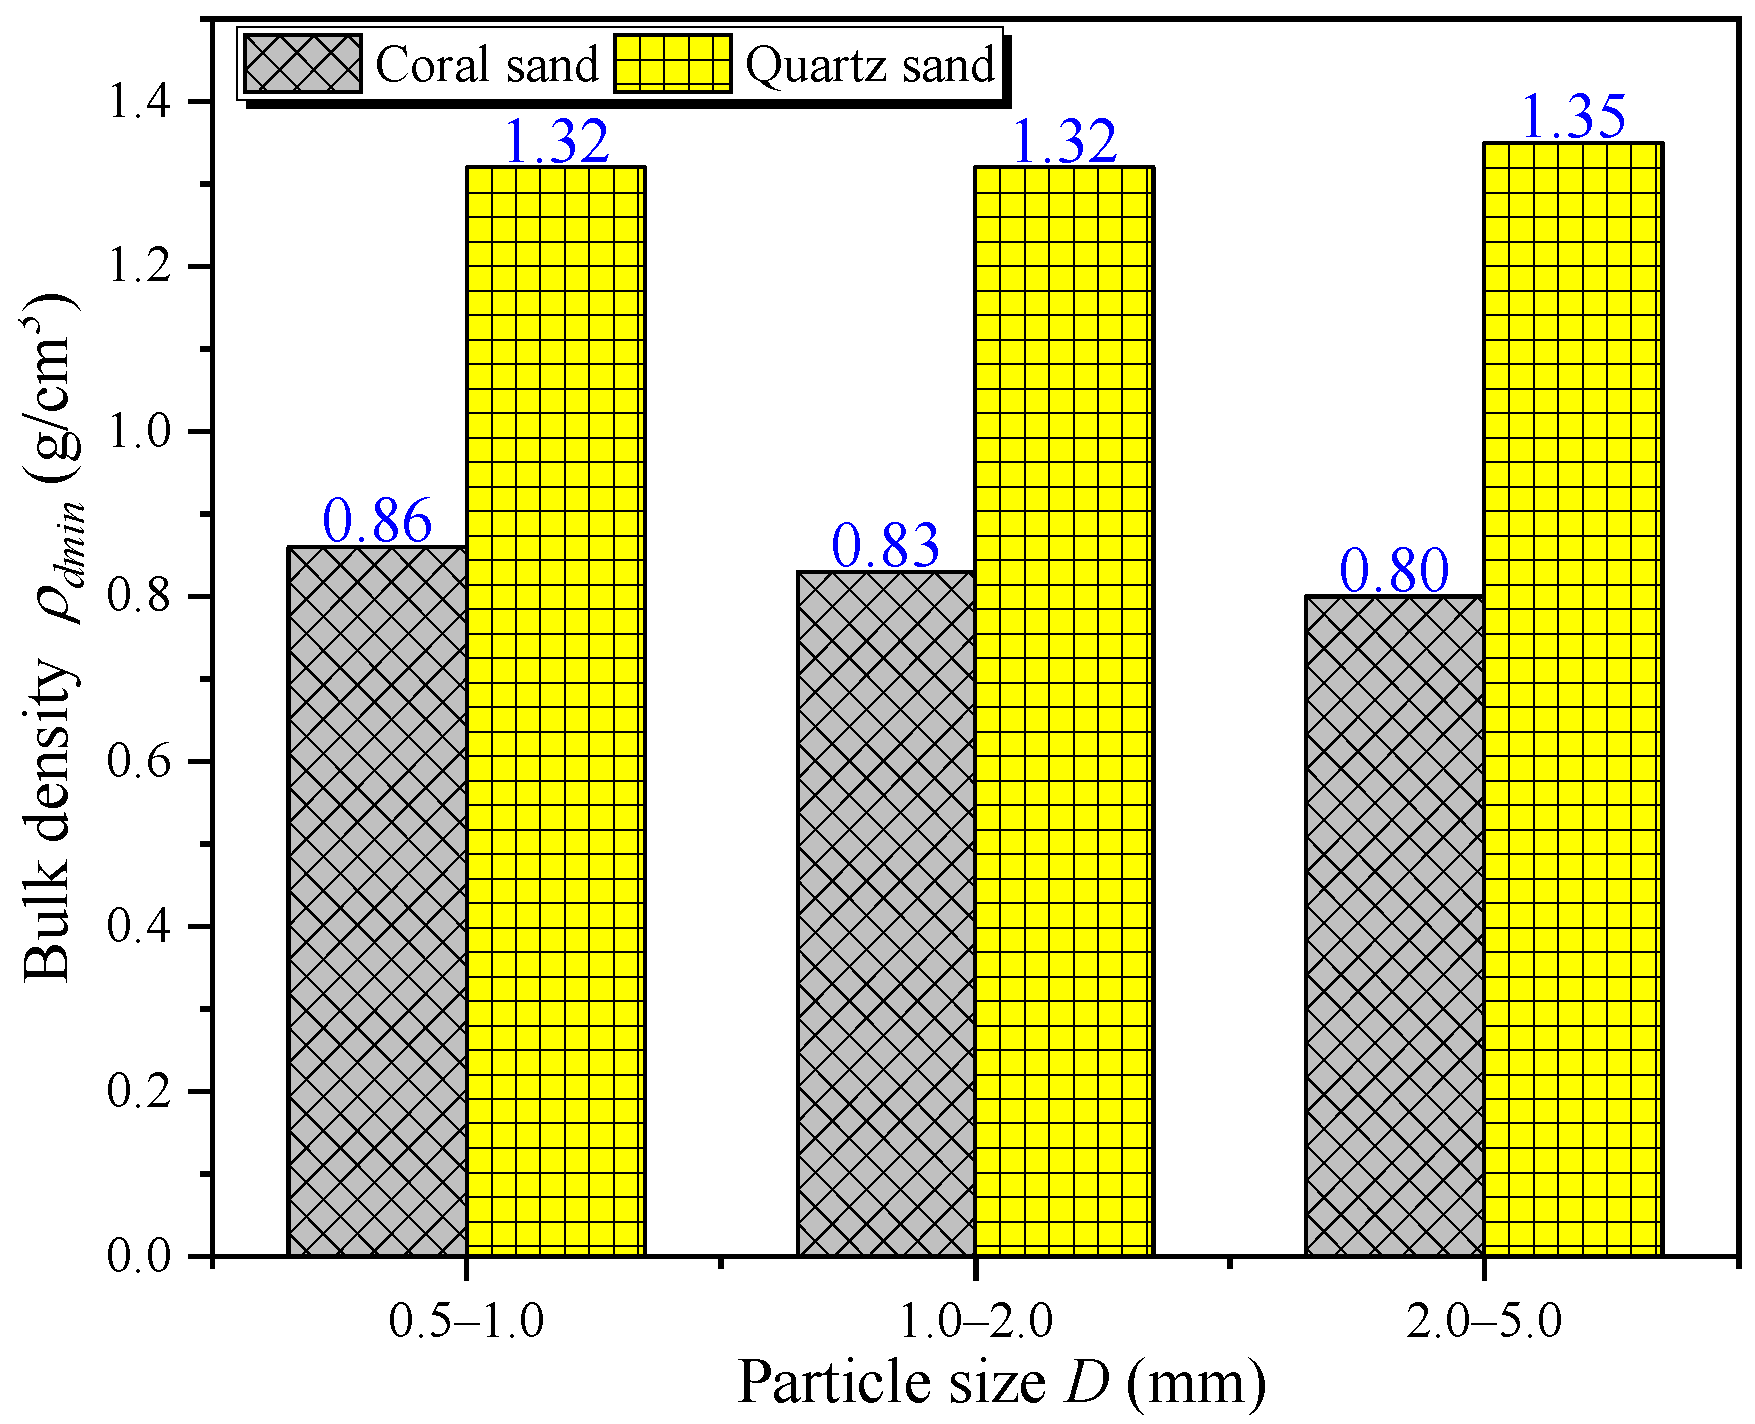
According to the specifications of the Chinese National Standard of Soil Test Method (GB/T50123-2019) [58], 700 g of dry coral sand and quartz sand of each grain group were taken for bulk density test (or minimum dry density test). The results are shown in Figure 16.
Figure 16 shows that as the particle size increases, the bulk density of coral sand decreases evenly by 6.98%, while that of quartz sand slightly increases (by 2.27%); that is, in the context of the same particle size, the bulk density of quartz sand is greater than that of coral sand, and the difference grows with an increase in particle size.
When the mass is constant, the bulk density depends on the gradation and specific gravity of particles and the volume of internal and intergranular pores [47,49]. The mineral composition of the sand is the decisive factor of its specific gravity. When the volume of the internal and intergranular pores is the same, the greater the specific gravity, the greater the bulk density of the sand. For the same mineral type of sand, the larger the volume of the internal and intergranular pores is, the smaller the bulk density becomes.
The special marine biogenesis of coral sand contributes to a mass of internal pores in the coral sand particles. Both internal pores and intergranular pores exist simultaneously in the process of natural accumulation. The larger the size of coral sand particles, the greater the probability of internal pores, the greater the number and volume of the corresponding internal pores, and the more irregular the shape of coral sand particles. This leads to the larger the volume of the intergranular pores in the natural accumulation process of large-size coral sand than those of small-sized coral sand. Therefore, the bulk density of coral sand decreases with the increase in particle size. Relevant research results [59,60,61] show that the influence of nonuniformity coefficient (Cu) on the bulk density of granular materials is greater than that of the median particle size (d50), and the bulk density of granular materials increases gradually with the increase of nonuniformity coefficient (Cu) within limits. In this paper, the nonuniformity coefficient (Cu) of coral sand with particle size in the range of 0.5–1.0 mm, 1.0–2.0 mm and 2.0–5.0 mm increases slightly with the increase of particle size (see Table 1), but the bulk density does not increase with the slightly increase of nonuniformity coefficient (Cu), indicating that the influence of particle shape on the bulk density of coral sand is stronger than that of nonuniform coefficient (Cu) in the case of little difference in the nonuniformity coefficient (Cu).
As there are almost no internal pores in quartz sand, the variation in bulk density with particle size hinges on the variation of intergranular pores and particle gradation. The particle shape of quartz sand is also more irregular with the increase of particle size, which leads to the increase of intergranular pore volume in the sample with the increase of particle size. However, the bulk density of quartz sand shows a slight increase trend with the increase of particle size. This is because the particle shape of quartz sand is relatively smooth, and the influence of particle gradation on the bulk density of quartz sand is greater than that of particle shape. The nonuniformity coefficient (Cu) of quartz sand increases slightly with the increase of particle size (see Table 1), which is the essential reason why the bulk density of quartz sand increases slightly with the increase of particle size.
Determination of the specific gravity of coral sand and quartz sand in this test shows that the specific gravity of coral sand is 2.785, which is greater than that of quartz sand (2.698). If the coral sand and quartz sand do not have internal pores and intergranular pores, the bulk density of these two types of sand is the same as its specific gravity; that is, the bulk density of coral sand should be greater than that of quartz sand. It can be observed that owing to the existence of internal pores and intergranular pores, the bulk density of coral sand significantly decreases. With the decrease in particle size, their difference in bulk density gradually decreases, which occurs because the number (or volume) of the internal pores of coral sand decrease with the decrease in particle size, and at this point, the key factors restricting their bulk density are the specific gravity of particles and the volume of the intergranular pores. Even in the case of small particle size, the bulk density of coral sand is still less than that of quartz sand, indicating that the intergranular pore volume of coral sand is much larger than that of quartz sand under the same particle size. The volume of internal pores of coral sand is determined by its marine origin, and the volume of the intergranular pores is associated with its irregular particle shape. From the above analysis, it can be observed that owing to the irregular shape of coral sand particles, the bulk density of small-size coral sand is still smaller when its specific gravity is larger than that of quartz sand.
6. Conclusions
(1) In this study, four shape parameters, namely, overall profile coefficient, flatness, angularity, and roughness, were constructed to study the change in particle shape with particle size ranging from 0.5 to 5.0 mm. It was proved that the larger the particle size of coral sand, the more evident the difference in shape between coral sand and the standard circle.
(2) The shape of coral sand exhibits good fractal property, and the fractal dimension of coral sand with particle size of 0.5–5.0 mm is between 1.07 and 1.10; thus, the larger the particle size, the greater the fractal dimension, and the more complex the particle profile.
(3) Although the distribution of each shape parameter presents certain discreteness, it generally obeys the skewed distribution. The flatness renders the greatest sensitivity to the change in particle shape, followed by the overall profile coefficient and angularity and then the roughness. It is suggested that flatness should be preferred as the evaluation parameter of the particle shape.
(4) Coral sand particles are mainly massive, flaky, and spindle shaped. In comparison with the quartz sand, the coral sand harbors more contents of rod- and branch-shaped particles, more edges and corners, larger roughness, and a more irregular grain shape.
(5) The irregular particle shape of coral sand makes its bulk density smaller than that of quartz sand under the same conditions, and it is also more difficult for coral sand to reach the dense state. The larger the particle size, the more irregular the particle shape, the larger the intergranular pore volume, the smaller the corresponding bulk density, and the greater the difference of bulk density between coral sand and quartz sand. The irregular particle shape of coral sand functions as the main reason why its specific gravity is higher than that of quartz sand, but its bulk density is less than that of quartz sand.
Author Contributions
Conceptualization, X.W. and Y.W.; methodology, X.W.; validation, X.W.; formal analysis, X.W. and Y.W.; investigation, Y.W.; resources, X.W.; data curation, X.W.; writing—original draft preparation, J.C.; writing—review and editing, C.-Q.Z.; visualization, X.-Z.W.; supervision, C.-Q.Z.; project administration, Y.W.; funding acquisition, Y.W. All authors have read and agreed to the published version of the manuscript.
Funding
This research was funded by the Consultative Project by Chinese Academy of Engineering(2019-XZ-18), the National Natural Science Foundation of China (Nos. 41877271, 51908153), the Strategic Priority Research Program of the Chinese Academy of Sciences (XDA13010301), and Guangzhou City Technology and Science Program (201904010278).
Conflicts of Interest
All the authors have read and approved this version of the article, and due care has been taken to ensure the integrity of the work. All the authors have no conflicts of interest to declare.
References
- Wang, X.; Cui, J.; Wu, Y.; Zhu, C.Q.; Wang, X.Z. Mechanical properties of calcareous silts in a hydraulic fill island-reef. Mar. Georesources Geotechnol. 2020, 1–14. [Google Scholar] [CrossRef]
- Wu, Y.; Wang, X.; Shen, J.H.; Cui, J.; Zhu, C.Q.; Wang, X.Z. Experimental study on the impact of water content on the strength parameters of coral gravelly sand. J. Mar. Sci. Eng. 2020, 8, 634. [Google Scholar] [CrossRef]
- Demars, K.R.; Nacci, V.A.; Kelly, W.E.; Wang, M.C. Carbonate content: An index property for ocean sediments. In Proceedings of the 8th Annual Offshore Technology Conference, Houston, TX, USA, 3–6 May 1976; pp. 97–106. [Google Scholar]
- Shaqour, F.M. Cone penetration resistance of calcareous sand. Bull. Eng. Geol. Environ. 2007, 66, 59–70. [Google Scholar] [CrossRef]
- Hassanlourad, M.; Salehzadeh, H.; Shahnazari, H. Dilation and particle breakage effects on the shear strength of calcareous sands based on energy aspects. Int. J. Civ. Eng. 2008, 6, 108–119. [Google Scholar]
- Hassanlourad, M.; Salehzadeh, H.; Shahnazari, H. Drained shear strength of carbonate sands based on energy approach. Int. J. Geotech. Eng. 2014, 8, 1–9. [Google Scholar] [CrossRef]
- Xiao, Y.; Liu, H.L.; Chen, Q.S.; Ma, Q.F.; Xiang, Y.Z.; Zheng, Y.R. Particle breakage and deformation of carbonate sands with wide range of densities during compression loading process. Acta Geotech. 2017, 12, 1177–1184. [Google Scholar] [CrossRef]
- Wang, G.; Ye, Q.G.; Zha, J.J. Experimental study on mechanical behavior and particle crushing of coral sand-gravel fill. Chin. J. Geotech. Eng. 2017, 40, 802–810. [Google Scholar]
- Wang, X.Z.; Wang, X.; Chen, J.W.; Wang, R.; Hu, M.J.; Meng, Q.S. Experimental study on permeability characteristics of calcareous soil. Bull. Eng. Geol. Environ. 2017, 77, 1753–1762. [Google Scholar] [CrossRef]
- Li, G.; Zhang, J.L.; Yang, Q.; Jiang, M.J. Centrifugal test and numerical assessment for settlement of a large-scale artificial island constructed on deep marine clays. Eur. J. Environ. Civ. Eng. 2017, 21, 172–192. [Google Scholar] [CrossRef]
- Wang, X.Z.; Wang, X.; Hu, M.J.; Zhu, C.Q.; Meng, Q.S.; Wang, R. Study on permeability characteristics of interlayer of calcareous silt in artificial island. Rock Soil Mech. 2017, 38, 3127–3135. [Google Scholar]
- Shen, Y.; Zhu, Y.H.; Liu, H.L.; Li, A.; Ge, H.Y. Macro-meso effects of gradation and particle morphology on the compressibility characteristics of calcareous sand. Bull. Eng. Geol. Environ. 2018, 77, 1047–1055. [Google Scholar] [CrossRef] [Green Version]
- Yang, Q.; Ren, Y.B.; Niu, J.L.; Cheng, K.; Hu, Y.X.; Wang, Y. Characteristics of soft marine clay under cyclic loading: A review. Bull. Eng. Geol. Environ. 2018, 77, 1017–1046. [Google Scholar] [CrossRef]
- Wang, Y.; Zhou, L.X.; Wu, Y.; Yang, Q. New simple correlation formula for the drag coefficient of calcareous sand particles of highly irregular shape. Powder Technol. 2018, 326, 379–392. [Google Scholar] [CrossRef]
- Wang, X.; Zhu, C.Q.; Wang, X.Z.; Qin, Y. Study of dilatancy behaviors of calcareous soils in a triaxial test. Mar. Georesources Geotechnol. 2019, 37, 1057–1070. [Google Scholar] [CrossRef]
- Shang, G.W.; Sun, L.Q.; Li, S.; Liu, X.L.; Chen, W.W. Experimental study of the shear strength of carbonate gravel. Bull. Eng. Geol. Environ. 2020, 79, 2381–2394. [Google Scholar] [CrossRef]
- He, S.H.; Zhang, Q.F.; Ding, Z.; Xia, T.D.; Gan, X.L. Experimental and estimation studies of resilient modulus of marine coral sand under cyclic loading. J. Mar. Sci. Eng. 2020, 8, 287. [Google Scholar] [CrossRef]
- Wu, Q.; Ding, X.M.; Zhang, Y.L.; Chen, Z.X. Comparative study on seismic response of pile group foundation in coral sand and Fujian sand. J. Mar. Sci. Eng. 2020, 8, 189. [Google Scholar] [CrossRef] [Green Version]
- Ting, J.M.; Meachum, L.; Rowell, J.D. Effect of particle shape on the strength and deformation mechanisms of ellipse-shaped granular assemblages. Eng. Comput. 1995, 12, 99–108. [Google Scholar] [CrossRef]
- Antony, S.J.; Kuhn, M.R. Influence of particle shape on granular contact signatures and shear strength: New insights from simulations. Int. J. Solids Struct. 2004, 41, 5863–5870. [Google Scholar] [CrossRef]
- Rouse, P.C.; Fannin, R.J.; Shuttle, D.A. Influence of roundness on the void ratio and strength of uniform sand. Geotechnique 2008, 58, 227–231. [Google Scholar] [CrossRef]
- Liu, Q.B.; Xiang, W.; Budhu, M.; Cui, D.S. Study of particle shape quantification and effect on mechanical property of sand. Rock Soil Mech. 2011, 32, 190–197. [Google Scholar]
- Liu, Q.B.; Xiang, W.; Lehane, B.M.; Cui, D.S.; Li, Y.N. Experimental study of effect of particle shapes on shear strength of sand and tip resistance of driven piles. Chin. J. Rock Mech. Eng. 2011, 30, 400–410. [Google Scholar]
- Payan, M.; Khoshghalb, A.; Senetakis, K.; Khalili, N. Effect of particle shape and validity of Gmax models for sand: A critical review and a new expression. Comput. Geotech. 2016, 72, 28–41. [Google Scholar] [CrossRef]
- Kandasami, R.K.; Murthy, T.G. Manifestation of particle morphology on the mechanical behaviour of granular ensembles. Granul. Matter 2017, 19, 1–13. [Google Scholar] [CrossRef]
- Zheng, J.; Hryciw, R.D. Traditional soil particle sphericity, roundness and surface roughness by computational geometry. Geotechnique 2015, 65, 494–506. [Google Scholar] [CrossRef]
- Ehrlich, R.; Weinberg, B. An exact method for characterization of grain shape. J. Sediment. Petrol. 1970, 40, 205–212. [Google Scholar]
- Bowman, E.T.; Soga, K.; Drummond, W. Particle shape characterisation using Fourier descriptor analysis. Geotechnique 2000, 51, 545–554. [Google Scholar] [CrossRef]
- Hyslip, J.P.; Vallejo, L.E. Fractal analysis of the roughness and size distribution of granular materials. Eng. Geol. 1997, 48, 231–244. [Google Scholar] [CrossRef]
- Chan, L.C.Y.; Page, N.W. Particle fractal and load effects on internal friction in powders. Powder Technol. 1997, 90, 259–266. [Google Scholar] [CrossRef]
- Gori, U.; Mari, M. The correlation between the fractal dimension and internal friction angle of different granular materials. Soils Found. 2001, 41, 17–23. [Google Scholar] [CrossRef] [Green Version]
- Rausch, J.; Grobety, B.; Vonlanthen, P. Eifel maars: Quantitative shape characterization of juvenile ash particles (Eifel Volcanic Field, Germany). J. Volcanol. Geotherm. Res. 2015, 291, 86–100. [Google Scholar] [CrossRef] [Green Version]
- Mora, C.F.; Kwan, A.K.H. Sphericity, shape factor, and convexity measurement of coarse aggregate for concrete using digital image processing. Cement Concrete Res. 2000, 30, 351–358. [Google Scholar] [CrossRef]
- Sukumaran, B.; Ashmawy, A.K. Quantitative characterisation of the geometry of discrete particles. Geotechnique 2002, 51, 619–627. [Google Scholar] [CrossRef]
- Cho, G.C.; Dodds, J.; Santamarina, J.C. Particle shape effects on packing density, stiffness, and strength: Natural and crushed sands. J. Geotech. Geoenviron. 2006, 132, 591–602. [Google Scholar] [CrossRef] [Green Version]
- Cox, M.R.; Budhu, M. A practical approach to grain shape quantification. Eng. Geol. 2008, 96, 1–16. [Google Scholar] [CrossRef]
- Felekoglu, B. A new approach to the characterisation of particle shape and surface properties of powders employed in concrete industry. Constr. Build. Mater. 2009, 23, 1154–1162. [Google Scholar] [CrossRef]
- Altuhafi, F.; O’ sullivan, C.; Cavarretta, I. Analysis of an image-based method to quantify the size and shape of sand particles. J. Geotech. Geoenviron. 2012, 139, 1290–1307. [Google Scholar] [CrossRef]
- Shin, H.; Santamarina, J.C. Role of particle angularity on the mechanical behavior of granular mixtures. J. Geotech. Geoenviron. 2013, 139, 353–355. [Google Scholar] [CrossRef]
- Yang, J.; Luo, X.D. Exploring the relationship between critical state and particle shape for granular materials. J. Mech. Phys. Solids. 2015, 84, 196–213. [Google Scholar] [CrossRef]
- Shen, W.G.; Yang, Z.G.; Cao, L.H.; Cao, L.; Liu, Y.; Yang, H.; Liu, Z.L.; Bai, J. Characterization of manufactured sand: Particle shape, surface texture and behavior in concrete. Constr. Build. Mater. 2016, 114, 595–601. [Google Scholar] [CrossRef]
- Keramatikerman, M.; Chegenizadeh, A. Effect of particle shape on monotonic liquefaction: Natural and crushed sand. Exp. Mech. 2017, 57, 1341–1348. [Google Scholar] [CrossRef]
- Xu, D.S.; Tang, Z.Y.; Zhang, L. Interpretation of coarse effect in simple shear behavior of binary sand-gravel mixture by DEM with authentic particle shape. Constr. Build. Mater. 2019, 195, 292–304. [Google Scholar] [CrossRef]
- Ren, Q.; De Schutter, G.; Jiang, Z.W.; Chen, Q. Multi-level diffusion model for manufactured sand mortar considering particle shape and limestone powder effects. Constr. Build. Mater. 2019, 207, 218–227. [Google Scholar] [CrossRef]
- Sarkar, D.; Goudarzy, M.; Konig, D. An interpretation of the influence of particle shape on the mechanical behavior of granular material. Granul. Matter 2019, 21, 53.1–53.24. [Google Scholar] [CrossRef]
- Zhang, X.Y.; Baudet, B.A.; Yao, T. The influence of particle shape and mineralogy on the particle strength, breakage and compressibility. Int. J. Geo-Eng. 2020, 11, 1–10. [Google Scholar] [CrossRef]
- Zhu, C.Q.; Zhou, B.; Liu, H.F. Investigation of naturally cemented calcareous soil on strength and microstructure of natural cemented calcareous soil. Rock Soil Mech. 2014, 35, 1655–1663. [Google Scholar]
- Zhu, C.Q.; Zhou, B.; Liu, H.F. Progress in laboratory experiments of cemented calcareous soils. Rock Soil Mech. 2015, 36, 311–319. [Google Scholar]
- Zhu, C.Q.; Chen, H.Y.; Meng, Q.S.; Wang, R. Structural analysis of pores in calcareous sand particles. Rock Soil Mech. 2014, 35, 1831–1836. [Google Scholar]
- Jiang, M.J.; Wu, D.; Cao, P.; Ding, Z.J. Connected inner pore analysis of calcareous sands using SEM. Chin. J. Geotech. Eng. 2017, 39, 1–5. [Google Scholar]
- Coop, M.R.; Sorensen, K.K.; Bodas Freitas, T.; Georgoutsos, G. Particle breakage during shearing of a carbonate sand. Geotechnique 2004, 54, 157–163. [Google Scholar] [CrossRef]
- Shahnazari, H.; Rezvani, R. Effective parameters for the particle breakage of calcareous sands: An experimental study. Eng. Geol. 2013, 159, 98–105. [Google Scholar] [CrossRef]
- Zhang, J.F.; Ye, J.B.; Chen, J.S.; Li, S.L. A preliminary study of measurement and evaluation of breakstone grain shape. Rock Soil Mech. 2016, 37, 343–349. [Google Scholar]
- Sun, Q.; Zheng, J.X.; Coop, M.R.; Altuhafi, F.N. Minimum image quality for reliable optical characterizations of soil particle shapes. Comput. Geotech. 2019, 114, 103110. [Google Scholar] [CrossRef]
- Mark, L.H.; Neil, W.P. Selection of descriptors for particle shape characterization. Part. Part. Syst. Char. 2010, 20, 25–38. [Google Scholar]
- Chen, H.Y.; Wang, R.; Li, J.G.; Zhang, J.M. Grain shape analysis of calcareous soil. Rock Soil Mech. 2005, 26, 1389–1392. [Google Scholar]
- Liu, G.; Zhao, M.Z.; Lu, R.; Luo, Q.; Lv, C. Morphology characterisics of gravel particle and its relationship with stacking void ratio. Rock Soil Mech. 2019, 40, 4644–4658. [Google Scholar]
- Chinese Ministry of Water Resources. Standard: Standard for Soil Test Method (GB/T 50123-2019); China Planning Press: Beijing, China, 2019.
- Youd, T.L. Factors Controlling Maximum and Minimum Densities of Sands; ASTM: West Conshohocken, PA, USA, 1973; pp. 98–112. [Google Scholar]
- Zheng, J.X.; Hryciw, R.D. Index void ratios of sands from their intrinsic properties. J. Geotech. Geoenviron. 2016, 142, 06016019. [Google Scholar] [CrossRef]
- Sarkar, D.; König, D.; Goudarzy, M. The influence of particle characteristics on the index void ratios ingranular materials. Particuology 2019, 46, 1–13. [Google Scholar] [CrossRef]
Figure 1.
Coral sand and quartz sand with different particle sizes.

Figure 2.
Particle size distribution curves of the tested materials.

Figure 3.
X-ray diffraction patterns of coral sand and quartz sand: (a) coral sand and (b) quartz sand.
Figure 3.
X-ray diffraction patterns of coral sand and quartz sand: (a) coral sand and (b) quartz sand.


Figure 4.
Two-dimensional image shooting device.

Figure 5.
Digital image processing software (IPP).

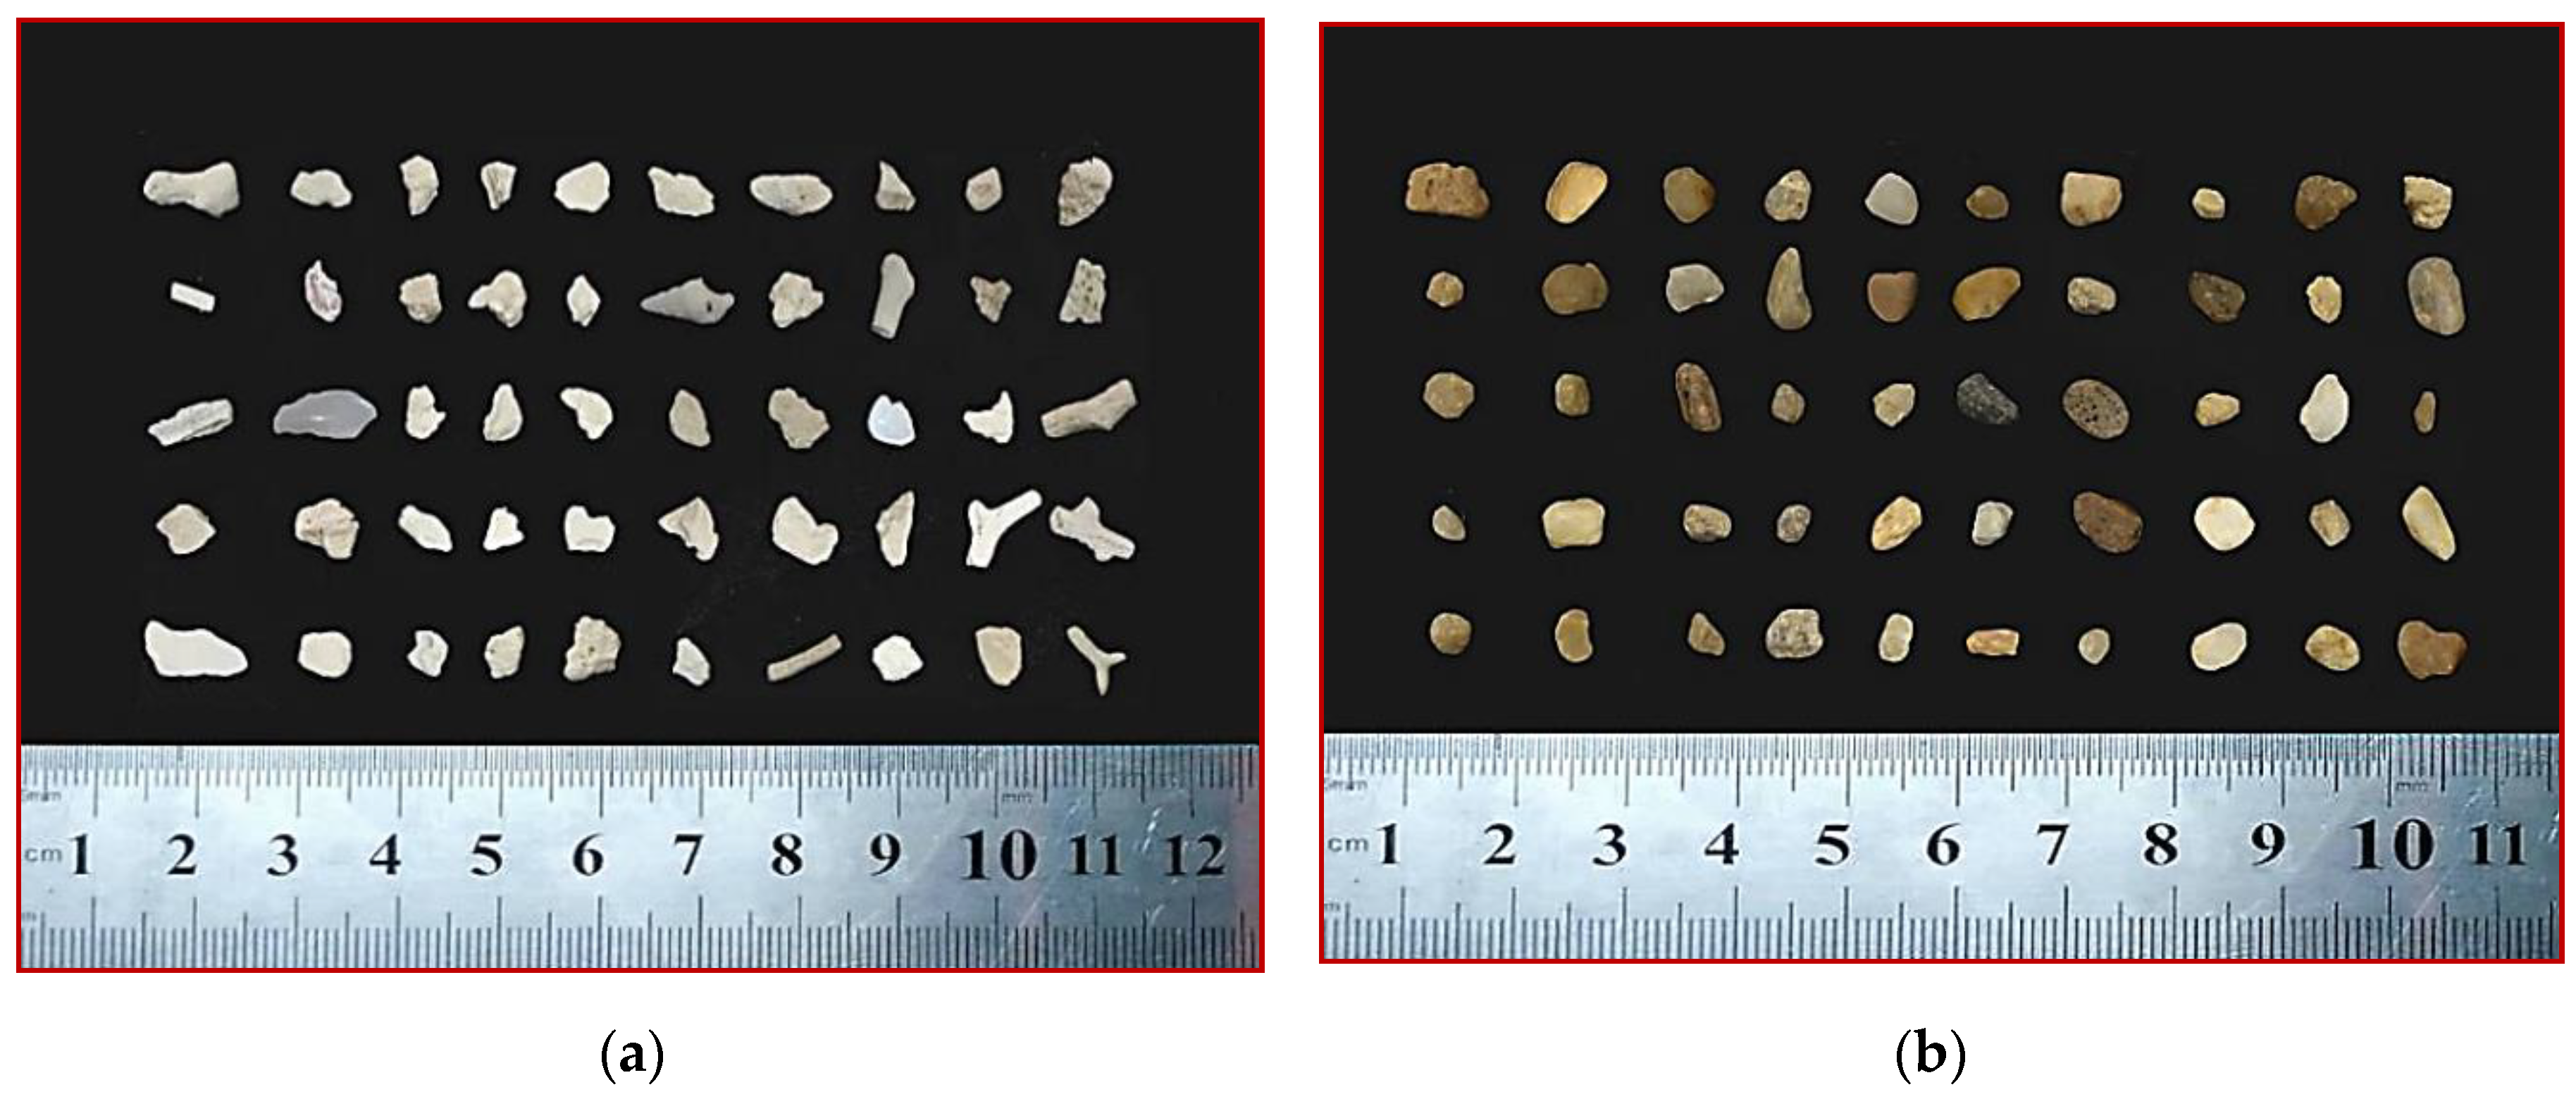
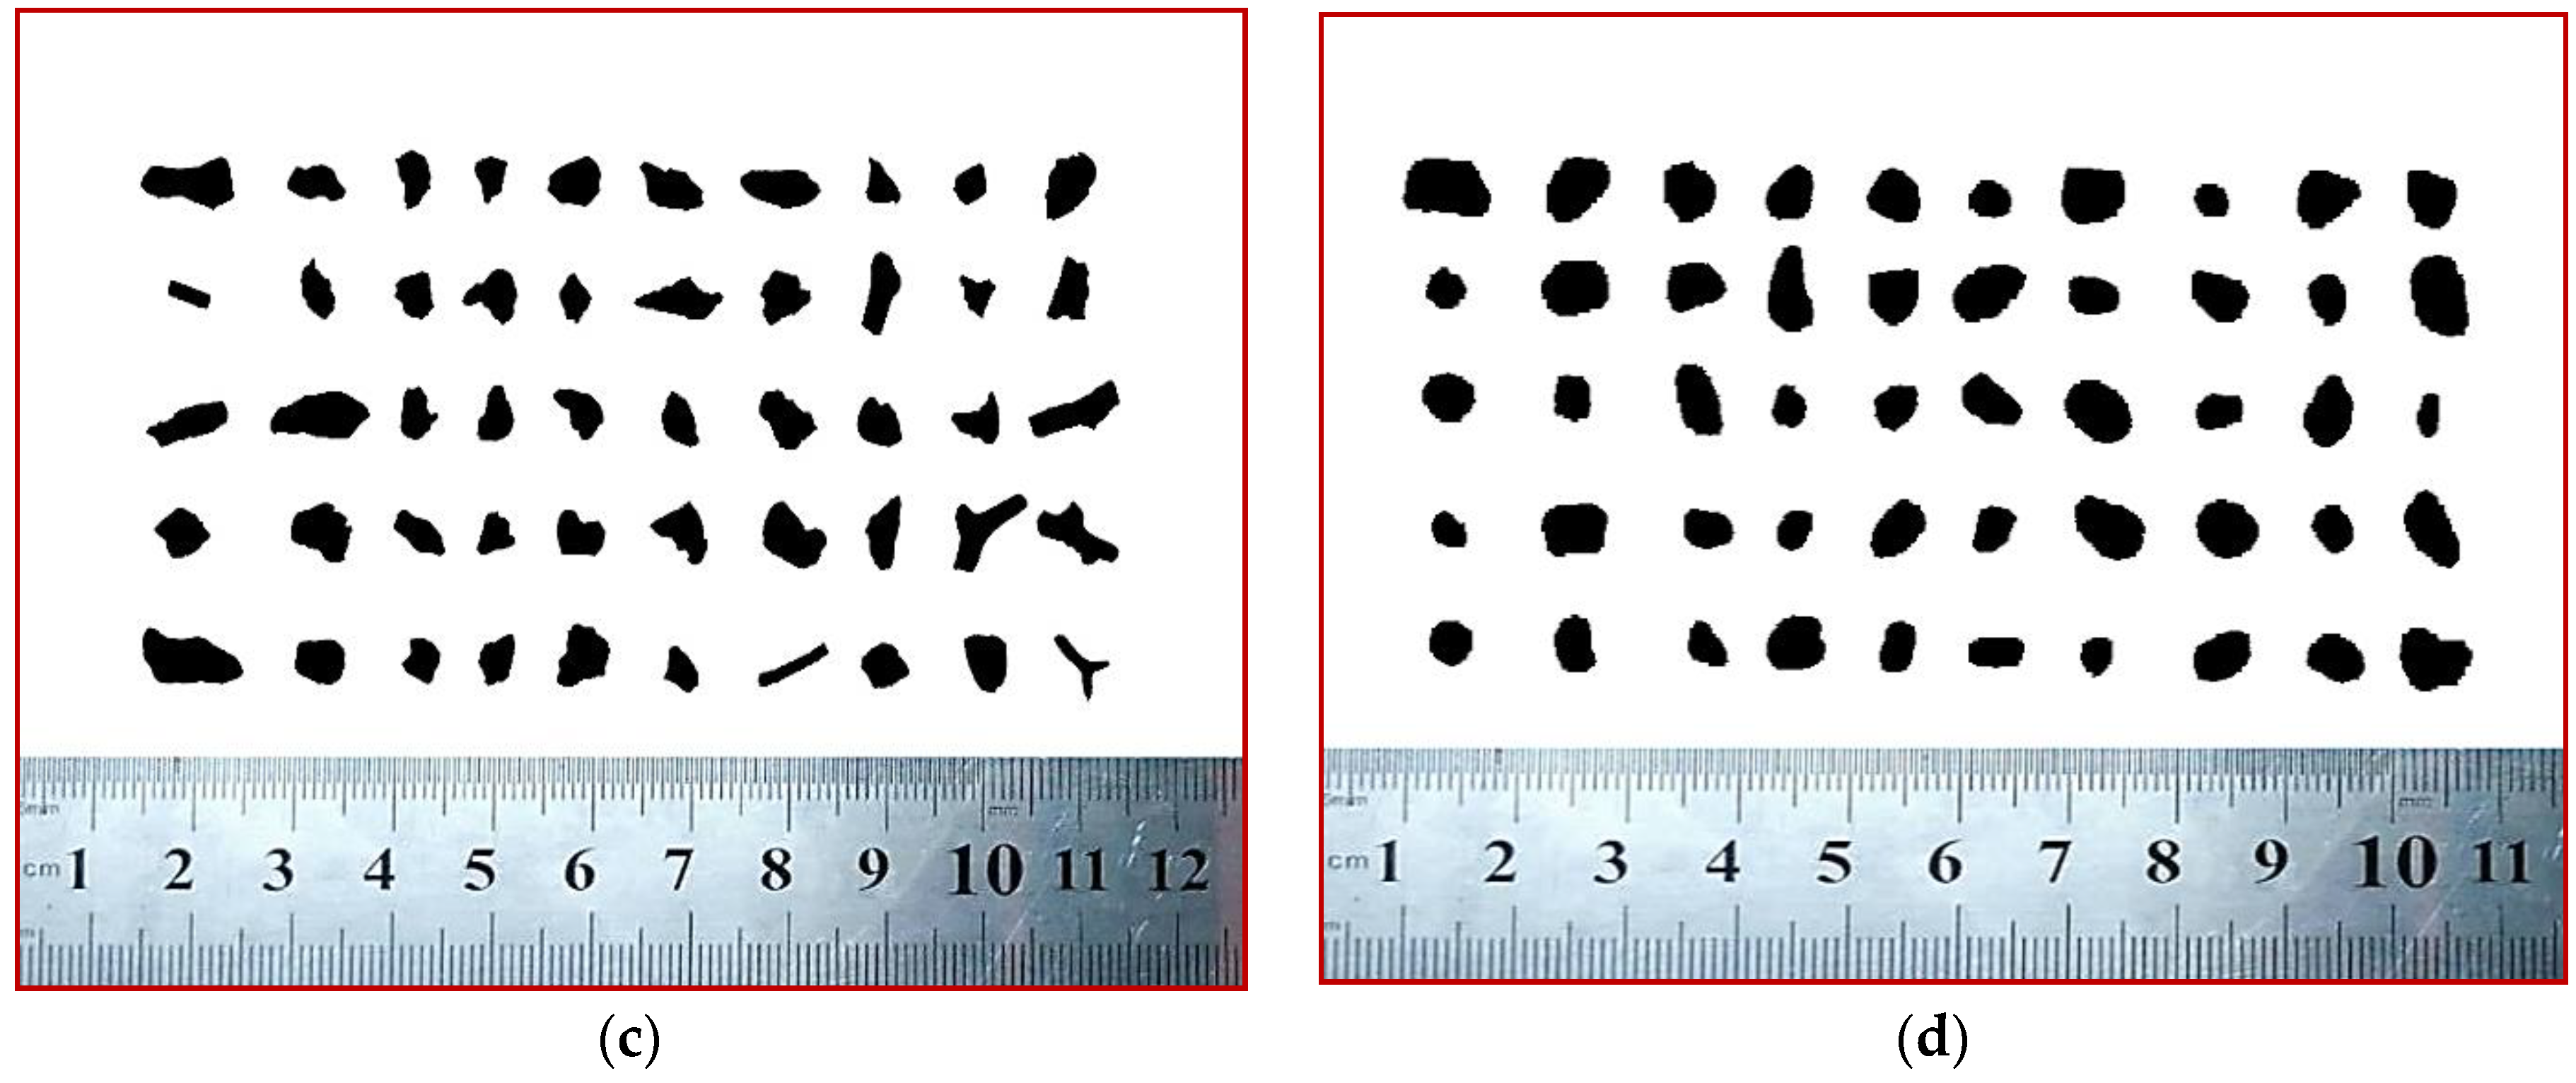
Figure 6.
Digital images and black-and-white binarization images of coral sand and quartz sand with a diameter of 2.0–5.0 mm: (a) digital images of coral sand, (b) digital images of quartz sand, (c) black-and-white binarization images of coral sand, and (d) black-and-white binarization images of quartz sand.


Figure 7.
Schematic view of the basic size parameters of an irregular sand particle.

Figure 8.
Multi-scale shape characteristics of the sand particle.

Figure 9.
Diagram of the particle shape parameters.

Figure 10.
Shape parameter distribution of coral sand with different particle sizes: (a) overall profile coefficient α, (b) flatness E, (c) angularity Ag, and (d) roughness R.
Figure 10.
Shape parameter distribution of coral sand with different particle sizes: (a) overall profile coefficient α, (b) flatness E, (c) angularity Ag, and (d) roughness R.

Figure 11.
Coral sand with different particle sizes: (a) D = 0.5–1.0 mm, (b) D = 1.0–2.0 mm, and (c) D = 2.0–5.0 mm.
Figure 11.
Coral sand with different particle sizes: (a) D = 0.5–1.0 mm, (b) D = 1.0–2.0 mm, and (c) D = 2.0–5.0 mm.


Figure 12.
lgP–lgA fitting curve of coral sand with different particle sizes: (a) D = 0.5–1.0 mm, (b) D = 1.0–2.0 mm, and (c) D = 2.0–5.0 mm.
Figure 12.
lgP–lgA fitting curve of coral sand with different particle sizes: (a) D = 0.5–1.0 mm, (b) D = 1.0–2.0 mm, and (c) D = 2.0–5.0 mm.


Figure 13.
Distribution diagram of the shape parameters of coral sand with the particle size of 2.0–5.0 mm: (a) overall profile coefficient α, (b) flatness E, (c) angularity Ag, and (d) roughness R.
Figure 13.
Distribution diagram of the shape parameters of coral sand with the particle size of 2.0–5.0 mm: (a) overall profile coefficient α, (b) flatness E, (c) angularity Ag, and (d) roughness R.

Figure 14.
Comparison of shape parameters for regular polygons: (a) schematic diagram of regular polygons, (b) variation of particle shape parameter value with the number of regular polygon edges.
Figure 14.
Comparison of shape parameters for regular polygons: (a) schematic diagram of regular polygons, (b) variation of particle shape parameter value with the number of regular polygon edges.

Figure 15.
Comparison of shape parameters for coral sand and quartz sand with different particle sizes: (a) D = 0.5–1.0 mm, (b) D = 1.0–2.0 mm, and (c) D = 2.0–5.0 mm.
Figure 15.
Comparison of shape parameters for coral sand and quartz sand with different particle sizes: (a) D = 0.5–1.0 mm, (b) D = 1.0–2.0 mm, and (c) D = 2.0–5.0 mm.

Figure 16.
Comparison of bulk density between coral sand and quartz sand with different particle sizes.
Figure 16.
Comparison of bulk density between coral sand and quartz sand with different particle sizes.


Table 1.
Particle gradation parameters of the tested materials.
| Sample | D (mm) | D10 (mm) | D30 (mm) | D50 (mm) | D60 (mm) | Nonuniformity Coefficient Cu | Curvature Coefficient Cc |
|---|---|---|---|---|---|---|---|
| Coral medium sand | 0.5–1.0 | 0.55 | 0.65 | 0.75 | 0.80 | 1.45 | 0.96 |
| Coral coarse sand | 1.0–2.0 | 1.10 | 1.30 | 1.50 | 1.60 | 1.45 | 0.96 |
| Coral gravel sand | 2.0–5.0 | 2.30 | 2.90 | 3.50 | 3.80 | 1.65 | 0.96 |
| Quartz medium sand | 0.5–1.0 | 0.55 | 0.65 | 0.75 | 0.80 | 1.45 | 0.96 |
| Quartz coarse sand | 1.0–2.0 | 1.10 | 1.30 | 1.50 | 1.60 | 1.45 | 0.96 |
| Quartz gravel sand | 2.0–5.0 | 2.30 | 2.90 | 3.50 | 3.80 | 1.65 | 0.96 |
Table 2.
Basic size parameters of the particle.
| Basic Size Parameters | Symbol | Description |
|---|---|---|
| Area | A | Area of the graph surrounded by the outer contour points of a particle |
| Perimeter | P | Perimeter of the graph surrounded by the outer contour points of a particle |
| Maximum Ferret diameter | Feretmax | Maximum distance between two boundary parallel lines of a particle projection contour |
| Minimum Ferret diameter | Feretmin | Minimum distance between two boundary parallel lines of a particle projection contour |
| Radius of circumscribed circle | Rc | Radius of the smallest circumscribed circle |
| Radius of inscribed circle | Ri | Radius of the largest inscribed circle |
| Perimeter of external polygon | Pc | Perimeter of the smallest external polygon along the particle boundary |
| Perimeter of ellipse | Pe | Perimeter of an ellipse with the same area and flatness as a particle |
Table 3.
Fractal dimension of coral sand with different particle sizes.
| Particle Size D (mm) | 0.5–1.0 | 1.0–2.0 | 2.0–5.0 |
| Fractal Dimension Dp | 1.06938 | 1.09268 | 1.10332 |
Table 4.
Probability statistics table of the shape parameters of coral sand with different particle sizes.
Table 4.
Probability statistics table of the shape parameters of coral sand with different particle sizes.
| Particle Size | 0.5–1.0 mm | 1.0–2.0 mm | 2.0–5.0 mm | |||||||||
|---|---|---|---|---|---|---|---|---|---|---|---|---|
| Shape Parameters | Overall Contour Coefficient α | Flatness E | Angularity Ag | Roughness R | Overall Contour Coefficient α | Flatness E | Angularity Ag | Roughness R | Overall Contour Coefficient α | Flatness E | Angularity Ag | Roughness R |
| Mean value | 0.93267 | 1.47363 | 1.01789 | 1.01425 | 0.90845 | 1.48061 | 1.04102 | 1.01556 | 0.86955 | 1.60616 | 1.06444 | 1.01926 |
| Standard variance | 0.03814 | 0.25311 | 0.01995 | 0.01294 | 0.03414 | 0.24156 | 0.02654 | 0.01217 | 0.05695 | 0.39946 | 0.03827 | 0.01910 |
| Coefficient of variation | 0.04089 | 0.17176 | 0.01960 | 0.01276 | 0.03758 | 0.16315 | 0.02550 | 0.01198 | 0.06549 | 0.24871 | 0.03595 | 0.01874 |
| Concentrated distribution interval | 0.92737– 0.93797 | 1.43846– 1.50879 | 1.01512– 1.02066 | 1.01246– 1.01605 | 0.90372– 0.91318 | 1.44713– 1.514090 | 1.03734– 1.04469 | 1.01388– 1.01725 | 0.86166– 0.87744 | 1.5508– 1.66152 | 1.05914– 1.06974 | 1.01661– 1.02190 |
| Interval length | 0.01060 | 0.07033 | 0.00554 | 0.00360 | 0.00946 | 0.06696 | 0.00736 | 0.00337 | 0.01578 | 0.11072 | 0.01061 | 0.00529 |
| SK | −0.76594 | 1.09211 | 0.80144 | 3.45728 | -0.39706 | 1.03294 | 1.09371 | 2.12617 | -0.77176 | 1.55492 | 1.02152 | 2.88351 |
| Skewness type | negative skewness | positive skewness | positive skewness | positive skewness | negative skewness | positive skewness | positive skewness | positive skewness | negative skewness | positive skewness | positive skewness | positive skewness |
Publisher’s Note: MDPI stays neutral with regard to jurisdictional claims in published maps and institutional affiliations. |
© 2020 by the authors. Licensee MDPI, Basel, Switzerland. This article is an open access article distributed under the terms and conditions of the Creative Commons Attribution (CC BY) license (http://creativecommons.org/licenses/by/4.0/).
Share and Cite
MDPI and ACS Style
Wang, X.; Wu, Y.; Cui, J.; Zhu, C.-Q.; Wang, X.-Z. Shape Characteristics of Coral Sand from the South China Sea. J. Mar. Sci. Eng. 2020, 8, 803. https://doi.org/10.3390/jmse8100803
AMA Style
Wang X, Wu Y, Cui J, Zhu C-Q, Wang X-Z. Shape Characteristics of Coral Sand from the South China Sea. Journal of Marine Science and Engineering. 2020; 8(10):803. https://doi.org/10.3390/jmse8100803
Chicago/Turabian StyleWang, Xing, Yang Wu, Jie Cui, Chang-Qi Zhu, and Xin-Zhi Wang. 2020. "Shape Characteristics of Coral Sand from the South China Sea" Journal of Marine Science and Engineering 8, no. 10: 803. https://doi.org/10.3390/jmse8100803
Note that from the first issue of 2016, this journal uses article numbers instead of page numbers. See further details here.