Article

Genetic Risk of Autism Spectrum Disorder in a Pakistani Population

1
Department of Biochemistry, University Institute of Biochemistry and Biotechnology, PMAS Arid Agriculture University, Rawalpindi 46000, Pakistan
2
Department of Genetics, Yale School of Medicine, New Haven, CT 06510, USA
3
Pakistan Institute of Medical Sciences, Islamabad 44000, Pakistan
4
Interdepartmental Neuroscience Program, Yale School of Medicine, New Haven, CT 06510, USA
5
Department of Rheumatology and Inflammation Research, Institute of Medicine, Sahlgrenska Academy, University of Gothenburg, 41346 Gothenburg, Sweden
6
Human Molecular Genetics Laboratory, Health Biotechnology Division, National Institute for Biotechnology and Genetic Engineering (NIBGE), Faisalabad 38000, Pakistan
7
Department of Neuroscience, Yale School of Medicine, New Haven, CT 06510, USA
8
Program in Cellular Neuroscience, Neurodegeneration and Repair, Yale School of Medicine, New Haven, CT 06510, USA
9
Yale Stem Cell Center, Yale School of Medicine, New Haven, CT 06510, USA
*
Authors to whom correspondence should be addressed.
Genes 2020, 11(10), 1206; https://doi.org/10.3390/genes11101206
Submission received: 25 August 2020 / Revised: 29 September 2020 / Accepted: 13 October 2020 / Published: 15 October 2020
(This article belongs to the Special Issue Genetics of Psychiatric Disorders)

Abstract

:
Autism spectrum disorder (ASD) is a group of complex multifactorial neurodevelopmental and neuropsychiatric disorders in children characterized by impairment of communication and social interaction. Several genes with associated single nucleotide polymorphisms (SNPs) have been identified for ASD in different genetic association studies, meta-analyses, and genome-wide association studies (GWAS). However, associations between different SNPs and ASD vary from population to population. Four SNPs in genes CNTNAP2, EIF4E, ATP2B2, CACNA1C, and SNP rs4307059 (which is found between CDH9 and CDH10 genes) have been identified and reported as candidate risk factors for ASD. The aim of the present study was, for the first time, to assess the association of SNPs in these genes with ASD in the Pakistani population. PCR-based genotyping was performed using allele-specific primers in 93 ASD and 93 control Pakistani individuals. All genetic associations, genotype frequencies, and allele frequencies were computed as odds’ ratios (ORs) using logistic regression with a threshold of p ≤ 0.01 to determine statistical significance. We found that the homozygous genotypes of mutant T alleles of CNTNAP2 and ATP2B2 were significantly associated with Pakistani ASD patients in unadjusted ORs (p < 0.01), but their significance score was lost in the adjusted model. Other SNPs such as rs4307059, rs17850950 of EIF4E, and rs1006737 of CACNA1C were not statistically significant. Based on this, we conclude that SNPs are not associated with, or are not the main cause of, autism in the Pakistani population, indicating the involvement of additional players, which need to be investigated in future studies in a large population size. One of the limitations of present study is its small sample size. However, this study, being the first on Pakistani ASD patients, may lay the foundations for future studies in larger samples.

1. Introduction

Autism is a complex group of neurodevelopmental disorders, also referred to as autism spectrum disorder (ASD). The term “spectrum” is used to describe the symptoms involving a wide range of skill impairments in ASD children. Some children display milder impairments while others may present more severe forms of ASD [1,2].
ASD is characterized by deficiencies in three main areas of development, which include defects in nonverbal and verbal communication, social interaction, and the presence of multiple repetitive behaviors with limited or unusual interests [3]. The prevalence of ASD has steadily increased over the last few decades. Initially, in the 1970s, ASD was considered a rare disorder, and its prevalence was estimated to be in around 2 of 10,000 children [4]. Towards the end of the 20th century, ASD prevalence began to change, which in 2006 increased to 116.1 per 10,000 children in the United Kingdom [5]. Several factors may contribute to this increase, such as changes in the use of screening tools and diagnostic methods as well as in the application of different epidemiological methods. Beyond the increased awareness among the general population and healthcare professionals contributing to the increased estimated incidence of ASD, it is also possible that other factors have resulted in an unusual increase in ASD occurrence [6].
According to the most recent estimate in the United States, 1 out of 59 children are affected with ASD [7]. Importantly, differences in the occurrence of ASD among different ethnic populations have been noted. For instance, in South Korea, the estimated prevalence of ASD is 2.64% [8] and in around 12 per 10,000 in China [9]. As discrepancies exist concerning the prevalence of ASD among different populations, it is difficult to compare the estimates of ASD prevalence in different regions. This, in part, may be due to the different methods of case identification [6]. ASD is diagnosed more commonly in males than in females, whereby boys are at a 4- to 7-fold higher risk of developing autism compared to girls; however, the reason behind this is still largely unknown [10]. Currently, ASD diagnosis is based on behavioral parameters by identifying the deviation from a typical behavior pattern, but what is considered typical may vary between different cultures. Hence the variability in the extent of deviation from typical behaviors in ASD can be influenced by cultural norms and values [11,12].
ASD is also reported as a complex genetically heritable disorder with a heritability of approximately 50% [13]. Several genetic factors have been found to contribute to the disease. Chromosomal abnormalities or single-gene mutations have been documented in familial and individual autism cases [14]. However, these defined mutations and de novo copy number variants account for only about 10–20% of ASD cases, leaving a high percentage of ASD cases with unknown genetic causes [15,16]. Besides genetic factors, certain environmental factors are also reported to contribute to ASD. Among them is included in utero exposure of offspring to viral or bacterial infection, which may lead to failures in early fetal brain development [17,18]. In addition, the risk of autism due to prenatal infections is most likely dependent on the individual immune status of the mother and fetus. This was confirmed when a substantial association with ASD was found in the allergies and autoimmune disease of the mother [19]. Since placenta serves as the source of hematopoietic stem cells for the fetus, these maternal infections could change the immune status of the fetal immune system as well as fetal brain development [20].
Genetic architecture of ASD is highly heterogeneous. Several genetic association studies and genome-wide association studies (GWAS) of ASD in different populations have identified a number of genes, SNPs and common genetic variants associated with the risk of ASD [21,22,23]. Among them, genetic marker rs4307059, which lies between cadherin 10 (CDH10) and cadherin 9 (CDH9), and the SNPs in the gene ATP2B2 are the major ASD risk markers because of their associations with ASD in different populations. ATP2B2 encodes plasma membrane calcium-transporting ATPase 2 (PMCA2), which extrudes calcium (Ca2+) from the cytosol into the extracellular space in response to increased cytosolic Ca2+ concentrations [22,24]. ATP2B2 is involved in maintaining intracellular calcium homeostasis, and disrupting this balance leads to seizures in ASD [25]. Several pieces of evidence from biochemical and genetic studies have indicated that altered Ca2+ homeostasis play a key role in the cascade of signaling events leading to ASD. Furthermore, ATP2B2 is expressed mainly in cerebellum, along with cerebral cortex, olfactory bulb, and hippocampal formation [26]. ATP2B2 is located in the human chromosome region 3p25.3. Several studies have linked the region in chromosome 3p25 with ASD [27]. The first evidence of the association between ATP2B2 and ASD was provided by Carayol J, et al. in a family-based association study [28]. Later on, similar results were replicated in another research in Italy [29]. These researches indicated that ATP2B2 might be a susceptible candidate gene for ASD [25]. On the other hand, the strongest GWAS and replicated evidence for association of an SNP rs4307059 on 5p14.1 and ASD has been found [30,31]. Recent GWAS from China has also shown a strong association of rs4307059 with ASD [32]. Of particular note, the chromosomal region containing rs4307059 also contains the transcript for the noncoding antisense RNA of the moesin pseudogene 1 (MSNP1), whose overexpression decreases the neurite length in human cells [33].
Furthermore, in European population GWAS studies, the SNPs in Eukaryotic translation initiation factor 4E (EIF4E) and the Contactin-associated protein-like 2 (CNTNAP2) have been proposed as strong risk candidates for ASD [34,35]. In a eukaryotic translation initiation, EIF4E is the rate-limiting component and plays a key role in memory and in learning through its control of translation within the synapse. Increased activity of EIF4E causes repetitive behaviors in ASD [36,37]. CNTNAP2 is the first widely replicated ASD-predisposition gene with the strongest evidence of ASD susceptibility from several independent studies [38,39]. CNTNAP2 encodes for Contactin Associated Protein-Like 2 (Caspr2), is localized at the juxtaparanodes of myelinated axons, and is thought to be involved in axon differentiation. Caspr2 plays a role as a receptor and cell adhesion molecule in the vertebrate nervous system. The neuronal circuits involved in higher cortical functions are enriched in Caspr2. It plays a major role in language development in ASD and other language-related disorders [40]. Mice lacking CNTNAP2 show similarity to the core deficits of cognitive and behavioral functions and selective dysregulation of connectivity in integrative prefrontal areas that are seen in ASD patients, signifying its vital role in brain development [41].Genetic variants within another gene, CACNA1C, are reported to be linked with psychiatric disorders including ASD, schizophrenia, and bipolar disorder. CACNA1C encodes the α 1C subunit (Cav 1.2) of the L-type voltage-dependent calcium channel and calcium influx through such channels is coupled to signaling pathways that stimulate the expression of genes essential for neuronal survival dendritic development, synaptic plasticity, learning, memory formation, and behavior. Rare mutations in CACNA1C are known to cause cognitive abnormalities in ASD [42,43,44]. On the basis of previous research and heterogeneity between the results of genetic association studies among different populations, the abovementioned five genes have been selected for the present study.
ASD is well studied in Europe and America but is relatively less understood in the Eastern world [6]. To date, most of genetic association studies on ASD have been primarily carried out in North America, Western Europe, and Australasia. Asia represents the largest portion of world’s population with different ethnic backgrounds and genomic heterogeneity. Therefore, there is a need to explore the genetic markers responsible for ASD in Asian populations. So far, most of the ASD-related genetic association studies have been performed on Chinese, Korean, and Indian populations, but there is no genetic association study reported in the Pakistani population as of yet [45,46,47,48]. There is even no reliable data available regarding the prevalence of ASD in Pakistan [49]. However, according to the estimates of the Pakistan Autism Society, about 350,000 children are suffering from ASD in Pakistan [50].
Examining the genetic variants in Pakistani individuals has been challenging, as individuals with psychiatric disorders do not report their disease due to the possibility of social stigma. This results in an under-reporting of the number of individuals in Pakistan with mental illnesses and prevents patients from receiving care by trained professionals. The present study has addressed this gap in our knowledge by examining five common ASD SNPs among a Pakistani cohort for the first time. This study may not only provide an initial step towards the awareness of ASD among parents and society, but also highlights the underlying genetic causes among Pakistani ASD children.

2. Materials and Methods

2.1. Procedure and Participants

This study was approved by the Ethics committee of Pir Mehr Ali Shah Arid Agriculture University Rawalpindi and the Pakistan Institute of Medical Sciences (PIMS) Hospital, Islamabad. Written informed consent was obtained from the parents of 93 patients and 93 healthy controls who participated in this study. Cases were recruited from PIMS hospital Islamabad, Pakistan after a consensus diagnosis made by experienced psychiatrists using a combination of the Autism Diagnosis Observation Schedule (ADOS) and the Diagnostic and Statistical Manual of Mental Disorders 5th edition (DSM-5) as the assessment instruments. Clinical phenotype data was collected by asking questions to the parents of children. Healthy controls were recruited from local communities with a simple non-structured interview performed by psychiatrists. Control subjects with a history of mental health or neurological disease, or first-degree relatives suffering from mental health or neurological disease, were excluded from the present study. Healthy controls were drawn from the same geographical areas as patients and were matched to the patient group based on ethnicity. All participants were unrelated Pakistani nationals born and residing in different areas of Pakistan.

2.2. DNA Extraction and Quantification

Venous blood was collected in Ethylenediaminetetraacetic acid (EDTA) vacutainers from patients and healthy controls. Genomic DNA was extracted by the standard phenol-chloroform method with few modifications in the protocol [51]. Whole blood (750 μL) and equal amount of red blood cell (RBC) lysis solution (0.32 M Sucrose, 10 mM Tris-HCl pH 7.5, 5 mM MgCl2, 0.01% Triton-X) were collected in an Eppendorf tube and incubated at room temperature for five minutes. Then centrifugation was performed at 12,000 revolutions per minute (rpm) for 2 min at 4 °C; 750 μL of RBC lysis solution was added to the pelleted cells after discarding the supernatant. Washing steps were repeated three times until a clear white blood cells (WBC) pellet was obtained. Then, to the pelleted cells, 450 μL of WBC lysis solution (10 mM Tris-HCl pH 7.5, 400 mM NaCl, 2 mM EDTA pH 8.0), 10 μL of 20% sodium dodecyl sulphate (SDS) solution, and 10 μL of Proteinase K (20 mg/μL) were added and incubated overnight at 37 °C. The next day, 300 μL of chloroform-isoamylalcohol solution (24:1) and 300 μL of phenol (pH 7.8) were added to the lysed WBCs and centrifugation was performed at 12,000 rpm for 10 min at 4 °C. The upper aqueous layer was collected in a new clean tube, and 55 μL of 3M sodium acetate solution and 800 μL of chilled isopropanol were added to precipitate the genomic DNA.
The solution was centrifuged for 10 min at 12,000 rpm, the supernatant was discarded, and the pellet of DNA was washed with 250 μL of 70% ethanol. Centrifugation was performed again for 10 min at 12,000 rpm and ethanol was removed by keeping the tubes inverted for 10 min which were then air dried. The DNA pellet was then dissolved in 100 μL of TE (100 mM Tris-HCl pH7.5, 10 mM EDTA pH 8.0) and stored at −20 °C for genotyping. DNA quantification was done using a Nanodrop Spectrophotometer 2000 (Thermo Scientific, Waltham, MA, USA). Each sample was diluted to a final concentration of 10 ng/μL before genotyping.

2.3. Genotyping

Genotyping was conducted on SNPs in the genes ATP2B2, CNTNAP2, CACNA1C, EIF4E and in the rs4307059 marker, which lies between the CDH9 and CDH10 genes at Yale school of medicine, Yale University, Connecticut, USA. IDT oligoanalyzer (IDT Technologies, Coralville, IA, USA) and BatchPrimer 3 (https://wheat.pw.usda.gov/demos/BatchPrimer3/) were used to design allele-specific primers and the primers for Sanger sequencing (Table S1). PCR-based amplification was performed using the reaction mixture with 1× PCR buffer (No. 10342020; Invitrogen, Carlsbad, CA, USA), 1.5 nM of MgCl2, 0.2 mM dNTPs, 0.5 μM primers, 1 unit of Taq DNA polymerase and 20 ng genomic DNA. Amplification was performed with a DNA Engine Peltier Thermal Cycler (Bio-Rad, Hercules, CA, USA) with the following cycling conditions: initial denaturation at 95 °C for 5 min, followed by 30 cycles at 95 °C for 30 s, Tm specific for each primer for 30 s, and 72 °C for 45 s, with a final elongation of 72 °C for 5 min.
Agarose gel (1.5%) was used for running the PCR products. Several randomly selected samples were sent for Sanger sequencing to confirm the specificity of allele-specific primers using allele-flanking primers (Table S1). For sequencing, bands of DNA were cut from the gel followed by DNA extraction using the MinElute gel extraction kit (No. 28604; Qiagen, Hilden, Germany). Finally, the Sanger sequencing was performed at the Keck DNA Sequencing Lab at Yale University, Connecticut, USA and a 4Peaks system was used to visualize electropherograms.

2.4. Genotyping Data Analysis

Difference in age and gender between the cases and control groups was determined by t-test and χ-squared test in Prism v7 (GraphPad, San Diego, CA, USA). Linkage disequilibrium and Hardy Weinberg equilibrium was calculated by Bioconductor’s R package “genetics” and “HardyWeinberg”, respectively. A bonferroni corrected p-value was applied to the Hardy Weinberg p-values and all subsequent statistical tests to account for multiple testing of five different SNPs in the same samples. The nominal p-value calculated in SAS v9.4 (SAS Institute, Cary, NC, USA) that surpassed the 0.01 Bonferroni-corrected p-value was considered significant. This methodology has been employed for GWAS and genetic case-control studies, and has been described in detail in previously published protocol papers [52,53]. The relative risk of SNPs to disease and interaction between gender and each SNP was determined using a multinomial logistic regression model in SAS. Both unadjusted and adjusted p-values, odds ratios (ORs), and 95% confidence intervals (95% CI) were calculated for each SNP. Adjusted models included age and gender as covariates. To identify an additive effect of risk alleles from multiple SNPs, the genetic risk scores analysis was performed. Furthermore, a χ-squared test was performed to check any association of clinical variables with SNP genotypes in SPSS v16 (IBM, Chicago, IL, USA).

2.5. Protein–Protein Interaction Network

The interaction between the selected proteins ATP2B2, CNTNAP2, CACNA1C, and CDH8 and CDH9 spanning the rs4307059 and other proteins related to ASD was explored using STRING version 10.5 [54]. We considered only high confidence protein–protein interactions obtained from experimental, co-expression, co-occurrence, or database sources. STRING analysis also included 20 primary and 20 secondary interactors along with selected proteins. Identification of ASD-linked KEGG pathways (https://www.genome.jp/kegg/) was also conducted.

3. Results

3.1. Patient Characteristics and Minor Allele Fequencies

In the present study, we compared 93 autistic individual cases with an equal number of healthy controls from the Pakistani population by genotyping to assess the association of SNPs in ATP2B2, CNTNAP2, CACNA1C, rs4307059, and EIF4E with the disease risk. The chromosomal position of each SNP is provided in Supplementary Table S2. The average age and gender of patients and controls are listed in Table 1. We found significant differences between the controls and ASD patients in age and gender (p-value < 0.001). These variables were used as covariates in subsequent statistical analysis. All controls passed Hardy-Weinberg equilibrium, and minor allele frequencies in our population were analyzed with globally reported frequencies in Table S2.

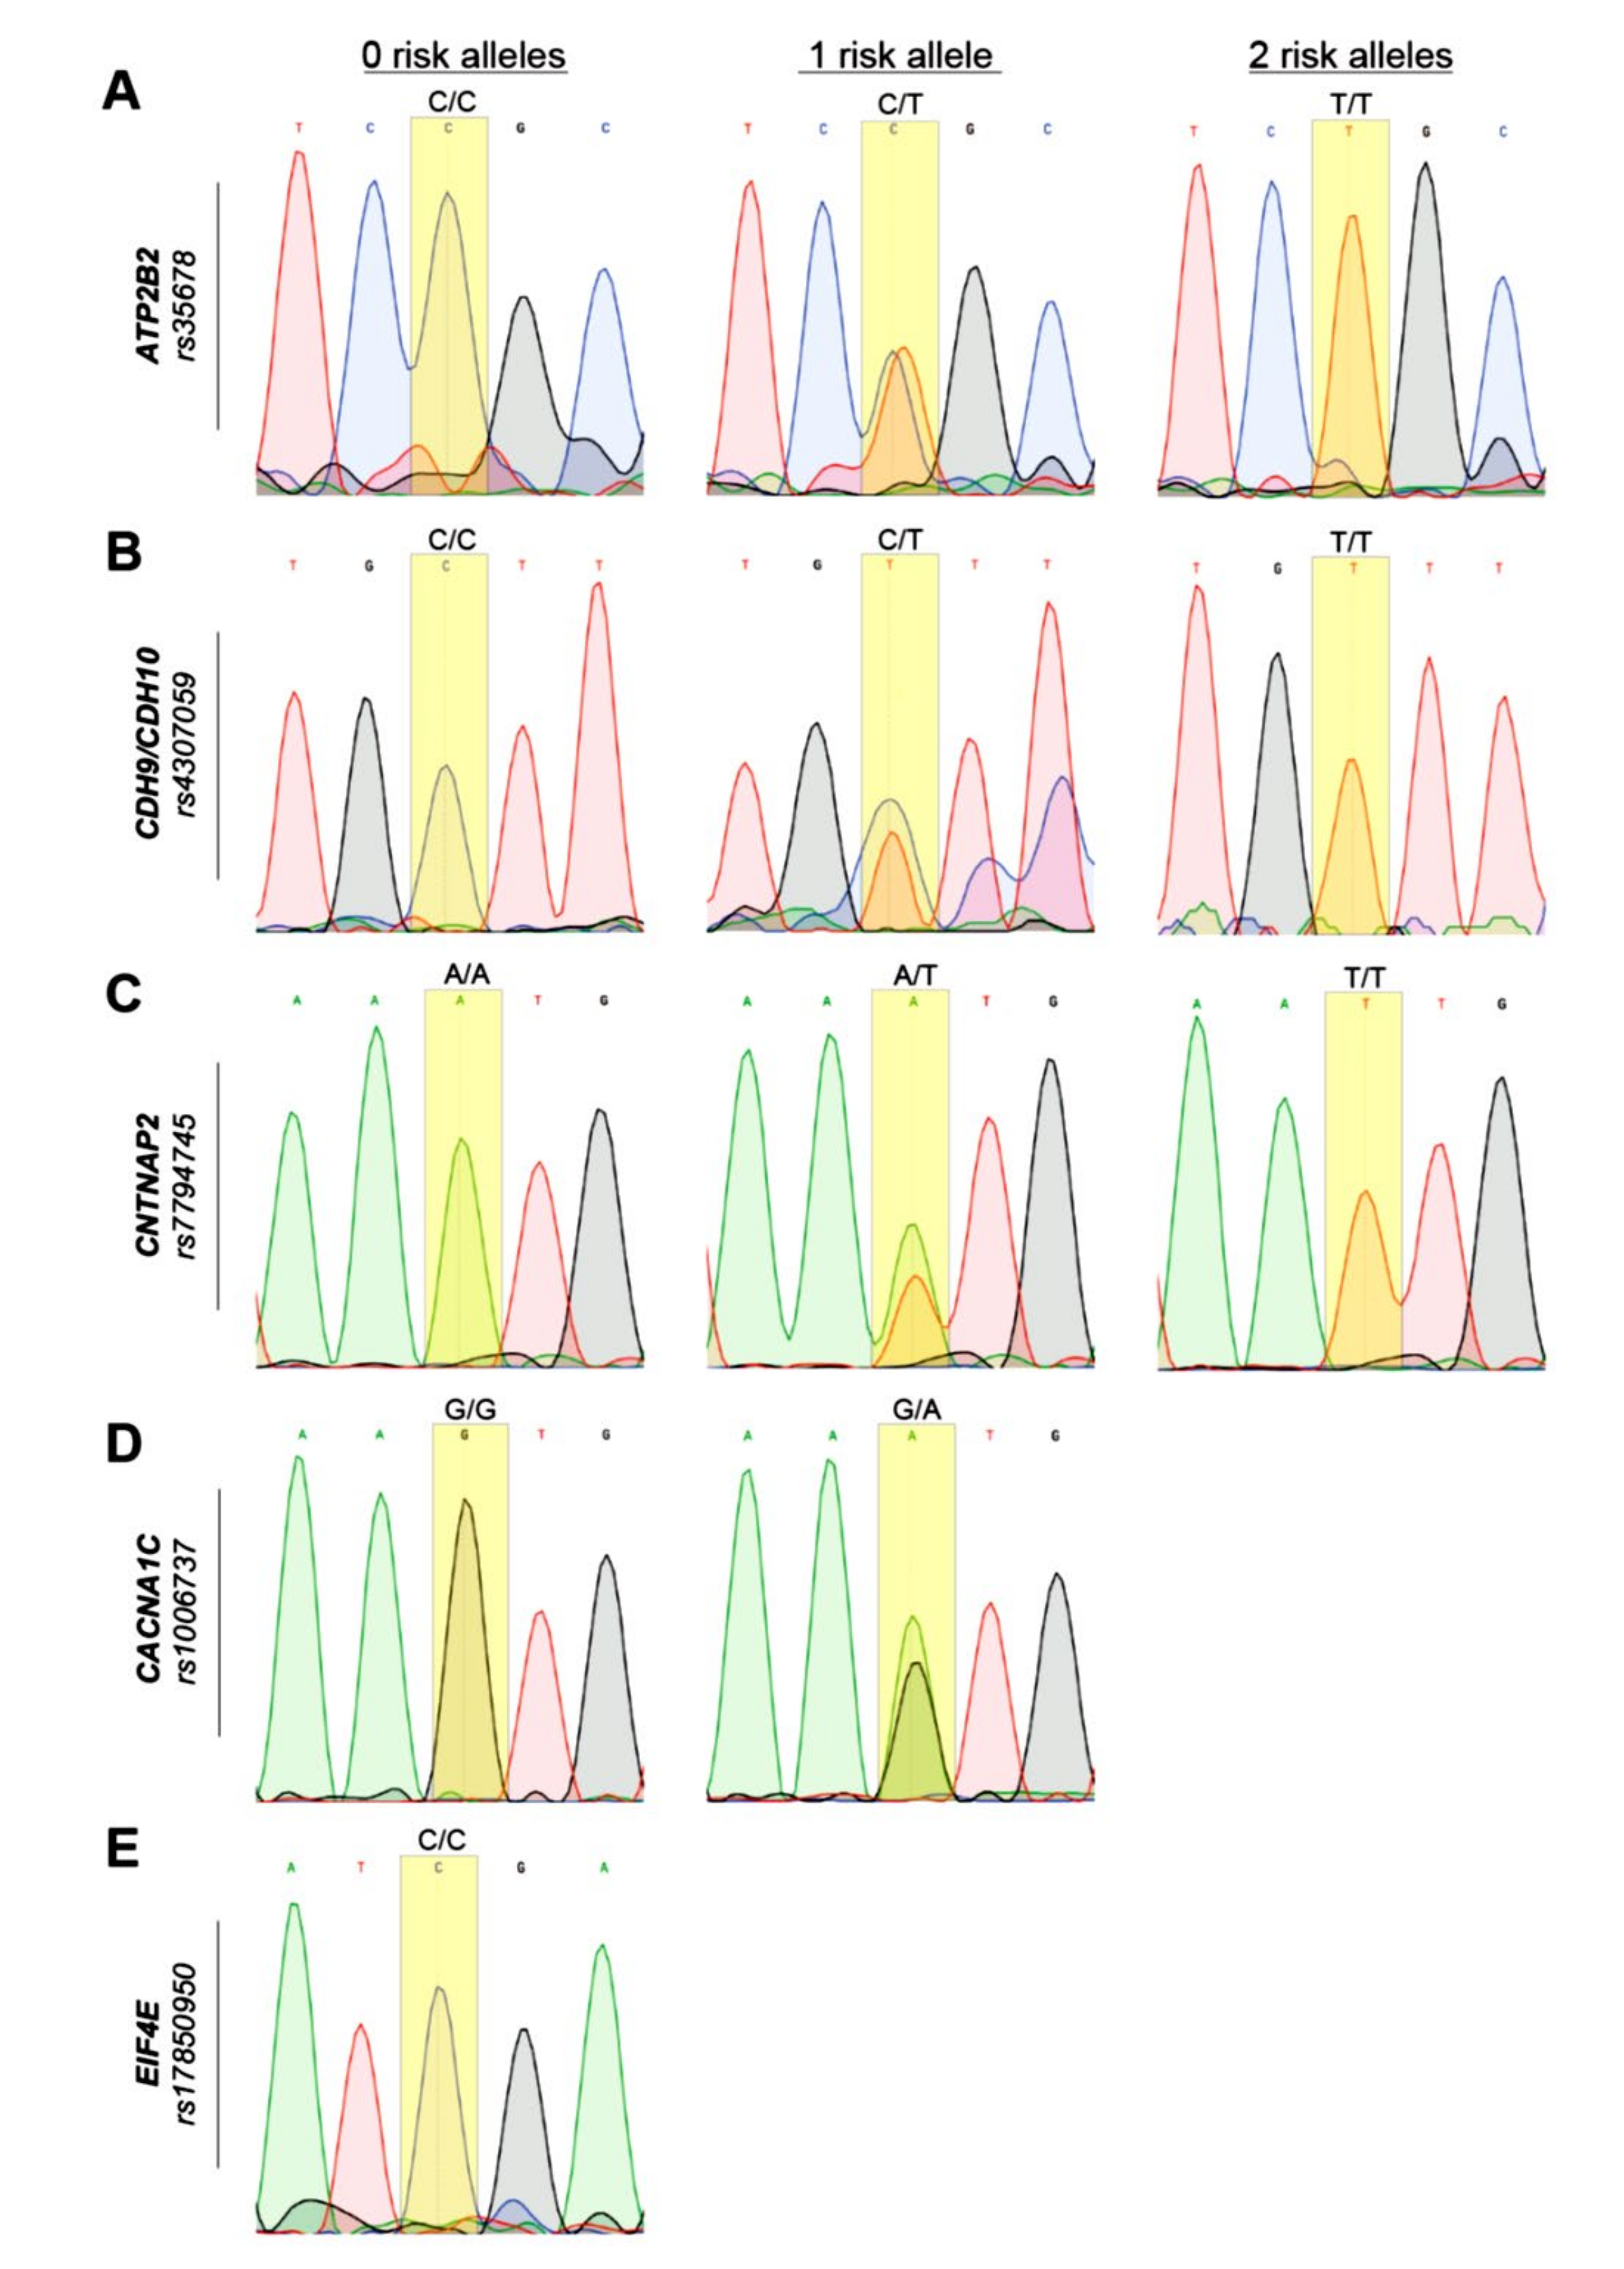
3.2. Genotyping and Sanger Sequencing

Genotyping was conducted on SNPs in the genes ATP2B2, CNTNAP2, CACNA1C, EIF4E, and in the rs4307059 marker, which lies between the CDH9 and CDH10 genes and the specificity of primers was confirmed by Sanger sequencing. The results of Sanger sequencing are shown in Figure 1. Parts A, B, C, D, and E shows sequencing results of ATP2B2/rs35678, Rs4307059, CNTNAP2/rs7794745, CACNA1C/rs1006737, and EIF4E/rs17850950, respectively. The measure of 0 risk refers to the homozygous ancestral genotype, 1 risk refers to the presence of one risk allele in the heterozygous condition and 2 risk refers to the presence of two risk alleles in homozygous condition (Figure 1).

3.3. Comparison of Allele Frequencies of Studied Population with Global Allele Frequencies

In a comparison of minor allele frequencies, the results revealed that minor allele T of ATP2B2 showed a frequency of 0.57 globally, but in the Pakistani population, it showed the relatively higher frequency of 0.65. On the other hand, the minor allele T of CNTNAP2 was found with the frequency of 0.40 in our population as compared to 0.51 observed by other populations. The frequency of a minor allele A of CACNA1C was 0.20 in our population, with a 0.30 globally estimated frequency, while a minor allele T of rs4307059 was also observed to have a difference in frequency of 0.63 in our population as compared to 0.79 reported globally. Minor allele T of rs17850950 of EIF4E showed 0 frequency in our population and globally it also showed the very low frequency of 0.01 (Table S2).

3.4. Association Analysis

It has been observed in genotyping results of rs17850950 of EIF4E that 100% of cases and controls were homozygous for the C allele. We did not find the risk allele T in any homozygous or heterozygous combination among cases or controls (Table 2). For the SNP rs35678 of ATP2B2, 15.1% controls and 3.2% ASD cases were observed as homozygous for the C allele. Observed frequencies of heterozygotes were 50.5% and 51.6% in controls and cases, respectively, while genotypic frequencies of controls and cases were 34.4% and 45.2%, respectively, for the homozygous risk allele genotype (TT). Unadjusted ORs and p-values for heterozygotes were 4.76 and 0.01, respectively, while for the homozygous risk allele genotypes, unadjusted ORs were 6.12 with a p-value of 0.007 (Table 2). After adjusting for age and gender, ORs for heterozygous and homozygous risk allele genotypes were 0.42 and 1.37 with non-significant p-values of 0.52 and 0.81, respectively (Table 2).
For SNP rs7794745 of CNTNAP2, we observed in 40.9% controls and 30.1% autistic cases homozygous for A allele, while 50.5% controls and 48.4% cases were heterozygous. For the homozygous risk allele combination (TT), 8.6% of controls and 21.5% of cases were observed. The homozygous genotype showed unadjusted OR of 3.39 (unadjusted p-value 0.01, Table 2), while the adjusted OR was 2.98 (p-adj. 0.83). In rs1006737 of CACNA1C, 62.4% of controls were homozygous for the G allele as compared to 55.9% cases, while 37.6% controls and 44.1% cases were heterozygotes (GA), carrying a single copy of the risk allele A. The observed unadjusted OR for the heterozygous genotype was 1.3 (p-value 0.37); however, the adjusted OR was 1.41 with a p-value of 0.58 (Table 2).
For the SNP rs4307059, we found 50.5% of controls as compared to 48.4% of cases with one risk allele T in the heterozygous genotype CT. In the homozygous risk allele combination TT, 36.6% of controls as compared to 40.9% of cases were observed. Both genotypes showed unadjusted ORs of 1.14 and 1.34 with p-values of 0.77 and 0.54, respectively. After adjusting the p-value with age and gender, ORs were 0.26 (p-value 0.319) and 0.05 (p-value 0.05), respectively.
In terms of minor allele frequencies and their association with ASD, our results indicated that the minor allele T of ATP2B2 and T of CNTNAP2 were found with unadjusted and adjusted odds of 1.04 (p-value 0.88), 0.29 (p-value 0.11) and 1.68 (p-value 0.01), 0.86 (p-value 0.79), respectively. Minor alleles A of CACNA1C and T of rs4307059 showed unadjusted ORs of 1.21 (p-value 0.44) and 1.16 (p-value 0.5) respectively; however, adjusted ORs were 1.21 (p-value 0.44) and 0.72 (p-value 0.61), respectively (Table 3). Interaction of gender and SNPs also revealed non-significant p-values (Table S3).

3.5. Risk Score Analysis

In a risk score analysis, no individual was found with a 0 risk allele and therefore, 1 risk allele was taken as a reference. The presence of 2 risk alleles was found with an adjusted OR of 2.17 (p-value 0.77) (Table 4). Similarly, the presence of 3 and 4 risk alleles was found with ORs of 3.53 (p 0.63) and 3.16 (p-value 0.66), respectively. Presence of 5 and more than 5 risk alleles together showed an OR of 2.11 and p-value 0.78.

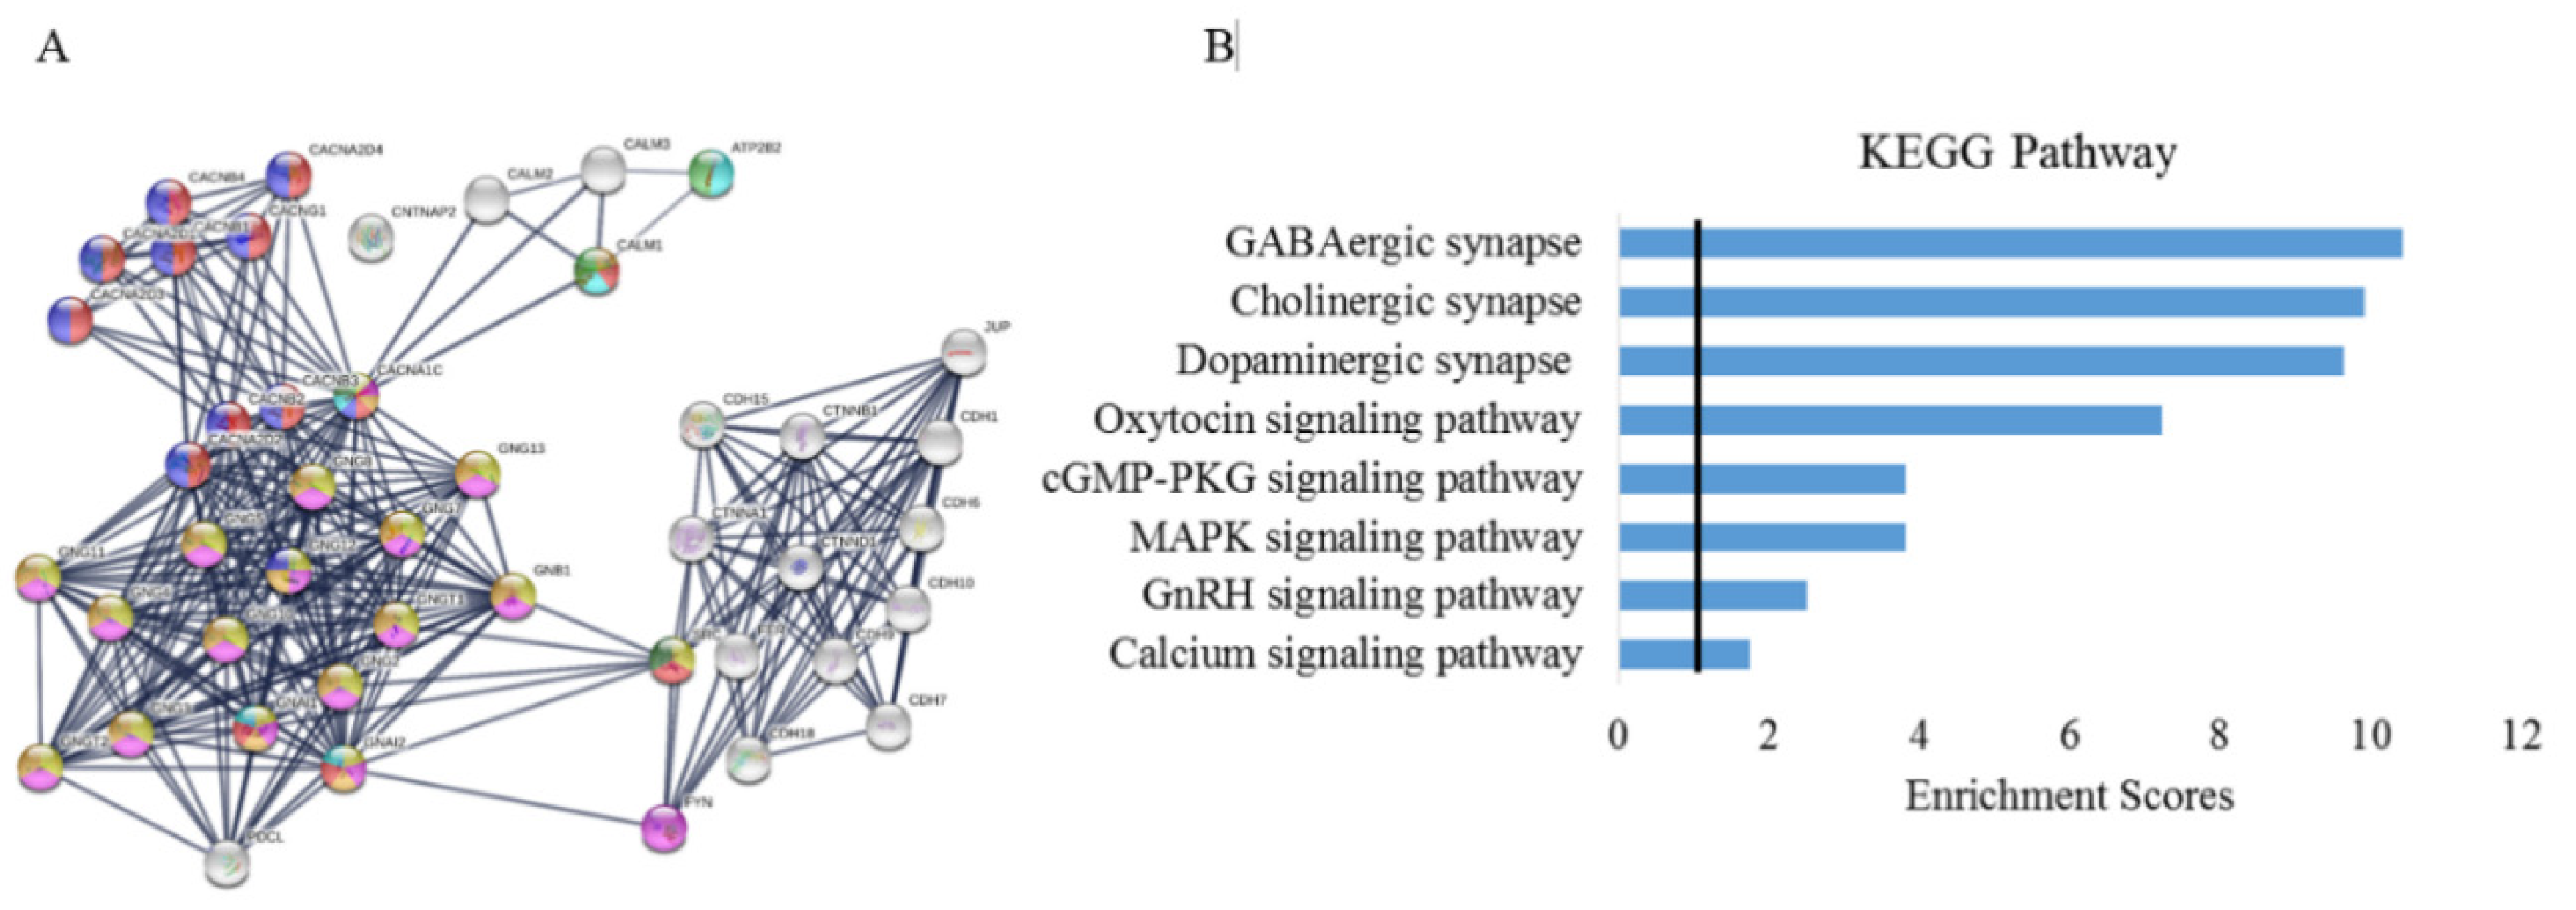
3.6. Protein–Protein Interactions and Pathway Analysis

The STRING analysis to evaluate the interaction of ATP2B2, CNTNAP2, CACNA1C, CDH9, and CDH10 directly or through their primary or secondary partners indicated that they do not interact directly but through primary or secondary interactors at a high confidence except for CNTNAP2, which interacts neither directly nor through any interactors (Figure 2A). Proteins with their interacting partners are shown in Table S4.
Some of the predicted functional partners were identified which include proteins involved in calcium channels (CACNA2D2, CACNA2D3, CACNB2, CACNB3, CACNB1, CACNB4), calcium-dependent cell adhesion proteins (CDH6, CDH7, CDH15, CDH18), and G-protein (GNB1) (Figure 2A, Table S5). Furthermore, some of the identified KEGG pathways by enrichment analysis were found to be associated with the oxytocin signaling pathway, MAPK signaling pathway, calcium signaling pathway, GABAergic synapse, GnRH signaling pathway, Cholinergic synapse, and the cGMP-PKG signaling pathway (Figure 2B).

3.7. Association between SNPs and Autistic-Like Traits

The association between 21 clinical variables of ASD was estimated with selected SNPs and our results indicated that rs35678 of ATP2B2 was found to be associated with olfactory symptoms and poor/limited understanding, with a p-value of 0.04 and 0.02, respectively (Table 5). rs7794745 of CNTNAP2 was associated with a lack of self-care skills and aggressive behavior, with a p-value of 0.03 and 0.009, respectively.rs1006737 of CACNA1C was found to be associated with aggressive behavior with a p-value of 0.01, while rs4307059 was associated with unusual noise-producing behavior and poor/limited understanding with p-values of 0.04 and 0.03, respectively. All of these associations become statistically non-significant after Bonferroni correction, except for aggressive behavior association with CNTNAP2 and CACNA1C, with p-values of 0.009 and 0.01, respectively (Table 5).

4. Discussion

ASD is a form of complex and severe developmental disorder, with strong genetic foundations [13]. In this present study, we investigated the association between EIF4E, ATP2B2, CNTNAP2, CACNA1C, and Rs4307059 polymorphisms and ASD in the Pakistani population. Comparing the minor allele frequencies of studied SNPs in our population with globally reported allele frequencies showed the differences indicating genetic heterogeneity in different ethnicities.
The genotyping results of our research indicated that EIF4E did not show any type of association; however, previous genome-wide linkage studies in ASD patients have linked the region containing the EIF4E locus on chromosome 4q with ASD as a regulation of EIF4E activity is known to play a key role in learning and memory through its control of translation within the synapse [55,56,57,58]. In our study, we did not find even a single individual showing minor allele T, which may be due to the fact that this minor allele was found in very low frequency, i.e., 0.01, even in other worldwide populations (1000 Genome).
Previous studies showed a significant association of SNP rs4307059, which is found between the CDH9 and CDH10 gene with ASD [22,59], however no association with ASD was found in the present study as both unadjusted and adjusted p-values were non-significant. These results are inconsistent with a previous study on the Italian population, which showed a significant association of rs4307059 with ASD [29]. Various independent GWAS done by using individuals from European and Caucasian ancestry, which reported rs4307059 as a novel ASD associated region [30,60]. Similar results were observed for CACNA1C in the present study, although several other independent studies reported the involvement and the association of the specific SNP rs1006737 in CACNA1C with psychiatric disorders in European, Danish, and Spanish populations [61,62,63]. However, in our study, we did not find any association of risk allele A of rs1006737 of CACNA1C with ASD. Consistent results with the present study were also reported in the Chinese Han population in which rs1003767 was not associated with ASD risk [64]. Allelic expression imbalance was also found for this SNP as no homozygotes for risk alleles (AA) were found among cases and controls.
In the case of SNP rs35678 of ATP2B2, an obvious difference between genotypic frequencies of controls (34.4%) and cases (45.2%) for homozygous risk allele genotype (TT) was observed and unadjusted p-values were significant for both heterozygous and homozygous risk allele genotypes, but after adjusting for age and gender, it was no longer statistically significant. Similar results were observed in terms of SNP rs7794745 of CNTNAP2, when for the homozygous risk allele combination (TT), a significant difference between genotypic frequencies of controls (8.6%) and cases (21.5%) were observed. The homozygous genotype was found to be significantly associated with disease with odds of 3.39 (unadjusted p 0.01) but this association did not remain significant after adjusting with covariates (p-adj. 0.83). Likewise, in terms of allele frequencies and their association with ASD, only risk allele T of CNTNAP2 was found to be significantly associated in the unadjusted model, but remained no longer significant in the adjusted model. This lost significance in most of the SNPs may be due to the unequal numbers of male and female patients, as well as the large difference between ages of controls and cases (Table 1). However, if we looked upon the interaction of gender with SNPs, as almost 73% of individuals who participated in this study were male, no significant interaction between any of the four SNPs and gender was observed (Table S3), indicating that gender had no effect on the association between any SNP and disease.
Although risk alleles of both ATP2B2 and CNTNAP2 did not show a significant association with ASD in adjusted models, we found a trend of association of studied SNPs with some behavioral phenotypes of ASD. ATP2B2 showed a trend of association towards a limited understanding and sensory behavior although later on, after Bonferroni correction, significance was lost but this trend of association was strengthened by previous findings, which showed plasma membrane calcium-transporting ATPase 2 (PMCA2) encoded by ATP2B2 are expressed in brain and sensory systems at a particularly high level and in the developing human brain. Similarly, CNTNAP2 was found to be associated with a lack of self-care skills and with aggressive behavior. Significant association of CNTNAP2 and aggressive behavior persisted even after Bonferroni correction.
Additionally, messenger RNA (mRNA) of CNTNAP2 is reported to be significantly enriched in the temporal and frontal lobes, as well as in the frontal cortex and in striatal circuits of the adult brain [65]. These regions support speech, language learning, and other forms of implicit learning, further strengthening a role of CNTNAP2 in cognition and language, which are the major affected areas in ASD [66,67]. CACNA1C has previously been implicated to be involved in anxiety, cognition, fear conditioning, and depressive phenotypes [68,69]. We also found a significant association of CACNA1C with aggressive behavior, with a p-value of 0.01.
In polygenic risk score analysis, no combined risk effect of studied SNPs was observed in our study, which is also obvious from STRING analysis, as none of the protein interact directly with each other and also no primary or secondary interacting protein was found to be previously reported in ASD. However, several KEGG pathways were found to be reported early in the case of ASD like oxytocin (OXT), calcium signaling pathways, and GABAergic function. In the hypothalamus, OXT is the biological basis of trust, social recognition, and bonding. It plays major roles in the modulation of social behaviors with a focus on social bonding, recognition, and communication [70]. Calcium signaling pathway disturbance may contribute greatly to the underlying molecular mechanism of ASD [71,72,73]. Furthermore, the characteristic ASD phenotype is often associated with either a loss or a gain of the GABAergic function. Dysfunction of GABAergic signaling mediates ASD-like stereotypes in the majority of animal models of ASD [74]. GABA-mediated calcium signaling regulates a variety of developmental processes from cell proliferation, and therefore it is not unanticipated that some forms of neuro-developmental disorders including ASD showed alterations of GABAergic signaling and impairment of the excitatory/inhibitory balance in selective neuronal circuits [75]. In the brain of ASD patients, insulin-signaling pathways and pathological involvement of cholinergic nuclei and altered expression of acetylcholine receptors, particularly nicotinic acetylcholine receptors, have also been reported [76,77,78,79].
The present study has some limitations, which include the small sample size, as well as the significant difference between age and gender between cases and controls (Table 1). Lack of awareness and misconceptions about psychiatric disorders among the Pakistani population pose a problem to correctly diagnosing and collecting blood/DNA samples for genetic testing. In recognition of these limitations, appropriate statistical analyses accounting for gender and age as covariates were conducted to ensure that there was no effect on statistical results. However, despite these limitations, this study may serve as an initial step to set the foundation for future studies utilizing larger samples from the Pakistani population.

5. Conclusions

The present study provided some trend of association of studied SNPs to the etiology of ASD in the Pakistani population. Homozygous risk allele genotypes of ATP2B2 and CNTNAP2 were strongly associated with ASD in unadjusted models. In terms of risk allele association, risk allele T of CNTNAP2 was significantly associated with ASD in an unadjusted model. Significance was lost in the adjusted model, which may be due to the difference in ages of cases and controls. All studied SNPs also showed some trend of association with clinical phenotypes of ASD, whereas CNTNAP2 and CACNA1C showed a significant association with the aggressive behavior of ASD patients. This study will serve as an initial study of the Pakistani population and further association studies in larger samples and functional research are needed.

Supplementary Materials

The following are available online at https://www.mdpi.com/2073-4425/11/10/1206/s1, Table S1: List of Primers used for genotyping and Sanger sequencing, Table S2: Genes/SNPs ID and their position on chromosomes. Minor allele frequency in studied population and in other worldwide populations, Table S3: Interaction of studied SNPs with Gender, Table S4: Proteins at node 1 and their interacting partners at node 2, Table S5: Gene annotation and Ensemble IDs of Nodes.

Author Contributions

Conceptualization, M.K., J.L. and G.K.R.; methodology, M.K., T.M.D. and L.T.; software, M.K., T.M.D. and P.J.L.; validation, J.L. and G.K.R.; formal analysis, M.K., T.M.D. and P.J.L.; investigation, M.K., H.R., T.M.D. and L.T.; resources, H.R., M.N., J.L. and G.K.R.; data curation, M.K. and H.R.; writing—original draft preparation, M.K.; writing—review and editing, M.K., M.N., T.M.D., P.J.L., L.T., S.M.B., A.S., J.L. and G.K.R.; visualization, M.K. and M.N.; supervision, J.L. and G.K.R.; project administration, M.K., J.L., and G.K.R.; funding acquisition, M.N., J.L. and G.K.R. All authors have read and agreed to the published version of the manuscript.

Funding

This work was supported by grants from the Higher Education Commission of Pakistan (to M.K.), the National Institute of Mental Health grant R21 MH119803 (to J.L.), and the National Institute of Neurological Disorders and Stroke grants R01 NS083706 and R01 NS088321 (to J.L.).

Acknowledgments

We thank the PIMS hospital Islamabad for their cooperation in sample collection. This work was supported by grants from the Higher Education Commission of Pakistan (to M.K.), the National Institute of Mental Health grant R21 MH119803 (to J.L.), and the National Institute of Neurological Disorders and Stroke grants R01 NS083706 and R01 NS088321 (to J.L.). M.N. acknowledges Adlerbertska Forskningsstiftelsen Research Foundation (09/2019), Sweden, and Stiftelsen Längmanska Kulturfonden (BA18-0708) (Stockholm), Sweden.

Conflicts of Interest

The authors declare no conflict of interest. The funders had no role in the design of the study; in the collection, analyses, or interpretation of data; in the writing of the manuscript, or in the decision to publish the results.

Abbreviations

ASDAutism spectrum disorder
SNPSingle nucleotide polymorphisms
GWASGenome wide association studies
OROdds’ ratio
CNTNAP2Contactin Association Protein-like 2
CACNA1CL-type voltage-dependent calcium channel
PCRPolymerase chain reaction
DSMDiagnostic and Statistical Manual
ADOSAutism Diagnosis Observation Schedule
RBCRed blood cells
WBCWhite blood cells
KEGGKyoto encyclopedia of genes and genomes

References

  1. Strock, M. Autism spectrum disorders (pervasive developmental disorders). Natl. Inst. Ment. Health 2007, 41. [Google Scholar] [CrossRef] [Green Version]
  2. Robert, C.; Pasquier, L.; Cohen, D.; Fradin, M.; Canitano, R.; Damaj, L.; Odent, S.; Tordjman, S. Role of genetics in the etiology of autistic spectrum disorder: Towards a hierarchical diagnostic strategy. Int. J. Mol. Sci. 2017, 18, 618. [Google Scholar] [CrossRef] [Green Version]
  3. AlSalehi, S.M.; Alhifthy, E.H. Autism Spectrum Disorder. In Clinical Child Neurology; Springer International Publishing: Cham, Switzerland, 2020. [Google Scholar] [CrossRef]
  4. Kawamura, Y.; Takahashi, O.; Ishii, T. Reevaluating the incidence of pervasive developmental disorders: Impact of elevated rates of detection through implementation of an integrated system of screening in Toyota, Japan. Psychiatry Clin. Neurosci. 2008, 62, 152–159. [Google Scholar] [CrossRef]
  5. Baird, G.; Simonoff, E.; Pickles, A.; Chandler, S.; Loucas, T.; Meldrum, D.; Charman, T. Prevalence of disorders of the autism spectrum in a population cohort of children in South Thames: The Special Needs and Autism Project (SNAP). Lancet 2006, 368, 210–215. [Google Scholar] [CrossRef]
  6. Sun, X.; Allison, C.; Auyeung, B.; Zhang, Z.; Matthews, F.E.; Baron-Cohen, S.; Brayne, C. Validation of existing diagnosis of autism in mainland China using standardised diagnostic instruments. Autism 2015, 19, 1010–1017. [Google Scholar] [CrossRef] [Green Version]
  7. Baio, J.; Wiggins, L.; Christensen, D.L.; Maenner, M.J.; Daniels, J.; Warren, Z.; Kurzius-Spencer, M.; Zahorodny, W.; Rosenberg, C.R.; White, T.; et al. Prevalence of Autism spectrum disorder among children aged 8 Years—Autism and developmental disabilities monitoring network, 11 Sites, United States 2014. MMWR Surveill. Summ. 2018. [Google Scholar] [CrossRef]
  8. Kim, Y.S.; Leventhal, B.L.; Koh, Y.-J.; Fombonne, E.; Laska, E.; Lim, E.-C.; Cheon, K.-A.; Kim, S.-J.; Kim, Y.-K.; Lee, H.; et al. Prevalence of Autism spectrum disorders in a total population sample. Am. J. Psychiatry 2011, 168, 904–912. [Google Scholar] [CrossRef] [Green Version]
  9. Sun, X.; Allison, C.; Matthews, F.E.; Sharp, S.J.; Auyeung, B.; Baron-Cohen, S.; Brayne, C. Prevalence of Autism in mainland China, Hong Kong and Taiwan: A systematic review and meta-analysis. Mol. Autism 2013, 4, 7. [Google Scholar] [CrossRef] [PubMed] [Green Version]
  10. Werling, D.M.; Geschwind, D.H. Understanding sex bias in Autism spectrum disorder. Curr. Opin. Neurol. 2013, 26, 146–153. [Google Scholar] [CrossRef] [Green Version]
  11. Mandell, D.S.; Novak, M.M.; Zubritsky, C.D. Spectrum disorders factors associated with age of diagnosis among children with Autism factors associated with age of diagnosis among children with Autism spectrum disorders. Pediatrics 2005, 116, 1480–1486. [Google Scholar] [CrossRef] [Green Version]
  12. Norbury, C.F.; Sparks, A. Difference or disorder? Cultural issues in understanding neurodevelopmental disorders. Dev. Psychol. 2013, 49, 45–58. [Google Scholar] [CrossRef] [PubMed] [Green Version]
  13. Sandin, S.; Lichtenstein, P.; Kuja-Halkola, R.; Hultman, C.; Larsson, H.; Reichenberg, A. The heritability of Autism spectrum disorder. JAMA J. Am. Med. Assoc. 2017, 318, 1182–1184. [Google Scholar] [CrossRef] [PubMed]
  14. Veenstra-Vanderweele, J.; Christian, S.L.; Cook, E.H., Jr. Autism as a paradigmatic complex genetic disorder. Annu. Rev. Genomics Hum. Genet. 2004, 5, 379–405. [Google Scholar] [CrossRef] [Green Version]
  15. Zoghbi, H.Y.; Bear, M.F. Synaptic dysfunction in neurodevelopmental disorders associated with Autism and Intellectual Disabilities. Cold Spring Harb. Perspect. Biol. 2012, 4, 1–22. [Google Scholar] [CrossRef] [Green Version]
  16. Geschwind, D.H.; Levitt, P. Autism spectrum disorders: Developmental disconnection syndromes. Curr. Opin. Neurobiol. 2007, 17, 103–111. [Google Scholar] [CrossRef]
  17. Arndt, T.L.; Stodgell, C.J.; Rodier, P.M. The teratology of autism. Int. J. Dev. Neurosci. 2005, 23, 189–199. [Google Scholar] [CrossRef]
  18. Libbey, J.E.; Sweeten, T.L.; McMahon, W.M.; Fujinami, R.S. Autistic disorder and viral infections. J. NeuroVirol. 2005, 11, 1–10. [Google Scholar] [CrossRef]
  19. Lloyd-Fox, S.; Blasi, A.; Elwell, C.E.; Charman, T.; Murphy, D.; Johnson, M.H. Reduced neural sensitivity to social stimuli in infants at risk for Autism. Proc. R. Soc. B Biol. Sci. 2013, 280, 20123026. [Google Scholar] [CrossRef] [Green Version]
  20. Gekas, C.; Dieterlen-Lièvre, F.; Orkin, S.H.; Mikkola, H.K.A. The placenta is a niche for hematopoietic stem cells. Dev. Cell 2005, 8, 365–375. [Google Scholar] [CrossRef] [Green Version]
  21. Grove, J.; Ripke, S.; Als, T.D.; Mattheisen, M.; Walters, R.K.; Won, H.; Pallesen, J.; Agerbo, E.; Andreassen, O.A.; Anney, R.; et al. Identification of common genetic risk variants for Autism spectrum disorder. Nat. Genet. 2019, 51, 431–444. [Google Scholar] [CrossRef] [PubMed] [Green Version]
  22. Alonso-Gonzalez, A.; Calaza, M.; Rodriguez-Fontenla, C.; Carracedo, A. Novel gene-based analysis of ASD GWAS: Insight into the biological role of associated genes. Front. Genet. 2019, 10, 733. [Google Scholar] [CrossRef] [Green Version]
  23. The Autism Spectrum Disorders Working Group of The Psychiatric Genomics Consortium. Meta-analysis of GWAS of over 16,000 individuals with Autism spectrum disorder highlights a novel locus at 10q24.32 and a significant overlap with Schizophrenia. Mol. Autism 2017, 8, 1–17. [Google Scholar] [CrossRef]
  24. Daghsni, M.; Rima, M.; Fajloun, Z.; Ronjat, M.; Brusés, J.L.; M’rad, R.; De Waard, M. Autism throughout genetics: Perusal of the implication of ion channels. Brain Behav. 2018, 8, e00978. [Google Scholar] [CrossRef]
  25. Yang, W.; Liu, J.; Zheng, F.; Jia, M.; Zhao, L.; Lu, T.; Ruan, Y.; Zhang, J.; Yue, W.; Zhang, D.; et al. The evidence for association of ATP2B2 polymorphisms with Autism in Chinese Han population. PLoS ONE 2013, 8, e61021. [Google Scholar] [CrossRef] [Green Version]
  26. Minich, R.R.; Li, J.; Tempel, B.L. Early growth response protein 1 regulates promoter activity of α-plasma membrane calcium ATPase 2, a major calcium pump in the brain and auditory system. BMC Mol. Biol. 2017, 18, 14. [Google Scholar] [CrossRef] [Green Version]
  27. Takata, A.; Miyake, N.; Tsurusaki, Y.; Fukai, R.; Miyatake, S.; Koshimizu, E.; Kushima, I.; Okada, T.; Morikawa, M.; Uno, Y.; et al. Integrative analyses of de novo mutations provide deeper biological insights into Autism spectrum disorder. Cell Rep. 2018, 22, 734–747. [Google Scholar] [CrossRef] [Green Version]
  28. Carayol, J.; Sacco, R.; Tores, F.; Rousseau, F.; Lewin, P.; Hager, J.; Persico, A.M. Converging evidence for an association of ATP2B2 allelic variants with Autism in male subjects. Biol. Psychiatry 2011, 70, 880–887. [Google Scholar] [CrossRef]
  29. Prandini, P.; Pasquali, A.; Malerba, G.; Marostica, A.; Zusi, C.; Xumerle, L.; Muglia, P.; Da Ros, L.; Ratti, E.; Trabetti, E.; et al. The association of Rs4307059 and Rs35678 markers with Autism spectrum disorders is replicated in Italian families. Psychiatr. Genet. 2012, 22, 177–181. [Google Scholar] [CrossRef]
  30. Wang, K.; Zhang, H.; Ma, D.; Bucan, M.; Glessner, J.T.; Abrahams, B.S.; Salyakina, D.; Imielinski, M.; Bradfield, J.P.; Sleiman, P.M.A.; et al. Common genetic variants on 5p14.1 associate with Autism spectrum disorders. Nature 2009, 459, 528–533. [Google Scholar] [CrossRef]
  31. Glessner, J.T.; Wang, K.; Cai, G.; Korvatska, O.; Kim, C.E.; Wood, S.; Zhang, H.; Estes, A.; Brune, C.W.; Bradfield, J.P.; et al. Autism genome-wide copy number variation reveals ubiquitin and neuronal genes. Nature 2009, 459, 569–573. [Google Scholar] [CrossRef]
  32. Wang, Z.; Zhang, J.; Lu, T.; Zhang, T.; Jia, M.; Ruan, Y.; Zhang, D.; Li, J.; Wang, L. Replication of previous GWAS hits suggests the association between Rs4307059 near MSNP1AS and Autism in a Chinese Han population. Prog. Neuro Psychopharmacol. Biol. Psychiatry 2019, 92, 194–198. [Google Scholar] [CrossRef]
  33. De Witt, J.J.; Grepo, N.; Wilkinson, B.; Evgrafov, O.V.; Knowles, J.A.; Campbell, D.B. Impact of the Autism-associated long noncoding RNA MSNP1AS on neuronal architecture and gene expression in human neural progenitor cells. Genes 2016, 7, 76. [Google Scholar] [CrossRef] [PubMed]
  34. Canali, G.; Goutebroze, L. CNTNAP2 heterozygous missense variants: Risk factors for Autism spectrum disorder and/or other pathologies? J. Exp. Neurosci. 2018, 12, 1179069518809666. [Google Scholar] [CrossRef] [PubMed] [Green Version]
  35. Wiebe, S.; Nagpal, A.; Truong, V.T.; Park, J.; Skalecka, A.; He, A.J.; Gamache, K.; Khoutorsky, A.; Gantois, I.; Sonenberg, N. Inhibitory interneurons mediate autism-associated behaviors via 4E-BP2. Proc. Natl. Acad. Sci. USA 2019, 116, 18060–18067. [Google Scholar] [CrossRef] [PubMed] [Green Version]
  36. Chang, Y.C.; Cole, T.B.; Costa, L.G. Behavioral phenotyping for Autism spectrum disorders in mice. Curr. Protoc. Toxicol. 2017, 72, 11–22. [Google Scholar] [CrossRef] [PubMed] [Green Version]
  37. Xu, Z.X.; Kim, G.H.; Tan, J.W.; Riso, A.E.; Sun, Y.; Xu, E.Y.; Liao, G.Y.; Xu, H.; Lee, S.H.; Do, N.Y.; et al. Elevated protein synthesis in microglia causes Autism-like synaptic and behavioral aberrations. Nat. Commun. 2020, 11, 1–17. [Google Scholar] [CrossRef]
  38. Zare, S.; Mashayekhi, F.; Bidabadi, E. The association of CNTNAP2 Rs7794745 gene polymorphism and Autism in Iranian population. J. Clin. Neurosci. 2017, 39, 189–192. [Google Scholar] [CrossRef]
  39. Beiranvandi, F.; Akouchekian, M.; Javadi, G.R.; Darvish, H. The association of CNTNAP2 Rs2710102 and ENGRAILED-2 Rs1861972 genes polymorphism and autism in Iranian population. Meta Gene 2020, 24, 100664. [Google Scholar] [CrossRef]
  40. Canali, G.; Garcia, M.; Hivert, B.; Pinatel, D.; Goullancourt, A.; Oguievetskaia, K.; Saint-Martin, M.; Girault, J.A.; Faivre-Sarrailh, C.; Goutebroze, L. Genetic variants in autism-related CNTNAP2 impair axonal growth of cortical neurons. Hum. Mol. Genet. 2018, 11, 1941–1954. [Google Scholar] [CrossRef] [Green Version]
  41. Liska, A.; Bertero, A.; Gomolka, R.; Sabbioni, M.; Galbusera, A.; Barsotti, N.; Panzeri, S.; Scattoni, M.L.; Pasqualetti, M.; Gozzi, A. Homozygous loss of Autism-risk gene CNTNAP2 results in reduced local and long-range prefrontal functional connectivity. Cereb. Cortex 2018, 28, 1141–1153. [Google Scholar] [CrossRef]
  42. Wei, Q.; Li, M.; Kang, Z.; Li, L.; Diao, F.; Zhang, R.; Wang, J.; Zheng, L.; Wen, X.; Zhang, J.; et al. ZNF804A Rs1344706 is associated with cortical thickness, surface area, and cortical volume of the unmedicated first episode Schizophrenia and healthy controls. Am. J. Med. Genet. Part B Neuropsychiatr. Genet. 2015, 168, 265–273. [Google Scholar] [CrossRef] [PubMed]
  43. Buddell, T.; Friedman, V.; Drozd, C.J.; Quinn, C.C. An Autism-causing calcium channel variant functions with selective autophagy to alter axon targeting and behavior. PLoS Genet. 2019, 12, e1008488. [Google Scholar] [CrossRef] [Green Version]
  44. Liao, X.; Liao, X.; Li, Y. Genetic associations between voltage-gated calcium channels and Autism spectrum disorder: A systematic review. Mol. Brain 2020, 13, 1–10. [Google Scholar] [CrossRef]
  45. Chien, Y.L.; Wu, Y.Y.; Chiu, Y.N.; Liu, S.K.; Tsai, W.C.; Lin, P.I.; Chen, C.H.; Gau, S.S.F.; Chien, W.H. Association study of the CNS patterning genes and Autism in Han Chinese in Taiwan. Prog. Neuro Psychopharmacol. Biol. Psychiatry 2011, 35, 1512–1517. [Google Scholar] [CrossRef]
  46. Yoo, H.J.; Cho, I.H.; Park, M.; Yang, S.Y.; Kim, S.A. Family based association of GRIN2A and GRIN2B with Korean Autism spectrum disorders. Neurosci. Lett. 2012, 512, 89–93. [Google Scholar] [CrossRef]
  47. Lim, E.T.; Uddin, M.; De Rubeis, S.; Chan, Y.; Kamumbu, A.S.; Zhang, X.; D’Gama, A.M.; Kim, S.N.; Hill, R.S.; Goldberg, A.P.; et al. Rates, Distribution and implications of postzygotic mosaic mutations in Autism spectrum disorder. Nat. Neurosci. 2017, 20, 1217–1224. [Google Scholar] [CrossRef] [Green Version]
  48. Dutta, S.; Das, S.; Guhathakurta, S.; Sen, B.; Sinha, S.; Chatterjee, A.; Ghosh, S.; Ahmed, S.; Ghosh, S.; Usha, R. Glutamate receptor 6 gene (GluR6 or GRIK2) polymorphisms in the Indian population: A genetic association study on Autism spectrum disorder. Cell. Mol. Neurobiol. 2007, 27, 1035–1047. [Google Scholar] [CrossRef]
  49. Akhter, M.; Ashraf, M.; Ali, A.; Rizwan, I.; Rehman, R. Integration of therapies in Autistic children; A survey based in Karachi, Pakistan. J. Pak. Med. Assoc. 2018, 68, 1508. [Google Scholar]
  50. Furrukh, J.; Anjum, G. Coping with Autism spectrum disorder (ASD) in Pakistan: A phenomenology of mothers who have children with ASD. Cogent Psychol. 2020, 7, 1728108. [Google Scholar] [CrossRef]
  51. Sambrook, J.; Russell, D.W. Molecular Cloning: A Laboratory Manual; Cold Spring Harbor Laboratory Press: Cold Spring Harbor, NY, USA, 2001; p. 999. [Google Scholar] [CrossRef]
  52. Clarke, G.M.; Anderson, C.A.; Pettersson, F.H.; Cardon, L.R.; Morris, A.P.; Zondervan, K.T. Basic statistical analysis in genetic case-control studies. Nat. Protoc. 2011, 6, 121–133. [Google Scholar] [CrossRef] [Green Version]
  53. Anderson, C.A.; Pettersson, F.H.; Clarke, G.M.; Cardon, L.R.; Morris, A.P.; Zondervan, K.T. Data quality control in genetic case-control association studies. Nat. Protoc. 2010, 5, 1564–1573. [Google Scholar] [CrossRef] [Green Version]
  54. Szklarczyk, D.; Franceschini, A.; Wyder, S.; Forslund, K.; Heller, D.; Huerta-Cepas, J.; Simonovic, M.; Roth, A.; Santos, A.; Tsafou, K.P.; et al. STRING V10: Protein-protein interaction networks, integrated over the tree of life. Nucleic Acids Res. 2015, 43, D447–D452. [Google Scholar] [CrossRef]
  55. Amorim, I.S.; Lach, G.; Gkogkas, C.G. The role of the eukaryotic translation initiation factor 4E (EIF4E) in neuropsychiatric disorders. Front. Genet. 2018, 9, 561. [Google Scholar] [CrossRef] [Green Version]
  56. Yonan, A.L.; Alarcón, M.; Cheng, R.; Magnusson, P.K.E.; Spence, S.J.; Palmer, A.A.; Grunn, A.; Hank Juo, S.-H.; Terwilliger, J.D.; Liu, J.; et al. A Genome-wide screen of 345 families for Autism-susceptibility loci. Am. J. Hum. Genet. 2003, 73, 886–897. [Google Scholar] [CrossRef] [Green Version]
  57. Schellenberg, G.D.; Dawson, G.; Sung, Y.J.; Estes, A.; Munson, J.; Rosenthal, E.; Rothstein, J.; Flodman, P.; Smith, M.; Coon, H.; et al. Evidence for multiple loci from a genome scan of Autism kindreds. Mol. Psychiatry 2006, 11, 1049–1060. [Google Scholar] [CrossRef] [Green Version]
  58. So, H.C.; Chau, C.K.L.; Chiu, W.T.; Ho, K.S.; Lo, C.P.; Yim, S.H.Y.; Sham, P.C. Analysis of genome-wide association data highlights candidates for drug repositioning in psychiatry. Nat. Neurosci. 2017, 20, 1342. [Google Scholar] [CrossRef]
  59. Inoue, Y.U.; Inoue, T. Brain enhancer activities at the gene-poor 5p14.1 Autism-associated locus. Sci. Rep. 2016, 6, 1–12. [Google Scholar] [CrossRef] [Green Version]
  60. Ma, D.; Salyakina, D.; Jaworski, J.M.; Konidari, I.; Whitehead, P.L.; Andersen, A.N.; Hoffman, J.D.; Slifer, S.H.; Hedges, D.J.; Cukier, H.N.; et al. A genome-wide association study of Autism reveals a common novel risk locus at 5p14.1. Ann. Hum. Genet. 2009, 73, 263–273. [Google Scholar] [CrossRef] [Green Version]
  61. Bigos, K.L.; Mattay, V.S.; Callicott, J.H.; Straub, R.E.; Vakkalanka, R.; Kolachana, B.; Hyde, T.M.; Lipska, B.K.; Kleinman, J.E.; Weinberger, D.R. Genetic variation in CACNA1C affects brain circuitries related to mental illness. Arch. Gen. Psychiatry 2010, 67, 939–945. [Google Scholar] [CrossRef] [Green Version]
  62. Ivorra, J.L.; Rivero, O.; Costas, J.; Iniesta, R.; Arrojo, M.; Ramos-Ríos, R.; Carracedo, Á.; Palomo, T.; Rodriguez-Jimenez, R.; Cervilla, J.; et al. Replication of previous genome-wide association studies of psychiatric diseases in a large Schizophrenia case-control sample from Spain. Schizophr. Res. 2014, 159, 107–113. [Google Scholar] [CrossRef]
  63. Nyegaard, M.; Demontis, D.; Foldager, L.; Hedemand, A.; Flint, T.J.; Sørensen, K.M.; Andersen, P.S.; Nordentoft, M.; Werge, T.; Pedersen, C.B.; et al. CACNA1C (Rs1006737) is associated with Schizophrenia. Mol. Psychiatry 2010, 15, 119–121. [Google Scholar] [CrossRef] [Green Version]
  64. Li, J.; Zhao, L.; You, Y.; Lu, T.; Jia, M.; Yu, H.; Ruan, Y.; Yue, W.; Liu, J.; Lu, L.; et al. Schizophrenia related variants in CACNA1C also confer risk of Autism. PLoS ONE 2015, 10, e0133247. [Google Scholar] [CrossRef]
  65. Scott-Van Zeeland, A.A.; Abrahams, B.S.; Alvarez-Retuerto, A.I.; Sonnenblick, L.I.; Rudie, J.D.; Ghahremani, D.; Mumford, J.A.; Poldrack, R.A.; Dapretto, M.; Geschwind, D.H.; et al. Altered functional connectivity in frontal lobe circuits is associated with variation in the Autism risk gene CNTNAP. Sci. Transl. Med. 2010, 56, 56ra80. [Google Scholar] [CrossRef] [Green Version]
  66. McNealy, K.; Mazziotta, J.C.; Dapretto, M. Cracking the language code: Neural mechanisms underlying speech parsing. J. Neurosci. 2006, 26, 7629–7639. [Google Scholar] [CrossRef]
  67. Knowlton, B.J.; Mangels, J.A.; Squire, L.R. A Neostriatal habit learning system in humans. Science 1996, 273, 1399–1402. [Google Scholar] [CrossRef] [PubMed] [Green Version]
  68. Moon, A.L.; Haan, N.; Wilkinson, L.S.; Thomas, K.L.; Hall, J. CACNA1C: Association with psychiatric disorders, behavior, and neurogenesis. Schizophr. Bull. 2018, 44, 958–965. [Google Scholar] [CrossRef] [PubMed]
  69. Zhao, M.; Yang, J.; Qiu, X.; Yang, X.; Qiao, Z.; Song, X.; Wang, L.; Zhao, E.; Yang, Y.; Cao, D. CACNA1C Rs1006737, threatening life events, and gene–environment interaction predict major depressive disorder. Front. Psychiatry 2020, 10. [Google Scholar] [CrossRef]
  70. Roopasree, B.; Joseph, J.; Mukkadan, J.K. Oxytocin-functions: An overview. MOJ Anat. Physiol. 2019, 6, 128–133. [Google Scholar] [CrossRef]
  71. Nguyen, R.L.; Medvedeva, Y.V.; Ayyagari, T.E.; Schmunk, G.; Gargus, J.J. Intracellular calcium dysregulation in Autism spectrum disorder: An analysis of converging organelle signaling pathways. Biochim. Biophys. Acta Mol. Cell Res. 2018, 1865, 1718–1732. [Google Scholar] [CrossRef]
  72. Wen, Y.; Alshikho, M.J.; Herbert, M.R. Pathway network analyses for Autism reveal multisystem involvement, major overlaps with other diseases and convergence upon MAPK and calcium signaling. PLoS ONE 2016, 11, e0153329. [Google Scholar] [CrossRef]
  73. Wen, Y. Involvement of Calcium, Ras, MAPK, PI3K-Akt and MTOR signaling pathways in Autism spectrum disorders. Neurol. Neurother. Open Access J. 2017, 2, 000110. [Google Scholar] [CrossRef]
  74. Kim, H.; Lim, C.S.; Kaang, B.K. Neuronal mechanisms and circuits underlying repetitive behaviors in mouse models of Autism spectrum disorder. Behav. Brain Funct. 2016, 12, 3. [Google Scholar] [CrossRef] [PubMed] [Green Version]
  75. Di, J.; Li, J.; O’Hara, B.; Alberts, I.; Xiong, L.; Li, J.; Li, X. The role of GABAergic neural circuits in the pathogenesis of Autism spectrum disorder. Int. J. Dev. Neurosci. 2020, 80, 73–85. [Google Scholar] [CrossRef]
  76. Cioana, M.; Michalski, B.; Fahnestock, M. Insulin-like growth factor and insulin-like growth factor receptor expression in human idiopathic Autism fusiform gyrus tissue. Autism Res. 2020, 6, 897–907. [Google Scholar] [CrossRef] [PubMed]
  77. Lo, F.S.; Erzurumlu, R.S. Insulin receptor sensitization restores neocortical excitation/inhibition balance in a mouse model of Autism. Mol. Autism 2018, 13, 9. [Google Scholar] [CrossRef] [PubMed] [Green Version]
  78. Mahmood, H.M.; Aldhalaan, H.M.; Alshammari, T.K.; Alqasem, M.A.; Alshammari, M.A.; Albekairi, N.A.; AlSharari, S.D. the role of nicotinic receptors in the attenuation of autism-related behaviors in a murine BTBR T + Tf/J Autistic model. Autism Res. 2020, 13, 1311–1334. [Google Scholar] [CrossRef]
  79. Marotta, R.; Risoleo, M.C.; Messina, G.; Parisi, L.; Carotenuto, M.; Vetri, L.; Roccella, M. The neurochemistry of autism. Brain Sci. 2020, 10, 163. [Google Scholar] [CrossRef] [Green Version]
Figure 1. Sanger sequencing of selected samples showing all observed genotypes. Electropherograms of individuals with (A) ATP2B2/rs35678 C/T, (B) Rs4307059 C/T, (C) CNTNAP2/rs7794745 A/T, (D) CACNA1C/rs1006737 G/A, (E) EIF4E/rs17850950 C/T. All three possible genotypes are highlighted.
Genes 11 01206 g001
Figure 2. Protein–protein interactions and enrichment analysis for ATP2B2, CNTNAP2, CACNA1C, CDH9, and CDH10 and their interacting partners. (A) Using STRING analysis, all forty proteins that interact with ATP2B2, CNTNAP2, CACNA1C, CDH9, and CDH10 via either primary or secondary interactions were plotted. The confidence level of the interactions is represented by the width of the edges connecting the proteins. (B) Enrichment analysis for KEGG pathways among the forty proteins that interact with ATP2B2, CNTNAP2, CACNA1C, CDH9, and CDH10. X-axis represents the enrichment score, which is the -log FDR-adjusted p-value. The black line at 1.3 represents an FDR-adjusted p-value and the pathways that surpass 1.3 are significantly over-represented among our proteins of interest.
Genes 11 01206 g002
Table 1. Mean age and gender frequency among control and autism spectrum disorder (ASD) patients.
ControlsASDp-Value
Total Samples9393data
Mean Age ± SD39.98 ± 1.878.409 ± 0.5784<0.001 a
Median407
Interquartile Range26.55.5
Total Number (Percentage) Males41 (44.09%)68 (73.12%)<0.001 b
Total Number (Percentage) Females52 (55.91%)25 (26.88%)
a Calculated using an independent t-test. b Calculated using a χ-square test.
Table 2. Genotypic frequencies of studied SNPs in control and ASD patients.
GenotypeControls
(n = 93)
Cases
(n = 93)
OR (95% CI)
p-Value
Adjusted OR (95% CI)
p-Value
ATP2B2/rs35678 (C/T)
CC14 (15.1%)3 (3.2%)Reference
CT47 (50.5%)48 (51.6%)*4.76 (1.28–17.66) 0.010.42 (0.02–6.23) 0.52
TT32 (34.4%)42 (45.2%)*6.12 (1.62–23.13) 0.0071.37 (0.09–19.88) 0.81
CNTNAP2/rs7794745 (A/T)
AA38 (40.9%)28 (30.1%)Reference
AT47 (50.5%)45 (48.4%)1.29 (0.68–2.45) 0.420.98 (0.26–3.68) 0.977
TT8 (8.6%)20 (21.5%)*3.39 (1.30–8.81) 0.012.98 (0.28–31.16) 0.361
CACNA1C/rs1006737 (G/A)
GG58 (62.4%)52 (55.9%)Reference
GA35 (37.6%)41 (44.1%)1.30 (0.72–2.34) 0.371.41 (0.40–4.92) 0.584
(CDH9/CDH10)/rs4307059 (C/T)
CC12 (12.9%)10 (10.8%)Reference
CT47 (50.5)45 (48.4)1.14 (0.45–2.92) 0.770.26 (0.01–3.62) 0.319
TT34 (36.6)38 (40.9)1.34 (0.51–3.49) 0.540.05 (0.002–1.02) 0.05
EIF4E/rs17850950
CC93 (100%)93 (100%)----
CT00----
TT00----
SNPs: Single nucleotide polymorphisms. The adjusted odds ratio (OR), 95% confidence interval (CI), and p-value were calculated after adjusting for gender and age as covariates. * Unadjusted significant p-values are in bold.
Table 3. Allele frequencies of studied SNPs in control and ASD patients.
Genes/SNPs IDsAllelesControls
(%)
Cases
(%)
OR (95%CI)
p-Value
Adjusted OR (95%CI)
p-Value
ATP2B2/rs35678 T 60711.04 (0.59–1.86) 0.880.29 (0.06–1.38) 0.11
C4029
CNTNAP2/rs7794745 T 3446*1.68 (1.09–*2.61) 0.0170.86 (0.28–2.65) 0.79
A6654
CACNA1C/rs1006737 A 19221.21 (0.73–2.02) 0.441.21 (0.73–2.02) 0.44
G8178
(CDH9/CDH10)/rs4307059 T 62651.16 (0.75–1.80) 0.50.72 (0.20–2.58) 0.61
C3835
The adjusted OR, 95% CI, and p-value were calculated after adjusting for gender and age as covariates. * Unadjusted significant p-values are bold
Table 4. Polygenic risk score between ASD cases and controls.
Number of Risk AllelesControls (n = 93) Cases (n = 93)OR (95% CI) p-ValueAdjusted OR (95% CI) p-Value
16 (6.5%)1 (1.1%)Reference
215 (16.1%)8 (8.6%)3.19 (0.326–31.391) 0.312.175 (0.010–463.87) 0.776
327 (29.03%)25 (26.9%)5.55 (0.624–49.38) 0.1243.53 (0.019–650.02) 0.634
424 (25.8%)22 (23.7%)5.49 (0.613–49.32) 0.1273.16 (0.016–611.30) 0.667
5+21 (22.6%)37 (39.7%)10.56 (1.19–93.77) 0.0342.114 (0.011–40.7.04) 0.780
The adjusted OR, 95% CI, and p-value were calculated after adjusting for gender and age as covariates.
Table 5. Association of clinical variables of ASD with genotypes.
Clinical PhenotypeClassificationATP2B2
rs35678
CNTNAP2
rs7794745
CACNA1C rs1006737rs4307059
CCCTTTp-ValueGGGAAAp-ValueGGGAp-ValueCCCTTTp-Value
LickingYes229230.8241726110.923 26280.076 427230.471
No1191911199262361815
Hand functioningOk245400.1502543190.545 47400.162 1042350.662
Poor13232151033
Self-care skillsFully dependent229250.983193070.03132240.721828200.527
Needs help1171671413191521517
Good02121012021
Vision problemsYes0410.4200320.275 140.096 1130.412
No34441284218513794435
Smells everythingYes015220.045122140.118 18190.251 320140.623
No33320162416342272524
Looks closely from eye cornerYes134290.3961834120.378 33310.209 633250.621
No2141310118191041213
Cover ear in noiseYes028210.1301225120.435 26230.559 528160.185
No3202116208261851722
Rocking and swayingYes340330.5962536150.413 46300.058 741280.074
No0893956113410
Repetitive behaviorsYes344390.8622641190.857 46400.099 1043330.206
No04324161025
Likes circular moving objectsYes121240.381142480.610 22240.120 623170.659
No22718142112301742221
Reciprocates smilesYes214120.55441590.209 15130.760 315100.748
Rarely0181311146191241611
No1161713165181631417
Eye contactGood215160.744131550.485 20130.616 513150.666
Poor13125152814312653022
No02102113021
Unusual noiseYes127200.5821424100.95027210.946 222240.046
No22122142110252082314
EcholaliaYes018150.42071880.382 18150.844 117150.201
No33027212712342692823
Sense of being praisedYes11370.45071040.917 9120.171 010110.149
No235352135164329103527
AggressiveYes018210.1591412130.009 16230.014 417180.672
No3302114337361862820
Speech No Speech221120.249131660.592 21140.920 418130.969
Able to make short sentences013157147151341212
Can string few words08848497196
Only a few single words13746165155
Normal03001212012
Idiosyncratic languageYes0680.5222840.365770.629 2750.858
No34234263716453483833
Understanding (Cognitive)Good1400.020 1310.664320.3490320.034
Limited01118616713165717
Poor23324212612362353519
Shared enjoyments with parentsYes0530.7422240.112 350.273 0350.340
No343392643164936104233
Follow instructionsYes0650.976 2450.07830.08412140.810
Very simple1151471491218155
No2272319276322052819
p-values were calculated using χ-squared tests. p-values that pass the Bonferroni p-value threshold of 0.01 are highlighted.
Publisher’s Note: MDPI stays neutral with regard to jurisdictional claims in published maps and institutional affiliations.

