Classification of Essential Tremor and Parkinson’s Tremor Based on a Low-Power Wearable Device


1
Department of Engineering and Applied Sciences, University of Bergamo, Viale Marconi 5, 24044 Dalmine (BG), Italy
2
Department of Neuroscience, Papa Giovanni XXIII Hospital, 24127 Bergamo, Italy
3
PhD Program in Neuroscience, University of Milano-Bicocca, Piazza dell’Ateneo Nuovo 1, 20126 Milano, Italy
*
Author to whom correspondence should be addressed.
Electronics 2020, 9(10), 1695; https://doi.org/10.3390/electronics9101695
Submission received: 31 August 2020
/
Revised: 10 October 2020
/
Accepted: 12 October 2020
/
Published: 15 October 2020
(This article belongs to the Section Bioelectronics)
Abstract
:Among movement disorders, essential tremor is by far the most common, as much as eight times more prevalent than Parkinson’s disease. Although these two conditions differ in their presentation and course, clinicians do not always recognize them, leading to common misdiagnoses. Proper and early diagnosis is important for receiving the right treatment and support. In this paper, the development of a portable and reliable tremor classification system based on a wearable device, enabling clinicians to differentiate between essential tremor and Parkinson’s disease-associated one, is reported. Inertial data were collected from subjects with a well-established diagnosis of tremor, and analyzed to extract different sets of relevant spectral features. Supervised learning methods were then applied to build several classification models, among which the best ones achieved an average accuracy above 90%. Results encourage the use of wearable technology as effective and affordable tools to support clinicians.
1. Introduction
Movement disorders are neurological syndromes in which there is either an excess of movement (hyperkinesias) or a lack of voluntary and automatic movements, unrelated to weakness or spasticity (hypokinesias) [1]. Movement disorders significantly impact the ability to function and live independently [2]. Among movement disorders, tremor is the most common symptom: it can be defined as an involuntary, rhythmic, periodic oscillation of a body part, differing from other involuntary movement disorders by its repetitive, stereotyped, movements of a regular amplitude and frequency [3,4]. Tremors are caused by the alternating or synchronous activation of the antagonist muscle groups [5] and may involve hands, head, face, vocal cords, trunk, or legs [3]. The general description of a tremor is given by the frequency of the oscillations (high or low) and the amplitude of the movement (fine or coarse); in addition, a tremor is classified by the activation condition, that is, which position most accentuates it [3,4]. Specifically:
- A resting tremor is visible when the subject is in a rest condition and occurs when a part of the body is relaxed and has a complete support against gravity (the weight lies on a stable resting point). It is minimal or absent during activity, when the body part is voluntary activated [3].
- An action tremor occurs while maintaining a position against gravity, such as in maintaining arms stretched forward (postural tremor) or while standing (orthostatic tremor). Action tremor occurs also during voluntary movement (kinetic tremor); particular specifications may distinguish simple kinetic tremor (e.g., waving the hands at a slow and regular speed while stretching arms forward), and task-specific kinetic tremor (e.g., while drawing a spiral) [3].
Aging-related tremors have become a critical aspect for the improvement of the quality of life of the elderly people [6], especially considering that the percentage of this population category in Western Countries is increasing [7,8]. In this context, essential and Parkinsonian tremors are the most common age-related movement disorders characterized by an outpatient neurology practice [9,10].
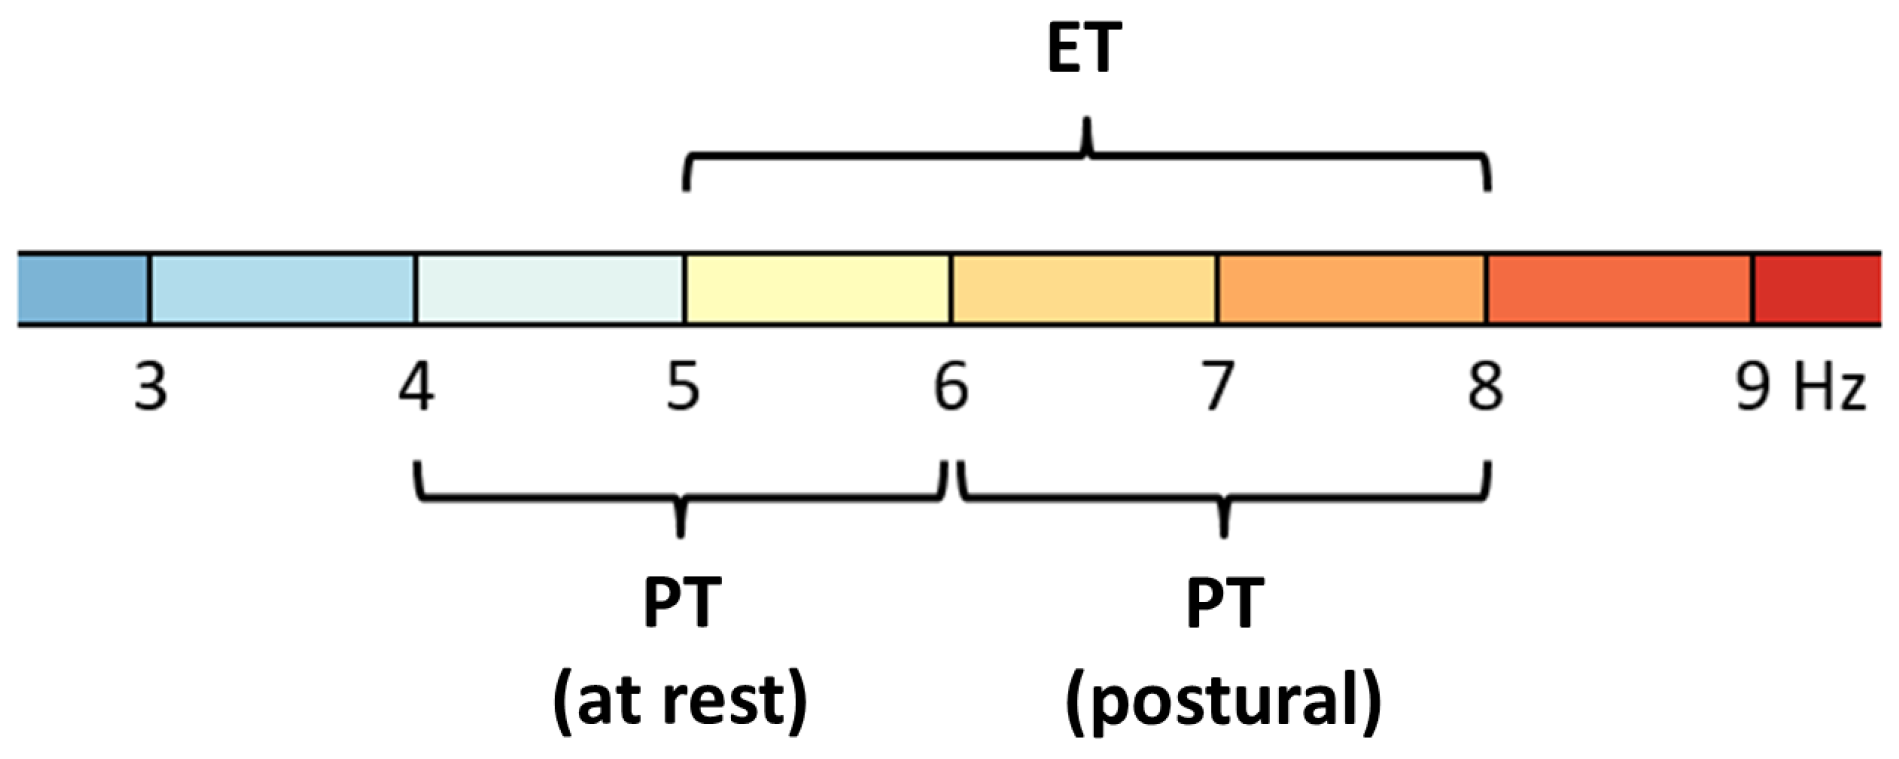
Essential tremor (ET) is the most common movement disorder, with a prevalence of around 2.2% in the United States population [3,11]. This progressive neurological disorder has a typical onset after age 40, although it can occur at any age, and usually affects limbs, head, and voice [12]. Essential tremor is characterized by an oscillation frequency varying from 5 Hz to 8 Hz, and it is classified as either a postural or a kinetic tremor [13]: nevertheless, during the disease progression, such tremor might also appear while approaching a target (intention tremor) and/or at rest [14,15]. On the other hand, Parkinsonian tremor (PT) is among the symptoms of Parkinson’s disease (PD), one of the most common neurodegenerative diseases in human beings [16]. In industrialized countries, the estimated prevalence of PD is 0.3% in the general population, 1.0% in people older than 60 years and 3.0% in people older than 80 years [17]. About 70% of people with PD experience a tremor at some point in the disease [18]. Such tremor usually affects only one side of the body: it tends to occur in the hands (where is often described as “pill-rolling”), but it can also appear in other parts of the body, including the lower lip, jaw, or leg [3,4,17,19]. Parkinsonian tremor occurs mostly at rest and lessens when the body part is actively in use. It is characterized by a common shaking frequency in between 4 Hz and 6 Hz [16]: nevertheless, in some subjects, a postural tremor with frequencies ranging from 6 Hz to 8 Hz was observed [20].
The approach to the diagnosis includes both the evaluation of the patient medical history and physical examinations to determine whether the tremor occurs during action or at rest [19]. While the other forms of tremor are associated with specific neurological findings that may clearly differentiate them on the clinical basis, in some cases, the similar amplitudes and the overlapping features (see Figure 1) characterizing ET and PT can make the differentiation a difficult task for neurologists [4,21], who can only rely on their experience to classify and then select the proper treatment for the tremor.
In the last decade, a wide variety of clinical applications involved the usage of wearable technologies to collect information from impaired subjects [22]: wearables can be used by healthcare professionals in rehabilitation practices to assess patient’s motor skills, for instance; in telemedicine contexts, they allow for continuous monitoring of human physical activities and physiological parameters during daily life. The role of technologies enabling remote monitoring has taken on even more prominence as the world has faced the arrival of COVID-19 [23]. In previous works [24,25], the authors already discussed the need of an objective, reliable tool enabling the clinicians to accurately differentiate between essential and Parkinsonian tremors. As reported in those papers, a preliminary study to assess the potential of an inertial sensors-based wearable device to detect subtle differences between such tremor families was conducted, leading to the following main findings:
- The wearable device chosen for the study was demonstrated to be a reliable tool when used to monitor tremor frequencies [25].
- A first feature extraction strategy, based on the frequency spectrum of the device orientation, was investigated. Results showed that the obtained features correctly highlight the main differences between the two forms of tremor [24].
- The strong correlation observed between orientation and inertial data frequency features allows for the extraction process to be applied indiscriminately on both datasets. This in turn leads to a potential optimization of the power consumption of the wearable device used, since it would no longer require embedded complex algorithms such as Kalman filter to estimate its orientation [25].
This paper reports a more in-depth experimental study aimed at building a portable classification system able to distinguish between essential and Parkinsonian tremors. Specifically, a low cost wearable device was exploited to collect orientation and inertial data from a sample of subjects affected by tremors—either ET or PT. Supervised learning algorithms were introduced to create several classification models from different feature sets, the latter obtained by means of two extraction strategies and three different data sources. The results of the study foster the usage of wearable technology as an objective and reliable tool to support clinicians in the diagnosis of tremors, and pave the way for telemedicine applications and remote health assessment.
2. Materials and Methods
2.1. System Architecture
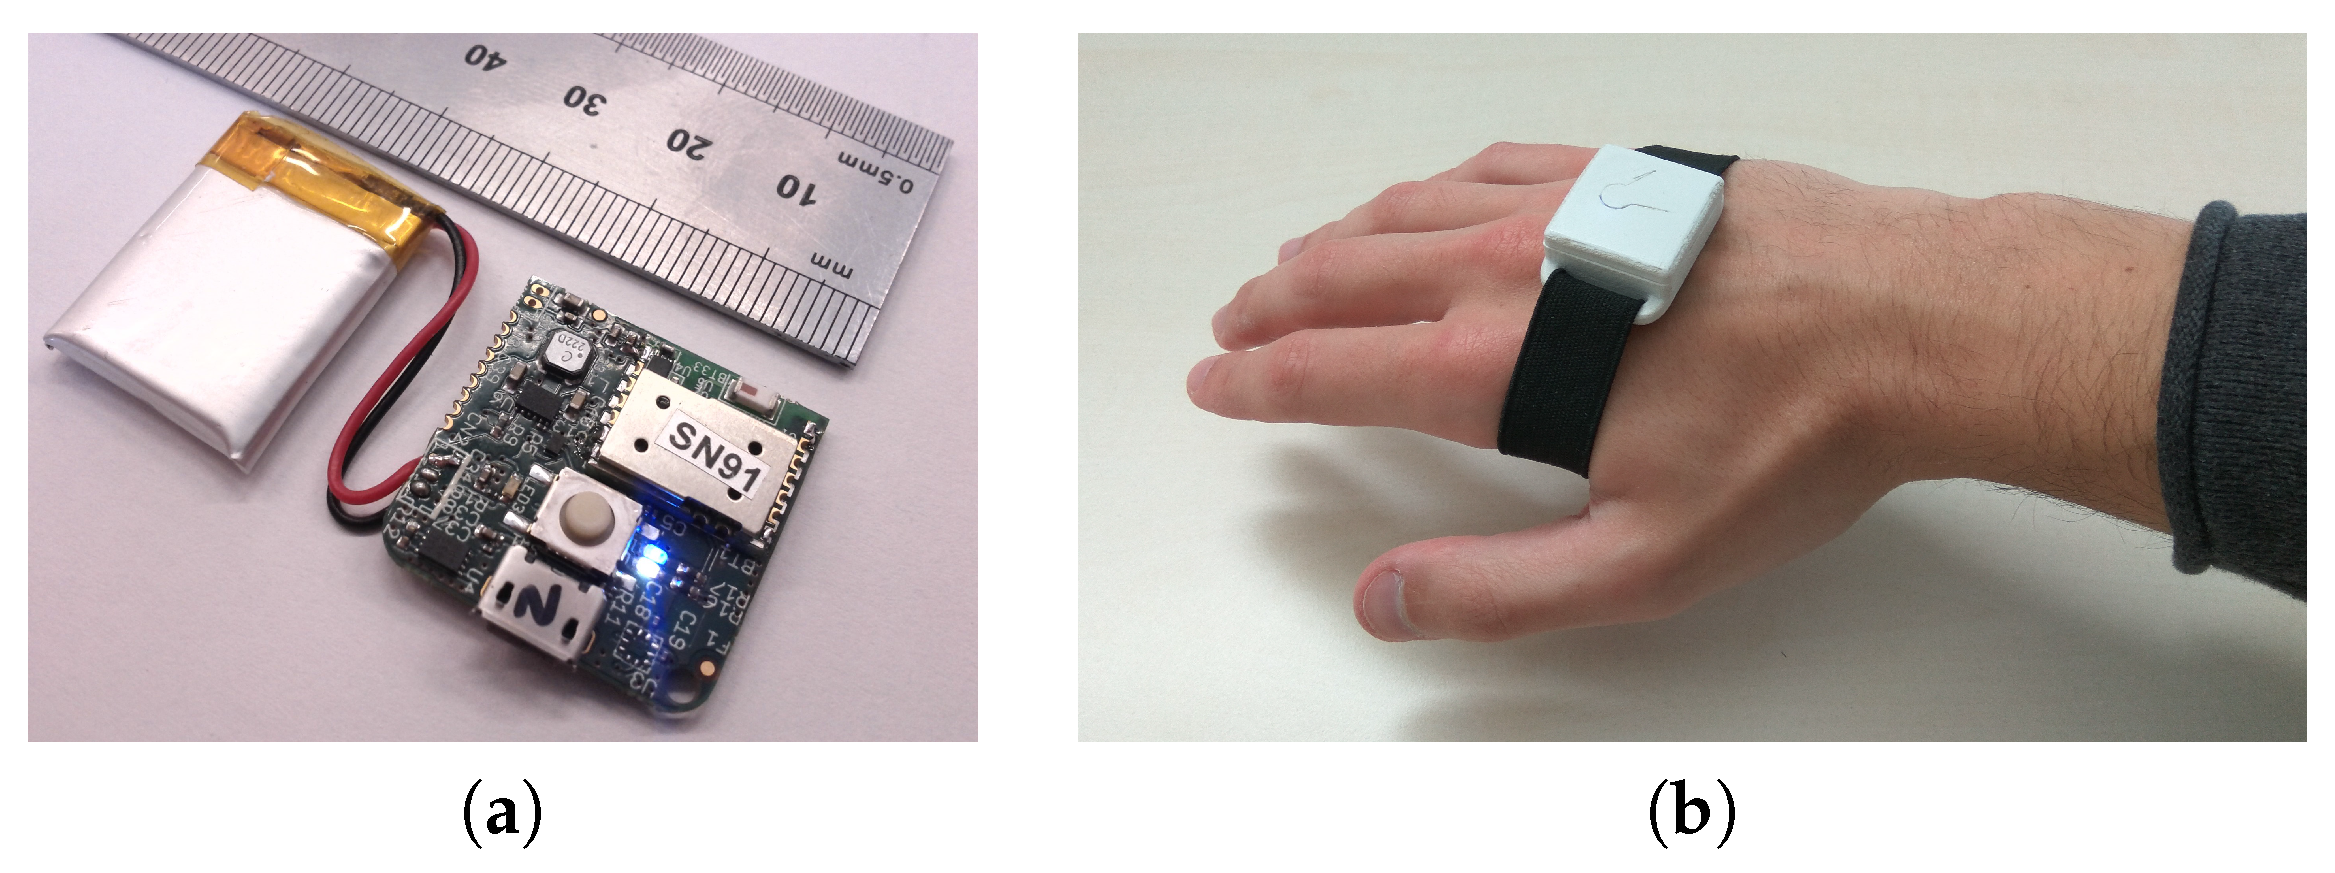
The core of the measuring system is MuSe, a miniaturized multi-sensor Attitude and Heading Reference System that integrates sensing, processing, storage, and communication units in a single 25 mm × 25 mm form factor Printed Circuit Board (see Figure 2). This wearable device was widely described by the authors in previous papers [24,25], and it was validated as a reliable vibration measuring tool [25]. In order to enable the communication between a smartphone (or tablet) and the wearable device, as well as to retrieve the collected data from it, an Android application was developed ad hoc. The software provides a Graphical User Interface allowing the user to manage subject profiles, to setup the MuSe device via a Bluetooth connection, and to start the real-time streaming of the acquired data.
2.2. Subject Sample and Recording Setup
Twenty-four (24) subjects with an average age of 72 years (standard deviation: 12 years) and a well-established tremor diagnosis were monitored on a voluntary basis: 17 subjects are affected by PD, 7 by ET (see Table 1 for more details). The diagnoses were done by a neurologist trained in movement disorders and made on the basis of the standard diagnosis procedure (subject’s medical history, physical and neurological examinations). Subjects voluntarily and freely accepted to participate after being informed of the experimental nature of the study and that the use of this wearable sensor would have had no relevance for their medical condition; they have also been informed that data would have been treated anonymously.The study was conducted at the Electronics Laboratory (Department of Engineering and Applied Sciences) of the University of Bergamo, in the context of the PhD program of one of the authors. The department agreed with the experimental nature of the study, as well as the usage of the non-invasive electronic system described in this document to monitor subjects affected by movement disorders.
Each subject was sitting at a table and was asked to replicate four standardized tasks typically used by neurologists to assess the tremor nature:
- Rest task: the subject is asked to lay their arms onto the legs.
- Postural task: the subject is asked to hold their arms parallel to the floor.
- Postural/Kinetic task: starting from task 2, the subject is asked to move their hands up and down by rotating their wrist.
- Kinetic task: the subject is asked to draw a spiral on a paper sheet.
Each task stresses a particular form of tremor according to their activation conditions: the rest task, for instance, should emphasize a PT, whereas postural and kinetic tremors should be typically evoked in ET during the execution of tasks 2 and 4. The subject was instructed before the execution of each task. A single MuSe device was mounted on the back of the hand presenting a dominant tremor by means of an adjustable strap (see Figure 2): since an intense pressure might lessen the intensity of the tremor, the strap was tightened just enough to ensure the contact between the hand and the device.
2.3. Feature Extraction
The MuSe device embeds a sensor fusion algorithm which combines raw data collected by the sensors (i.e., accelerations, intensity of magnetic field and angular rates) to compute its orientation in the space: both the raw and the processed data can then be sent in real-time over a Bluetooth connection. For each subject, 15 s of data were collected at a sample rate of 50 Hz and transmitted to the Android application: the received data were then stored in four different text files, one for each task. All data analyses were performed offline using MATLAB R2017b.
2.3.1. Preprocessing
Data collected by the device represent the movements of the subject’s hand: as such, they include both voluntary movements required in the specific task (such as drawing the spiral) and involuntary movements induced by the tremor. Since the former are performed at frequencies below the typical tremor frequency band, data were first filtered by means of a Chebyshev Type-II bandpass filter with cutoff frequencies of 2.5 Hz and 15 Hz. This digital filter was purposely designed to have a maximum passband ripple of 1 dB and a minimum stopband attenuation of 80 dB. In order to remove the transient response of the filter, each data acquisition was trimmed (2.5 s in both sides) obtaining a 10 s-long window, corresponding to a signal of 500 samples.
2.3.2. Approach 1: Spectrum Fit
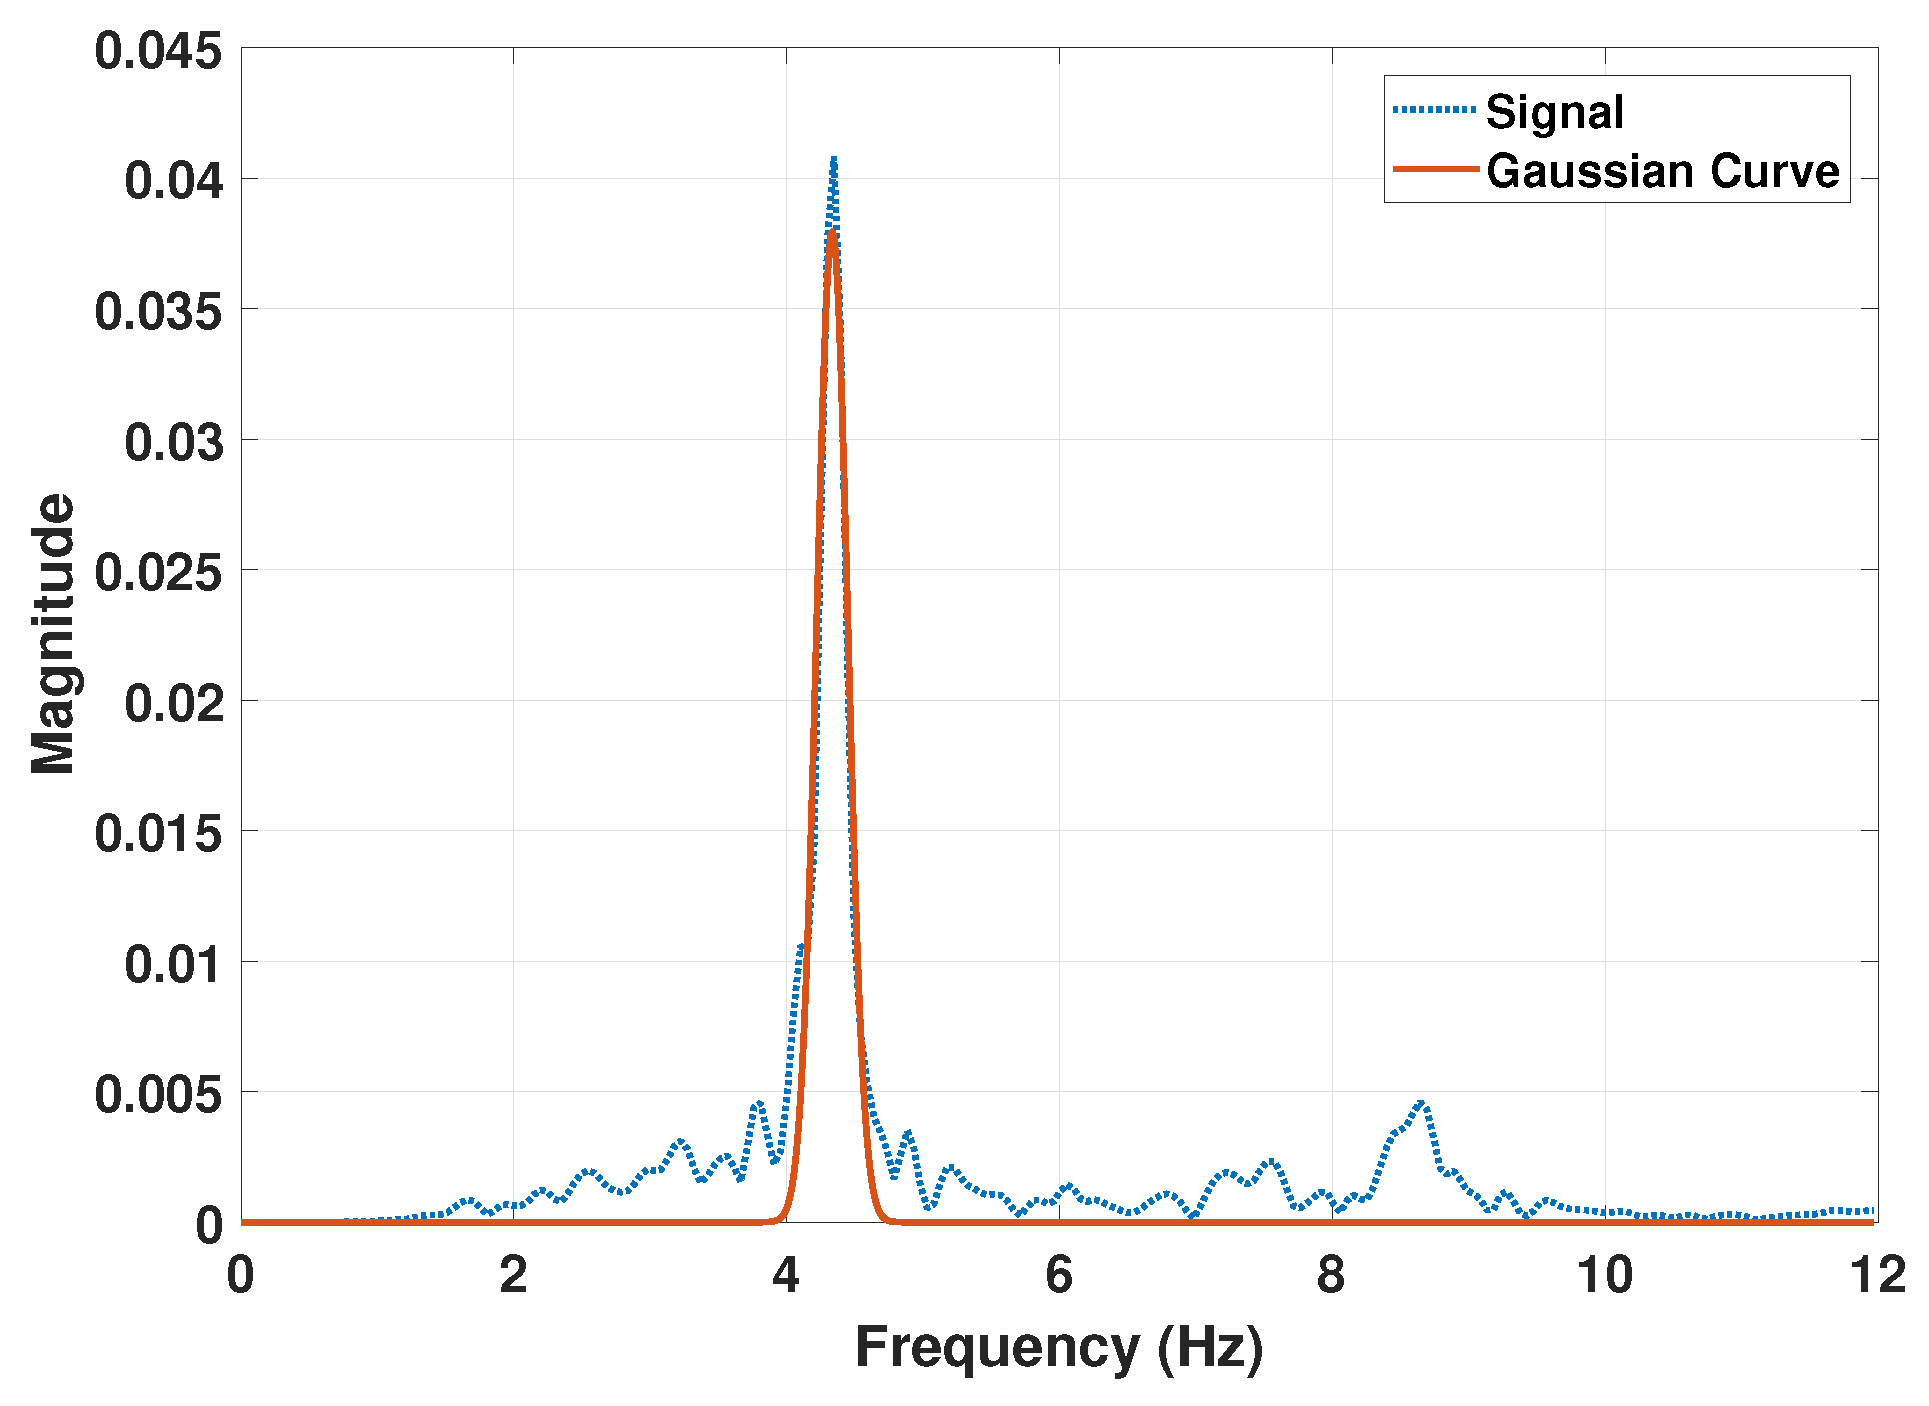
The first feature extraction strategy was discussed by the authors in [24] and relies on the shape of the signal’s Fourier representation. According to the results of some preliminary analysis in fact, the typical frequency spectrum resembled a bell-shaped curve (see Figure 3). Data in the frequency domain were thus fitted with a Gaussian function in the form
where a is the height of the curve’s peak, b is the position of the center of the peak, and c is related to the width of the “bell”: such parameters were identified as signal descriptors. To improve the curve fit, the process included constraints on parameters (all of them had to be positive values) and sample weighting (to discard frequencies outside the range of interest).
This approach was applied indiscriminately to orientation data, acceleration data, and angular rate data collected by the wearable device during the execution of each task. However, driven by the preliminary results obtained in [25], a more rigorous analysis was conducted to assess the data source interchangeability. Specifically, Pearson’s linear correlation indexes r among pairwise data sources were computed, for each parameter and for each task, regardless of the tremor nature. Moreover, right tailed significance tests were performed under the null hypothesis of correlation being equal to zero, against the alternative hypothesis of correlation being greater than zero. The significance level was set to 0.05.
2.3.3. Approach 2: Power Features
In order to be independent of the specific frequency spectrum pattern, a more general approach was adopted, based on the spectral features of the raw signals collected by the MuSe platform. Both accelerometer and gyroscope data were considered, in order to successively compare results obtained using both sensors with those obtained by using a single sensor only.
For each acquired signal and for each axis, the power spectral density (PSD) was computed by means of the Welch’s method [26] as follows. First, data were split into overlapping segments with a length of 125 samples and an overlap percentage of 50%. Segments were then windowed by using the Hann window function and zero padded in order to get 512 discrete Fourier transform points. Finally, the modified periodograms were computed and averaged to get the power spectral density of the signal along an axis. Once the PSDs of the three axes were obtained, their amplitudes were added in quadrature in order to combine the spectra and obtain one PSD per signal.
The following power features were extracted from PSDs of each task, both for accelerometer and gyroscope data:
- Peak Power (PP): The maximum power that was observed.
- Peak Frequency (PF): The frequency where the maximum power occurred.
- Peak Area (PA): The area under the observed power peak, within an interval of ±0.3 Hz.
- Median Power Frequency (MPF): The frequency dividing the PSD into two intervals, each with 50% of the total power.
- Total Power (TP): The power of the signal in the 2 Hz to 10 Hz frequency interval (wide enough to include all tremors’ frequency components), computed as the definite integral of the PSD.
By introducing some of the problem knowledge in the feature extraction process, a new feature called Relative Power (RP) was computed in addition to the above-mentioned ones. In fact, since PT and ET are a resting tremor and a postural/kinetic tremor respectively, the Total Power of a signal collected during the execution of task 1 is expected to be higher for a PT subject with respect to an ET subject’s signal power; on the contrary, the Total Power of an ET subject’s signal collected during the execution of task 2 is expected to be higher than a PT subject’s one. For this reason, the Relative Power (RP) was defined as
that is, the ratio between the Total Power in task 1 () and the Total Power in task 2 (), each of them obtained by integrating the related PSD in the frequency domain as described above.
2.4. Classifiers Modeling and Evaluation
The goal of the study was to create a model able to distinguish between Parkinsonian and essential tremors. This task can be addressed to as a classification problem: the tremor diagnosis is the known response, and belongs to one of a set of two discrete classes—PT and ET.
Several datasets containing the extracted features were built by using the procedures previously described: they were obtained by applying one of the two feature extraction approaches to data from one of the available data sources (either orientations, accelerometer or gyroscope signals). Each dataset was composed of 24 observations (one per subject), and a variable number of features depending on the specific approach. Considerations reported below, as well as the model building procedure, hold for all the datasets: for simplicity, the following discussion will therefore refer to a single data set.
Due to the small size of the sample (24 observations) and the imbalance of the pathologies distribution (17 PT vs. 7 ET), a stratified k-fold partitioning technique was used on the starting dataset, with the k parameter set to 5. The stratification ensures that the folds preserve the percentage of samples for each class, in order for each of them to be a good representative of the whole and to not condition the model training. Moreover, to cope with the imbalance of the dataset, a specific metric was used to evaluate the built models and to select the best one during the optimization phase: the balanced accuracy (BACC). For a two class problem, this metric is defined as
where , , , and represent the number of true positives, true negatives, false positives and false negatives, respectively: in this terminology, true or false refers to the assigned classification being correct or incorrect, while positive or negative refers to assignment to the positive or the negative category. The balanced accuracy weights in the same way both the majority and the minority classes, so that the final value is independent of the size of each of them: since the ratio between essential and Parkinsonian tremors is approximately 1:2.5, misclassifying an observation labeled as “Essential” equals misclassifying 2.5 “Parkinsonian” observations.
Classification models were trained by using five different learning algorithms for each dataset: k-Nearest Neighbors (kNN), Support Vector Machine (SVM), Naïve Bayes (NB), Discriminant Analysis (DA), and Decision Tree (DT). The following procedure was adopted for each learning algorithm:
- A first model was trained with the entire set of features. Few hyperparameters were optimized by means of Bayesian optimization algorithm and cross-validation.
- The sequential forward feature selection was computed by using the trained, loosely optimized model as the predictive model. The algorithm used cross-validation and the balanced accuracy complementary as loss function.
- The final model was trained with the selected feature subset. The full hyperparameters optimization was performed with the same conditions as before (Bayesian optimization, cross-validation).
This procedure was adopted for each learning algorithm except for the decision tree, which already integrates a feature selection approach, used to decide the branching condition at each split (before finding the weight): for this learner, only the third point was executed, with the entire feature set.
2.5. Substudy: Healthy vs. Tremor-Affected Subjects
In order to enlarge the capabilities of the developed classification system, an additional preliminary study was conducted: the goal was to verify whether or not the feature extraction procedures would provide sufficient information to differentiate between healthy and tremor-affected subjects. For this purpose, 14 healthy subjects with an average age of 45 years (standard deviation: 20 years) underwent the same test procedure: they were monitored by means of a MuSe platform mounted on the back of their non-dominant hand, while executing the four standardized tasks aforementioned.
After collecting orientation and inertial measurements, data were analyzed as described in previous sections. A first group of control cases datasets were built by using the spectrum fit approach described in Section 2.3.2: specifically, following the results of data sources interchangeability evaluation, only inertial data (accelerations and angular rates) were considered. The second group of control cases datasets were built according to the analysis procedure described in Section 2.3.3.
3. Results
3.1. Feature Extraction
By applying the methods described in Section 2.3.2 and Section 2.3.3, orientation, acceleration, and angular rate signals were analyzed to obtain different feature sets. For the sake of brevity, only the summaries of the features from angular rate signals are shown in this paper.
The first, second, and third distribution quartiles (, , and , respectively) of Gaussian curve parameters for subjects showing PT and subjects showing ET were computed from each feature set (see Table 2). The fitted curves are centered in the correct frequency range of the associated tremor: specifically, the inter-task medians of frequency centers (b parameter) range from 4.94 Hz to 5.84 Hz for Parkinsonian tremors (typical frequency range: 4 Hz to 6 Hz) and from 5.71 Hz to 6.34 Hz for essential tremors (typical frequency range: 5 Hz to 8 Hz), depending on the data source used.
Since it is expected to observe different tremor manifestation with respect to the task performed, the quartiles of the parameter distributions were grouped by task, as reported in Table 3. Task 1 results show that the fitted Gaussian curves are typically higher and more narrow in PD tremors with respect to the ET ones, indicating a greater manifestation of the former type of tremor at rest as expected. As noted above, in some cases, PD subjects may show a postural tremor with a slightly higher frequency (6 Hz to 8 Hz) than resting tremor:results from task 2 may be partially explained by taking into account this aspect of the disease. In fact, in this task, PT and ET Gaussian curves have comparable heights and width, giving no significant distinction between them. On the contrary, results from tasks 3 and 4—postural/kinetic and kinetic tasks respectively—highlight the presence of essential tremors among subjects, characterized by higher and more narrow Gaussian curves in essential tremors with respect to the PD ones.
Table 4 reports the correlation indexes of data sources for each Gaussian parameter and task, and the related p-values computed from the significance tests. Thirty-four (34) out of the performed thirty-six (36) tests resulted in a p-value less than 0.05, suggesting that the null hypothesis of no correlation may be rejected.
Finally, the distribution quartiles of power features obtained by analyzing acceleration and angular rate signals were computed, as shown in Table 5. Generally speaking, results show that PT subjects are characterized by higher-amplitude tremors with respect to ET subjects, as resulted from the spectrum fit-based approach. Frequencies at which power maxima occurred (PF) as well as the estimated median power frequencies (MPF) correctly fall into the frequency range reported in literature for ET; instead, they are slightly greater than the expected ones for PD subjects. Lastly, results related to the relative power RP confirm the aforementioned hypothesis, being greater in PD subjects than in ET. These overall considerations stand for both accelerometer- and gyroscope-based results.
3.2. Spectrum Fit-Based Classifiers
Datasets used in this subsection were generated from the feature extraction process described in Section 2.3.2. Since the data sources interchangeability had already been confirmed at this point of the study, only the two datasets obtained from the analysis of acceleration signals and angular rate signals were considered. Each of those datasets contained 12 features, that is, the parameters a, b, and c of the fitted Gaussian curve for each task. In addition, a new dataset with a total of 24 features was generated by merging the acceleration-based and the angular rate-based ones.
Table 6, Table 7 and Table 8 report the optimal classifiers trained with the acceleration dataset, the angular rate dataset, and the mixed one, respectively. Each table contains the optimal feature subset and hyperparameters of the trained classifiers, as well as the out-of-sample accuracy, sensitivity, and specificity obtained by cross-validating the models. The feature subscripts indicate the task which they refer to. Moreover, in the mixed dataset, the abbreviations “Acc” and “Gyro” were used to distinguish features extracted from the accelerometer and gyroscope signals, respectively. It has to be noticed that, due to the automated feature selection procedure, some observations resulted in only having NaN values. Such records were removed by the dataset before the third step of the training: this resulted in models trained on different classes sizes, as reported in the last column of each table. Sensitivity and specificity were computed by considering PT as the “positive” class and ET as the “negative” one, although there is no specific reason explaining this choice (the two classes could be switched).
3.3. Power Features-Based Classifiers
Similar to what was reported in the previous one, datasets used in this subsection were generated from the feature extraction process described in Section 2.3.3. Both the acceleration and the angular rates data sets contained a total of 21 features: 5 per each task’s PSD, plus the Relative Power. In addition, a new dataset with a total of 42 features was generated by merging the acceleration-based and the angular rates-based ones.
Table 9, Table 10 and Table 11 report the optimal classifiers trained with the acceleration dataset, the angular rate dataset, and the mixed one, respectively. The table structure resembles the one used for the previous subsection. In this case, no observation included NaN values, as such all the models were trained with the very same classes size: 17 observation for PT, 7 for ET.
3.4. Healthy vs. Tremor-Affected Subjects Analysis
In order to have a first insight about how control cases could have been differentiated from tremor-affected subjects, the frequency spectra of signals related to both categories were compared, as depicted in Figure 4. As can be noticed, the absence of tremor in control cases clearly results in lower signals power and, as a consequence, in lower frequency spectra than the tremor-affected ones (those from tasks 1 or 2, depending on the tremor type).
The feature extraction process based on the spectrum fit approach resulted in 12 out of 14 observations characterized by having NaN values only (thus with no valid feature available), independently of the data source. This result was expected, confirming that hands’ movements of healthy subjects do not show remarkable frequency components in the tremors band of interest: as such, no Gaussian curve could be fit, and no classifier could be built due to the lack of valid features. However, although the spectrum fit approach alone would seem sufficient to differentiate control cases and tremor-affected subjects due to the observed behavior (12 out of 14 potentially classified correctly), it is not advisable to base the classification response on a non-identification as the NaN values: such result might be due in fact either to non-expected scenarios or to some fit problems.
On the other hand, several features were extracted from the power spectral densities of accelerometer and gyroscope data, and then used to create three different datasets (one per sensor, and one including both). Then, features from the datasets of the two populations were joined, and the “PT” and “ET” categories were merged to form one label only, named “Patient”. As a result, three datasets consisting of 38 observations (24 tremor-affected subjects and 14 healthy subjects) were built and used to train several classifiers according to the methods described in Section 2.4: Table 12 reports the out-of-sample accuracies of the resulting models, for each learner and dataset used (for the sake of brevity, selected features and optimized hyperparameters were omitted).
4. Discussion
4.1. Feature Extraction Approaches
The spectrum fit approach was performed by using three different data sources: orientation, accelerations, and angular rates. The correlation indexes and significance test results support the hypothesis of data sources being interchangeable, thus potentially reducing the computational cost of an embedded classification algorithm. The estimated center of the peaks correctly fall in the proper frequency range for both Parkinsonian and essential tremors. Moreover, data collected during the execution of the resting task show a predominance of Parkinsonian tremors over ET, whereas data provided from postural and kinetic tasks highlighted the presence of essential tremor in the subject, as expected. Nevertheless, this feature extraction approach suffers from several issues due to the Gaussian curve fitting.
One of the main problems is that this technique relies on the hypothesis that a tremor spectrum can be always described by means of a “bell” shaped curve. However, this is not always possible. In some cases (see Figure 5a), the tremor spectrum had a quasi-flat-top trend, thus the fitted Gaussian curve spanned over an interval wider than the actual range of interesting frequencies, and the curve peak was not correctly identified: although curves with a width larger than a predefined threshold were excluded from the dataset during the training phase, the risk of misclassifying that tremor is high if subjects will show tremor spectra similar to the excluded ones.
A second problem is related to the quality of the fit. In some cases, a few small peaks around the spectrum’s dominant peak induced the fit process to produce a wider and lower curve, thus underestimating the actual height of the dominant peak (see Figure 5b). This could be avoided by reducing the fit interval to a neighborhood of the dominant (maximum) peak, the size of which could be defined a priori (for instance, 1 Hz per side). However, this trick would work only for sharp dominant peaks (it could potentially lead to the exclusion of part of a wider peak) and would be dependent on the size of the fit interval (it may still include undesired peaks). For these main reasons, the more general approach represented by the second feature extraction strategy should be preferred.
4.2. Classifier Performance
The training procedure produced several classifiers able to differentiate among Parkinsonian tremor and essential tremor on the basis of features extracted from different signals and approaches. The use of multiple sensors is usually preferred in an acquisition system, as this increases the available data: this, in turn, can help to improve the quantity and the quality of extracted information. Nevertheless, in miniaturized acquisition systems such as wearable devices, the area occupancy and the power consumption of a sensor are two important factors that may overcome the choice of having more data available. Thus, many wearable devices do not provide both the sensors used in this work (namely, accelerometer and gyroscope), or alternatively the full product comes with a high price. In order to investigate the portability of the developed algorithms and to determine their reliability when some sensors are not available, three different feature sets were built from each extraction approach: two datasets were based on raw data collected by means of accelerometer and gyroscope, respectively, while the third one contained information from both data sources. For each learning algorithm, feature selection and fine hyperparameters tuning were performed to obtain a good predictive model. Finally, the cross-validation resulted in the accuracies reported in the previous tables.
Generally speaking, classifiers based on power-related features performed better than those based on parameters of the fitting Gaussian curves, having on average greater accuracies (91.4% versus 81.6%). These results, along with previously discussed problems associated with this latter approach, lead to preferring the classification based on signal power features with respect to the one based on the spectrum fit.
Regarding datasets based on power features, the feature selection procedure revealed that the most used one is the Peak Power of task 1 (recurring in 9 out of 15 classifiers), followed by Relative Power (4 uses) and Peak Frequency of task 1 (3 uses). These results highlight the importance of the resting task (and partially the postural task) in the differentiation among Parkinsonian and essential tremors, as expected. The goal of task 1, in fact, is to stress the former tremor: in a population of only tremor-affected subjects and for a two class problem, data collected within this task are sufficient to correctly classify almost all subjects. However, the rest of the features, as well as the tasks, might become relevant if the classification problem either extends to other tremor forms, or includes healthy subjects to be classified as such. Using multiple sensors led to better overall performance as expected, with out-of-sample accuracies of models trained with the mixed dataset slightly greater than the ones obtained with data from a single sensor. Specifically, the cross-validation revealed that the worst model trained from the mixed dataset (out-of-sample accuracy: 87.5%) misclassified only 1 out of 17 PT subjects and 2 out of 7 ET subjects, whereas the best ones (out-of-sample accuracy: 95.8%) correctly classified all the ET subjects and failed to classify only 1 out of 17 PT subjects. Despite the lower performance when compared to these latter models, it is however important to underline that solutions based on data either from accelerometer only or gyroscope only still provided good results, with out-of-sample accuracies around 90%: this means that even wearable devices that do not host both these sensors might be used to achieve the results described in this work. Although best results were achieved by Support Vector Machine and Naïve Bayes classifiers, the choice of the final model should take into account not only the estimated prediction accuracy, but also intrinsic features of the specific learning algorithm. Some of these are: training time; interpretability; prediction time; and flexibility. For instance, Support Vector Machine classifiers have typically a high accuracy, but Naïve Bayes classifiers require less training time. On the other hand, both may lack interpretability, an attribute for which decision trees and k-Nearest Neighbors are the best solutions. The authors of this paper reserve the right not to choose the best classifier at the time of writing, since this final decision will depend on several other factors. Firstly, the sample needs to be enlarged with new subjects in order to get a higher number of observations, possibly equal among Parkinsonian and essential tremors. Moreover, the model selection will depend on the computational power of the system that will host it, being either the wearable device itself or the Android system running the classification app.
Finally, as far as the substudy related to differentiation between healthy and tremor-affected subjects concerns, the preliminary accuracies were lower than expected, ranging on average from 80 to 85%. Nevertheless, a good result was achieved by training a decision tree on the feature set based on angular rates, with an out-of-sample accuracy of 92.21% obtained by using two features only, specifically and (see Section 2.3.3 for more details). If considering the “Patient” label as the positive class and the “Control” label as the negative class, the model’s k-fold sensitivity and specificity were 95.83% and 85.71%, respectively: this means that only one tremor-affected subject out of 24 was misclassified as healthy, and two control cases out of 14 were misclassified as trembling. Such results are encouraging, but further investigations are needed in the near future (1) to assess whether or not new stronger features are necessary, and (2) to possibly modify the model optimization procedure (e.g., changing the metric used in the feature selection process). Moreover, parallel to the enlarging of the subjects sample size already foreseen, new healthy subjects will be recruited to increase the range of control cases.
During the last few years, several monitoring systems and approaches have been proposed by researchers to enable the differentiation between essential and Parkinsonian tremors. For instance, di Biase et al. [27] defined a new metric called “tremor stability index” to discriminate such tremors with high diagnostic accuracy. The presented index was based on the distribution of changes in the tremor frequency over time: such information was measured by means of a triaxial accelerometer taped on the wrist of the monitored subject during the execution of the aforementioned rest and postural tasks (see Section 2.2). The system was tested in a cohort of 36 patients affected by PT and ET, and it was validated on a second cohort comprising 55 further subjects: the diagnostic accuracy, assessed by binary logistic regression and by receiver operating characteristic analysis, was about 90%. A similar study conducted by Barrantes et al. [28] involved the use of a smartphone’s accelerometer to measure time-frequency differences between PT an ET. The study was carried out in a cohort of 52 subjects comprising patients affected by ET and PT, healthy subjects and patients with tremor of undecided diagnosis. The smartphone was placed on the back of the hand presenting the tremor and recorded 30 s of resting and postural tasks each. The data analysis was performed in the frequency domain, and a simple classifier was trained on the extracted discriminative features. The developed system correctly classified 49 out of 52 subjects in the category with/without tremor and 27 out of 32 patients in the category PD/ET, with a discrimination accuracy of 84.38%. The study presented in this document shares some aspects with such studies. In fact:
- The used measuring systems were based on an accelerometer, it being either embedded in a dedicated device or in a smartphone;
- The monitored tasks were resting and postural ones;
- The conducted analyses were based on the frequency features of the tremors.
Nevertheless, this work enriches the past studies with some new items. First, the measuring system not only included a triaxial accelerometer but also a triaxial gyroscope: this additional data source allowed the collection of data of a different nature, which in turn contributed to enhancing the classification accuracies, both ET VS PT and Healthy vs. Tremor-affected subjects ones, as discussed above. Moreover, the small size of the measuring device potentially allows the usage of two devices simultaneously, one mounted on the wrist and one mounted on a finger: this larger sensor network enables the collection of additional information that might be used to improve the differentiation accuracy. Finally, the addition of new tasks to be performed by the subjects increased the range of collectible tremor artifacts: this provided a wider variety of features, which in some cases were proved to be more discriminating than those based on rest and postural tasks only (as in the case of features from task 4 in Healthy/Tremor-affected Subjects differentiation). To conclude, overall results achieved by the study presented in this document are in line with the ones in literature, in some cases being even better: the investigations included in the future developments, such as sample enlargement and training refinement, will aim to strengthen the models robustness and possibly further increase accuracy.
5. Conclusions
This paper presented the development of a portable, wearable-based tremor classification system able to differentiate between essential and Parkinsonian tremors. A wireless inertial platform was exploited to build a set of models able to label tremor-related data (collected from the subject’s hand) with accuracies above 80%. Two feature extraction approaches were developed, and three different data sources were investigated, namely orientation, acceleration, and angular speed of the wearable platform. Best results were achieved by classifiers who exploited inertial-based, power-related features, with an average out-of-sample accuracy above 90%: among them, the simultaneous usage of features from multiple sensors led to better performances. The built models will be embedded either in the developed Android app or in the wearable device itself, on the basis of their nature and complexity. Despite the need for enlarging the subject samples to reinforce and support the obtained models, results encourage the extension of the study to other tremor types, in order to increase the differentiation capabilities of the developed system. If its reliability is confirmed, this system will represent a precious tool for clinicians who are not experts in movement disorders (such as General Pratictioners, or even general neurologists) to carry out simple and fast differential diagnosis between two of the major tremor syndromes they may observe in their outpatient clinical practice.
Author Contributions
Conceptualization, D.A.; methodology, P.L. and D.A.; software, P.L.; formal analysis, P.L.; investigation, P.L. and D.A.; writing—original draft preparation, P.L.; writing—review and editing, D.A., G.T. and V.R.; supervision, V.R. All authors have read and agreed to the published version of the manuscript.
Funding
This research received no external funding.
Conflicts of Interest
The authors declare no conflict of interest.
Abbreviations
The following abbreviations are used in this manuscript:
| ET | Essential tremor |
| PT | Parkinsonian tremor |
| PD | Parkinson’s disease |
| PSD | Power spectral density |
References
- Fahn, S.; Jankovic, J.; Hallett, M. Principles and Practice of Movement Disorders; Elsevier Health Sciences: Amsterdam, The Netherlands, 2011. [Google Scholar]
- Dodel, R.; Schrag, A. Health-Related Quality of Life in Movement Disorders. In Handbook of Disease Burdens and Quality of Life Measures; Preedy, V.R., Watson, R.R., Eds.; Springer: New York, NY, USA, 2010; pp. 4013–4034. [Google Scholar] [CrossRef]
- Bhatia, K.P.; Bain, P.; Bajaj, N.; Elble, R.J.; Hallett, M.; Louis, E.D.; Raethjen, J.; Stamelou, M.; Testa, C.M.; Deuschl, G.; et al. Consensus Statement on the classification of tremors. from the task force on tremor of the International Parkinson and Movement Disorder Society. Mov. Disord. 2018, 33, 75–87. [Google Scholar] [CrossRef] [PubMed]
- Albanese, A.; Jankovic, J. Hyperkinetic Movement Disorders: Differential Diagnosis and Treatment; Wiley-Blackwell: Hoboken, NJ, USA, 2012. [Google Scholar] [CrossRef]
- Milanov, I. Electromyographic differentiation of tremors. Clin. Neurophysiol. 2001, 112, 1626–1632. [Google Scholar] [CrossRef]
- Deuschl, G.; Petersen, I.; Lorenz, D.; Christensen, K. Tremor in the elderly: Essential and aging-related tremor. Mov. Disord. 2015, 30, 1327–1334. [Google Scholar] [CrossRef] [PubMed]
- World Health Organization. WHO: Ageing and Life Course. Available online: http://www.who.int (accessed on 5 March 2018).
- He, W.; Goodkind, D.; Kowal, P. An aging world: International population reports. In International Population Reports; U.S. Government Printing Office: Washington, DC, USA, 2016. [Google Scholar]
- Gironell, A.; Ribosa-Nogué, R.; Gich, I.; Marin-Lahoz, J.; Pascual-Sedano, B. Severity Stages in Essential Tremor: A Long-Term Retrospective Study Using the Glass Scale. Tremor Other Hyperkinetic Mov. 2015, 5, 299. [Google Scholar] [CrossRef]
- Hindle, J.V. Ageing, neurodegeneration and Parkinson’s disease. Age Ageing 2010, 39, 156–161. [Google Scholar] [CrossRef] [PubMed] [Green Version]
- Louis, E.; Ottman, R. How Many People in the USA Have Essential Tremor? Deriving a Population Estimate Based on Epidemiological Data. Tremor Other Hyperkinetic Mov. 2014, 4, 259. [Google Scholar] [CrossRef]
- Shanker, V. Essential tremor: Diagnosis and management. BMJ 2019, 366. [Google Scholar] [CrossRef] [PubMed] [Green Version]
- Clark, L.N.; Louis, E.D. Essential tremor. Handb. Clin. Neurol. 2018, 147, 229–239. [Google Scholar] [CrossRef]
- Sternberg, E.; Alcalay, R.; Levy, O.; Louis, E. Postural and Intention Tremors: A Detailed Clinical Study of Essential Tremor vs. Parkinson’s Disease. Front. Neurol. 2013, 4, 51. [Google Scholar] [CrossRef] [PubMed] [Green Version]
- Louis, E.D.; Frucht, S.J.; Rios, E. Intention tremor in essential tremor: Prevalence and association with disease duration. Mov. Disord. 2009, 24, 626–627. [Google Scholar] [CrossRef] [PubMed]
- Kalia, L.V.; Lang, A.E. Parkinson’s disease. Lancet 2015, 386, 896–912. [Google Scholar] [CrossRef]
- Balestrino, R.; Schapira, A. Parkinson disease. Eur. J. Neurol. 2020, 27, 27–42. [Google Scholar] [CrossRef] [PubMed]
- Parkinson’s Foundation. Tremor. Available online: https://www.parkinson.org/Understanding-Parkinsons/Symptoms/Movement-Symptoms/Tremor (accessed on 24 August 2020).
- Albanese, A.; Jankovic, J. Distinguishing Clinical Features of Hyperkinetic Disorders. In Hyperkinetic Movement Disorders: Differential Diagnosis and Treatment; Wiley-Blackwell: Hoboken, NJ, USA, 2012; pp. 1–14. [Google Scholar] [CrossRef]
- Dirkx, M.F.; Zach, H.; Bloem, B.R.; Hallett, M.; Helmich, R.C. The nature of postural tremor in Parkinson disease. Neurology 2018, 90, e1095–e1103. [Google Scholar] [CrossRef] [PubMed]
- Louis, E.D. Tremor. Contin. Lifelong Learn. Neurol. 2019, 25, 959–975. [Google Scholar] [CrossRef] [PubMed]
- Iqbal, M.; Aydın, A.; Brunckhorst, O.; Dasgupta, P.; Ahmed, K. A review of wearable technology in medicine. J. R. Soc. Med. 2016, 109, 372–380. [Google Scholar] [CrossRef] [PubMed]
- Greiwe, J.; Nyenhuis, S.M. Wearable Technology and How This Can Be Implemented into Clinical Practice. Curr. Allergy Asthma Rep. 2020, 20, 36. [Google Scholar] [CrossRef] [PubMed]
- Locatelli, P.; Alimonti, D. Differentiating essential tremor and Parkinson’s disease using a wearable sensor—A pilot study. In Proceedings of the 2017 7th IEEE International Workshop on Advances in Sensors and Interfaces (IWASI), Vieste, Italy, 15–16 June 2017; pp. 213–218. [Google Scholar] [CrossRef]
- Locatelli, P.; Alimonti, D. Advances in wearable sensor-based automatic tremor classification. In Proceedings of the 2018 7th International Conference on Modern Circuits and Systems Technologies (MOCAST), Thessaloniki, Greece, 7–9 May 2018; pp. 1–4. [Google Scholar] [CrossRef]
- Welch, P. The use of fast Fourier transform for the estimation of power spectra: A method based on time averaging over short, modified periodograms. IEEE Trans. Audio Electroacoust. 1967, 15, 70–73. [Google Scholar] [CrossRef] [Green Version]
- Di Biase, L.; Brittain, J.S.; Shah, S.A.; Pedrosa, D.J.; Cagnan, H.; Mathy, A.; Chen, C.C.; Martín-Rodríguez, J.F.; Mir, P.; Timmerman, L.; et al. Tremor stability index: A new tool for differential diagnosis in tremor syndromes. Brain J. Neurol. 2017, 140, 1977–1986. [Google Scholar] [CrossRef] [PubMed]
- Barrantes, S.; Sánchez Egea, A.J.; González Rojas, H.A.; Martí, M.J.; Compta, Y.; Valldeoriola, F.; Simo Mezquita, E.; Tolosa, E.; Valls-Solè, J. Differential diagnosis between Parkinson’s disease and essential tremor using the smartphone’s accelerometer. PLoS ONE 2017, 12, e0183843. [Google Scholar] [CrossRef] [PubMed]
Figure 1.
Typical frequency ranges for essential tremor (ET) and Parkinsonian tremors (PT). As can be observed, these ranges partially overlap, thus making the differentiation difficult.
Figure 1.
Typical frequency ranges for essential tremor (ET) and Parkinsonian tremors (PT). As can be observed, these ranges partially overlap, thus making the differentiation difficult.

Figure 2.
(a) the MuSe device; (b) MuSe mounted on the back of the hand by means of an elastic strap.
Figure 2.
(a) the MuSe device; (b) MuSe mounted on the back of the hand by means of an elastic strap.

Figure 3.
A Gaussian curve (orange, solid line) fitting the Fourier representation of quaternions collected from a Parkinsonian subject (blue, dashed line).
Figure 3.
A Gaussian curve (orange, solid line) fitting the Fourier representation of quaternions collected from a Parkinsonian subject (blue, dashed line).

Figure 4.
(a) comparison of power spectral densities from tremor-affected subjects’ and control cases’ acceleration signals. (b) a zoom in of the chart highlighting how spectra related to task 1 and task 2 (dashed lines) are significantly higher in tremor-affected than in healthy subjects (solid lines).

Figure 5.
(a) a case of quasi-flat-top tremor spectrum. The fitted curve has a peak center below 6 Hz, although a dominant peak is evident in the 6 Hz to 7 Hz frequency range; (b) ET spectrum of orientation data, task 2. The fitted Gaussian curve underestimates the spectral peak due to the presence of low peaks in the neighborhood of the dominant one.


Table 1.
Personal data, diagnosis, and tremor dominant hand of subjects who participated in the study. Average age: 72 years (males: 72, females: 70). Number of subjects affected by essential tremor: 7 (males: 5, females: 2). Number of subjects affected by Parkinsonian tremor: 17 (males: 13, females: 4).
| Subject ID | Gender | Age | Tremor Diagnosis | Tremor Dominant Hand |
|---|---|---|---|---|
| 1 | Female | 73 | Essential | Right |
| 2 | Male | 70 | Parkinson | Right |
| 3 | Male | 64 | Parkinson | Right |
| 4 | Male | 69 | Parkinson | Left |
| 5 | Male | 81 | Parkinson | Right |
| 6 | Female | 78 | Parkinson | Left |
| 7 | Male | 77 | Essential | Left |
| 8 | Male | 71 | Parkinson | Left |
| 9 | Male | 49 | Parkinson | Right |
| 10 | Female | 79 | Parkinson | Right |
| 11 | Male | 77 | Essential | Left |
| 12 | Male | 80 | Essential | Left |
| 13 | Female | 88 | Parkinson | Left |
| 14 | Male | 84 | Parkinson | Left |
| 15 | Male | 73 | Parkinson | Right |
| 16 | Male | 74 | Essential | Left |
| 17 | Male | 81 | Essential | Right |
| 18 | Male | 67 | Parkinson | Left |
| 19 | Male | 77 | Parkinson | Right |
| 20 | Female | 31 | Essential | Right |
| 21 | Male | 67 | Parkinson | Left |
| 22 | Female | 73 | Parkinson | Right |
| 23 | Male | 69 | Parkinson | Left |
| 24 | Female | 66 | Parkinson | Left |
Table 2.
Quartiles of Gaussian curve parameters a, b and c from gyroscope data.
| Parameter | PT | ET | ||||
|---|---|---|---|---|---|---|
| # | # | |||||
| a (dps) | 5.78 | (2.06; 14.84) | 54 | 6.43 | (1.78; 14.02) | 19 |
| b (Hz) | 5.68 | (4.71; 6.36) | 54 | 6.23 | (5.66; 6.79) | 19 |
| c (Hz) | 0.81 | (0.25; 2.22) | 54 | 0.85 | (0.35; 1.28) | 19 |
dps: degrees per second; Hz: Hertz; : Median value; : First, and third distribution quartiles.
Table 3.
Quartiles of Gaussian curve parameters a, b and c from gyroscope data, grouped by task.
| Task | Parameter | PT | ET | ||||
|---|---|---|---|---|---|---|---|
| # | # | ||||||
| 1 | a (dps) | 10.41 | (2.92; 25.62) | 17 | 0.78 | (0.43; 1.63) | 4 |
| b (Hz) | 4.88 | (4.40; 5.48) | 17 | 5.84 | (5.26; 6.53) | 4 | |
| c (Hz) | 0.25 | (0.15; 0.69) | 17 | 0.70 | (0.14; 1.80) | 4 | |
| 2 | a (dps) | 7.42 | (1.23; 19.68) | 14 | 6.43 | (4.82; 18.11) | 5 |
| b (Hz) | 6.16 | (4.90; 6.61) | 14 | 6.23 | (5.70; 6.60) | 5 | |
| c (Hz) | 0.56 | (0.20; 1.61) | 14 | 0.51 | (0.24; 1.17) | 5 | |
| 3 | a (dps) | 5.96 | (4.35; 8.94) | 11 | 14.04 | (11.43; 17.30) | 5 |
| b (Hz) | 6.31 | (5.78; 7.07) | 11 | 6.82 | (6.43; 6.87) | 5 | |
| c (Hz) | 2.06 | (1.53; 2.96) | 11 | 1.25 | (1.10; 1.63) | 5 | |
| 4 | a (dps) | 2.46 | (0.99; 5.22) | 12 | 7.78 | (2.75; 13.85) | 5 |
| b (Hz) | 5.86 | (5.17; 6.33) | 12 | 5.83 | (5.29; 6.78) | 5 | |
| c (Hz) | 2.08 | (0.59; 3.49) | 12 | 0.46 | (0.37; 1.31) | 5 | |
dps: degrees per second; Hz: Hertz; : Median value; : First, and third distribution quartiles.
Table 4.
Correlation indexes among different data sources, for each parameter (a, b, c) and task. Values in brackets represent the p-values obtained from the significance tests, under the null hypothesis of correlation being equal to zero ( = 0.05).
Table 4.
Correlation indexes among different data sources, for each parameter (a, b, c) and task. Values in brackets represent the p-values obtained from the significance tests, under the null hypothesis of correlation being equal to zero ( = 0.05).
| Task | Parameter | r (p-Value) | ||
|---|---|---|---|---|
| Quat VS Acc | Quat VS Gyro | Acc VS Gyro | ||
| 1 | a | 0.94 (0.00) | 0.98 (0.00) | 0.95 (0.00) |
| b | 0.85 (0.00) | 0.87 (0.00) | 0.99 (0.00) | |
| c | 0.75 (0.00) | 0.65 (0.00) | 0.93 (0.00) | |
| 2 | a | 0.99 (0.00) | 0.99 (0.00) | 0.99 (0.00) |
| b | 0.94 (0.00) | 0.92 (0.00) | 0.98 (0.00) | |
| c | 0.91 (0.00) | 0.98 (0.00) | 0.93 (0.00) | |
| 3 | a | 0.96 (0.00) | 0.99 (0.00) | 0.98 (0.00) |
| b | 0.84 (0.00) | 0.84 (0.00) | 0.97 (0.00) | |
| c | 0.89 (0.00) | 0.82 (0.00) | 0.96 (0.00) | |
| 4 | a | 0.52 (0.05) | 0.75 (0.00) | 0.77 (0.00) |
| b | 0.85 (0.00) | 0.69 (0.00) | 0.99 (0.00) | |
| c | 0.61 (0.02) | 0.80 (0.00) | 0.42 (0.10) | |
Quat: Quaternion; Acc: Accelerometer; Gyro: Gyroscope.
Table 5.
Quartiles of power features from gyroscope data.
| Feature | Unit | PT | ET | ||||
|---|---|---|---|---|---|---|---|
| # | # | ||||||
| PP | 53.20 | (6.12; 258.85) | 68 | 18.44 | (1.29; 324.96) | 28 | |
| PF | Hz | 5.66 | (4.74; 6.49) | 68 | 6.34 | (5.47; 6.93) | 28 |
| PA | 36.83 | (4.02; 166.13) | 68 | 12.25 | (0.95; 219.60) | 28 | |
| MPF | Hz | 6.02 | (4.97; 6.75) | 68 | 6.79 | (5.82; 7.14) | 28 |
| TP | 88.61 | (12.29; 280.81) | 68 | 32.76 | (3.92; 370.64) | 28 | |
| RP | - | 0.58 | (0.23; 98.16) | 17 | 0.01 | (0.01; 0.02) | 7 |
dps: degrees per second; Hz: Hertz; : Median value; : First, and third distribution quartiles.
Table 6.
Classification models trained on Gaussian curve parameters a, b, and c from acceleration dataset. Parameters’ subscripts indicate the task number.
Table 6.
Classification models trained on Gaussian curve parameters a, b, and c from acceleration dataset. Parameters’ subscripts indicate the task number.
| Learner | Feature Set | Hyperparameters | Accuracy | Sensitivity | Specificity | # PT/ET |
|---|---|---|---|---|---|---|
| kNN | Neighbors Number: 9 | 82.4% | 100.0% | 40.0% | 12/5 | |
| Distance Metric: cosine | ||||||
| Distance Weight: inverse | ||||||
| SVM | Box Constraint: 3.4968 | 63.6% | 100.0% | 0.0% | 7/4 | |
| Kernel Function: linear | ||||||
| NB | , , | Distribution: normal | 90.9% | 94.1% | 80.0% | 17/5 |
| DA | Type: quadratic | 85.7% | 88.2% | 75.0% | 17/4 | |
| DT | Min Leaf Size: 10 | 77.3% | 100.0% | 0.0% | 17/5 | |
| Split Criterion: deviance | ||||||
kNN: k-Nearest Neighbors; SVM: Support Vector Machine; NB: Naïve Bayes; DA: Discriminant Analysis; DT: Decision Tree.
Table 7.
Classification models trained on Gaussian curve parameters a, b, and c from angular rate dataset. Parameters’ subscripts indicate the task number.
Table 7.
Classification models trained on Gaussian curve parameters a, b, and c from angular rate dataset. Parameters’ subscripts indicate the task number.
| Learner | Feature Set | Hyperparameters | Accuracy | Sensitivity | Specificity | # PT/ET |
|---|---|---|---|---|---|---|
| kNN | Neighbors Number: 8 | 87.5% | 90.9% | 80.0% | 11/5 | |
| Distance Metric: city block | ||||||
| Distance Weight: inverse | ||||||
| SVM | Box Constraint: 2.2712 | 81.0% | 100.0% | 0.0% | 17/4 | |
| Kernel Function: linear | ||||||
| NB | , , | Distribution: kernel | 86.4% | 100.0% | 40.0% | 17/5 |
| Kernel Type: Epanechnikov | ||||||
| Width: 0.030354 | ||||||
| DA | Type: linear | 81.0% | 100.0% | 0.0% | 17/4 | |
| Delta: 0.078064 | ||||||
| Gamma: 0.49373 | ||||||
| DT | Min Leaf Size: 3 | 77.3% | 76.5% | 80.0% | 17/5 | |
| Split Criterion: gdi | ||||||
kNN: k-Nearest Neighbors; SVM: Support Vector Machine; NB: Naïve Bayes; DA: Discriminant Analysis; DT: Decision Tree; gdi: Gini’s diversity index.
Table 8.
Classification models trained on Gaussian curve parameters a, b and c from the mixed dataset. Parameters’ subscripts indicate the task number, whereas Acc (accelerometer) and Gyro (gyroscope) indicate the data source.
Table 8.
Classification models trained on Gaussian curve parameters a, b and c from the mixed dataset. Parameters’ subscripts indicate the task number, whereas Acc (accelerometer) and Gyro (gyroscope) indicate the data source.
| Learner | Feature Set | Hyperparameters | Accuracy | Sensitivity | Specificity | # PT/ET |
|---|---|---|---|---|---|---|
| kNN | Acc , Acc , | Neighbors Number: 2 | 86.4% | 94.1% | 60.0% | 17/5 |
| Gyro , | Distance Metric: Spearman | |||||
| Gyro | Distance Weight: inverse | |||||
| SVM | Gyro | Box Constraint: 636.48 | 70.6% | 100.0% | 0.0% | 12/5 |
| Kernel Function: linear | ||||||
| NB | Acc , Acc , | Distribution: normal | 90.9% | 94.1% | 80.0% | 17/5 |
| Acc | ||||||
| DA | Acc | Type: quadratic | 85.7% | 88.2% | 75.0% | 17/4 |
| DT | Acc | Min Leaf Size: 10 | 77.3% | 100.0% | 0.0% | 17/5 |
| Split Criterion: deviance | ||||||
kNN: k-Nearest Neighbors; SVM: Support Vector Machine; NB: Naïve Bayes; DA: Discriminant Analysis; DT: Decision Tree.
Table 9.
Classification models trained on accelerations power features. Parameters’ subscripts indicate the task number.
Table 9.
Classification models trained on accelerations power features. Parameters’ subscripts indicate the task number.
| Learner | Feature Set | Hyperparameters | Accuracy | Sensitivity | Specificity | |
|---|---|---|---|---|---|---|
| kNN | , , | Neighbors Number: 2 | 79.2% | 82.4% | 71.4% | |
| Distance Metric: correlation | ||||||
| Distance Weight: equal | ||||||
| SVM | Box Constraint: 833.91 | 95.8% | 94.1% | 100.0% | ||
| Kernel Function: Gaussian | ||||||
| Kernel Scale: 0.020372 | ||||||
| NB | Distribution: normal | 95.8% | 94.1% | 100.0% | ||
| DA | , | Type: quadratic | 91.7% | 100.0% | 71.4% | |
| DT | Min Leaf Size: 2 | 87.5% | 94.1% | 71.4% | ||
| Split Criterion: gdi | ||||||
kNN: k-Nearest Neighbors; SVM: Support Vector Machine; NB: Naïve Bayes; DA: Discriminant Analysis; DT: Decision Tree; PP: Power Peak; RP: Relative Power; PF: Peak Frequency; MPF: Median Power Frequency; gdi: Gini’s diversity index.
Table 10.
Classification models trained on angular rates power features. Parameters’ subscripts indicate the task number.
Table 10.
Classification models trained on angular rates power features. Parameters’ subscripts indicate the task number.
| Learner | Feature Set | Hyperparameters | Accuracy | Sensitivity | Specificity |
|---|---|---|---|---|---|
| kNN | , , | Neighbors Number: 6 | 87.5% | 94.1% | 71.4% |
| Distance Metric: cosine | |||||
| Distance Weight: inverse | |||||
| SVM | , | Box Constraint: 237.02 | 91.7% | 100.0% | 71.4% |
| Kernel Function: Gaussian | |||||
| Kernel Scale: 0.26942 | |||||
| NB | , | Distribution: normal | 100.0% | 100.0% | 100.0% |
| DA | , | Type: linear | 83.3% | 94.1% | 57.1% |
| Delta: 2.325 × 10⁻⁵ | |||||
| Gamma: 0.42864 | |||||
| DT | Min Leaf Size: 4 | 91.7% | 100.0% | 71.4% | |
| Split Criterion: gdi | |||||
kNN: k-Nearest Neighbors; SVM: Support Vector Machine; NB: Naïve Bayes; DA: Discriminant Analysis; DT: Decision Tree; PP: Power Peak; TP: Total Power; RP: Relative Power; MPF: Median Power Frequency; gdi: Gini’s diversity index.
Table 11.
Classification models trained on both accelerations and angular rates power features. Parameters’ subscripts indicate the task number, whereas Acc (accelerometer) and Gyro (gyroscope) indicate the data source.
Table 11.
Classification models trained on both accelerations and angular rates power features. Parameters’ subscripts indicate the task number, whereas Acc (accelerometer) and Gyro (gyroscope) indicate the data source.
| Learner | Feature Set | Hyperparameters | Accuracy | Sensitivity | Specificity |
|---|---|---|---|---|---|
| kNN | Acc , | Neighbors Number: 11 | 95.8% | 94.1% | 100.0% |
| Gyro | Distance Metric: Chebyshev | ||||
| Distance Weight: inverse | |||||
| SVM | Acc | Box Constraint: 972.96 | 95.8% | 94.1% | 100.0% |
| Kernel Function: Gaussian | |||||
| Kernel Scale: 901.76 | |||||
| NB | Acc | Distribution: normal | 95.8% | 94.1% | 100.0% |
| DA | Acc , | Type: quadratic | 91.7% | 100.0% | 71.4% |
| Acc | |||||
| DT | Acc | Min Leaf Size: 2 | 87.5% | 94.1% | 71.4% |
| Split Criterion: deviance | |||||
kNN: k-Nearest Neighbors; SVM: Support Vector Machine; NB: Naïve Bayes; DA: Discriminant Analysis; DT: Decision Tree; PP: Power Peak; TP: Total Power; RP: Relative Power; PF: Peak Frequency; MPF: Median Power Frequency.
Table 12.
Out-of-sample accuracy, sensitivity, and specificity of the “Healthy” vs. “Patients” classifiers, trained on power features-based datasets. Sensitivity and specificity were computed by considering the “Patient” class as the positive one.
Table 12.
Out-of-sample accuracy, sensitivity, and specificity of the “Healthy” vs. “Patients” classifiers, trained on power features-based datasets. Sensitivity and specificity were computed by considering the “Patient” class as the positive one.
| Learner | Accelerometer | Gyroscope | Both | ||||||
|---|---|---|---|---|---|---|---|---|---|
| Acc | Sens | Spec | Acc | Sens | Spec | Acc | Sens | Spec | |
| kNN | 81.6% | 83.3% | 78.6% | 78.9% | 75.0% | 85.7% | 78.9% | 95.8% | 50.0% |
| SVM | 78.9% | 66.7% | 100.0% | 84.2% | 75.0% | 100.0% | 78.9% | 66.7% | 100.0% |
| NB | 81.6% | 79.2% | 85.7% | 84.2% | 79.2% | 92.9% | 84.2% | 87.5% | 78.6% |
| DA | 78.9% | 66.7% | 100.0% | 84.2% | 79.2% | 92.9% | 78.9% | 66.7% | 100.0% |
| DT | 84.2% | 91.7% | 71.4% | 92.1% | 95.8% | 85.7% | 89.5% | 91.7% | 85.7% |
Acc: Accuracy; Sens: Sensitivity; Spec: Specificity; kNN: k-Nearest Neighbors; SVM: Support Vector Machine; NB: Naïve Bayes; DA: Discriminant Analysis; DT: Decision Tree.
Publisher’s Note: MDPI stays neutral with regard to jurisdictional claims in published maps and institutional affiliations. |
© 2020 by the authors. Licensee MDPI, Basel, Switzerland. This article is an open access article distributed under the terms and conditions of the Creative Commons Attribution (CC BY) license (http://creativecommons.org/licenses/by/4.0/).
Share and Cite
MDPI and ACS Style
Locatelli, P.; Alimonti, D.; Traversi, G.; Re, V. Classification of Essential Tremor and Parkinson’s Tremor Based on a Low-Power Wearable Device. Electronics 2020, 9, 1695. https://doi.org/10.3390/electronics9101695
AMA Style
Locatelli P, Alimonti D, Traversi G, Re V. Classification of Essential Tremor and Parkinson’s Tremor Based on a Low-Power Wearable Device. Electronics. 2020; 9(10):1695. https://doi.org/10.3390/electronics9101695
Chicago/Turabian StyleLocatelli, Patrick, Dario Alimonti, Gianluca Traversi, and Valerio Re. 2020. "Classification of Essential Tremor and Parkinson’s Tremor Based on a Low-Power Wearable Device" Electronics 9, no. 10: 1695. https://doi.org/10.3390/electronics9101695
Note that from the first issue of 2016, this journal uses article numbers instead of page numbers. See further details here.