The Ångström Exponent and Single-Scattering Albedo of Black Carbon: Effects of Different Coating Materials


State Key Laboratory of Fire Science, University of Science and Technology of China, Hefei 230026, China
*
Author to whom correspondence should be addressed.
Atmosphere 2020, 11(10), 1103; https://doi.org/10.3390/atmos11101103
Submission received: 7 September 2020
/
Revised: 30 September 2020
/
Accepted: 9 October 2020
/
Published: 15 October 2020
(This article belongs to the Special Issue Carbonaceous Aerosol)
Abstract
:In this work, the absorption Ångström exponent (AAE), extinction Ångström exponent (EAE), and single-scattering albedo (SSA) of black carbon (BC) with different coating materials are numerically investigated. BC with different coating materials can provide explanations for the small AAE, small EAE, and large AAE observed in the atmosphere, which is difficult to be explained by bare BC aggregate models. The addition of organic carbon (OC) does not necessarily increase AAE due to the transformation of BC morphologies and the existence of non-absorbing OC. The addition of coating materials does also not necessarily decrease EAE. While the addition of coating materials can increase the total size of BC-containing particles, the effective refractive index can be modified by introducing the coating materials, so increases the EAE. We found that it is not possible to differentiate between thinly- and heavily-coated BC based on EAE or AAE alone. On the other hand, SSA is much less sensitive to the size and can provide much more information for distinguishing heavily-coated BC from thinly-coated BC. For BC with different coating materials and mixing states, AAE, EAE, and SSA show rather different sensitivities to particle size and composition ratios, and their spectral-dependences also exhibit distinct differences. Different AAE and EAE trends with BC/OC ratio were also found for BC with different coating materials and mixing states. Furthermore, we also found empirical fittings for AAE, EAE, SSA, and optical cross-sections, which may be useful for retrieving the size information based on the optical measurements.
1. Introduction
As an important component in the atmosphere, atmospheric aerosols have great impacts on climate change by absorbing or scattering solar radiation in the atmosphere [1,2]. However, the radiative effects for climate may be varied for different aerosols. Some aerosols (e.g., black carbon (BC), brown carbon (BrC)) may have a positive radiative forcing effect, while others (e.g., sulfates, nitrates) may have a negative radiative forcing effect [3]. The diversities of aerosol effects lead to large uncertainties in the quantification of climate forcing.
For a better understanding of the effect of aerosol, numerous studies have attempted to infer microphysical characteristics of aerosols based on the observed optical properties at multiple wavelengths. Among these optical properties, extinction Ångström exponent (EAE) [4], absorption Ångström exponent (AAE), and single-scattering albedo (SSA) are widely used [5,6]. The knowledge of the spectral dependence of aerosol extinction is rather significant for estimating aerosol forcing and retrieving the microphysical properties of aerosols [7,8]. Due to the varieties of physical and chemical characteristics, the extinction spectral dependence varies among different aerosol types [9]. The extinction spectral dependence can be represented by EAE. The EAE is an effective tool for inferring the aerosol type [8,10]. Kaufman [11] and showed that EAE can be used to estimate the size information of atmospheric aerosol. Schuster et al. [10] found a strong correlation between the EAE and the size distribution of the atmospheric aerosols. Consequently, the EAE can be used for inferring the size information of aerosols [11]. SSA, a sign of the ratio of scattering to absorption, is a commonly used parameter to reflect the contribution of aerosol absorption and scattering to the radiative effects. In addition, it is often used to distinguish absorbing aerosols from non-absorbing aerosols [6]. AAE represents the wavelength dependence of the absorption and is varied in different compositions of absorbing aerosols [12,13,14,15]. A simplistic line of reasoning takes BC AAE to be close to 1 and SSA close to 0.3–0.4, higher values are assumed to indicate the presence of BrC. In addition, the understanding of spectral optical properties is helpful for the estimation of aerosol radiative forcing [16]. Consequently, the knowledge of spectral-dependent radiative properties is significant in climate study.
BC, the strongest aerosol absorber in the atmosphere [17], has become recognized as the second most important anthropogenic contributor after CO to global radiative forcing [18,19]. However, due to the complex morphologies and mixing states, the knowledge on the radiative properties of BC is still limited, especially for the spectral-dependent properties. Therefore, it is imperative to provide further information about the radiative properties of BC. Although measurements can provide reference data for radiative properties of aerosols in different environments, it has less ability to reveal how the complex radiative properties are caused. Moreover, as measurements are not available in all circumstances, numerical calculations can be supplements for measurements. EAE of BC is quite sensitive to the size distribution and a range of 1.10–1.63 for BC aggregates was reported by Li et al. [20] and Smith et al. [21], and the range is wide for estimating the radiative forcing. SSA of bare BC aggregates is commonly within 0.1–0.4 [22,23]. However, it is also affected by coating thickness [24]. Even though BC AAE of about 1 is widely accepted, recent studies have shown that there is still large uncertainties due to the complex morphologies, monomer radius, BC refractive index, and coatings [20,25,26]. Li et al. [20] showed the size distribution and BC shape have great impacts on AAE; Liu et al. [25] demonstrated that BC AAE is also affected by BC refractive index; Conrad and Johnson [26] showed that both BC refractive index and monomer radius can affect BC AAE.
The most commonly used radiative parameterizations assuming that BC aerosols are represented by a spherical structure, while observations often show an aggregate structure for BC [27,28,29]. Freshly emitted BC aggregates are widely assumed to present a fractal structure, while BC can mix with other chemical materials with atmospheric aging, so leads to more complex structures [28,30,31]. Although numerous studies have investigated the radiative properties of BC with various structures [32,33,34], they mostly focused on the optical cross-sections, and the understanding of BC AAE, EAE, and SSA is still rather limited. Table 1 summarizes the recent studies on the numerical investigation of AAE, EAE, and SSA of BC. Limited studies have investigated the AAE, EAE, and SSA of black carbon under a real size distribution. Even though Kahnert et al. [35] and Liu and Mishchenko [36] have investigated the AAE and EAE of BC with non-absorbing coatings, their studies are based on a single particle. In the atmosphere, numerous particles exist. BC sizes are not fixed and commonly present a distribution. A single particle model cannot give results that are representative of the remote sensing related AAE, EAE, and SSA values. To connect the modeling with the observations, there is a need to calculate the bulk optical properties of BC under a real size distribution. Therefore, in recent years, some studies have investigated the optical properties of BC under real size distributions. For example, Li et al. [20] have investigated BC morphological effects on AAE and EAE, while coated BC was not considered. Liu et al. [25] have investigated the AAE of heavily-coated BC, while just non-absorbing coatings were considered and EAE was not investigated. BC is greatly possible to mix with different materials, including non-absorbing materials, and strong spectral dependent organic carbon, namely brown carbon (BrC). A recent study conducted by Zhang et al. [37] have investigated the AAE of BC with brown coatings, while the coating structures were assumed to be spherical, and just partially-coated and heavily-coated BC were considered. In many cases, BC is coated with a thin layer of non-BC materials, and the coating structures are not spherical [38]. BC morphology can vary with atmospheric aging. In addition, Zhang et al. [37] did not compare the AAE difference of BC with different coating materials, and EAE was not investigated. So there is a need to investigate different AAE and EAE of BC with different coating materials. SSA, another parameter widely used in remote sensing, is important to infer the aerosol type. As shown in Table 1, the numerical investigation of BC SSA was commonly based on the single BC, and limited studies have investigated the SSA of coated BC under a real size distribution. In addition, in remote sensing, some AAE, EAE, and SSA values are used, while rather limited studies have noticed spectral dependences. This should be carefully noticed, as AAE, EAE, and SSA are often measured in different wavelengths in various literature. To give an implication for the use of AAE, EAE, and SSA values in different studies, there is a need to investigate the spectral-dependences AAE, EAE, and SSA.
As AAE, EAE, and SSA are commonly used to infer aerosol types, it is important to understand the different features of AAE, EAE, and SSA of different aerosols. However, there are few studies that compare the distinct difference of AAE, EAE, and SSA for BC with different coating materials and different mixing states. With the atmospheric aging, the coating materials can increase and BC morphologies become more compact, so we used two types of BC to represent BC at different aging status. As some inversion techniques are being developed to infer the microphysical properties of carbonaceous particles, the understanding of the distinct properties of BC with different coating materials, and different aging status seem to be very important. In this work, we intend to answer the following questions:
- How the observed AAE, EAE, and SSA are affected by coating materials and mixing states?
- What is the difference between BC with different coating materials?
- What is the difference between BC with different aging status?
- Can we find an empirical fitting to characterize all the spectral-dependent radiative properties?
In this work, bulk AAE, EAE, and SSA of BC with different coating materials and mixing states are investigated using typical size distributions measured in the atmosphere. The effects of coating materials are investigated by assuming two types of coatings: BrC coatings and non-absorbing coatings. The different impacts of the particle size and wavelength dependence are also demonstrated for different coating materials and mixing status. Our results may be helpful for aerosol discrimination and inferring BC radiative properties at multiple wavelengths.
2. Methodology
2.1. Shape and Mixing States of BC
Current remote sensing techniques commonly assume aerosols to be spherical, as the calculations can be executed using the Mie theory [50,51,52]. However, the spherical assumption for aerosol does not reflect reality. Non-spherical aerosols exist in many conditions [53,54]. Especially, BC radiative properties are largely affected by their morphologies [29,55]. Therefore, the non-sphericity of BC should be carefully considered. Freshly emitted BC is composed of numerous monomers, and the fractal law is widely accepted to describe the shape [56]:
where and R represent the monomer number and monomer radius; and are the fractal prefactor and the fractal dimension, respectively; the radius of gyration is denoted by , and denotes the distance between the ith monomer and the center of the cluster.
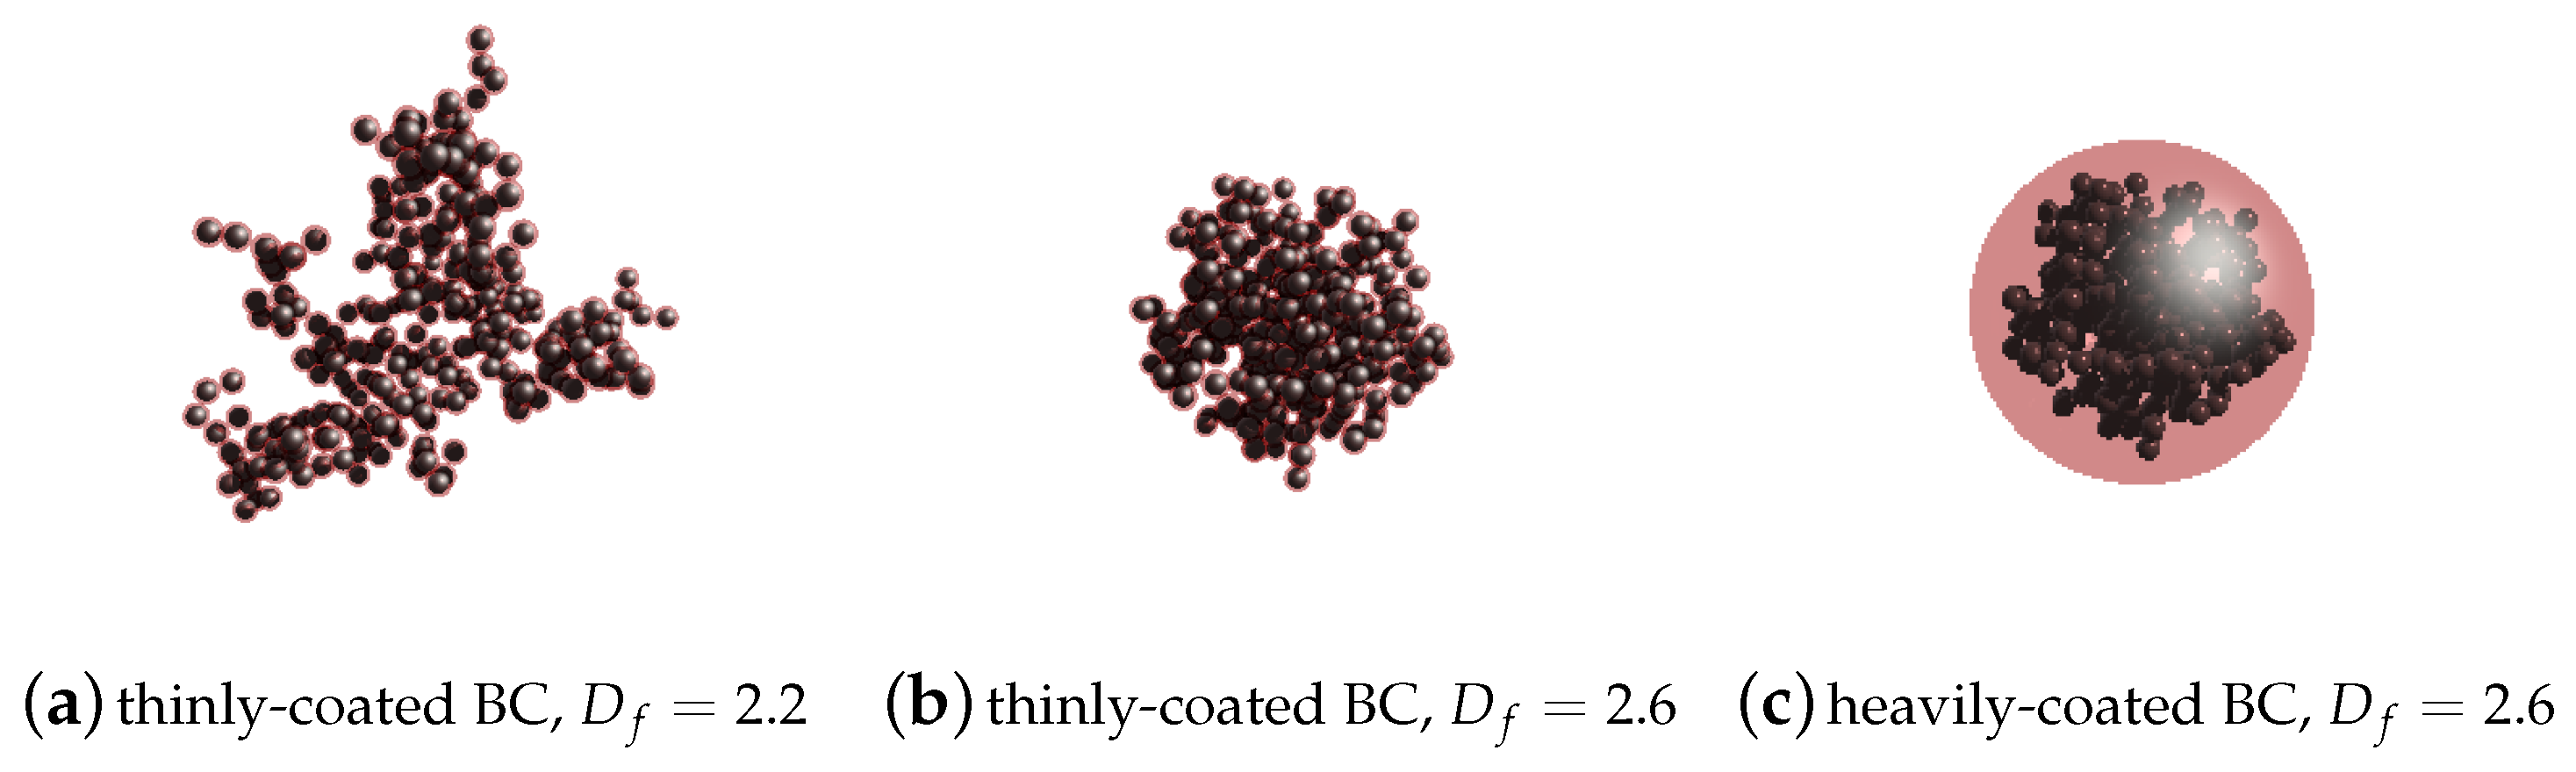
can be used to characterize the compactness of BC aggregates [57,58]. It is well-acknowledged that larger can denote more compact BC aerosols. Freshly emitted aggregates commonly have less than 2.0 [27,59,60]. However, as the particles age, BC can be collapsed to a near-spherical structure [59]. Furthermore, in the aging process, BC tends to be coated with other chemical constituents [33,38,43]. There are two types of coated BC which are commonly observed: thinly-coated BC and heavily-coated BC. BC covered with a thin layer of coatings was assumed to be still a fractal-like structure, and of 1.8–2.6 is considered for thinly-coated BC. However, as the coatings become thicker, BC tends to be nearly spherical particles [17]. Therefore, of heavily-coated BC is assumed to be 2.6. Reported also varies in different studies. Lattuada et al. [61] reported a of 1.17 for diffusion-limited cluster aggregation (DLCA) aggregates; Sorensen [62] show typical fractal aggregates present a of approximately 1.3; Amin et al. [63] obtained a range of 1.68–1.86 in counterflow flames. However, Liu and Mishchenko [22] demonstrated the optical cross-sections don’t change largely as increases from 0.9 to 2.1, and the variation was below 10%. As has less significant effects on the radiative properties of BC, similar to many modeling studies [25,33,38], we used the value of 1.2 suggested by Sorensen and Roberts [58]. Monomer radius is commonly in the range of 10–25 nm [64]. In this work, we mostly focus on the effects of brown and non-absorbing coatings, and the effects of monomer radius were discussed in other studies [22,39,65]. Therefore, the monomer radius is fixed to be 20 nm.
2.2. Generation of BC
Although fractal structures are widely accepted to characterize the shape of freshly emitted BC, as the BC ages, BC becomes more compact and OC materials can condense onto the BC. Therefore, BC can be embedded in an OC shell [28,30]. When the non-BC fraction is low, BC can still present near-fractal structure (referred to as thinly-coated in this study) [30]. As BC is further coated, BC becomes more compact and the coating shell becomes more spherical [17,66]. Eventually, BC is included in an approximately spherical shell (referred to as heavily-coated in this study) [28].
A closed-cell structure was used to represent the thinly-coated soot [67,68,69]. Although the real shape of thinly-coated BC is more complex, a closed-cell structure can characterize the morphology and can be calculated with fast computation speed [24]. In addition, Kahnert [33] demonstrated that the optical cross-sections of the closed-cell model are generally correspondent with those calculated using more morphologically realistic coated models for thinly-coated BC. Moreover, He et al. [70] found optical cross-sections of different models (including the closed-cell model) are in general agreement with laboratory measurements. Therefore, it is acceptable to make some simplification in the model application. However, as coating materials increase, the fractal structure of BC may be damaged. Chakrabarty and Heinson [71] used a complex BC model by assuming that coating materials surround BC to calculate BC optical properties; Ishimoto et al. [72] proposed an internally mixed BC model based on the artificial surface tension; Luo et al. [48] have proposed BC models with different coating materials. However, these models are complex and computationally expensive. So it is widely accepted that the coating structures are spherical [37]. In this work, the heavily-coated BC can be commonly modeled by a shape of a coating sphere covering the BC aggregates [32,43,73], and the partially-coated BC was not considered in this work. In the study of Teng et al. [74], the thinly-coated BC is recognized as a non-ideal minor structure, and an empirical relationship was proposed for optical cross-section, while AAE and EAE were not calculated, and BrC coatings were not considered. In this work, BC is assumed to be thinly-coated as a mass of BC to OC (BC/OC) is larger than 0.375, and is assumed to heavily-coated when BC/OC is less than approximately 0.167, where BC/OC are calculated using:
where , and represent BC mass density, OC mass density, and BC volume fraction (i.e, defined as the ratio of BC volume to whole particle volume), respectively. In this work, is assumed to be 1.8 g/m according to Bond and Bergstrom [64]. Turpin and Lim [75] found that OC mass density was 1.2 g/m for certain regions near Los Angeles, while a lower OC mass density (0.87 g/m) was observed at a background site. By summarizing the literature, Turpin and Lim [75] also found that the measured OC mass density was generally within the range of 0.77 to 1.9 g/m. In this work, we just used the typical value (1.2 g/m) suggested by Turpin and Lim [75], and the uncertainties of OC mass density need to be investigated in the future. We must clarify the thresholds are different for thinly-coated BC and heavily-coated BC. For the thinly-coated BC, the structure was assumed to be fractal aggregates, while for heavily coated BC, the overall structure was assumed to be spherical. However, the BC within the transition between the thinly-coated BC and heavily-coated BC may present more complex structures. So the thresholds were assumed to be different, and more complex structures may be considered in future investigation.
In this work, the bare BC aggregates were generated using a tunable particle aggregation algorithm developed by Woźniak [76]. After the generation of the aggregates, coating materials were added according to previous studies [24,43,77,78]. The typical morphologies are shown in Figure 1. The modeling performances of the thinly-coated and heavily-coated BC have been reported in the study of [31], and the modeling results generally agree with the measurements, so here, we just use the models.
2.3. Refractive Indices (RI) of BC and Coatings
Even though the BC refractive index can vary with wavelengths, it is often assumed to be wavelength-independent from the visible to near-visible spectral bands [64,79]. Here we must clarify that BC refractive index can be varied in a limited range [25]. However, compared with the effects of morphology, the effects of the BC refractive index on the radiative properties are relatively small [70]. In addition, the effects of BC refractive index were discussed in other literature [25]. Our work mainly attempts to demonstrate the effect of different coatings and mixing states, so the BC refractive index is fixed to be a typical value of .
The coatings are classified into two categories: non-absorbing coatings and BrC coatings. For both non-absorbing coatings and BrC coatings, we assume the real part of the refractive index to be a constant 1.5 [80]. The imaginary part of non-absorbing coating RI is fixed to be 0. However, the imaginary part of BrC RI () is rather wavelength-dependent in shorter visible and ultraviolet wavelengths [79,81,82]. is varied in different studies. We assumed the of 0.158, 0.112, 0.0354, 0.001 for four typical wavelengths = 350 nm, 440 nm, 532 nm, and 700 nm by interpolating the reported value of Kirchstetter et al. [83], and we used the values measured by Chen and Bond [84] to analyze the sensitivity of radiative properties to .
For the estimation of the impacts of composition ratios on the BC absorbing, mixed states are assumed to be independent on BC size. Coatings thickness contributes to the size difference between bare and coated BC. Even though real cases are more complex, to analyze the sensitivity of BC radiative properties to the coating thickness, it is easier to discuss the results to make some simplifications.
2.4. Calculation Method
Although many numerical methods such as the multiple sphere T-matrix (MSTM) method [85,86], the discrete dipole approximation (DDA) method [87,88,89], the finite-difference time-domain (FDTD) method [90,91], and the generalized multi-particle Mie (GMM) method [92,93] can be used to calculate the radiative properties of aggregates, we used the numerically exact multiple-sphere T-matrix (MSTM) method [85,86] as it is more computationally efficient than other numerical methods [45]. In this work, we used MSTM version 3.0 [94]. To guarantee the convergence of harmonic order, we have sampled the calculation cases and compared our calculated results with those with a more accurate convergence criterion for Mie expansions and T matrix. We found the deviations are within 0.1%. Using MSTM, we first calculated the absorption efficiency () and scattering efficiency (). Then, the absorption cross-section () and scattering cross-section () can be obtained using:
where denotes the equivalent volume radius of BC aerosols. In this work, randomly oriented aerosols are assumed [95].
2.5. Calculations of Bulk Radiative Properties of BC
The bulk radiative properties of BC were calculated to reflect realistic BC. Given a size distribution of equivalent volume radii (r):
where represents the geometric mean radius and represents the geometric standard deviation [96,97]. Bulk SSA, AAE, and EAE can be calculated using the following equations:
where and are the extinction cross-sections at the wavelengths of and , respectively, and and are the corresponding absorption cross-sections.
We have calculated the optical properties of BC aggregates with monomer number from 1 to 1000. When < 20, the number step size () was 1, = 5, = 10, and = 20 were assumed for the cases of 20 < < 200, 200 < < 600 and > 600, respectively. The and in this work are applied for bare BC, and the total volume of coated BC is the sum of coating materials and bare BC.
3. Results and Discussion
3.1. The Effect of Coating Ratio
Previous studies have shown that the particle size significantly affects the radiative properties of BC [32,39]. Numerous measurements have demonstrated that the lognormal size distribution can greatly fit the realistic BC size distributions [59,98]. Nevertheless, the geometric mean radius () and standard deviation () can be varied in different combustion status and mixing states. According to Li et al. [20], Liu et al. [25], Alexander et al. [82], the typical geometric mean radius of bare BC of 0.05–0.06 m was used, and the standard deviation is varied in a relatively narrow range.
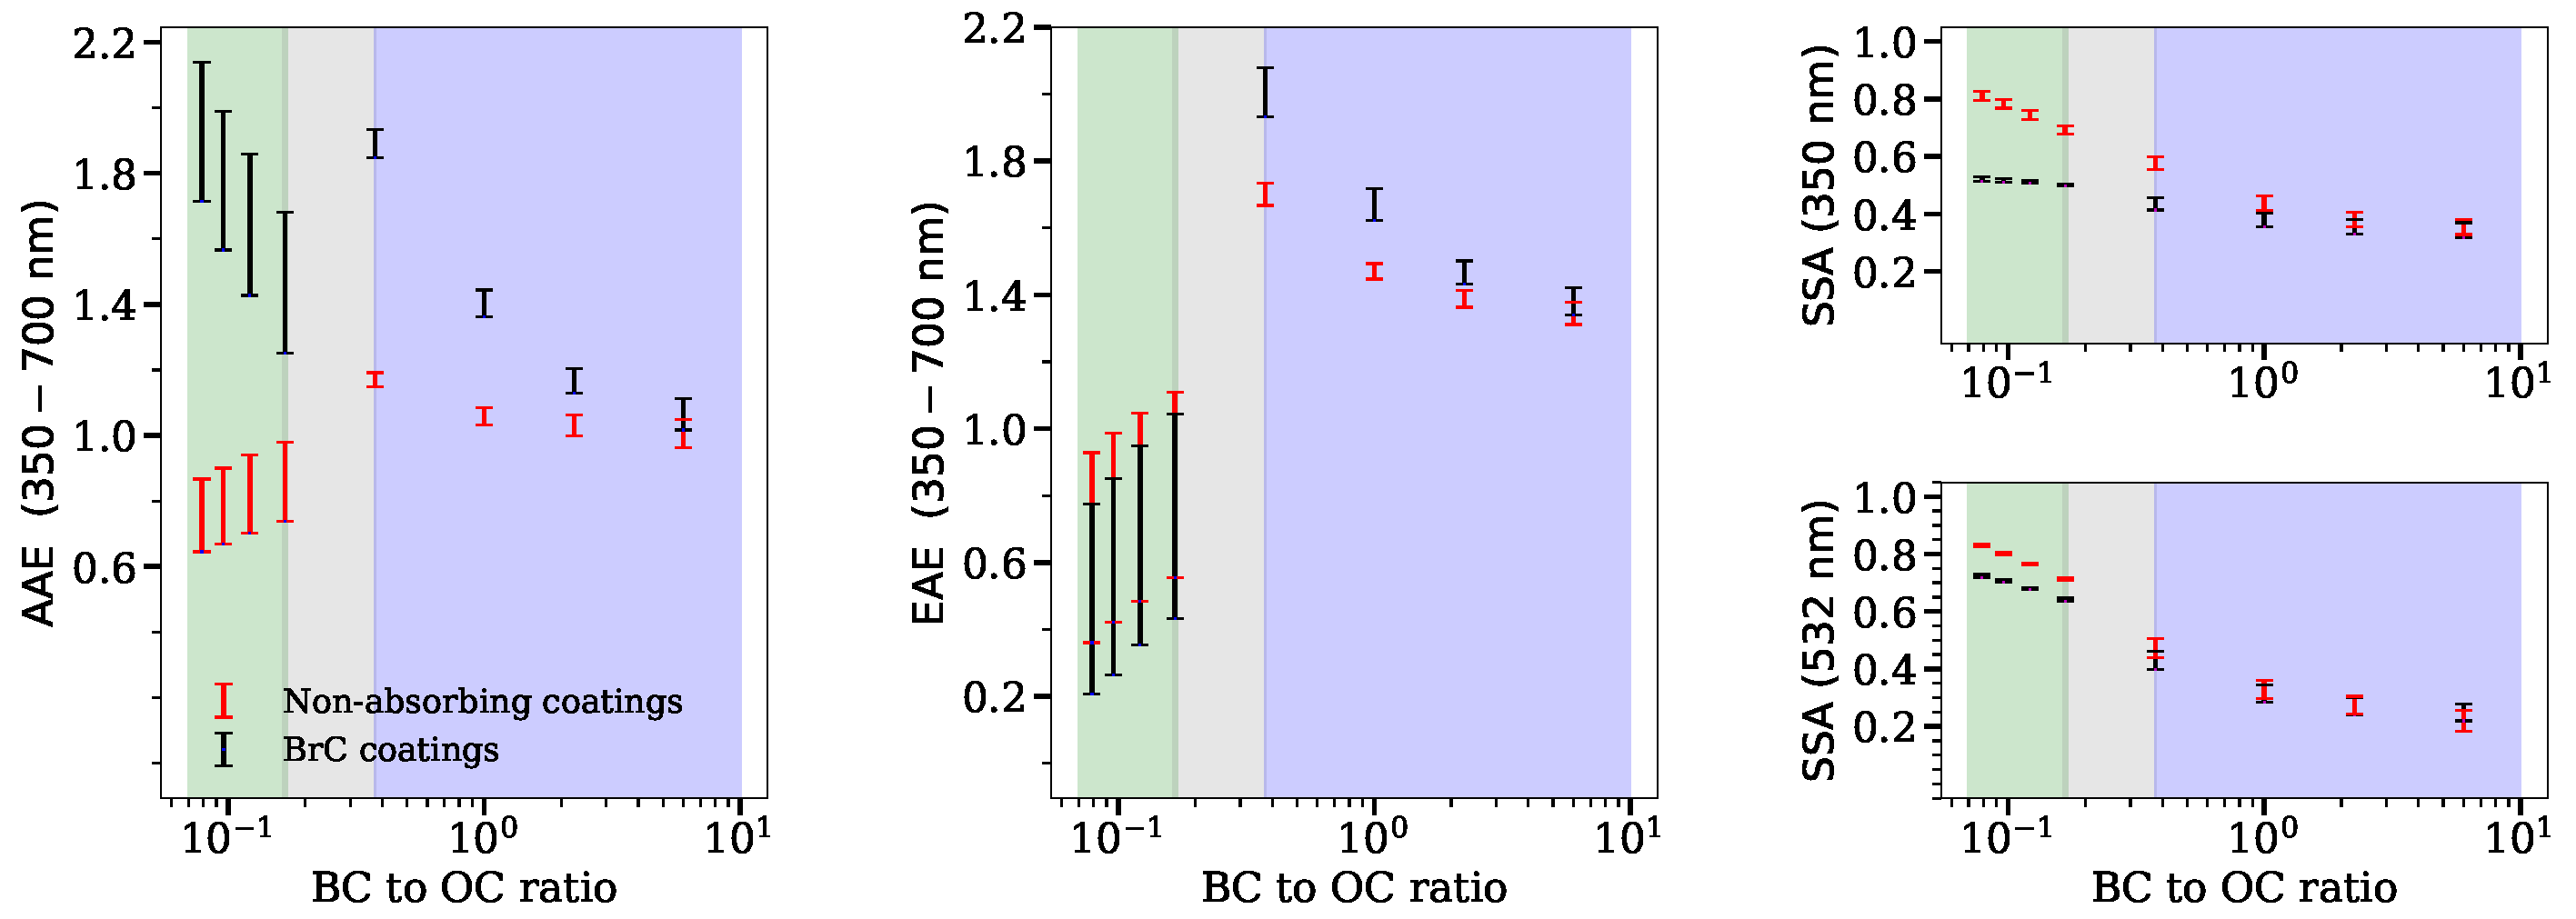
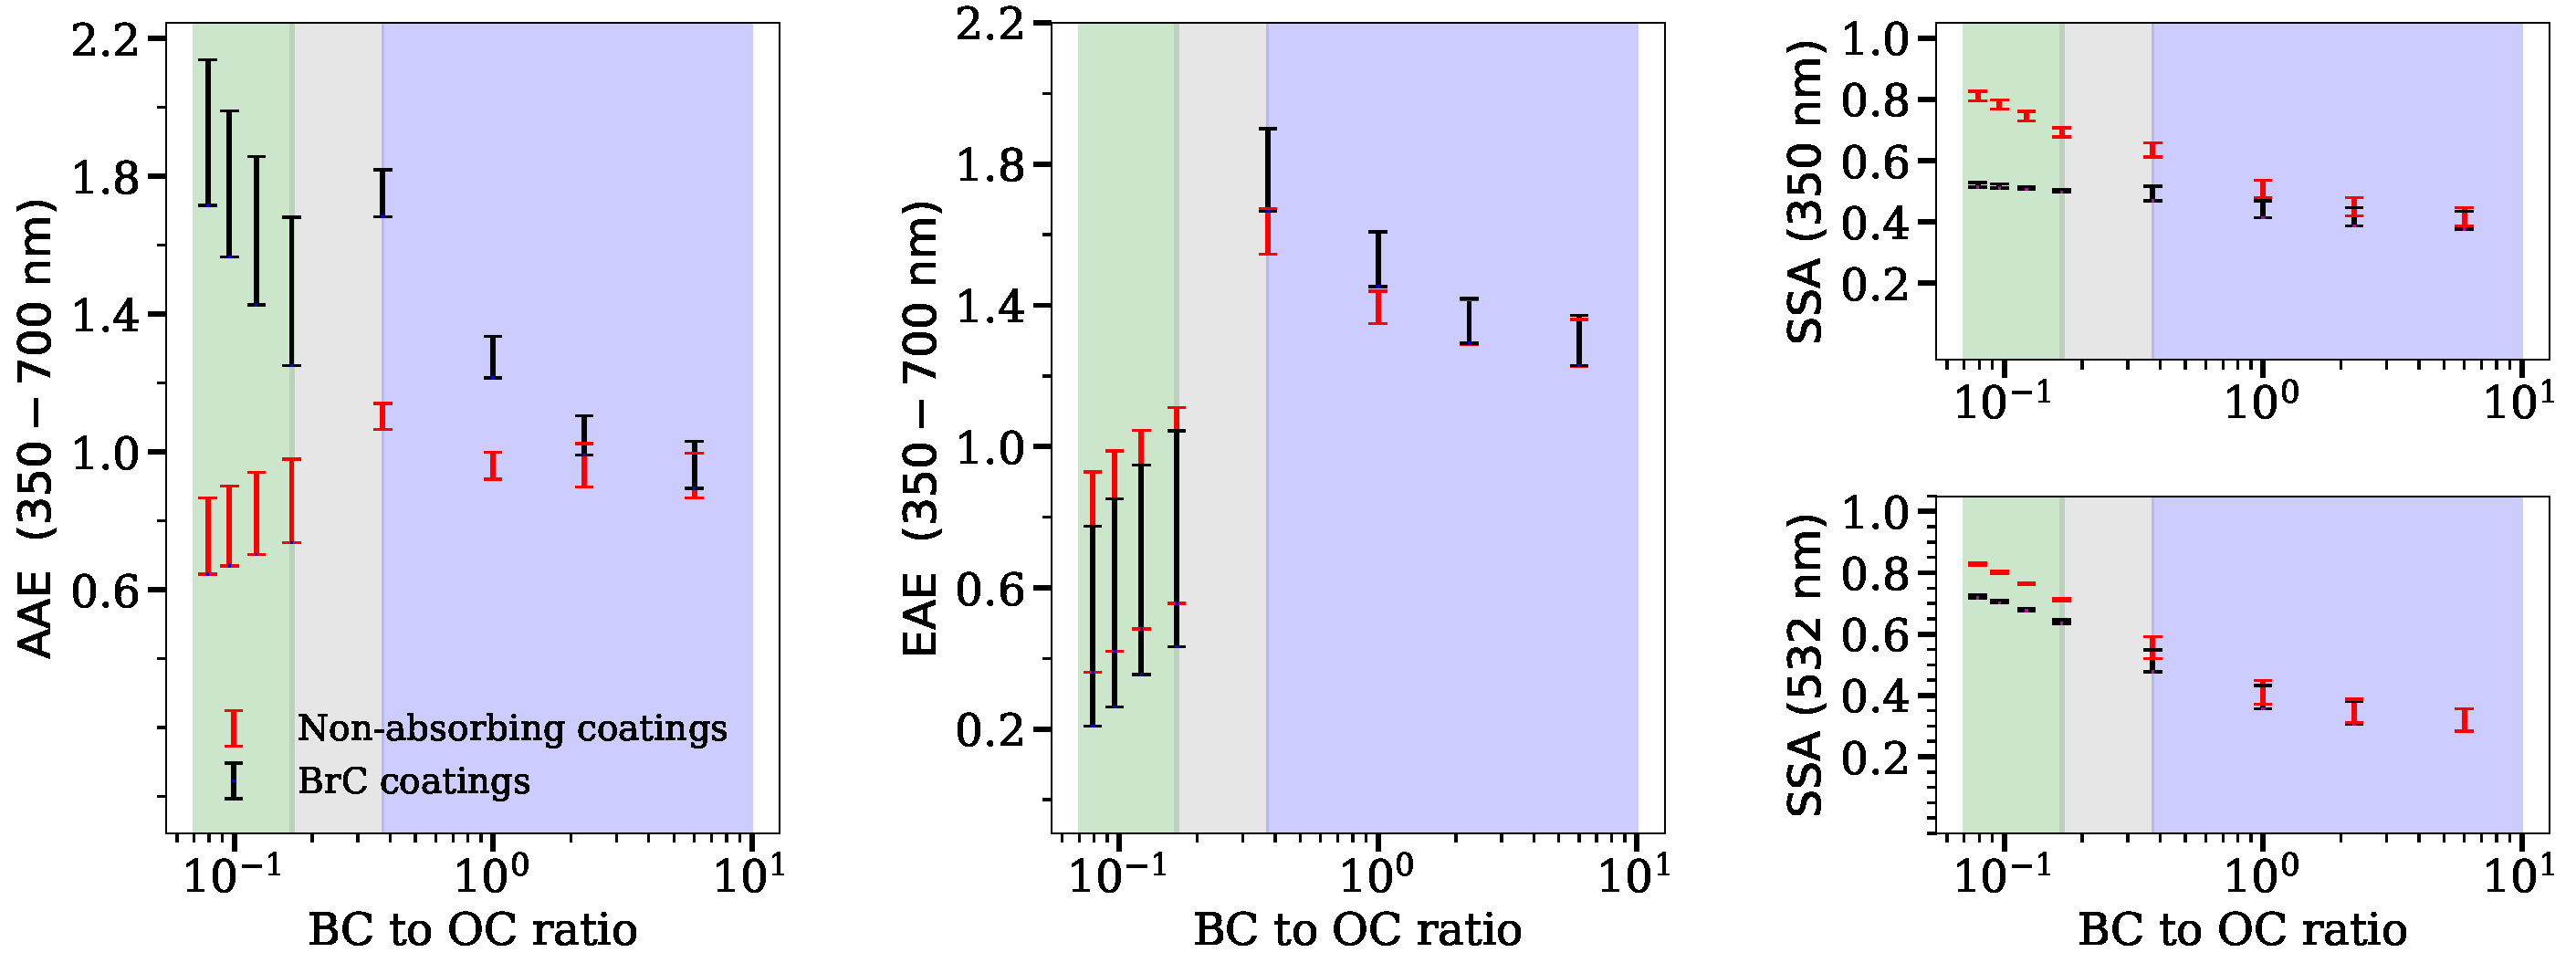
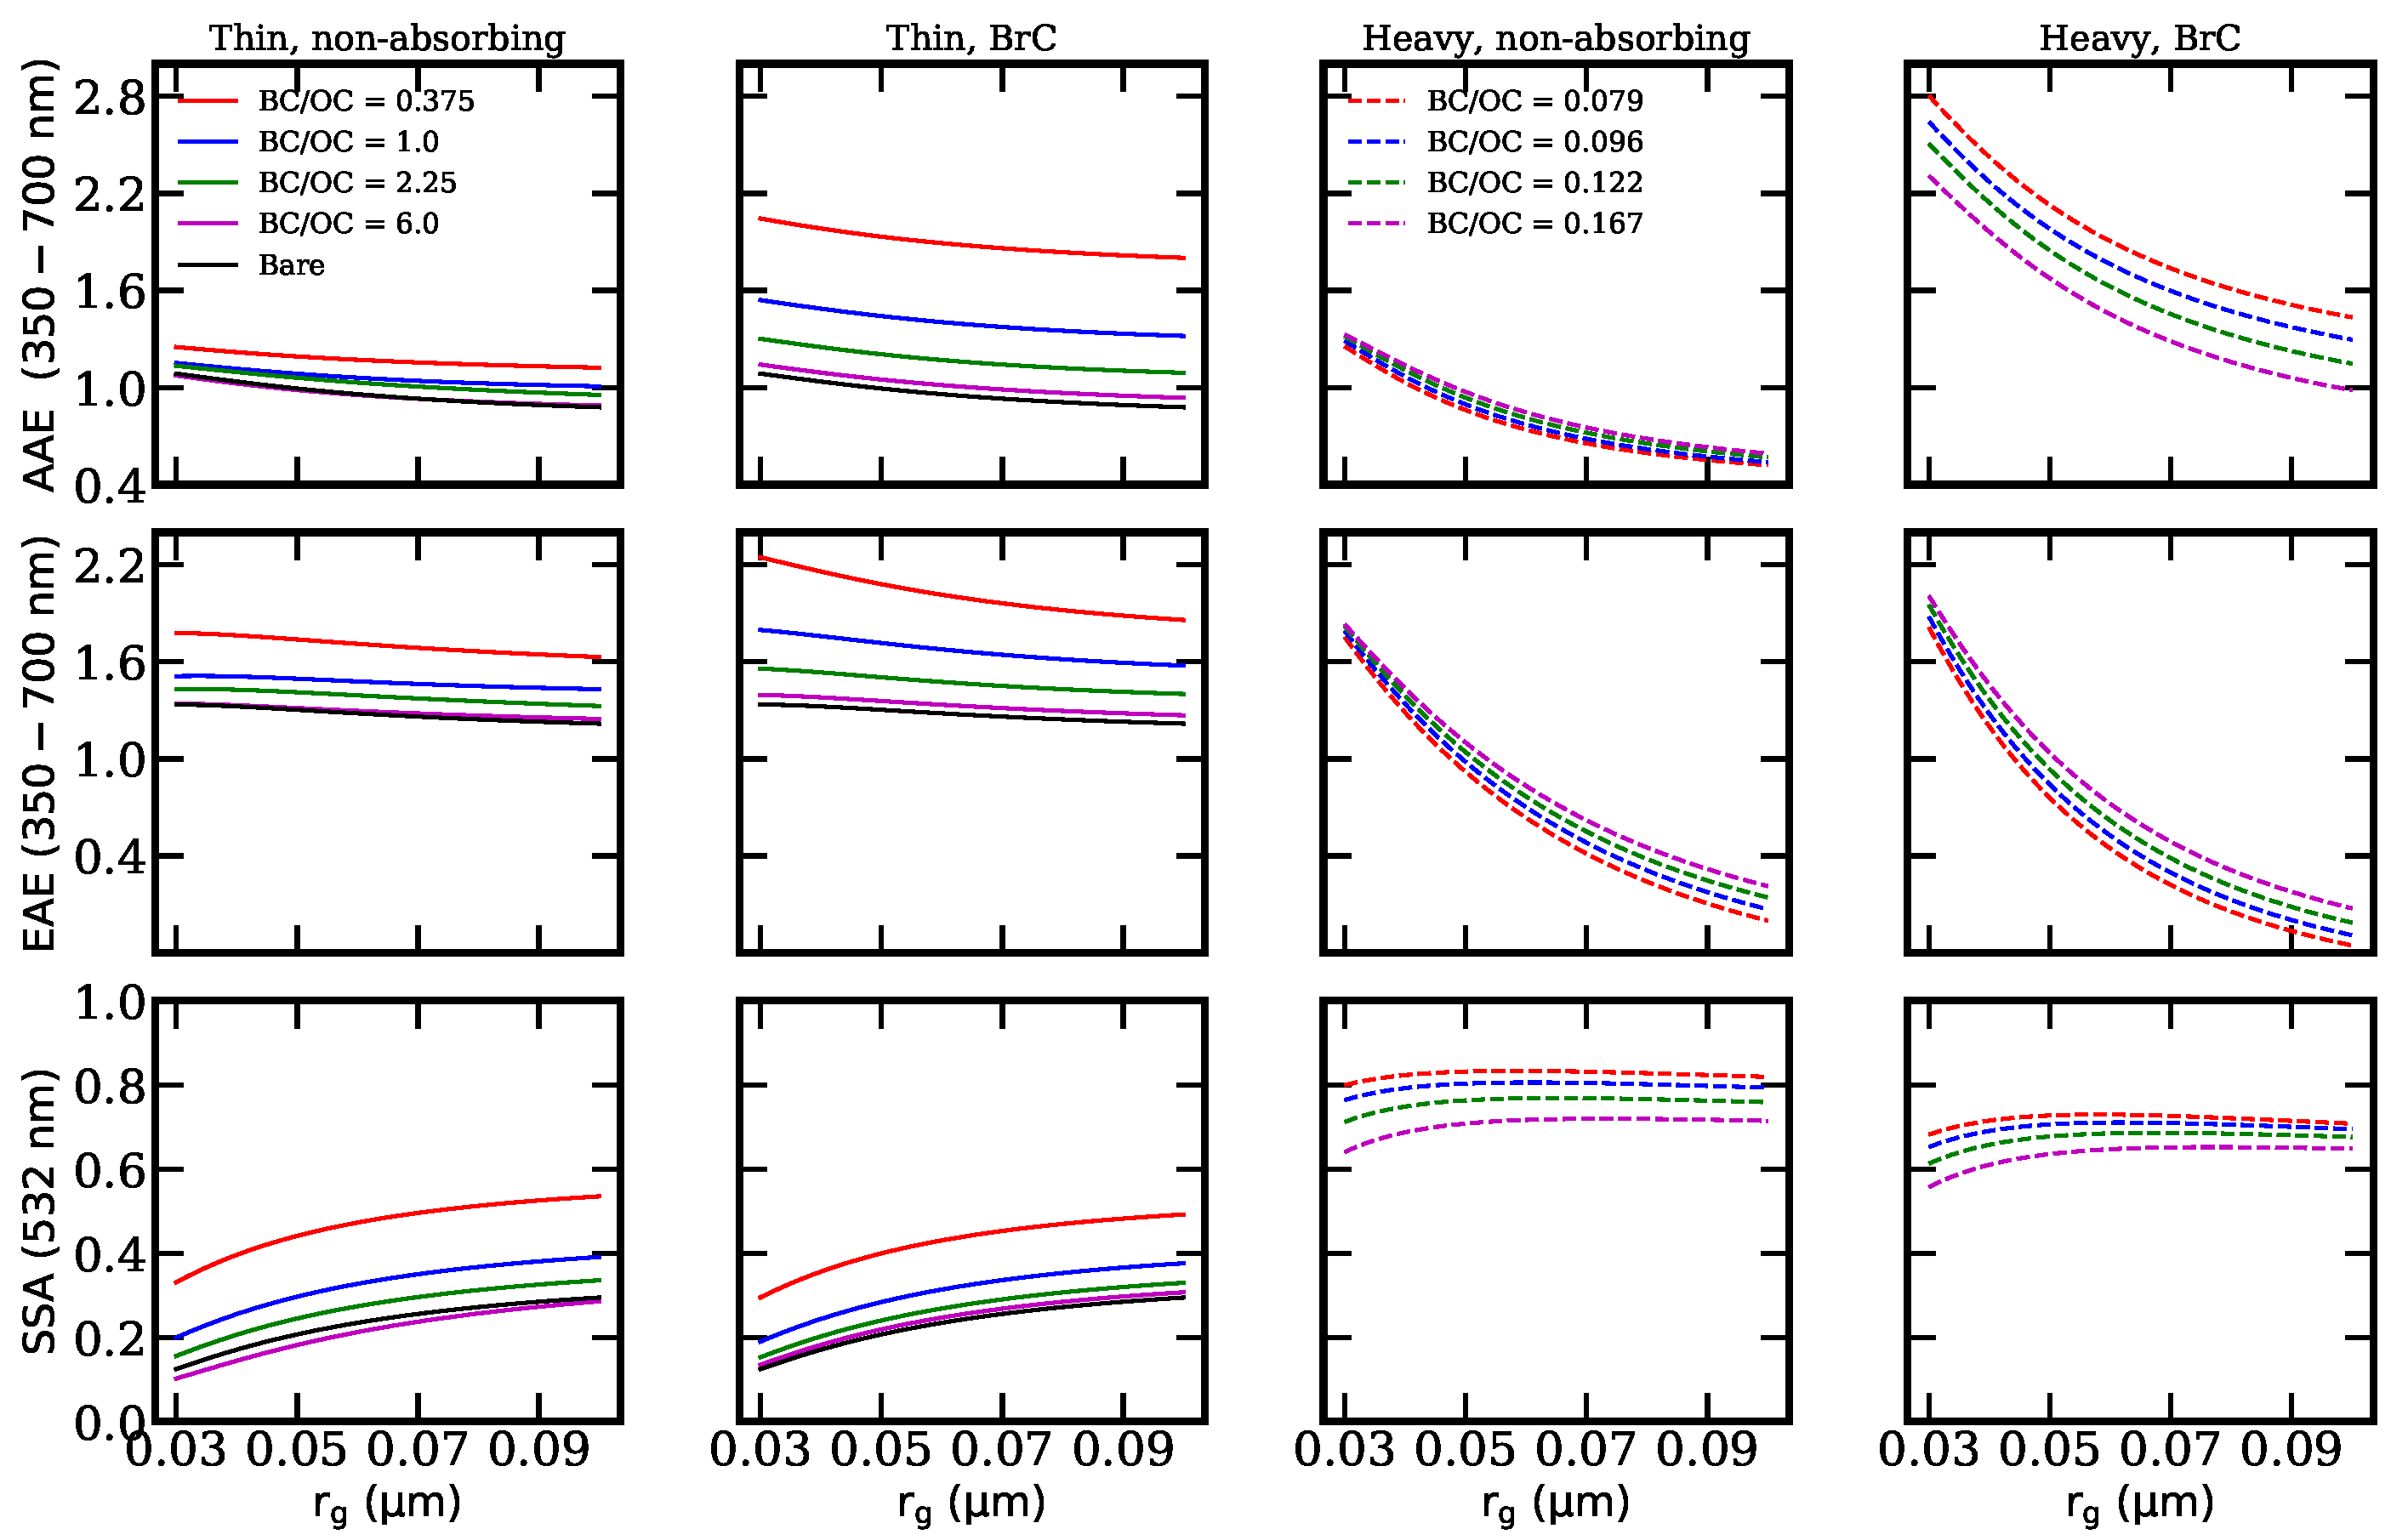
To demonstrate the effects of composition ratios, the AAE, EAE, and SSA for different BC composition ratios are shown in Figure 2. To reflect the real circumstance, the is varied from 0.05 to 0.06 m and varies from 1.5 to 1.7. The minimum equivalent volume radius is 0.02 m and the maximum radius is 0.2 m. The error bars reflect the upper and lower bounds of the calculations using different BC size distributions. According to Adachi et al. [55], embedded BC has an average of . Therefore, the results of are exhibited for thinly-coated BC. For comparison, the results of are shown in Figure 3. While for heavily-coated BC (BC/OC < 0.167), was assumed in this study. To reflect the average AAE and EAE across the visible spectrum, wavelengths of 350 nm and 700 nm are selected.
Li et al. [20] reported that AAE of bare BC aggregates was generally within the range of 0.87–1.50, while a small AAE of approximately 0.6 was measured by Kirchstetter et al. [83]. The existence of coating materials may contribute to the observed small value. Our calculated AAE for heavily-coated BC may provide proper explanations for the small AAE values observed in the study of Kirchstetter et al. [83]. For BC heavily-coated with non-absorbing coatings, AAE slightly decreases with increasing coating thickness, and AAE can decrease to approximately 0.6, and our calculated AAE range of 0.6–1.2 for BC with non-absorbing coatings is generally consistent with the observed range of Kirchstetter et al. [83], who obtained a BC AAE range of 0.6–1.3. However, the results for BC with non-absorbing coating cannot explain the results of Schnaiter et al. [99], where AAE of 2.1 was reported for spark discharge soot. This indicates the existence of BrC, and our modeling results for BC with BrC coatings can explain that large value. Our calculated AAE values for BC with BrC coatings are within approximately 0.8–2.1.
Zhang et al. [37] have shown that AAE of BC with brown coatings increases with coating thickness increasing, while they did not consider the morphology transformation from thinly-coated to thickly-coated. In their study, all BC aggregates were assumed with a spherical coating. However, for thinly-coated BC, the assumption may be not always correct. Thinly-coated BC may still present a near-fractal structure, and with coatings increases, the coating structure can become spherical [28]. Our results show even though AAE decreases with increasing BC/OC for both BC thinly- and heavily-coated with BrC, the AAE can increase with BC/OC as BC transform from thinly-coated to heavily coated, as the overall structures of BC may change. Besides, for BC heavily-coated with non-absorbing OC, AAE of BC can decrease with coating materials increasing, which was not revealed by the study of Zhang et al. [37]. Therefore, the addition of OC does not necessarily increase the AAE of coated BC, which should provide new insights for the atmospheric studies, as it was widely accepted that AAE increase with increasing OC ratio. Previous modeling studies have demonstrated that we cannot determine the existence of brown carbon only when AAE > 1.4 by using an aggregate model [37], and AAE > 1.6 by using the core–shell sphere model [49]. Our results show that AAE of BC with non-absorbing coatings can reach approximately 1.2, which generally agrees with the previous studies [37,49]. However, we must acknowledge that there are large uncertainties in BrC refractive indices, BC refractive indices, particle sizes, BC morphologies, and the presence of externally BC to determine the existence of BrC.
As shown in Figure 2 and Figure 3, different coating materials can lead to large variations in the spectral-dependent radiative properties. Generally, AAE of BC with BrC coatings is much larger than those with non-absorbing coatings due to the significant wavelength dependences of BrC. The variation of the size distribution also contributes to a larger variation of AAE value for BC with BrC coatings compared to those with non-absorbing coatings. The variation between cases in AAE is approximately 9–13% for thinly-coated BC and 23–28% for heavily-coated BC with the varying in the range of 0.05–0.06 m and in the range of 1.5–1.7. As BC becomes more compact, AAE turns smaller and is more sensitive to the size distribution (also see Figure 3).
Li et al. [20] reported an EAE range of ∼1.21–1.41 for bare BC. However, their results are unable to explain the small EAE values observed in the atmosphere. For example, Cao et al. [100] reported that the EAE of BC can reach a small value of approximately 0.2. The reason may be that Li et al. [20] did not consider the effects of coatings. Considering the effects of coating materials, our calculated EAE show a much wider range, which is generally within the range of approximately 0.2–2.0. The results provide good explanations for the small EAE measured by Cao et al. [100]. The calculated EAE range of heavily-coated BC is approximately 0.2–1.2, which is generally in agreement with the observed range of 0.2–1.35 [100]. This implies that BC was heavily-coated in the study of Cao et al. [100]. This is consistent with the BC volume fraction measurements. For example, BC volume fraction of 7–24% (BC/OC is approximately 0.113–0.474) were reported by Adachi and Buseck [101]; Adachi et al. [55] reported an average BC volume fraction of 7% (BC/OC is approximately 0.1125) in Mexico City, Mexico.
The coating ratio has a significant effect on BC EAE. The effects of BC/OC on EAE are similar to the effects on AAE for thinly-coated BC. Fixing to be 2.2, as BC varies from bare to BC/OC = 0.375, an increase of 32% and 67% for EAE can be observed for BC with non-absorbing coatings and BrC coatings, respectively. EAE of heavily-coated BC generally increases with BC/OC ratio. The possible reason is that as BC/OC increases, coating materials decreases, and the overall size of BC-containing particles decreases, which leads to larger EAE. However, for thinly-coated BC, the opposite phenomenon is observed. This may be affected by the variation of the effective refractive index with the increases of coating materials. Even though the overall size of BC-containing particles will decrease with increasing BC/OC ratio, the effective refractive index can be also varied. Due to the large volume fraction of BC, the variation of BC/OC ratio may lead to a large variation of the effective refractive index, so may lead to a decrease of EAE. We must clarify that the modification of the BC/OC ratio also changes the effective refractive index of heavily-coated BC. However, as heavily-coated BC is dominated by OC, the modification of the BC/OC ratio has less of an effect on the effective refractive index than it would with thinly-coated BC. In Figure 2 and Figure 3, for AAE and EAE, there is a sudden jump between thinly- and heavily-coated BC. However, this feature does not relate to realistic conditions. In the atmosphere, BC morphologies can vary with atmospheric aging but this is not a sudden jump. Here, we have just considered two extreme cases: thinly-coated and heavily-coated, and the transition between the thinly-coated BC and heavily-coated BC was not considered.
The SSA can provide important information for inferring different aerosol types, while the BC SSA range has not been well defined by current studies. Bond and Bergstrom [64] suggested that bare BC SSA is generally within the range of 0.2–0.3 at nm, and our calculated SSA shows a similar range at nm. However, as BC can be commonly mixed with other chemical compositions, these values are rarely used. As expected, thicker coating materials will lead to a much larger SSA. However, compared to BC with non-absorbing coatings, SSA of BC with absorbing coatings show much less sensitivity to BC/OC ratio. Based on the measurements in the laboratory, Pokhrel et al. [102] demonstrated that SSA is significantly affected by the ratio of elemental carbon (EC) and organic carbon (OC) (or BC/OC). In the study of Pokhrel et al. [102], at 532 nm, SSA was approximately 0.85 at BC/OC = 0.1, while it decreases to approximately 0.5 at BC/OC = 1. Our 532 nm SSA calculated using BC with non-absorbing coatings decreases from approximately 0.8 to approximately 0.35–0.5 as BC/OC increases from approximately 0.1 to approximately 1, which generally agrees with the measurements of Pokhrel et al. [102]. This implies the generated OC in the biomass burning process is weakly absorbing in the visible spectrum. In addition, Pokhrel et al. [102] also found that SSA values at 532 and 660 nm is fairly close to each other. This is also demonstrated by our results for the heavily-coated BC with non-absorbing coatings, where the SSA is nearly wavelength-independent (see Section 3.4). However, much smaller SSA values were measured at 405 nm, and this may be due to the effects of BrC coatings. Statistically, in the absence of size information, it does not appear possible to differentiate between thinly- and heavily-coated BC based on AAE or EAE alone. On the other hand, SSA is much less sensitive to the size and for thin coatings, it is largely independent of coating optical properties. Based on the SSA at 532 nm, thinly- and heavily-coated BC can be differentiated. However, it is difficult to distinguish thinly- and heavily-coated BC based on SSA at 350 nm alone. This is because that SSA of BrC may be close to that of BC at 350 nm, so when coated with BrC, SSA of thinly- and heavily-coated BC can be overlapped.
3.2. BC Radiative Properties at Different Size Distributions
Li et al. [20] and Liu et al. [25] have demonstrated that size distributions significantly affect AAE and EAE for uncoated BC and heavily-coated BC. In this work, we make a further investigation of the thinly-coated BC with non-absorbing and BrC coatings. As shown in Figure 2 and Figure 3, AAE, EAE, and SSA of BC with different coating materials also show different sensitivities to the size distributions. AAE and EAE of heavily-coated BC show a much larger dependence on the size distribution compared to thinly-coated BC, while SSA show much larger dependence on the size distribution for thinly-coated BC. With thickly coating materials, the overall structure can be collapsed to a spherical shape, and this may account for why AAE and EAE of heavily-coated BC show much larger dependence on the size distribution, as AAE and EAE of spherical BC are more sensitive to the size distribution [20,25]. SSA of heavily-coated BC may be dominated by the coating materials, whose SSA is very large, and the SSA of coatings materials are not significantly affected by the size distribution. This may be why the SSA of heavily-coated BC shows less dependence on the size distribution. In addition, AAE of BC with BrC coatings shows a larger dependence on the size distribution than those with non-absorbing coatings due to the effects of the large BrC AAE.
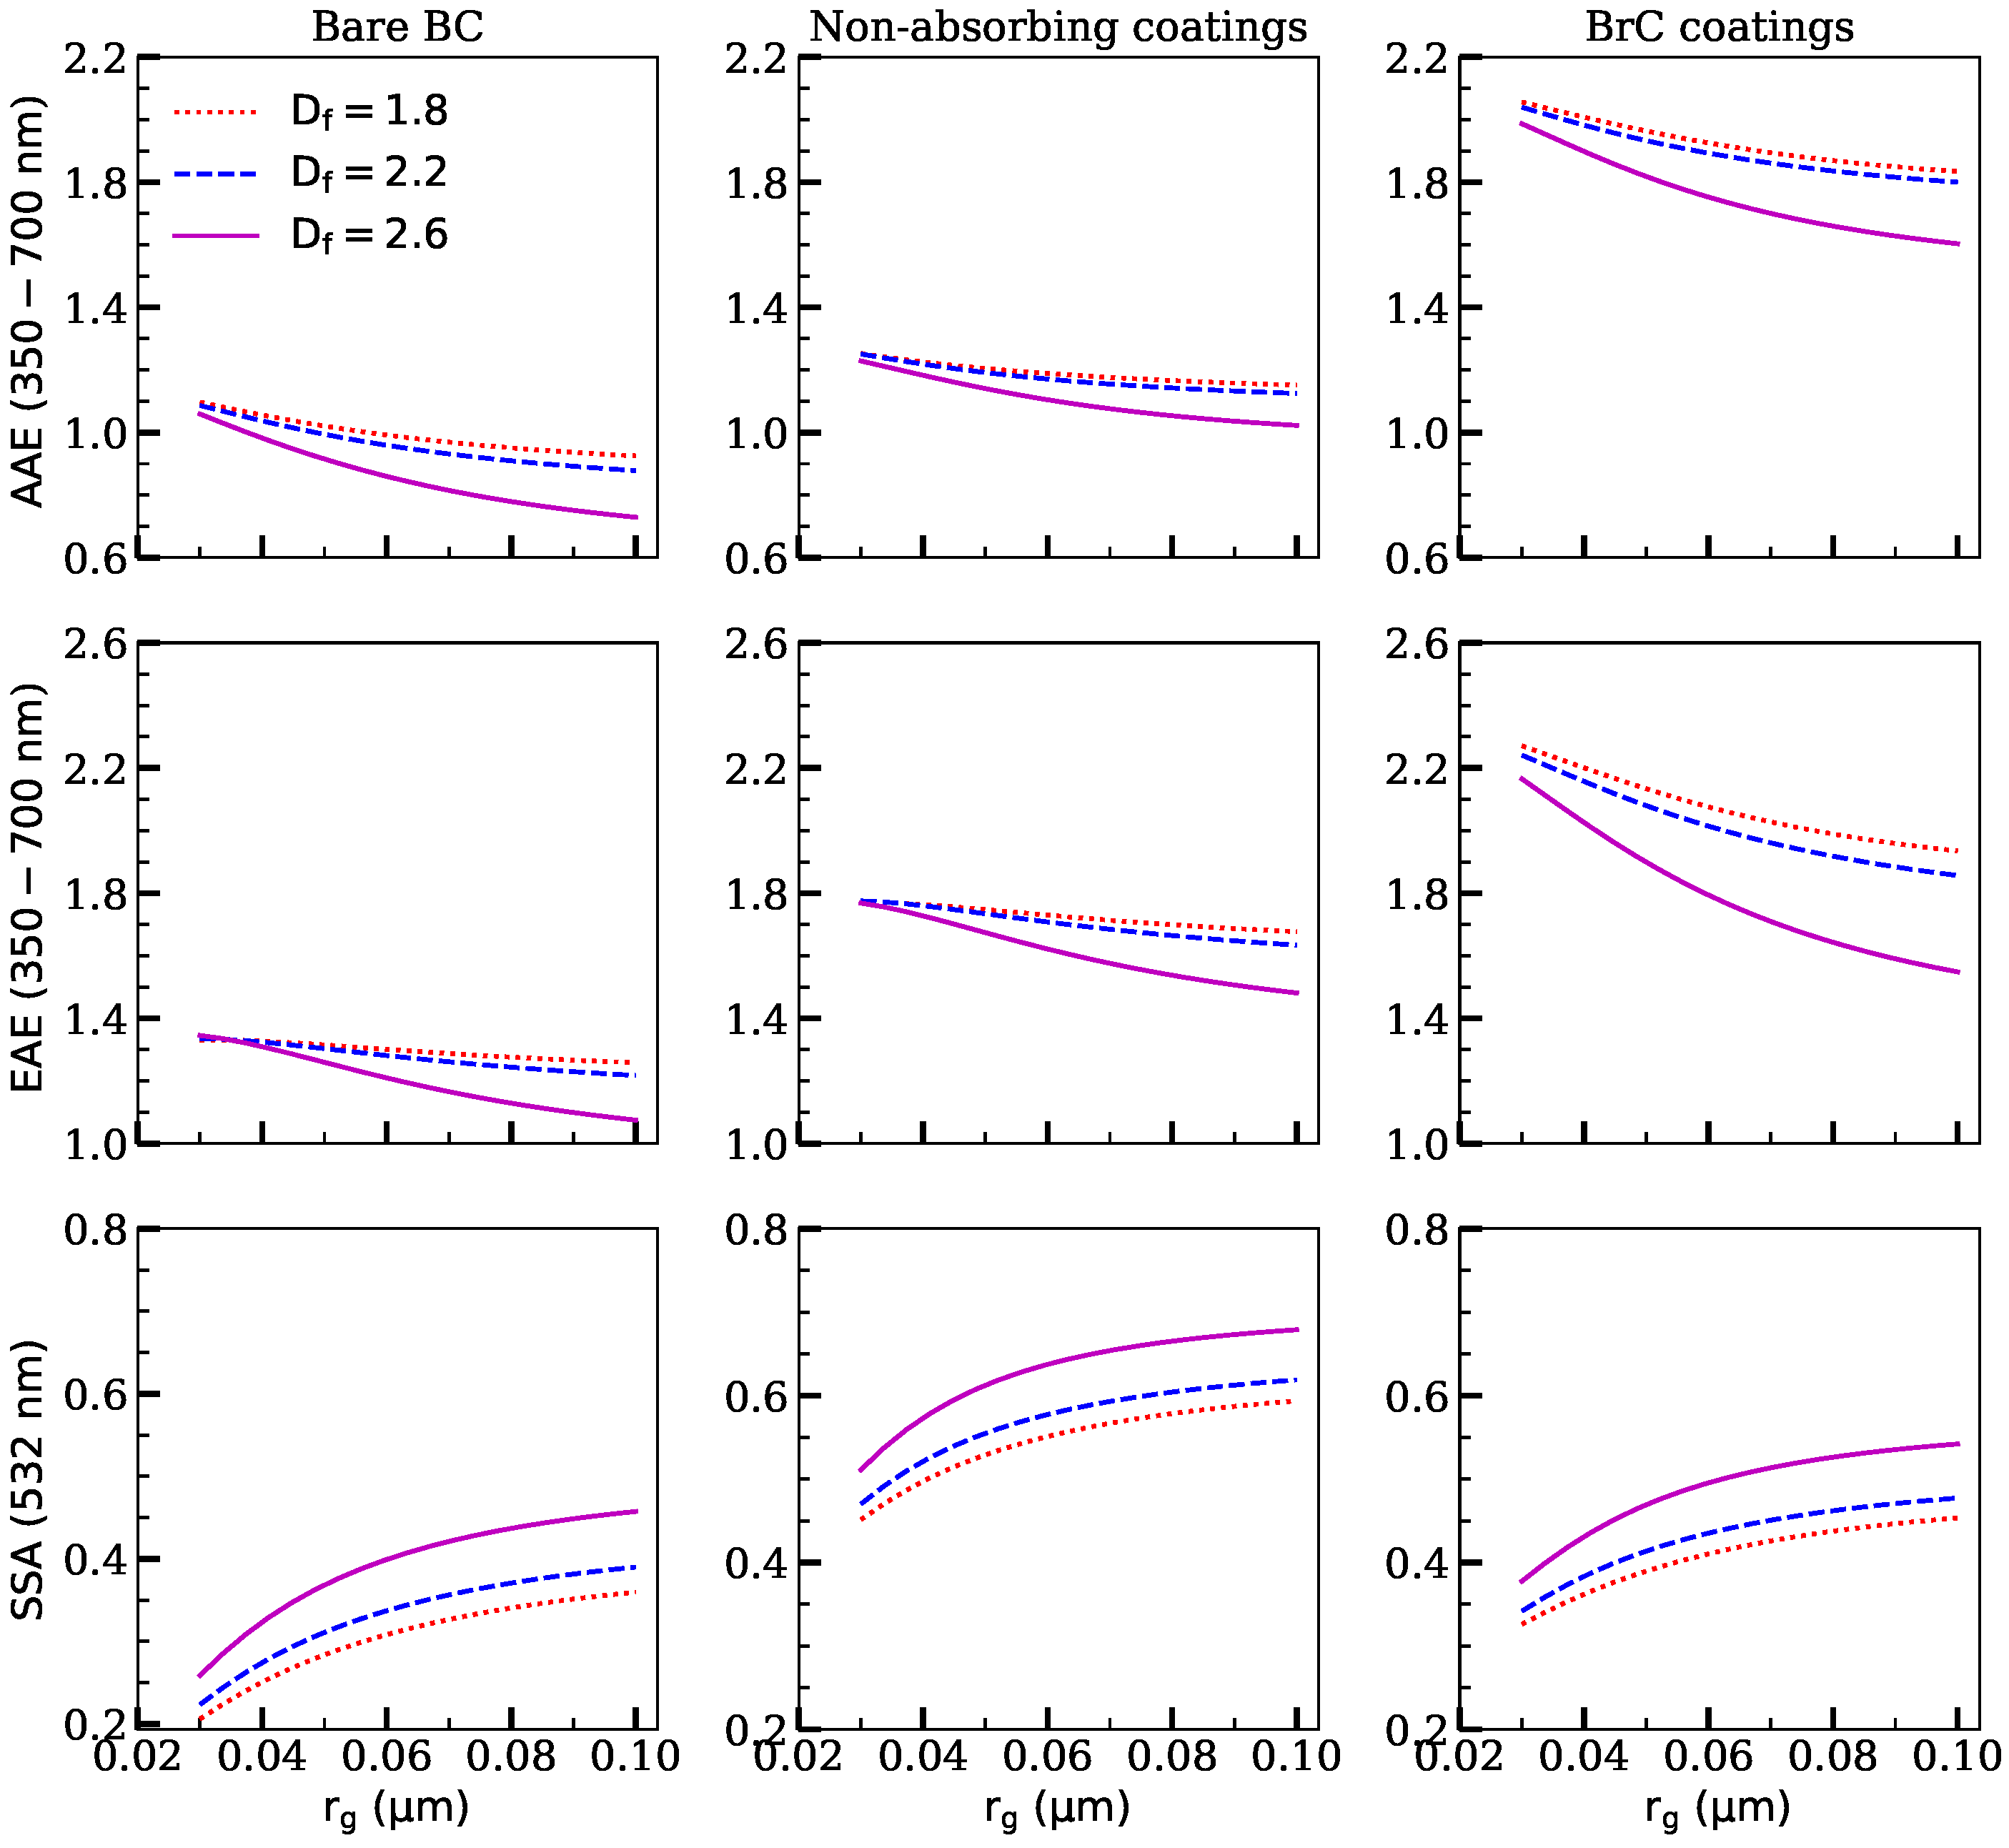
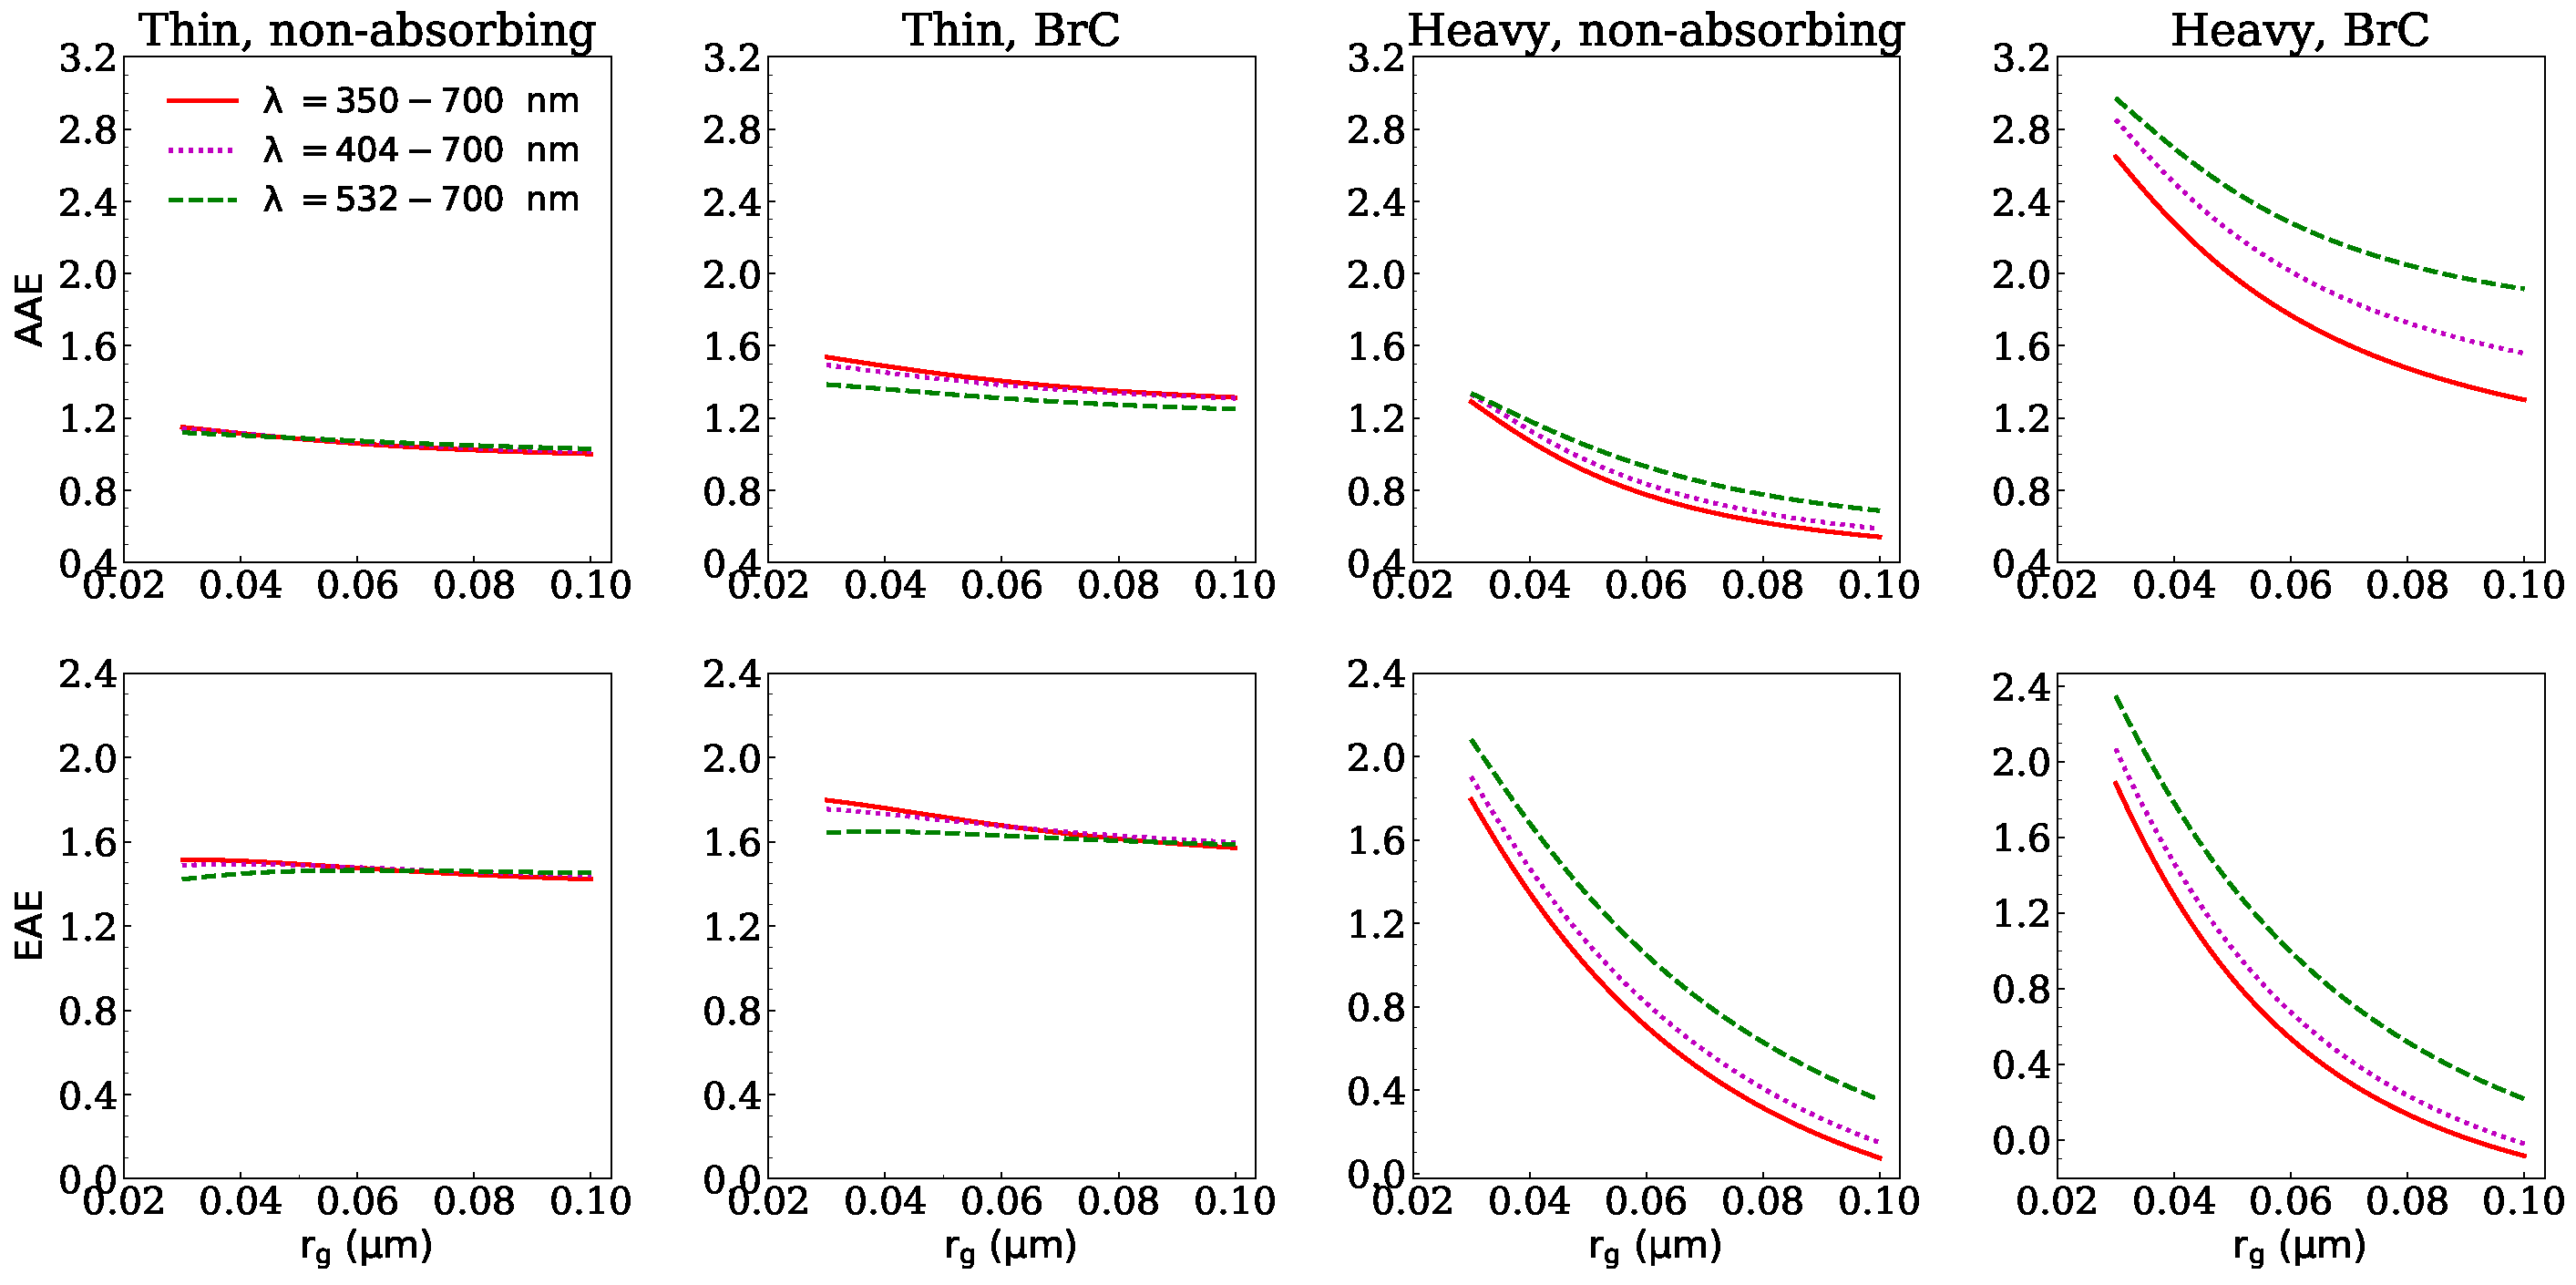
Figure 4 further shows how AAE, EAE, and SSA of BC depend on the size distributions, where a fixed was assumed. Both EAE and AAE decrease with increasing , which is consistent with the results of Li et al. [20] and Liu et al. [25]. Even though the typical AAE of about 1 is accepted for uncoated BC at a typical size distribution (see Figure 2), as increases to 0.1 m, AAE decreases to approximately 0.7. Therefore, the size distribution is also an important factor that contributes to the complex observed AAE of approximately 0.6–1.3 [83]. For thinly-coated BC, SSA increases with , which is mainly caused by the largely increased scattering with the increases of the particle size. In addition, for bare and thinly-coated BC, AAE, EAE, and SSA, all are sensitive to the compactness of particles. Generally, AAE and EAE decrease with increasing , and the results agree with the findings of Li et al. [20] and Liu et al. [25], while SSA increases as the particles become more compact. This is in line with the findings of Liu et al. [42], who found that stronger scattering interaction and stronger electromagnetic coupling between spherules can be observed as particles become more compact. In addition, it seems that AAE, EAE, and SSA are more sensitive to as particles become larger. A possible explanation is that the modification of the shape of large aggregates can have more significant effects on the surrounding electromagnetic field. The range of leads to AAE and EAE differences of less than 5% at = 0.03 m. However, as increases to 0.1 m, the AAE and EAE differences between and can reach approximately 18% and 30%, respectively. Moreover, there are similar dependencies on for different and coating types.
Figure 5 demonstrates how the mixing sates affect the BC radiative properties. AAE of BC heavily-coated with non-absorbing materials can be below approximately 0.5 when . For both thinly- and heavily-coated BC, AAE, and EAE decrease with increasing . This is generally in agreement with the results of the core–shell sphere model [49]. However, for the AAE value, a sizable difference should be observed between core–shell sphere model and the MSTM models [36]. Compared with thinly-coated BC, AAE, and EAE are more sensitive to size distribution for heavily-coated BC. SSA of thinly-coated BC generally increases with , while for heavily-coated BC, SSA exhibits a little decrease with increasing . However, our results indicate that the decrease should not exceed 10%. This is rather different from the results of the core–shell sphere model, where SSA generally decreases with the core diameter increasing [49].
3.3. Parameterizing BC Radiative Properties with the Size Distribution
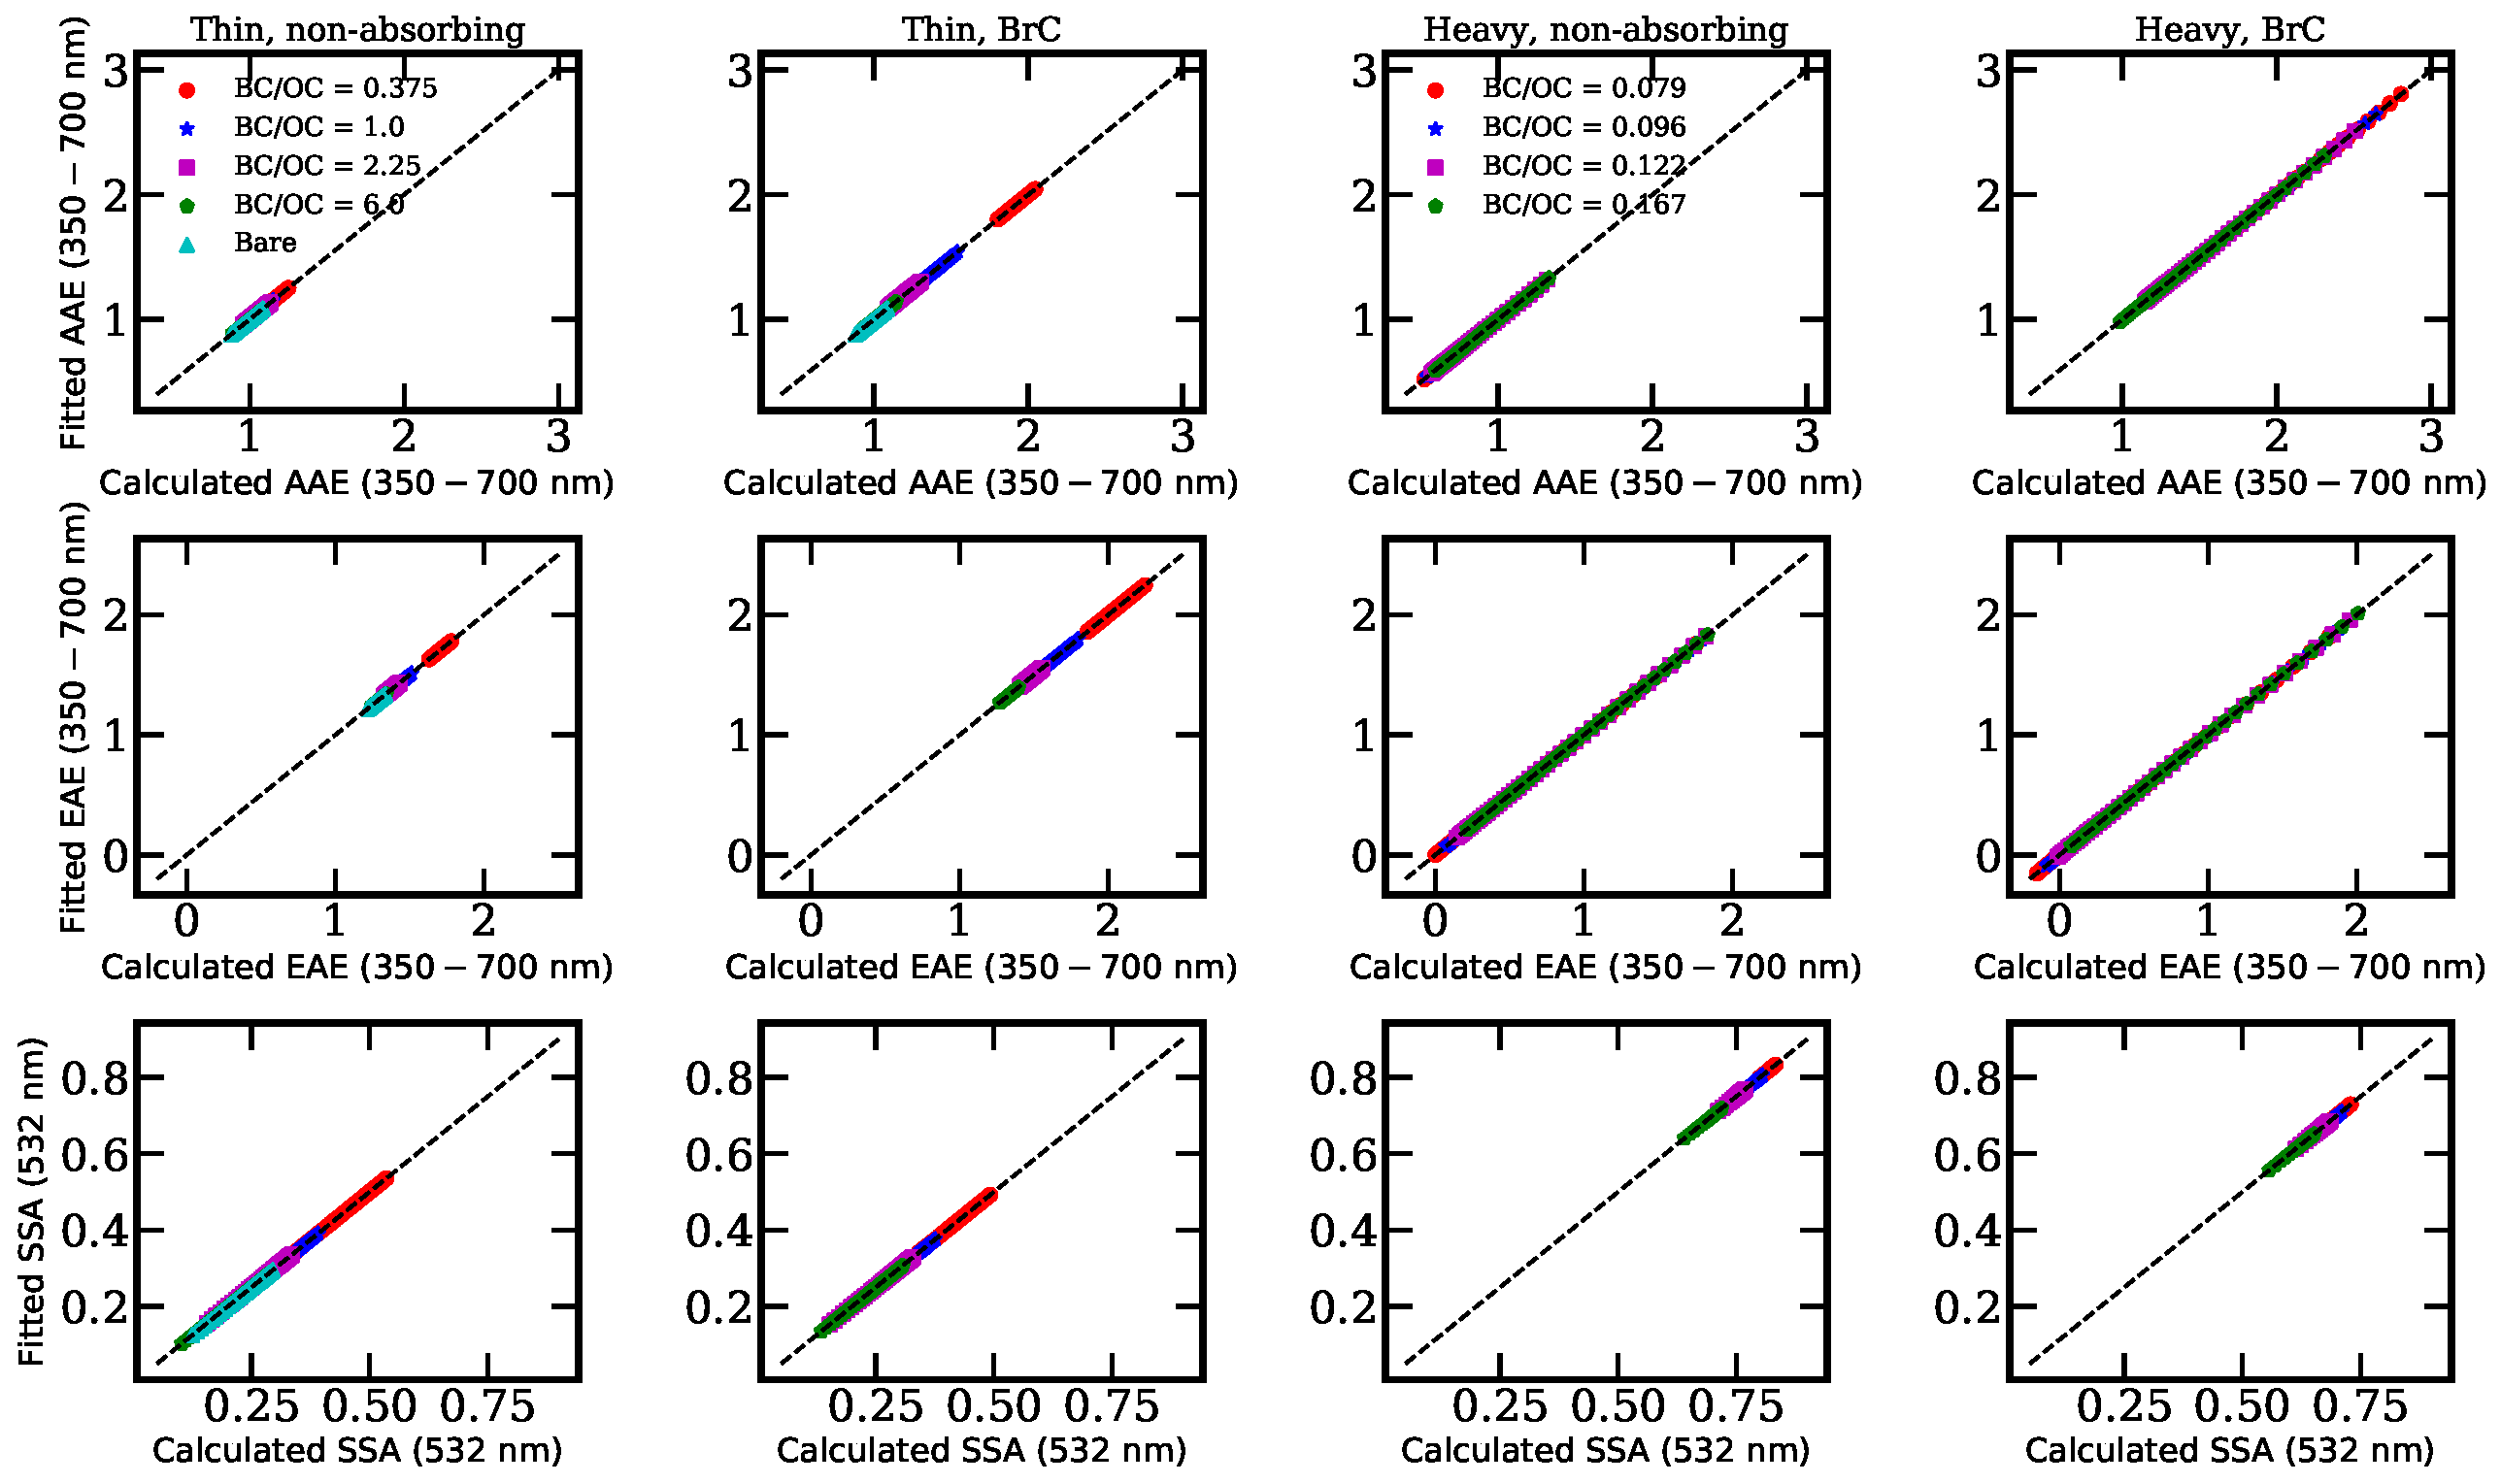
To promote the use of the non-spherical BC model in the retrieval of BC microphysical properties based on the optical measurement, it is beneficial to develop more efficient parameterizations of the BC radiative properties. Therefore, we try to fit the AAE, EAE, and SSA with an empirical expression. Liu et al. [25] attempted to fit AAE with a logarithmic expression, whereas some poor agreements are found. Luo et al. [103] applied a machine learning method for the estimation of BC radiative properties, while the bulk radiative properties were not considered. Although Smith and Grainger [23] derived empirical expressions for bulk and for uncoated BC, the SSA is difficult to be derived and the applicability of coated BC is unexpected. Based on Smith and Grainger [23] and Liu et al. [25], we found an empirical fit which is applicable for AAE, EAE, and SSA under different mixing states:
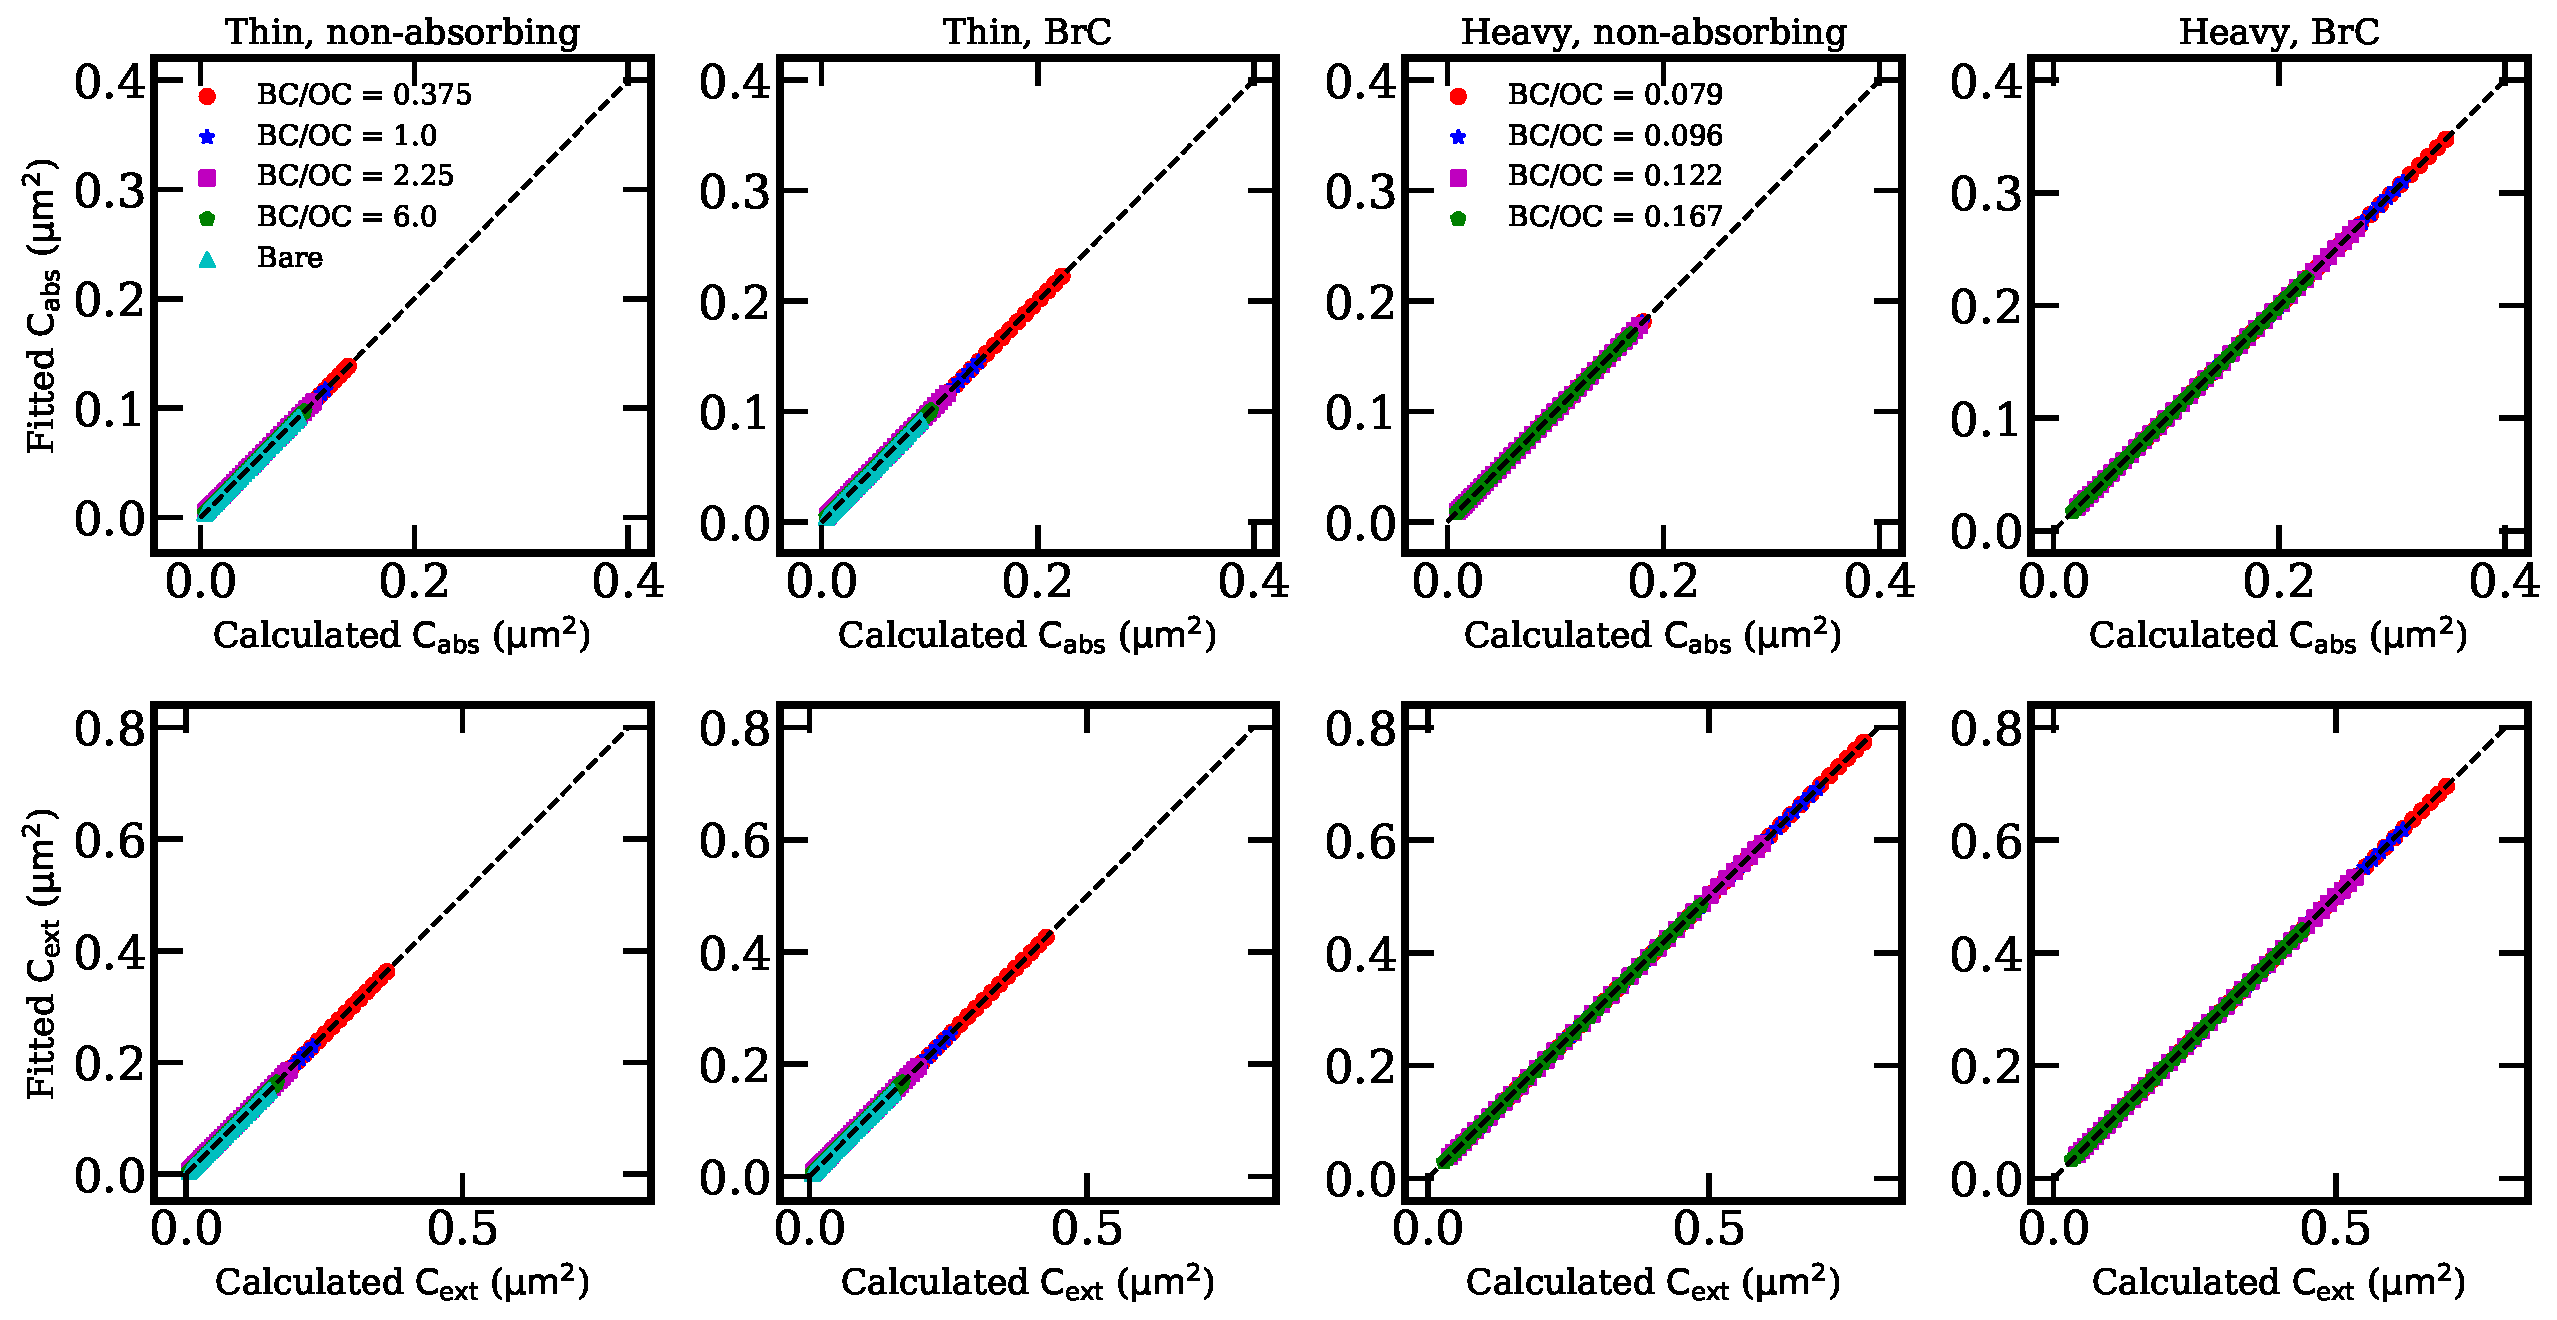
where AOP (aerosol optical properties) represents AAE, EAE, or SSA. Figure 6 shows that fitted AOP is in great agreement with the calculated AOP using MSTM code for different mixing states. The correlation coefficients () between the numerical calculations and fittings are larger than 0.999, and the normalized mean absolute errors (NMAE) are less than 10. Figure 7 shows that Equation (12) also has a good performance in fitting the absorption and extinction cross-sections. In this work, the function was fitted at each BC/OC, and fittings in a two-dimensional (2D) space need to be discussed in the future. Our fittings may be useful for retrieving the size information based on the optical measurements. Instead of using a lookup table, a mathematic expression can help look for an optimum solution for the inverse problem. The fitting parameters are shown in Table A1, Table A2, Table A3, Table A4 and Table A5 in Appendix A.
3.4. The Spectral Dependence of BC Radiative Properties
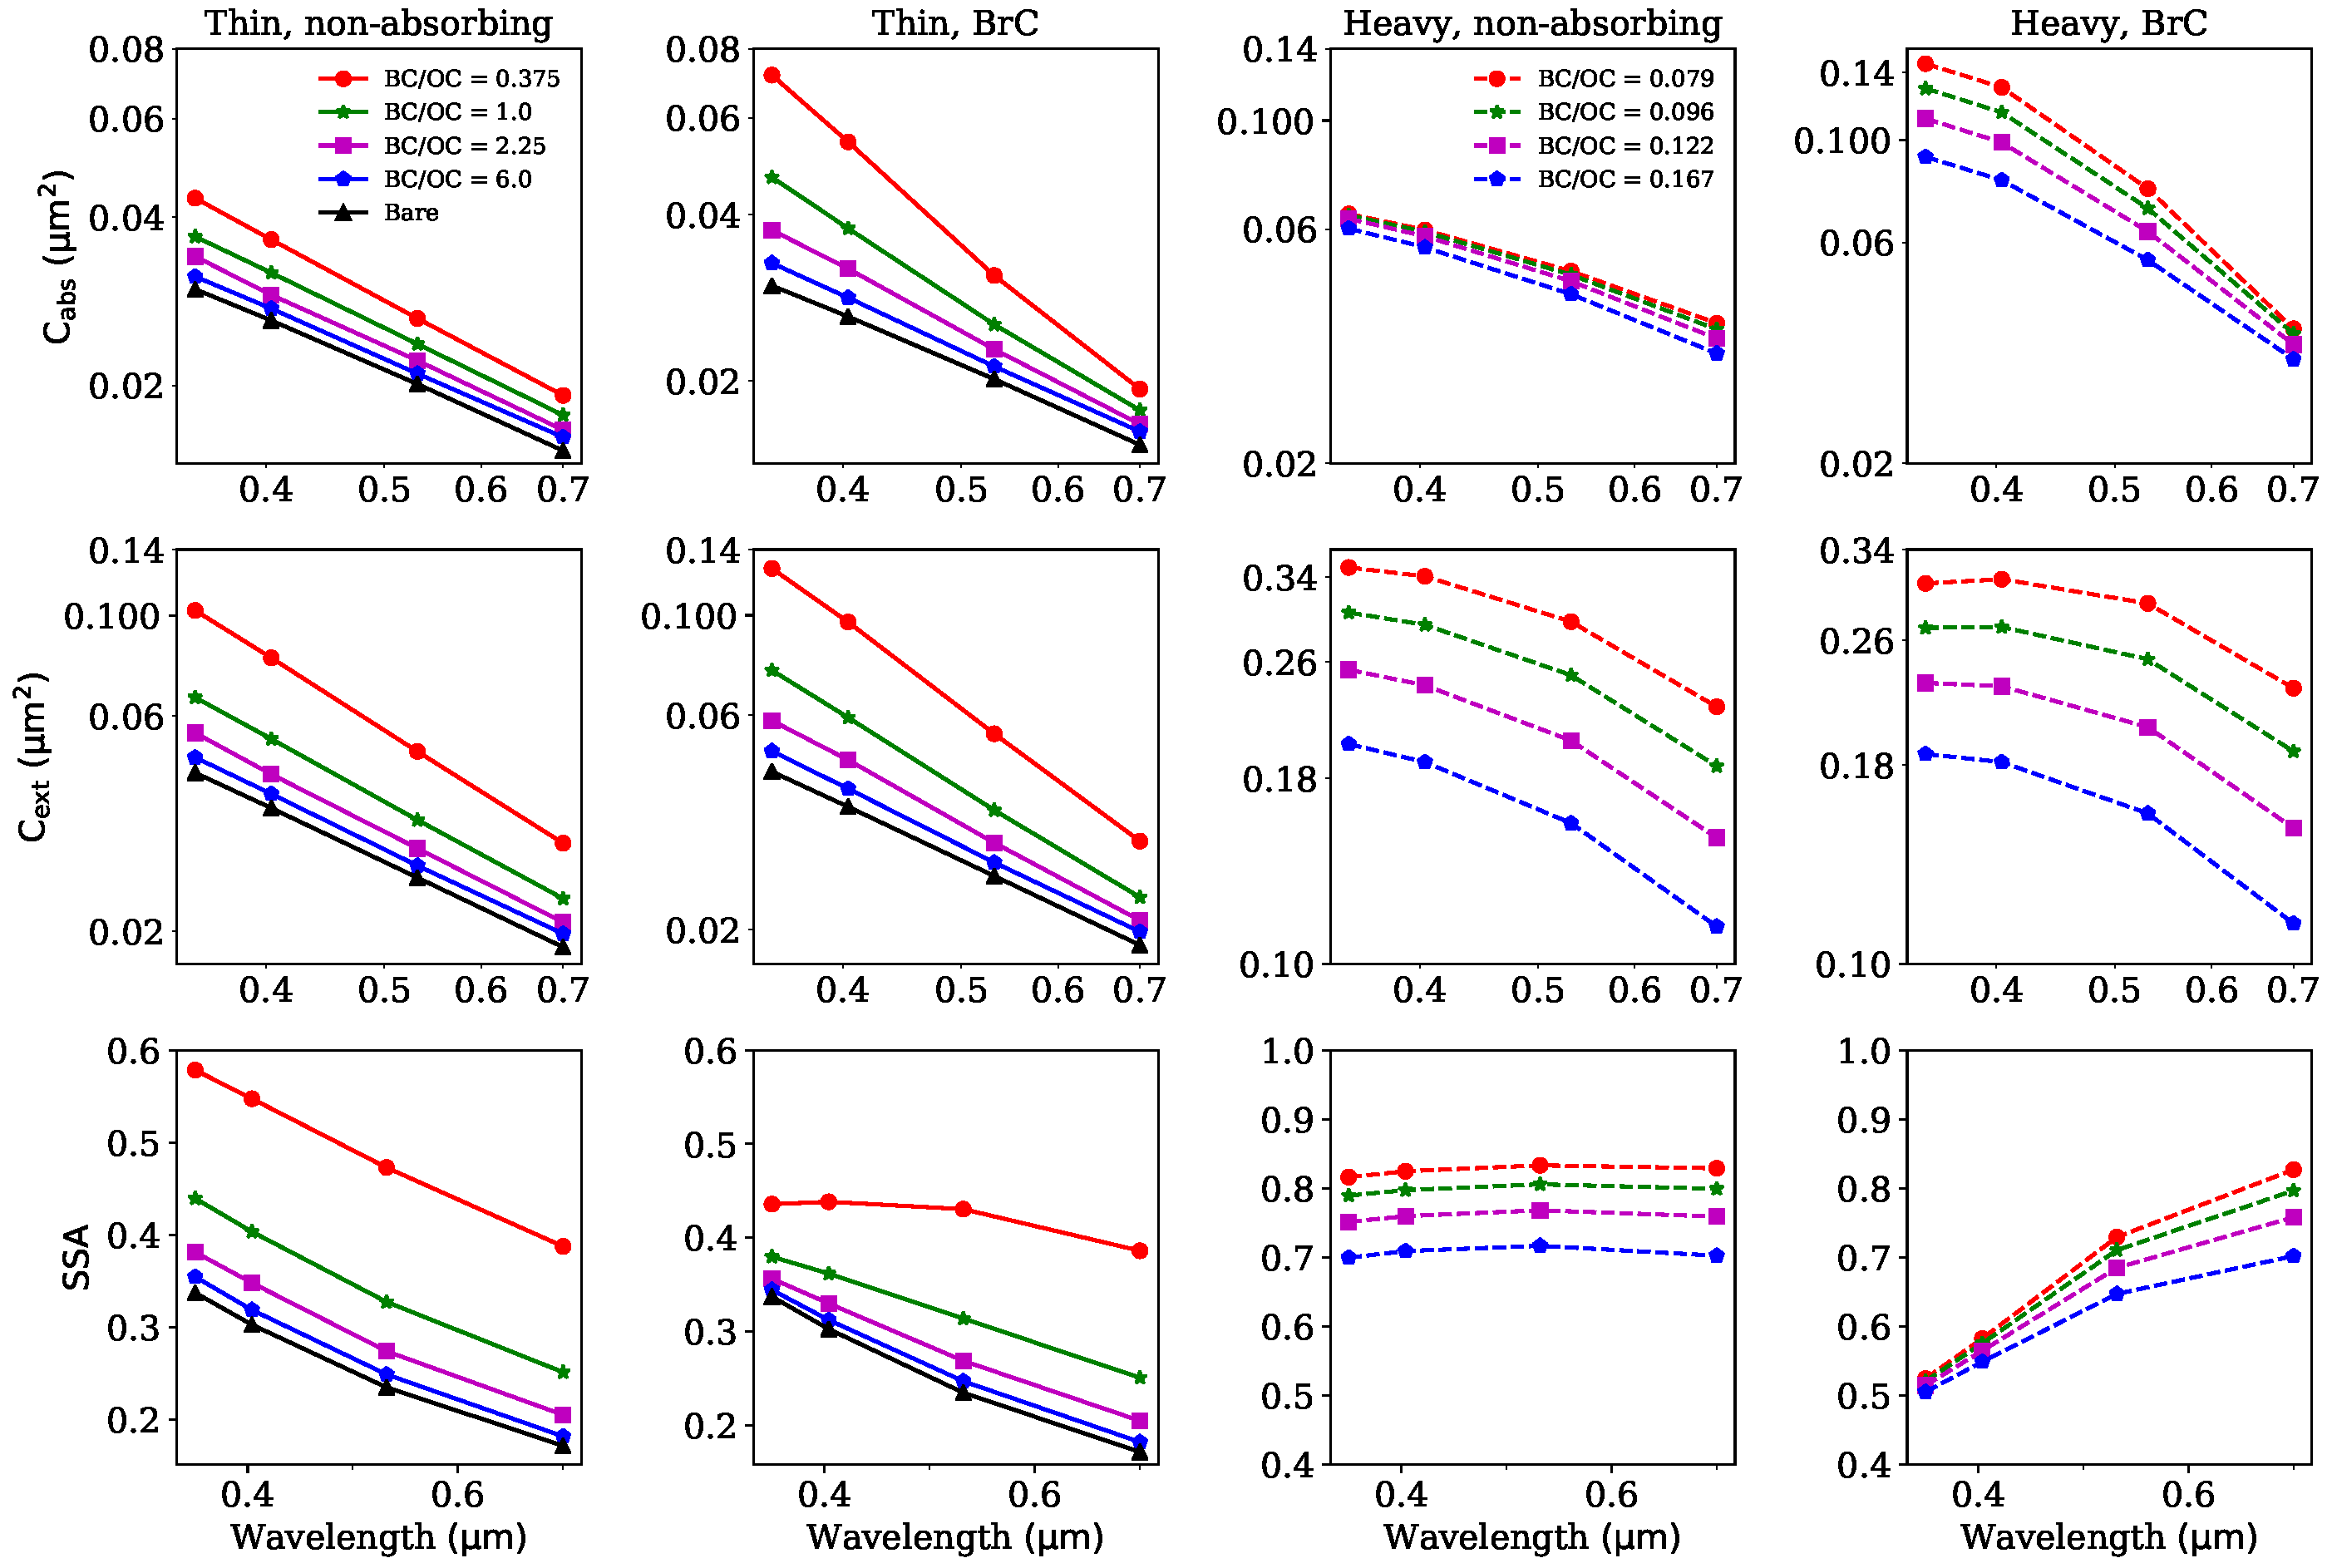
Some measured AAE, EAE, and SSA values were used in different studies, while the measurements were commonly conducted at different wavelengths. Figure 8 shows the wavelength dependences of BC optical properties at a typical size distribution of m and . In Figure 8, and are plotted on a logarithmic scale, and the slopes represent AAE and EAE, respectively. decreases with increasing wavelengths for all cases. However, the dependences of AAE are various. For the thinly-coated BC, AAE seems to be wavelength-invariant. As shown in Table 2, for BC thinly-coated with non-absorbing coatings, the difference between AAE for 350–700 nm and AAE for 532–700 nm is approximately 1%. The difference for BC thinly-coated with BrC coatings may be larger, while it is not larger than 15%. This is a little different from the results of Li et al. [20], where EAE and AAE based on 350 nm and 550 nm are different from that based on 550 nm and 880 nm. This is mainly due to the variant BC refractive indices with wavelengths in the study of Li et al. [20]. However, AAE of heavily-coated BC increases with wavelengths. Specifically, the AAE of BC heavily-coated with BrC coatings is much more significantly dependent on wavelengths than BC with non-absorbing coatings. EAE has a similar dependence on wavelengths as AAE. The wavelength dependences of SSA are significantly affected by mixing states and the coating type. For thinly-coated BC, SSA decreases with increasing wavelengths, which is consistent with the results of Cheng et al. [43]. Compared with BC with non-absorbing coatings, the wavelength dependences of SSA is relatively small for BC with BrC coatings. This phenomenon may be caused by the strong wavelength dependences of BrC coatings. The BrC absorption decreases with the increase of wavelengths, so leads to the increases of SSA with wavelengths, which weaken the decreases of SSA with increasing wavelengths. While for heavily-coated BC, there is a different variation with wavelengths. For BC heavily-coated with non-absorbing coatings, the SSA seems to be wavelength-independent due to the leading role of non-absorbing coatings. Nevertheless, SSA increases with wavelengths for BC with BrC coatings due to the large wavelength-dependences of BrC absorption. As AAE, EAE, and SSA all present different wavelength dependences for different mixing states, the wavelength dependences of radiative properties may be a potential tool to analyze the mixing states. Specifically, the wavelength dependences of SSA can be used to infer the type of coatings when BC is heavily-coated. However, for thinly-coated BC, there is a need to provide more information about how optical properties depend on BC composition ratios for different coating types.
One may wonder whether the wavelength dependences of AAE and EAE of BC, indicated by non-linearities in Figure 8, are affected by the size distribution. AAE and EAE for different wavelength pairs are investigated at different size distributions, and the results are shown in Figure 9 and Table 2. For BC thinly-coated with non-absorbing materials, AAE and EAE at different wavelength pairs do not deviate largely. AAE and EAE differences for different wavelength pairs are within 5% and 10%, respectively. For BC thinly-coated with BrC, the AAE and EAE differences for different wavelength pairs are relatively larger. However, they are not above 15%. While for heavily-coated BC, AAE and EAE are obviously affected by wavelengths, and the effect increases with increasing . For all wavelength pairs and mixing states, AAE decreases with increasing . Overall, EAE shares similar dependences on as AAE. Differently, for BC thinly-coated with non-absorbing coatings, a little increase in EAE at nm is observed. However, the increase does not exceed 3%.
3.5. The Effects of the Refractive Index of BrC Coating
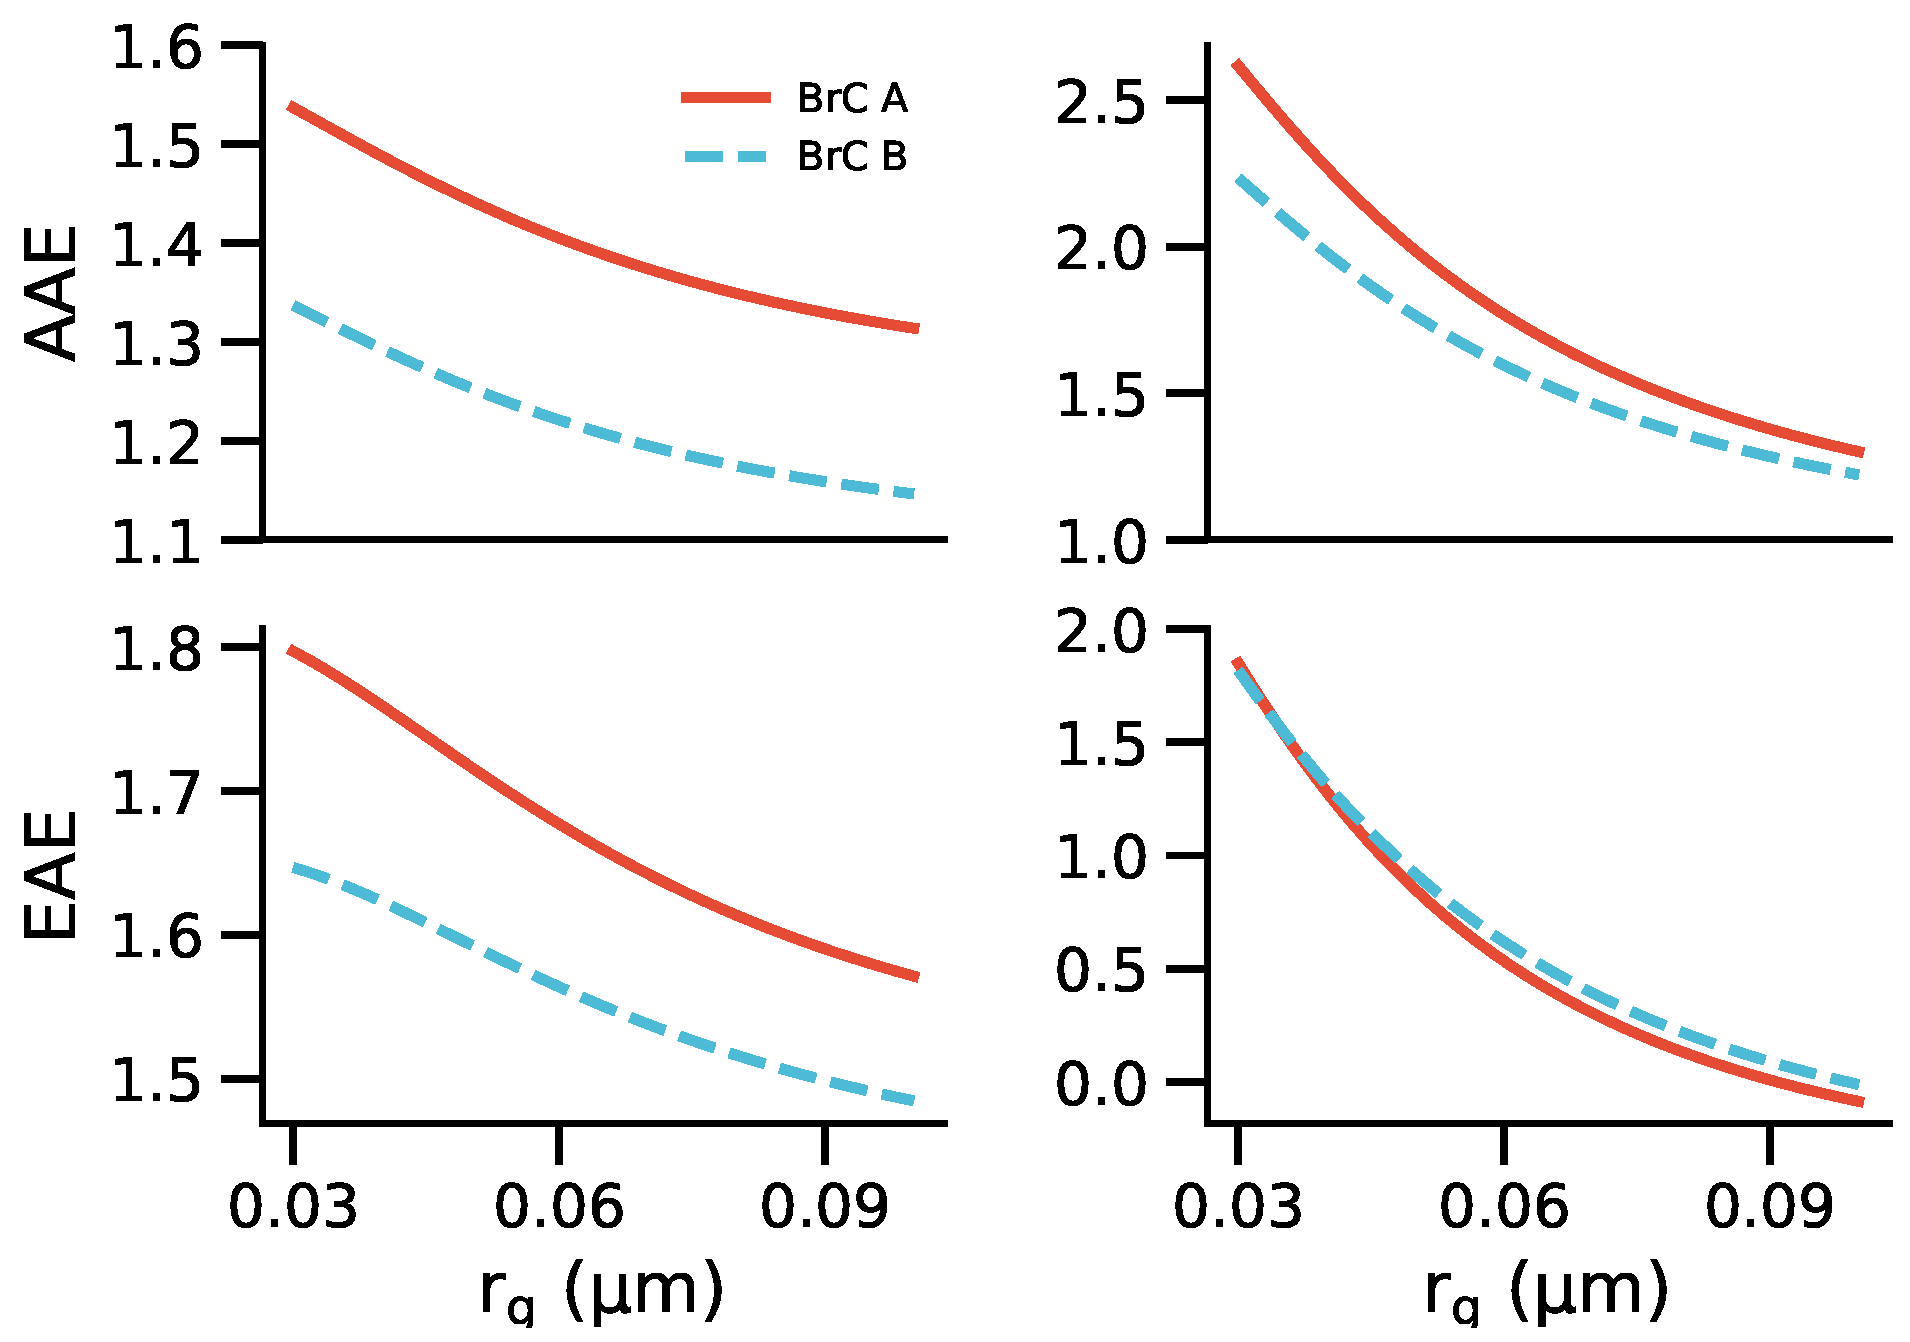
As AAE and EAE are significantly affected by the refractive index of BrC, the sensitivities of AAE and EAE to the RI of BrC are investigated. To demonstrate the sensitivity of AAE and EAE to , two BrC coating materials are selected, while many measurements based on different methods performed on different fuel and in different combustion conditions showed different refractive indices [104,105,106,107], their values fall within the range of those of Kirchstetter et al. [83] and Chen and Bond [84], which is shown in Table 3. Similar to Lin et al. [108], reported by Kirchstetter et al. [83] (BrC A) and Chen and Bond [84] (BrC B) were used to represent the upper and low limits of BrC absorption. Figure 10 shows that AAE and EAE are significantly affected by the imaginary part of BrC RI. AAE of BC with the coatings of BrC A is much larger than that of BC with BrC B coatings. This is because that of BrC A has a larger spectral-dependence than BrC B. However, different effects of are observed for BC EAE. For thinly-coated BC, the EAE of BC with BrC A coatings is much larger than that of BC with BrC B coatings, while the EAE of heavily-coated BC seems not significantly sensitive to . This can be understood from two aspects. For thinly-coated BC, BC extinction is dominated by the absorption due to small SSA. As the modification of mainly affects the absorption of BC-containing particles, it is easily understood that EAE of BC with BrC A coatings is much larger than that of BC with BrC B coatings. However, the extinction of heavily-coated BC is dominated by scattering, and the modification of does not significantly affect the scattering cross-sections, so EAE of heavily-coated BC is less sensitive to .
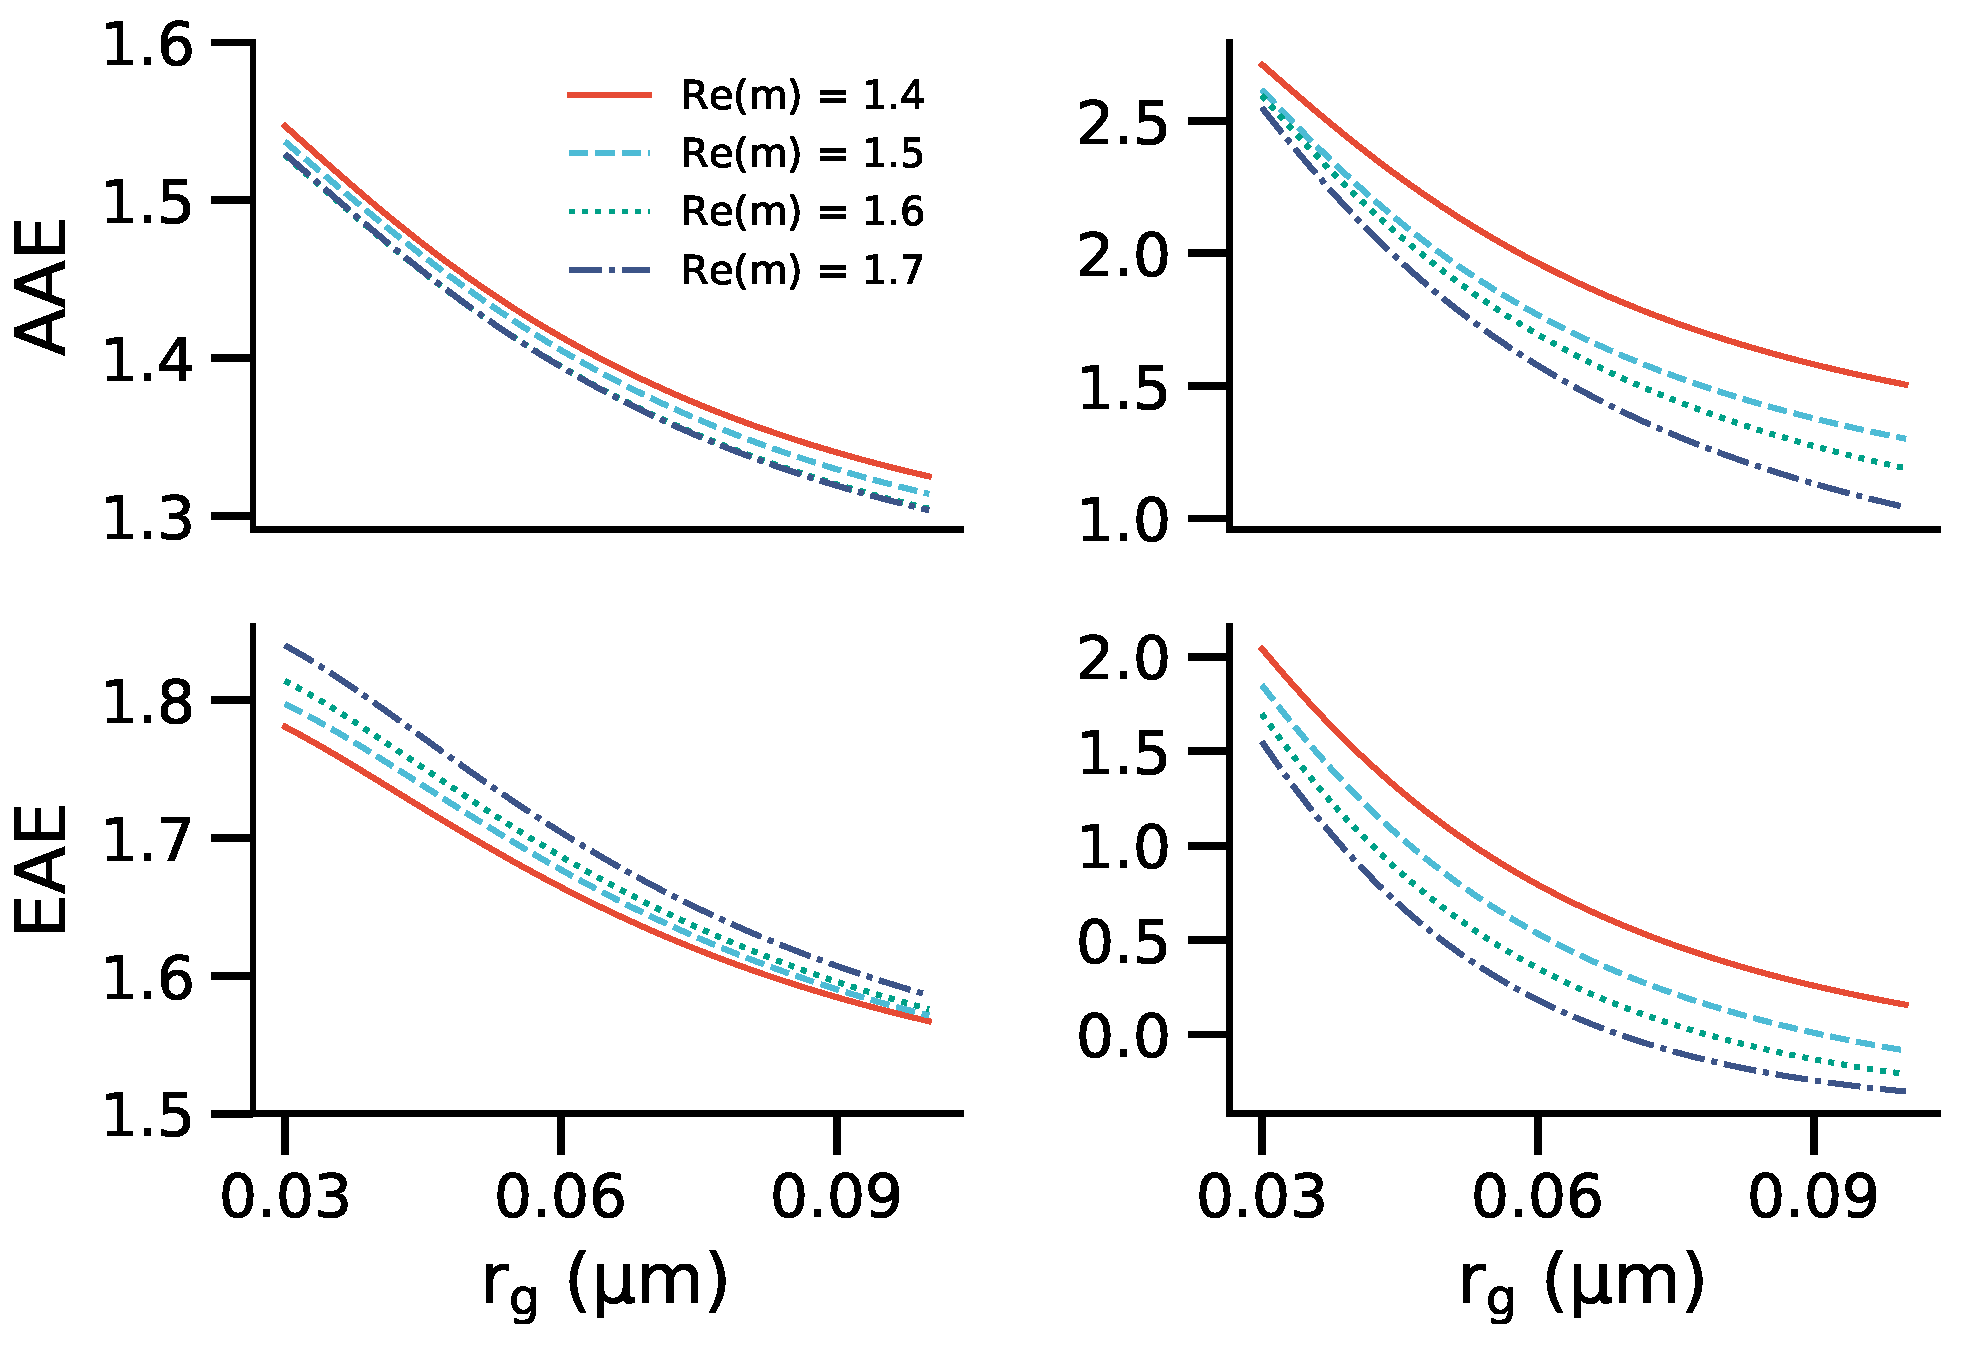
The sensitivities of AAE and EAE to the real part of BrC RI (Re(m)) are shown in Figure 11, AAE of BC-containing aerosols is significantly enhanced by decreasing the real part of BrC RI. Even though the absorptions of spheres are mainly affected by the imaginary part of RI, the real part of RI can modify the scattering pattern, and lead to a different distribution of the multiple scattering field, so contribute to the variation of absorption. As pointed by Liu et al. [25], BC absorption can increase as the real part of RI decreases or the imaginary part increases. With the real part of BrC increasing, the absorption of BrC coating in the ultraviolet band can decrease, so lead to less absorption wavelength dependence. EAE is also significantly affected by the real part of BrC, and opposite trends are found for thinly and heavily-coated BC. EAE of thinly-coated BC increases with the real part of BrC, while the opposite phenomenon is observed for heavily-coated BC. The possible reason is the effects of different BC morphologies and different BrC contents. For thinly-coated BC, even though the absorption spectral-dependence decreases with increasing the real part of BrC RI, the increases are relatively small, and the modification of scattering spectral dependence should be the main cause of the increases of EAE when increasing the real part of BrC RI. For heavily-coated BC, the modification of absorption spectral-dependence should dominate the decreases of EAE by increasing the real part of BrC RI.
4. Conclusions and Future Work
In this work, bulk AAE, EAE, and SSA are numerically studied using typical size distributions. Our results show that AAE and EAE of coated BC closely match the observed range in the atmosphere. While Li et al. [20] reported that AAE of bare BC aggregates was generally within the range of 0.87–1.50, a small AAE of approximately 0.6 was measured by Kirchstetter et al. [83]. Our calculated AAE using BC models with non-absorbing coating materials can provide an explanation for the small AAE. The large measured AAE of approximately 2.1 by Schnaiter et al. [99] may imply the existence of BrC, as modeling results by us and previous studies [37,49] all show AAE of BC with non-absorbing coating materials does not exceed 1.6. The BC EAE range of 0.2–1.35 observed by Cao et al. [100] also implies the occurrence of coatings materials, as EAE of bare aggregates is not less than 1.21 [20]. Considering the effects of coating materials, our calculated EAE is generally within the range of 0.2–2.1, which can provide explanations for the observed small EAE.
With the BrC ratio increases, AAE of BC-containing particles does not necessarily increase, as the morphology transformation will lead to a decrease of AAE as BC transform from thinly-coated to heavily-coated. In addition, for BC with non-absorbing OC, AAE can decrease with OC thickness increasing. Additionally, the increase in coating materials does not necessarily decrease EAE. For heavily-coated BC, the addition of coating materials does decrease the BC EAE, while the EAE of thinly-coated BC increases with increasing coating materials. We found that it is not possible to differentiate between thinly- and heavily-coated BC based on EAE or AAE alone. On the other hand, SSA is much less sensitive to the size and provides much more information for distinguishing heavily-coated BC from thinly-coated BC.
For BC with different coating materials and mixing states, AAE, EAE, and SSA show rather different sensitivities to particle size and composition ratios, and their spectral dependences also exhibit distinct differences. Different AAE and EAE trends with BC/OC ratio were also found for BC with different coating materials and mixing states. Furthermore, an empirical fitting for AAE, EAE, SSA, C, and C is also found, which may be useful for retrieving the size information based on the optical measurements.
Although our calculations are extensive and representative, they are by no means exhaustive. For example, a fixed BC refractive index was assumed in this work, while it may show a little wavelength-dependent in the atmosphere. In our calculations, we just used some typical BrC refractive indices. However, the reported BrC refractive indices are in a rather wide range in different studies. Furthermore, two typical morphologies were used to represent the thinly-coated and heavily-coated BC. However, the morphologies in the atmosphere are more complex. Therefore, the optical properties of more morphological realistic models need to be investigated in the future. We also acknowledge that the presence of OC or BrC externally mixed with BC is often a confounding factor in analyzing atmospheric observations.
Author Contributions
Conceptualization, J.L. and Q.Z.; methodology, J.L. and Q.Z.; software, J.L.; validation, J.L., Q.Z., and Y.Z.; formal analysis, J.L.; investigation, J.L. and Q.Z.; resources, J.L.; data curation, J.L.; writing—original draft preparation, J.L.; writing—review and editing, Q.Z. and Y.Z.; visualization, J.L.; supervision, Q.Z.; project administration, Q.Z. and Y.Z.; funding acquisition, Q.Z. and Y.Z. All authors have read and agreed to the published version of the manuscript.
Funding
This research was funded by The National Natural Science Foundation of China (Grant No. 41675024 and U1733126) and Fundamental Research Funds for the Central Universities (Grant No. WK2320000040).
Acknowledgments
We are grateful to D.W. Mackowski and M.I. Mishchenko for the MSTM code. The numerical calculations in this paper have been done on the supercomputing system in the Supercomputing Center of University of Science and Technology of China. The calculated data can be found from https://figshare.com/articles/dataset/Database_or_optical_properties_of_coated_black_carbon_aggregates/12827327.
Conflicts of Interest
The authors declare no conflict of interest.
Appendix A

Table A1.
Fitting parameters of BC aerosols for AAE (350–700 nm).
| Cases | |||||
|---|---|---|---|---|---|
| Bare | 1.537 | −0.917 | 0.413 | −0.073 | 0.124 |
| BC/OC = 6.0 (Thin, non-absorbing) | 1.512 | −0.846 | 0.379 | −0.067 | 0.120 |
| BC/OC = 2.25 (Thin, non-absorbing) | 1.514 | −0.745 | 0.317 | −0.056 | 0.115 |
| BC/OC = 1.0 (Thin, non-absorbing) | 1.575 | −0.809 | 0.364 | −0.064 | 0.131 |
| BC/OC = 0.375 (Thin, non-absorbing) | 1.424 | −0.415 | 0.200 | −0.037 | 0.016 |
| BC/OC = 6.0 (Thin, BrC) | 1.537 | −0.833 | 0.380 | −007 | 0.093 |
| BC/OC = 2.25 (Thin, BrC) | 1.782 | −0.980 | 0.448 | −0.080 | 0.133 |
| BC/OC = 1.0 (Thin, BrC) | 1.961 | −0.873 | 0.380 | −0.064 | 0.102 |
| BC/OC = 0.375 (Thin, BrC) | 2.337 | −0.728 | 0.345 | −0.0617 | 0.009 |
| BC/OC = 0.167 (Heavy, non-absorbing) | 4.581 | −5.867 | 2.665 | −0.486 | 1.274 |
| BC/OC = 0.122 (Heavy, non-absorbing) | 2.970 | −3.719 | 1.944 | −0.383 | 0.331 |
| BC/OC = 0.096 (Heavy, non-absorbing) | 2.907 | −3.684 | 1.927 | −0.379 | 0.339 |
| BC/OC = 0.079 (Heavy, non-absorbing) | 2.277 | −2.848 | 1.650 | −0.339 | −0.049 |
| BC/OC = 0.167 (Heavy, BrC) | 4.864 | −5.702 | 2.830 | −0.538 | 0.492 |
| BC/OC = 0.122 (Heavy, BrC) | 4.500 | −4.915 | 2.525 | −0.487 | 0.150 |
| BC/OC = 0.096 (Heavy, BrC) | 3.843 | −3.672 | 1.981 | −0.386 | −0.280 |
| BC/OC = 0.079 (Heavy, BrC) | 4.105 | −3.911 | 2.129 | −0.418 | −0.257 |
Table A2.
Fitting parameters of BC aerosols for EAE (350–700 nm).
| Cases | |||||
|---|---|---|---|---|---|
| Bare | 2.154 | −1.275 | 0.478 | −0.077 | 0.420 |
| BC/OC = 6.0 (Thin, non-absorbing) | 2.164 | −1.225 | 0.450 | −0.071 | 0.427 |
| BC/OC = 2.25 (Thin, non-absorbing) | 2.236 | −1.195 | 0.415 | −0.064 | 0.439 |
| BC/OC = 1.0 (Thin, non-absorbing) | 2.463 | −1.428 | 0.535 | −0.085 | 0.505 |
| BC/OC = 0.375 (Thin, non-absorbing) | 2.700 | −1.431 | 0.526 | −0.084 | 0.472 |
| BC/OC = 6.0 (Thin, BrC) | 2.150 | −1.191 | 0.447 | −0.072 | 0.379 |
| BC/OC = 2.25 (Thin, BrC) | 2.438 | −1.434 | 0.564 | −0.093 | 0.422 |
| BC/OC = 1.0 (Thin, BrC) | 2.698 | −1.511 | 0.581 | −0.091 | 0.404 |
| BC/OC = 0.375 (Thin, BrC) | 3.085 | −1.662 | 0.712 | −0.121 | 0.247 |
| BC/OC = 0.167 (Heavy, non-absorbing) | 4.656 | −6.096 | 2.771 | −0.490 | 0.564 |
| BC/OC = 0.122 (Heavy, non-absorbing) | 3.560 | −4.600 | 2.199 | −0.392 | −0.088 |
| BC/OC = 0.096 (Heavy, non-absorbing) | 3.430 | −4.517 | 2.176 | −0.388 | −0.158 |
| BC/OC = 0.079 (Heavy, non-absorbing) | 2.615 | −3.403 | 1.732 | −0.308 | −0.644 |
| BC/OC = 0.167 (Heavy, BrC) | 3.175 | −4.520 | 2.568 | −0.501 | −0.744 |
| BC/OC = 0.122 (Heavy, BrC) | 2.162 | −3.241 | 2.130 | −0.433 | −1.348 |
| BC/OC = 0.096 (Heavy, BrC) | 1.445 | −2.345 | 1.806 | −0.380 | −1.738 |
| BC/OC = 0.079 (Heavy, BrC) | 1.029 | −1.904 | 1.685 | −0.364 | −1.967 |
Table A3.
Fitting parameters of BC aerosols for SSA (532 nm).
| Cases | |||||
|---|---|---|---|---|---|
| Bare | −0.004 | 0.420 | −0.224 | 0.043 | 0.045 |
| BC/OC = 6.0 (Thin, non-absorbing) | 0.022 | 0.406 | −0.223 | 0.043 | 0.058 |
| BC/OC = 2.25 (Thin, non-absorbing) | 0.076 | 0.367 | −0.211 | 0.041 | 0.082 |
| BC/OC = 1.0 (Thin, non-absorbing) | 0.189 | 0.288 | −0.188 | 0.038 | 0.132 |
| BC/OC = 0.375 (Thin, non-absorbing) | 0.553 | −0.017 | −0.085 | 0.023 | 0.282 |
| BC/OC = 6.0 (Thin, BrC) | 0.023 | 0.399 | −0.218 | 0.042 | 0.057 |
| BC/OC = 2.25 (Thin, BrC) | 0.071 | 0.364 | −0.207 | 0.040 | 0.078 |
| BC/OC = 1.0 (Thin, BrC) | 0.165 | 0.300 | −0.190 | 0.038 | 0.119 |
| BC/OC = 0.375 (Thin, BrC) | 0.450 | 0.065 | −0.112 | 0.026 | 0.236 |
| BC/OC = 0.167 (Heavy, non-absorbing) | 1.607 | −1.233 | 0.405 | −0.063 | 0.640 |
| BC/OC = 0.122 (Heavy, non-absorbing) | 1.526 | −1.046 | 0.340 | −0.052 | 0.533 |
| BC/OC = 0.096 (Heavy, non-absorbing) | 0.760 | 0.159 | −0.149 | 0.036 | 0.0328 |
| BC/OC = 0.079 (Heavy, non-absorbing) | 1.373 | −0.737 | 0.232 | −0.035 | 0.373 |
| BC/OC = 0.167 (Heavy, BrC) | 1.474 | −1.111 | 0.331 | −0.047 | 0.632 |
| BC/OC = 0.122 (Heavy, BrC) | 1.455 | −1.031 | 0.303 | −0.042 | 0.573 |
| BC/OC = 0.096 (Heavy, BrC) | 1.426 | −0.953 | 0.274 | −0.037 | 0.521 |
| BC/OC = 0.079 (Heavy, BrC) | 1.398 | −0.884 | 0.248 | −0.032 | 0.479 |
Table A4.
Fitting parameters of BC aerosols for (350 nm).
| Cases | |||||
|---|---|---|---|---|---|
| Bare | 0.164 | −0.327 | 0.247 | −0.054 | 0.074 |
| BC/OC = 6.0 (Thin, non-absorbing) | 0.178 | −0.354 | 0.265 | −0.0581 | 0.081 |
| BC/OC = 2.25 (Thin, non-absorbing) | 0.200 | −0.391 | 0.292 | −0.064 | 0.089 |
| BC/OC = 1.0 (Thin, non-absorbing) | 0.221 | −0.437 | 0.322 | −0.070 | 0.101 |
| BC/OC = 0.375 (Thin, non-absorbing) | 0.274 | −0.539 | 0.393 | −0.085 | 0.125 |
| BC/OC = 6.0 (Thin, BrC) | 0.183 | −0.363 | 0.273 | −0.060 | 0.083 |
| BC/OC = 2.25 (Thin, BrC) | 0.212 | −0.420 | 0.314 | −0.069 | 0.096 |
| BC/OC = 1.0 (Thin, BrC) | 0.261 | −0.520 | 0.390 | −0.085 | 0.118 |
| BC/OC = 0.375 (Thin, BrC) | 0.409 | −0.810 | 0.605 | −0.132 | 0.186 |
| BC/OC = 0.167 (Heavy, non-absorbing) | 0.201 | −0.438 | 0.382 | −0.089 | 0.090 |
| BC/OC = 0.122 (Heavy, non-absorbing) | 0.224 | −0.471 | 0.403 | −0.093 | 0.099 |
| BC/OC = 0.096 (Heavy, non-absorbing) | 0.229 | −0.479 | 0.408 | −0.094 | 0.102 |
| BC/OC = 0.079 (Heavy, non-absorbing) | 0.233 | −0.484 | 0.410 | −0.094 | 0.104 |
| BC/OC = 0.167 (Heavy, BrC) | 0.141 | −0.331 | 0.378 | −0.096 | 0.059 |
| BC/OC = 0.122 (Heavy, BrC) | 0.187 | −0.436 | 0.509 | −0.131 | 0.079 |
| BC/OC = 0.096 (Heavy, BrC) | 0.166 | −0.388 | 0.447 | −0.114 | 0.070 |
| BC/OC = 0.079 (Heavy, BrC) | 0.206 | −0.478 | 0.564 | −0.145 | 0.087 |
Table A5.
Fitting parameters of BC aerosols for (350 nm).
| Cases | |||||
|---|---|---|---|---|---|
| Bare | 0.317 | −0.623 | 0.445 | −0.095 | 0.145 |
| BC/OC = 6.0 (Thin, non-absorbing) | 0.354 | −0.693 | 0.491 | −0.104 | 0.162 |
| BC/OC = 2.25 (Thin, non-absorbing) | 0.408 | −0.800 | 0.566 | −0.121 | 0.186 |
| BC/OC = 1.0 (Thin, non-absorbing) | 0.514 | −1.000 | 0.697 | −0.146 | 0.236 |
| BC/OC = 0.375 (Thin, non-absorbing) | 0.854 | −1.658 | 1.147 | −0.241 | 0.392 |
| BC/OC = 6.0 (Thin, BrC) | 0.356 | −0.698 | 0.497 | −0.106 | 0.162 |
| BC/OC = 2.25 (Thin, BrC) | 0.417 | −0.816 | 0.580 | −0.123 | 0.19 |
| BC/OC = 1.0 (Thin, BrC) | 0.531 | −1.041 | 0.744 | −0.158 | 0.242 |
| BC/OC = 0.375 (Thin, BrC) | 0.901 | −1.765 | 1.259 | −0.268 | 0.411 |
| BC/OC = 0.167 (Heavy, non-absorbing) | −0.092 | −0.124 | 0.597 | −0.180 | −0.081 |
| BC/OC = 0.122 (Heavy, non-absorbing) | −0.230 | 0.069 | 0.613 | −0.198 | −0.152 |
| BC/OC = 0.096 (Heavy, non-absorbing) | −0.405 | 0.338 | 0.575 | −0.203 | −0.239 |
| BC/OC = 0.079 (Heavy, non-absorbing) | −0.092 | −0.124 | 0.597 | −0.180 | −0.081 |
| BC/OC = 0.167 (Heavy, BrC) | 0.062 | −0.296 | 0.583 | −0.162 | 0.0096 |
| BC/OC = 0.122 (Heavy, BrC) | 0.057 | −0.309 | 0.670 | −0.189 | 0.0066 |
| BC/OC = 0.096 (Heavy, BrC) | 0.048 | −0.310 | 0.742 | −0.211 | 0.0027 |
| BC/OC = 0.079 (Heavy, BrC) | 0.037 | −0.298 | 0.798 | −0.229 | −0.0017 |
References
- Shine, K.P.; Forster, P.M.D. The effect of human activity on radiative forcing of climate change: A review of recent developments. Glob. Planet. Chang. 1999, 20, 205–225. [Google Scholar] [CrossRef]
- Haywood, J.; Boucher, O. Estimates of the direct and indirect radiative forcing due to tropospheric aerosols: A review. Rev. Geophys. 2000, 38, 513–543. [Google Scholar] [CrossRef]
- Chylek, P.; Coakley, J.A. Aerosols and Climate. Science 1974, 183, 75–77. [Google Scholar]
- Angstrom, A. On the Atmospheric Transmission of Sun Radiation and on Dust in the Air. Geogr. Ann. 1929, 11, 156–166. [Google Scholar]
- Patel, P.N.; Dumka, U.C.; Kaskaoutis, D.G.; Babu, K.N.; Mathur, A.K. Optical and radiative properties of aerosols over Desalpar, a remote site in western India: Source identification, modification processes and aerosol type discrimination. Sci. Total Environ. 2017, 575, 612–627. [Google Scholar] [CrossRef] [Green Version]
- Lee, J.; Kim, J.; Song, C.H.; Kim, S.B.; Chun, Y.; Sohn, B.J.; Holben, B.N. Characteristics of aerosol types from AERONET sunphotometer measurements. Atmos. Environ. 2010, 44, 3110–3117. [Google Scholar] [CrossRef]
- Levy, R.C.; Remer, L.A.; Dubovik, O. Global aerosol optical properties and application to Moderate Resolution Imaging Spectroradiometer aerosol retrieval over land. J. Geophys. Res. Atmos. 2007, 112. [Google Scholar] [CrossRef] [Green Version]
- Eck, T.F.; Holben, B.N.; Reid, J.S.; Dubovik, O.; Smirnov, A.; O’Neill, N.T.; Slutsker, I.; Kinne, S. Wavelength dependence of the optical depth of biomass burning, urban, and desert dust aerosols. J. Geophys. Res. Atmos. 1999, 104, 31333–31349. [Google Scholar] [CrossRef]
- Kalapureddy, M.C.R.; Kaskaoutis, D.G.; Raj, P.E.; Devara, P.C.S.; Kambezidis, H.D.; Kosmopoulos, P.G.; Nastos, P.T. Identification of aerosol type over the Arabian Sea in the premonsoon season during the Integrated Campaign for Aerosols, Gases and Radiation Budget (ICARB). J. Geophys. Res. Atmos. 2009, 114. [Google Scholar] [CrossRef] [Green Version]
- Schuster, G.L.; Dubovik, O.; Holben, B.N. Ångström Exponent and bimodal aerosol size distributions. J. Geophys. Res.-Atmos. 2006, 111. [Google Scholar] [CrossRef] [Green Version]
- Kaufman, Y.J. Aerosol Optical-Thickness and Atmospheric Path Radiance. J. Geophys. Res. Atmos. 1993, 98, 2677–2692. [Google Scholar] [CrossRef] [Green Version]
- Russell, P.B.; Bergstrom, R.W.; Shinozuka, Y.; Clarke, A.D.; DeCarlo, P.F.; Jimenez, J.L.; Livingston, J.M.; Redemann, J.; Dubovik, O.; Strawa, A. Absorption Ångström Exponent in AERONET and related data as an indicator of aerosol composition. Atmos. Chem. Phys. 2010, 10, 1155–1169. [Google Scholar] [CrossRef] [Green Version]
- Bergstrom, R.W.; Russell, P.B.; Hignett, P. Wavelength dependence of the absorption of black carbon particles: Predictions and results from the TARFOX experiment and implications for the aerosol single scattering albedo. J. Atmos. Sci. 2002, 59, 567–577. [Google Scholar] [CrossRef] [Green Version]
- Kam, Z. Absorption and Scattering of Light by Small Particles. Nature 1983, 306, 625. [Google Scholar] [CrossRef]
- Yang, M.; Howell, S.G.; Zhuang, J.; Huebert, B.J. Attribution of aerosol light absorption to black carbon, brown carbon, and dust in China - interpretations of atmospheric measurements during EAST-AIRE. Atmos. Chem. Phys. 2009, 9, 2035–2050. [Google Scholar] [CrossRef] [Green Version]
- Satheesh, S.K.; Srinivasan, J. A method to estimate aerosol radiative forcing from spectral optical depths. J. Atmos. Sci. 2006, 63, 1082–1092. [Google Scholar] [CrossRef]
- Zhang, R.Y.; Khalizov, A.F.; Pagels, J.; Zhang, D.; Xue, H.X.; McMurry, P.H. Variability in morphology, hygroscopicity, and optical properties of soot aerosols during atmospheric processing. Proc. Natl. Acad. Sci. USA 2008, 105, 10291–10296. [Google Scholar] [CrossRef] [Green Version]
- Forster, P.; Ramaswamy, V.; Artaxo, P.; Berntsen, T.; Betts, R.; Fahey, D.W.; Haywood, J.; Lean, J.; Lowe, D.C.; Myhre, G.; et al. Changes in atmospheric constituents and in radiative forcing. Chapter 2. In Climate Change 2007. The Physical Science Basis; IPCC: Geneva, Switzerland, 2007. [Google Scholar]
- Bond, T.C.; Doherty, S.J.; Fahey, D.W.; Forster, P.M.; Berntsen, T.; DeAngelo, B.J.; Flanner, M.G.; Ghan, S.; Kärcher, B.; Koch, D.; et al. Bounding the role of black carbon in the climate system: A scientific assessment. J. Geophys. Res. Atmos. 2013, 118, 5380–5552. [Google Scholar] [CrossRef]
- Li, J.; Liu, C.; Yin, Y.; Kumar, K.R. Numerical investigation on the Ångström Exponent of black carbon aerosol. J. Geophys. Res. Atmos. 2016, 121, 3506–3518. [Google Scholar] [CrossRef] [Green Version]
- Smith, A.J.A.; Peters, D.M.; McPheat, R.; Lukanihins, S.; Grainger, R.G. Measuring black carbon spectral extinction in the visible and infrared. J. Geophys. Res. Atmos. 2015, 120, 9670–9683. [Google Scholar] [CrossRef]
- Liu, L.; Mishchenko, M.I. Effects of aggregation on scattering and radiative properties of soot aerosols. J. Geophys. Res. Atmos. 2005, 110. [Google Scholar] [CrossRef] [Green Version]
- Smith, A.J.A.; Grainger, R.G. Simplifying the calculation of light scattering properties for black carbon fractal aggregates. Atmos. Chem. Phys. 2014, 14, 7825–7836. [Google Scholar] [CrossRef] [Green Version]
- Wu, Y.; Cheng, T.H.; Gu, X.F.; Zheng, L.J.; Chen, H.; Xu, H. The single scattering properties of soot aggregates with concentric core-shell spherical monomers. J. Quant. Spectrosc. Radiat. Transf. 2014, 135, 9–19. [Google Scholar] [CrossRef]
- Liu, C.; Chung, C.E.; Yin, Y.; Schnaiter, M. The absorption Ångström exponent of black carbon: From numerical aspects. Atmos. Chem. Phys. 2018, 18, 6259–6273. [Google Scholar] [CrossRef] [Green Version]
- Conrad, B.; Johnson, M. Mass absorption cross-section of flare-generated black carbon: Variability, predictive model, and implications. Carbon 2019, 149, 760–771. [Google Scholar] [CrossRef]
- China, S.; Salvadori, N.; Mazzoleni, C. Effect of Traffic and Driving Characteristics on Morphology of Atmospheric Soot Particles at Freeway On-Ramps. Environ. Sci. Technol. 2014, 48, 3128–3135. [Google Scholar] [CrossRef] [PubMed]
- China, S.; Mazzoleni, C.; Gorkowski, K.; Aiken, A.C.; Dubey, M.K. Morphology and mixing state of individual freshly emitted wildfire carbonaceous particles. Nat. Commun. 2013, 4. [Google Scholar] [CrossRef] [Green Version]
- China, S.; Scarnato, B.; Owen, R.C.; Zhang, B.; Ampadu, M.T.; Kumar, S.; Dzepina, K.; Dziobak, M.P.; Fialho, P.; Perlinger, J.A.; et al. Morphology and mixing state of aged soot particles at a remote marine free troposphere site: Implications for optical properties. Geophys. Res. Lett. 2015, 42, 1243–1250. [Google Scholar] [CrossRef]
- Wang, Y.Y.; Liu, F.S.; He, C.L.; Bi, L.; Cheng, T.H.; Wang, Z.L.; Zhang, H.; Zhang, X.Y.; Shi, Z.B.; Li, W.J. Fractal Dimensions and Mixing Structures of Soot Particles during Atmospheric Processing. Environ. Sci. Technol. Lett. 2017, 4, 487–493. [Google Scholar] [CrossRef]
- Wu, Y.; Cheng, T.; Liu, D.; Allan, J.D.; Zheng, L.; Chen, H. Light Absorption Enhancement of Black Carbon Aerosol Constrained by Particle Morphology. Environ. Sci. Technol. 2018, 52, 6912–6919. [Google Scholar] [CrossRef] [PubMed]
- Luo, J.; Zhang, Y.; Zhang, Q.; Wang, F.; Liu, J.; Wang, J. Sensitivity analysis of morphology on radiative properties of soot aerosols. Opt. Express 2018, 26, A420–A432. [Google Scholar] [CrossRef] [PubMed]
- Kahnert, M. Optical properties of black carbon aerosols encapsulated in a shell of sulfate: Comparison of the closed cell model with a coated aggregate model. Opt. Express 2017, 25, 24579–24593. [Google Scholar] [CrossRef] [Green Version]
- Liu, C.; Xu, X.; Yin, Y.; Schnaiter, M.; Yung, Y.L. Black carbon aggregates: A database for optical properties. J. Quant. Spectrosc. Radiat. Transf. 2019, 222–223, 170–179. [Google Scholar] [CrossRef]
- Kahnert, M.; Nousiainen, T.; Lindqvist, H. Models for integrated and differential scattering optical properties of encapsulated light absorbing carbon aggregates. Opt. Express 2013, 21, 7974–7993. [Google Scholar] [CrossRef] [PubMed] [Green Version]
- Liu, L.; Mishchenko, M.I. Scattering and Radiative Properties of Morphologically Complex Carbonaceous Aerosols: A Systematic Modeling Study. Remote Sens. 2018, 10, 1634. [Google Scholar] [CrossRef] [Green Version]
- Zhang, X.; Mao, M.; Yin, Y.; Tang, S. The absorption Ångstrom exponent of black carbon with brown coatings: Effects of aerosol microphysics and parameterization. Atmos. Chem. Phys. 2020, 20, 9701–9711. [Google Scholar] [CrossRef]
- Wu, Y.; Cheng, T.H.; Zheng, L.J.; Chen, H. Models for the optical simulations of fractal aggregated soot particles thinly coated with non-absorbing aerosols. J. Quant. Spectrosc. Radiat. Transf. 2016, 182, 1–11. [Google Scholar] [CrossRef]
- Kahnert, M. On the Discrepancy between Modeled and Measured Mass Absorption Cross Sections of Light Absorbing Carbon Aerosols. Aerosol Sci. Technol. 2010, 44, 453–460. [Google Scholar] [CrossRef]
- Kahnert, M. Numerically exact computation of the optical properties of light absorbing carbon aggregates for wavelength of 200 nm–12.2 μm. Atmos. Chem. Phys. 2010, 10, 8319–8329. [Google Scholar] [CrossRef] [Green Version]
- Wu, Y.; Cheng, T.; Zheng, L.; Chen, H. Effect of morphology on the optical properties of soot aggregated with spheroidal monomers. J. Quant. Spectrosc. Radiat. Transf. 2016, 168, 158–169. [Google Scholar] [CrossRef]
- Liu, L.; Mishchenko, M.I.; Arnott, W.P. A study of radiative properties of fractal soot aggregates using the superposition T-matrix method. J. Quant. Spectrosc. Radiat. Transf. 2008, 109, 2656–2663. [Google Scholar] [CrossRef]
- Cheng, T.H.; Wu, Y.; Chen, H. Effects of morphology on the radiative properties of internally mixed light absorbing carbon aerosols with different aging status. Opt. Express 2014, 22, 15904–15917. [Google Scholar] [CrossRef] [PubMed]
- Cheng, T.; Wu, Y.; Gu, X.; Chen, H. Effects of mixing states on the multiple-scattering properties of soot aerosols. Opt. Express 2015, 23, 10808–10821. [Google Scholar] [CrossRef] [PubMed]
- Liu, C.; Li, J.; Yin, Y.; Zhu, B.; Feng, Q. Optical properties of black carbon aggregates with non-absorptive coating. J. Quant. Spectrosc. Radiat. Transf. 2017, 187, 443–452. [Google Scholar] [CrossRef]
- Scarnato, B.V.; Vahidinia, S.; Richard, D.T.; Kirchstetter, T.W. Effects of internal mixing and aggregate morphology on optical properties of black carbon using a discrete dipole approximation model. Atmos. Chem. Phys. 2013, 13, 5089–5101. [Google Scholar] [CrossRef] [Green Version]
- Dong, J.; Zhao, J.; Liu, L. Morphological effects on the radiative properties of soot aerosols in different internally mixing states with sulfate. J. Quant. Spectrosc. Radiat. Transf. 2015, 165, 43–55. [Google Scholar] [CrossRef]
- Luo, J.; Zhang, Q.; Luo, J.; Liu, J.; Huo, Y.; Zhang, Y. Optical Modeling of Black Carbon With Different Coating Materials: The Effect of Coating Configurations. J. Geophys. Res. Atmos. 2019, 124, 13230–13253. [Google Scholar] [CrossRef]
- Lack, D.A.; Cappa, C.D. Impact of brown and clear carbon on light absorption enhancement, single scatter albedo and absorption wavelength dependence of black carbon. Atmos. Chem. Phys. 2010, 10, 4207–4220. [Google Scholar] [CrossRef] [Green Version]
- Mie, G. Beiträge zur Optik trüber Medien, speziell kolloidaler Metallösungen. Ann. Phys. 1908, 330, 377–445. [Google Scholar] [CrossRef]
- Bao, F.; Cheng, T.; Li, Y.; Gu, X.; Guo, H.; Wu, Y.; Wang, Y.; Gao, J. Retrieval of black carbon aerosol surface concentration using satellite remote sensing observations. Remote Sens. Environ. 2019, 226, 93–108. [Google Scholar] [CrossRef]
- Wang, X.; Heald, C.L.; Sedlacek, A.J.; de Sá, S.S.; Martin, S.T.; Alexander, M.L.; Watson, T.B.; Aiken, A.C.; Springston, S.R.; Artaxo, P. Deriving brown carbon from multiwavelength absorption measurements: Method and application to AERONET and Aethalometer observations. Atmos. Chem. Phys. 2016, 16, 12733–12752. [Google Scholar] [CrossRef] [Green Version]
- Yang, P.; Wei, H.L.; Kattawar, G.W.; Hu, Y.X.; Winker, D.M.; Hostetler, C.A.; Baum, B.A. Sensitivity of the backscattering Mueller matrix to particle shape and thermodynamic phase. Appl. Opt. 2003, 42, 4389–4395. [Google Scholar] [CrossRef] [PubMed]
- Bi, L.; Yang, P. Tunneling effects in electromagnetic wave scattering by nonspherical particles: A comparison of the Debye series and physical-geometric optics approximations. J. Quant. Spectrosc. Radiat. Transf. 2016, 178, 93–107. [Google Scholar] [CrossRef] [Green Version]
- Adachi, K.; Chung, S.H.; Buseck, P.R. Shapes of soot aerosol particles and implications for their effects on climate. J. Geophys. Res. Atmos. 2010, 115. [Google Scholar] [CrossRef]
- Mishchenko, M.I.; Travis, L.D.; Lacis, A.A. Scattering, Absorption, and Emission of Light by Small Particles; Cambridge University Press: Cambridge, UK, 2002. [Google Scholar]
- Sorensen, C.M. Light scattering by fractal aggregates: A review. Aerosol Sci. Technol. 2001, 35, 648–687. [Google Scholar] [CrossRef]
- Sorensen, C.M.; Roberts, G.C. The prefactor of fractal aggregates. J. Colloid Interface Sci. 1997, 186, 447–452. [Google Scholar] [CrossRef]
- Chakrabarty, R.K.; Moosmuller, H.; Garro, M.A.; Arnott, W.P.; Walker, J.; Susott, R.A.; Babbitt, R.E.; Wold, C.E.; Lincoln, E.N.; Hao, W.M. Emissions from the laboratory combustion of wildland fuels: Particle morphology and size. J. Geophys. Res. Atmos. 2006, 111. [Google Scholar] [CrossRef] [Green Version]
- Wentzel, M.; Gorzawski, H.; Naumann, K.H.; Saathoff, H.; Weinbruch, S. Transmission electron microscopical and aerosol dynamical characterization of soot aerosols. J. Aerosol Sci. 2003, 34, 1347–1370. [Google Scholar] [CrossRef]
- Lattuada, M.; Wu, H.; Morbidelli, M. A simple model for the structure of fractal aggregates. J. Colloid Interface Sci. 2003, 268, 106–120. [Google Scholar] [CrossRef]
- Sorensen, C.M. The Mobility of Fractal Aggregates: A Review. Aerosol Sci. Technol. 2011, 45, 765–779. [Google Scholar] [CrossRef]
- Amin, H.M.F.; Bennett, A.; Roberts, W.L. Determining fractal properties of soot aggregates and primary particle size distribution in counterflow flames up to 10 atm. Proc. Combust. Inst. 2019, 37, 1161–1168. [Google Scholar] [CrossRef]
- Bond, T.C.; Bergstrom, R.W. Light absorption by carbonaceous particles: An investigative review. Aerosol Sci. Technol. 2006, 40, 27–67. [Google Scholar] [CrossRef]
- Liu, C.; Yin, Y.; Hu, F.C.; Jin, H.C.; Sorensen, C.M. The Effects of Monomer Size Distribution on the Radiative Properties of Black Carbon Aggregates. Aerosol Sci. Technol. 2015, 49, 928–940. [Google Scholar] [CrossRef] [Green Version]
- Coz, E.; Leck, C. Morphology and state of mixture of atmospheric soot aggregates during the winter season over Southern Asia-a quantitative approach. Tellus Ser. B Chem. Phys. Meteorol. 2011, 63, 107–116. [Google Scholar] [CrossRef]
- Liou, K.N.; Takano, Y.; Yang, P. Light absorption and scattering by aggregates: Application to black carbon and snow grains. J. Quant. Spectrosc. Radiat. Transf. 2011, 112, 1581–1594. [Google Scholar] [CrossRef]
- Strawa, A.W.; Drdla, K.; Ferry, G.V.; Verma, S.; Pueschel, R.F.; Yasuda, M.; Salawitch, R.J.; Gao, R.S.; Howard, S.D.; Bui, P.T.; et al. Carbonaceous aerosol (Soot) measured in the lower stratosphere during POLARIS and its role in stratospheric photochemistry. J. Geophys. Res. Atmos. 1999, 104, 26753–26766. [Google Scholar] [CrossRef]
- Liu, C.; Panetta, R.L.; Yang, P. The Influence of Water Coating on the Optical Scattering Properties of Fractal Soot Aggregates. Aerosol Sci. Technol. 2012, 46, 31–43. [Google Scholar] [CrossRef]
- He, C.; Liou, K.N.; Takano, Y.; Zhang, R.; Zamora, M.L.; Yang, P.; Li, Q.; Leung, L.R. Variation of the radiative properties during black carbon aging: Theoretical and experimental intercomparison. Atmos. Chem. Phys. 2015, 15, 11967–11980. [Google Scholar] [CrossRef] [Green Version]
- Chakrabarty, R.K.; Heinson, W.R. Scaling Laws for Light Absorption Enhancement due to Nonrefractory Coating of Atmospheric Black Carbon Aerosol. Phys. Rev. Lett. 2018, 121, 218701. [Google Scholar] [CrossRef] [Green Version]
- Ishimoto, H.; Kudo, R.; Adachi, K. A shape model of internally mixed soot particles derived from artificial surface tension. Atmos. Meas. Tech. 2019, 12, 107–118. [Google Scholar] [CrossRef] [Green Version]
- Zhang, X.L.; Mao, M.; Yin, Y.; Wang, B. Absorption enhancement of aged black carbon aerosols affected by their microphysics: A numerical investigation. J. Quant. Spectrosc. Radiat. Transf. 2017, 202, 90–97. [Google Scholar] [CrossRef]
- Teng, S.; Liu, C.; Schnaiter, M.; Chakrabarty, R.K.; Liu, F. Accounting for the effects of nonideal minor structures on the optical properties of black carbon aerosols. Atmos. Chem. Phys. 2019, 19, 2917–2931. [Google Scholar] [CrossRef] [Green Version]
- Turpin, B.J.; Lim, H.J. Species contributions to PM2. 5 mass concentrations: Revisiting common assumptions for estimating organic mass. Aerosol Sci. Technol. 2001, 35, 602–610. [Google Scholar] [CrossRef]
- Woźniak, M. Characterization of Nanoparticle Aggregates with Light Scattering Techniques. Ph.D. Thesis, Aix-Marseille University, Marseille, France, 2012. [Google Scholar]
- Luo, J.; Zhang, Y.M.; Zhang, Q.X. A model study of aggregates composed of spherical soot monomers with an acentric carbon shell. J. Quant. Spectrosc. Radiat. Transf. 2018, 205, 184–195. [Google Scholar] [CrossRef]
- Luo, J.; Zhang, Y.; Wang, F.; Zhang, Q. Effects of brown coatings on the absorption enhancement of black carbon: A numerical investigation. Atmos. Chem. Phys. 2018, 18, 16897–16914. [Google Scholar] [CrossRef] [Green Version]
- Moosmuller, H.; Chakrabarty, R.K.; Arnott, W.P. Aerosol light absorption and its measurement: A review. J. Quant. Spectrosc. Radiat. Transf. 2009, 110, 844–878. [Google Scholar] [CrossRef]
- Schnaiter, M.; Linke, C.; Mohler, O.; Naumann, K.H.; Saathoff, H.; Wagner, R.; Schurath, U.; Wehner, B. Absorption amplification of black carbon internally mixed with secondary organic aerosol. J. Geophys. Res. Atmos. 2005, 110. [Google Scholar] [CrossRef]
- Andreae, M.O.; Gelencser, A. Black carbon or brown carbon? The nature of light-absorbing carbonaceous aerosols. Atmos. Chem. Phys. 2006, 6, 3131–3148. [Google Scholar] [CrossRef] [Green Version]
- Alexander, D.T.L.; Crozier, P.A.; Anderson, J.R. Brown carbon spheres in East Asian outflow and their optical properties. Science 2008, 321, 833–836. [Google Scholar] [CrossRef]
- Kirchstetter, T.W.; Novakov, T.; Hobbs, P.V. Evidence that the spectral dependence of light absorption by aerosols is affected by organic carbon. J. Geophys. Res. Atmos. 2004, 109. [Google Scholar] [CrossRef] [Green Version]
- Chen, Y.; Bond, T.C. Light absorption by organic carbon from wood combustion. Atmos. Chem. Phys. 2010, 10, 1773–1787. [Google Scholar] [CrossRef] [Green Version]
- Mackowski, D.W.; Mishchenko, M.I. A multiple sphere T-matrix Fortran code for use on parallel computer clusters. J. Quant. Spectrosc. Radiat. Transf. 2011, 112, 2182–2192. [Google Scholar] [CrossRef]
- Mishchenko, M.I.; Liu, L.; Travis, L.D.; Lacis, A.A. Scattering and radiative properties of semi-external versus external mixtures of different aerosol types. J. Quant. Spectrosc. Radiat. Transf. 2004, 88, 139–147. [Google Scholar] [CrossRef]
- Draine, B.T.; Flatau, P.J. Discrete-Dipole Approximation for Scattering Calculations. J. Opt. Soc. Am. A-Opt. Image Sci. Vis. 1994, 11, 1491–1499. [Google Scholar] [CrossRef]
- Laczik, Z. Discrete-dipole-approximation-based light-scattering calculations for particles with a real refractive index smaller than unity. Appl. Opt. 1996, 35, 3736–3745. [Google Scholar] [CrossRef] [PubMed]
- Smith, D.A.; Stokes, K.L. Discrete dipole approximation for magneto-optical scattering calculations. Opt. Express 2006, 14, 5746–5754. [Google Scholar] [CrossRef]
- Yee, K. Numerical solution of initial boundary value problems involving Maxwell’s equations in isotropic media. IEEE Trans. Antennas Propag. 1966, 14, 302–307. [Google Scholar]
- Taflove, A.; Hagness, S.C. Computational Electrodynamics: The Finite-Difference Time-Domain Method; Artech House: Norwood, MA, USA, 2005. [Google Scholar]
- Xu, Y.L. Calculation of the addition coefficients in electromagnetic multisphere-scattering theory (vol 127, pg 285, 1996). J. Comput. Phys. 1997, 134, 200. [Google Scholar] [CrossRef]
- Xu, Y.L.; Gustafson, B.A.S. A generalized multiparticle Mis-solution: Further experimental verification. J. Quant. Spectrosc. Radiat. Transf. 2001, 70, 395–419. [Google Scholar] [CrossRef]
- Mackowski, D.W. MSTM Version 3.0: April 2013. Available online: http://www.eng.auburn.edu/~dmckwski/scatcodes/ (accessed on 13 October 2020).
- Mishchenko, M.I.; Yurkin, M.A. On the concept of random orientation in far-field electromagnetic scattering by nonspherical particles. Opt. Lett. 2017, 42, 494–497. [Google Scholar] [CrossRef] [Green Version]
- Schwarz, J.P.; Gao, R.S.; Spackman, J.R.; Watts, L.A.; Thomson, D.S.; Fahey, D.W.; Ryerson, T.B.; Peischl, J.; Holloway, J.S.; Trainer, M.; et al. Measurement of the mixing state, mass, and optical size of individual black carbon particles in urban and biomass burning emissions. Geophys. Res. Lett. 2008, 35. [Google Scholar] [CrossRef]
- Zhang, X.; Mao, M.; Yin, Y.; Wang, B. Numerical Investigation on Absorption Enhancement of Black Carbon Aerosols Partially Coated With Nonabsorbing Organics. J. Geophys. Res. Atmos. 2018, 123, 1297–1308. [Google Scholar] [CrossRef]
- Bond, T.C.; Covert, D.S.; Kramlich, J.C.; Larson, T.V.; Charlson, R.J. Primary particle emissions from residential coal burning: Optical properties and size distributions. J. Geophys. Res. Atmos. 2002, 107. [Google Scholar] [CrossRef]
- Schnaiter, M.; Horvath, H.; Mohler, O.; Naumann, K.H.; Saathoff, H.; Schock, O.W. UV-VIS-NIR spectral optical properties of soot and soot-containing aerosols. J. Aerosol Sci. 2003, 34, 1421–1444. [Google Scholar] [CrossRef]
- Cao, X.J.; Liang, J.N.; Tian, P.F.; Zhang, L.; Quan, X.J.; Liu, W.P. The mass concentration and optical properties of black carbon aerosols over a semi-arid region in the northwest of China. Atmos. Pollut. Res. 2014, 5, 601–609. [Google Scholar] [CrossRef] [Green Version]
- Adachi, K.; Buseck, P.R. Internally mixed soot, sulfates, and organic matter in aerosol particles from Mexico City. Atmos. Chem. Phys. 2008, 8, 6469–6481. [Google Scholar] [CrossRef] [Green Version]
- Pokhrel, R.P.; Wagner, N.L.; Langridge, J.M.; Lack, D.A.; Jayarathne, T.; Stone, E.A.; Stockwell, C.E.; Yokelson, R.J.; Murphy, S.M. Parameterization of single-scattering albedo (SSA) and absorption Angstrom exponent (AAE) with EC/OC for aerosol emissions from biomass burning. Atmos. Chem. Phys. 2016, 16, 9549–9561. [Google Scholar] [CrossRef] [Green Version]
- Luo, J.; Zhang, Y.; Wang, F.; Wang, J.; Zhang, Q. Applying machine learning to estimate the optical properties of black carbon fractal aggregates. J. Quant. Spectrosc. Radiat. Transf. 2018, 215, 1–8. [Google Scholar] [CrossRef]
- Lack, D.A.; Langridge, J.M.; Bahreini, R.; Cappa, C.D.; Middlebrook, A.M.; Schwarz, J.P. Brown carbon and internal mixing in biomass burning particles. Proc. Natl. Acad. Sci. USA 2012, 109, 14802–14807. [Google Scholar] [CrossRef] [Green Version]
- Chakrabarty, R.; Moosmüller, H.; Chen, L.W.; Lewis, K.; Arnott, W.; Mazzoleni, C.; Dubey, M.; Wold, C.; Hao, W.; Kreidenweis, S. Brown carbon in tar balls from smoldering biomass combustion. Atmos. Chem. Phys. 2010, 10, 6363–6370. [Google Scholar] [CrossRef] [Green Version]
- Saleh, R.; Hennigan, C.; McMeeking, G.; Chuang, W.; Robinson, E.; Coe, H.; Donahue, N.; Robinson, A. Absorptivity of brown carbon in fresh and photo-chemically aged biomass-burning emissions. Atmos. Chem. Phys. 2013, 13, 7683–7693. [Google Scholar] [CrossRef] [Green Version]
- Cheng, Y.; He, K.B.; Engling, G.; Weber, R.; Liu, J.M.; Du, Z.Y.; Dong, S.P. Brown and black carbon in Beijing aerosol: Implications for the effects of brown coating on light absorption by black carbon. Sci. Total Environ. 2017, 599, 1047–1055. [Google Scholar] [CrossRef] [PubMed]
- Lin, G.; Penner, J.E.; Flanner, M.G.; Sillman, S.; Xu, L.; Zhou, C. Radiative forcing of organic aerosol in the atmosphere and on snow: Effects of SOA and brown carbon. J. Geophys. Res. Atmos. 2014, 119, 7453–7476. [Google Scholar] [CrossRef] [Green Version]
Figure 1.
BC models, .

Figure 2.
Radiative properties of BC with coatings, . When BC/OC > 0.375, BC is assumed to be thinly-coated, while BC is assessed to be heavily-coated when BC/OC < 0.167. The green and blue region represent heavily- and thinly-coated BC, respectively, and the gray region represents the transition from thin-coated to heavily-coated. The error bars represent the upper and lower bounds of sensitivity calculations using different size distributions.

Figure 3.
Similar to Figure 2, but for thinly-coated BC.
Figure 3.
Similar to Figure 2, but for thinly-coated BC.

Figure 4.
Radiative properties of thinly-coated BC as the function of at different (, BC/OC = 0.375 for coated BC).
Figure 4.
Radiative properties of thinly-coated BC as the function of at different (, BC/OC = 0.375 for coated BC).

Figure 5.
Radiative properties of BC as the function of at different mixing states, = 1.5.

Figure 6.
Comparison of the fitted radiative properties and those calculated using MSTM, , where correlation coefficients () > 0.999 and normalized mean absolute error (NMAE) < 10.
Figure 6.
Comparison of the fitted radiative properties and those calculated using MSTM, , where correlation coefficients () > 0.999 and normalized mean absolute error (NMAE) < 10.

Figure 7.
Similar to Figure 6, but for absorption and extinction cross-sections (350 nm), where the correlation coefficients () > 0.999 and the normalized mean absolute errors (NMAE) < 10.
Figure 7.
Similar to Figure 6, but for absorption and extinction cross-sections (350 nm), where the correlation coefficients () > 0.999 and the normalized mean absolute errors (NMAE) < 10.

Figure 8.
The wavelength dependences of radiative properties of BC at different mixing states, m, .

Figure 9.
AAE and EAE of BC at different wavelength pairs for different mixing states and size distributions, .BC/OC = 0.1 for thinly-coated BC and BC/OC = 0.096 for heavily-coated BC.
Figure 9.
AAE and EAE of BC at different wavelength pairs for different mixing states and size distributions, .BC/OC = 0.1 for thinly-coated BC and BC/OC = 0.096 for heavily-coated BC.

Figure 10.
The sensitivity of AAE (350, 700 nm) and EAE to the imaginary part of BrC coatings RI, BrC A and BrC B represent the measured values by Kirchstetter et al. [83] and Chen and Bond [84]. The figures in the left column represent AAE and EAE of thinly-coated BC, and the right column represent AAE and EAE of heavily-coated BC. BC/OC = 0.1 for thinly-coated BC and BC/OC = 0.096 for heavily-coated BC.

Figure 11.
Similar to Figure 10, but for the sensitivity of the real part of BrC coatings RI (Re(m)).
Figure 11.
Similar to Figure 10, but for the sensitivity of the real part of BrC coatings RI (Re(m)).

Table 1.
Relevant literature on the numerical investigation of absorption Ångström exponent (AAE), extinction Ångström exponent (EAE), and single-scattering albedo (SSA) of black carbon (BC).
Table 1.
Relevant literature on the numerical investigation of absorption Ångström exponent (AAE), extinction Ångström exponent (EAE), and single-scattering albedo (SSA) of black carbon (BC).
| Relevant Literature | AAE | EAE | SSA | BC Type | Bulk Optical Properties | Coating Type |
|---|---|---|---|---|---|---|
| Kahnert [39] | No | No | Yes | Bare | No | No |
| Liu and Mishchenko [22] | No | No | Yes | Bare | No | No |
| Kahnert [40] | No | No | Yes | Bare | No | No |
| Wu et al. [41] | No | No | Yes | Bare | No | No |
| Liu et al. [42] | No | No | Yes | Bare | No | No |
| Wu et al. [38] | No | No | Yes | Thinly-coated | No | Non-absorbing |
| Wu et al. [24] | No | No | Yes | Thinly-coated | No | Non-absorbing |
| Cheng et al. [43] | No | No | Yes | Thinly/Heavily-coated | No | Non-absorbing |
| Cheng et al. [44] | No | No | Yes | Heavily-coated | No | Non-absorbing |
| Kahnert et al. [35] | Yes | No | Yes | Heavily-coated | No | Non-absorbing |
| Liu and Mishchenko [36] | Yes | No | Yes | Thinly/heavily-coated | No | Non-absorbing |
| Liu et al. [45] | No | No | Yes | Partially/Heavily-coated | No | Non-absorbing |
| Scarnato et al. [46] | Yes | No | Yes | Partially/Heavily-coated | No | Non-absorbing |
| Dong et al. [47] | No | No | Yes | Partially | No | Non-absorbing |
| Luo et al. [48] | Yes | Yes | No | With different coating structures | No | Non-absorbing |
| Li et al. [20] | Yes | Yes | Yes | Bare | Yes | No |
| Liu et al. [25] | Yes | No | No | Bare/Heavily-coated | Yes | Non-absorbing |
| Zhang et al. [37] | Yes | No | No | Partially/Heavily-coated | Yes | Brown |
| Lack and Cappa [49] | Yes | No | Yes | Spherical | Yes | Brown/Non-absorbing |
Table 2.
Spectral-dependent characteristics of the modeled BC under different mixing states, m, .
| Cases | BC/OC | AAE (350–700 nm) | AAE (532–700 nm) | EAE (350–700 nm) | EAE (532–700 nm) |
|---|---|---|---|---|---|
| Case A | 1 | 1.061 | 1.068 | 1.478 | 1.459 |
| Case B | 1 | 1.404 | 1.306 | 1.677 | 1.625 |
| Case C | 0.0957 | 70072 | 0.931 | 70001 | 1.049 |
| Case D | 0.0957 | 1.762 | 2.276 | 0.526 | 0.992 |
Table 3.
Imaginary parts of the refractive index of BrC.
| Wavelength (nm) | 350 | 400 | 450 | 500 | 550 | 600 | 650 | 700 |
|---|---|---|---|---|---|---|---|---|
| BrC A | 0.168 | 0.112 | 0.063 | 0.045 | 0.030 | 0.017 | 0.005 | 0.001 |
| BrC B | 0.0738 | 0.025 | 0.0066 | 0.0024 | 0.0010 | 0.0004 | 0.0002 | 0.0001 |
Publisher’s Note: MDPI stays neutral with regard to jurisdictional claims in published maps and institutional affiliations. |
© 2020 by the authors. Licensee MDPI, Basel, Switzerland. This article is an open access article distributed under the terms and conditions of the Creative Commons Attribution (CC BY) license (http://creativecommons.org/licenses/by/4.0/).
Share and Cite
MDPI and ACS Style
Luo, J.; Zhang, Y.; Zhang, Q. The Ångström Exponent and Single-Scattering Albedo of Black Carbon: Effects of Different Coating Materials. Atmosphere 2020, 11, 1103. https://doi.org/10.3390/atmos11101103
AMA Style
Luo J, Zhang Y, Zhang Q. The Ångström Exponent and Single-Scattering Albedo of Black Carbon: Effects of Different Coating Materials. Atmosphere. 2020; 11(10):1103. https://doi.org/10.3390/atmos11101103
Chicago/Turabian StyleLuo, Jie, Yongming Zhang, and Qixing Zhang. 2020. "The Ångström Exponent and Single-Scattering Albedo of Black Carbon: Effects of Different Coating Materials" Atmosphere 11, no. 10: 1103. https://doi.org/10.3390/atmos11101103
Note that from the first issue of 2016, this journal uses article numbers instead of page numbers. See further details here.