
Abstract
Understanding spontaneous imbibition helps to determine the fracturing fluid volume and optimize the flowback design. At present, many studies have mainly focused on shale, but few on igneous rocks. As such, in this study, imbibition experiments were conducted on igneous rocks. The effects of KCl concentration, confining pressure, and imbibition direction on the spontaneous imbibition were systematically investigated. This study then introduces a new imbibition capacity index. The results show that KCl concentration has certain inhibitory effects on igneous rock imbibition, which reduce the absorption of clay minerals to liquid. Different imbibition directions result in distinct imbibition volumes. The co-current imbibition process is similar to fluid leak-off, but this rule is not satisfied in countercurrent imbibition, the n of which is fitted as 0.1.0.3. Increasing the confining pressure will slightly decrease the imbibition capacity of igneous rock. Rock imbibition causes a decrease in the surface hardness and physical properties of igneous rock, and increasing the KCl concentration in the fluid will effectively hinder clay swelling.
Introduction
Unconventional reservoirs have become the focus of research seeking to explore and develop oil and gas (Zou et al. 2018). One of the key technologies for unconventional oil and gas development is the multistage fracturing of horizontal wells (Huang et al. 2019; Al-Fatlawi et al. 2019; Gao et al. 2018; Sobhaniaragh et al. 2016). In the multistage fracturing process, a large amount of liquid needs to be pumped into the formation, but field practice has shown that a large amount of liquid remains underground. This has attracted attention, and scholars have conducted much research on fracturing fluid retention, the focus of which is spontaneous imbibition. Spontaneous imbibition refers to the process of absorption with no pressure driving the phase into the rock.
Dehghanpour et al. (2012) studied the relationship between illite content, quartz content, and the amount of spontaneous imbibition. Both water absorption and oil absorption were positively correlated with illite content and negatively correlated with quartz content. At the same time, the effects of kerosene and low-concentration aqueous solutions on spontaneous imbibition were studied. The results showed that the ratio of water absorption to oil absorption was much greater than the water-to-oil capillary force ratio, indicating the existence of osmotic pressure as a driving force. Dehghanpour et al. (2013) studied the spontaneous imbibition capacity of deionized water, KCl solution, kerosene, and other liquids. The results show that spontaneous imbibition in deionized water is larger than that in KCl solution and much larger than that of kerosene. Furthermore, fractures induced by water intake are one of the reasons for the increase in permeability. Makhanov (2013) studied the anisotropy of spontaneous imbibition. The anisotropy index in the 2% KCl solution is approximately 0.3–0.7, and in the direction of parallel lamination it is 1.4–3.3. Ghanbari and Dehghanpour (2015) also studied the anisotropy of spontaneous imbibition and ion diffusion. The results showed that the imbibition volume in the parallel bedding direction was higher than that in the vertical bedding direction. Meng et al. (2015a, b) studied the co-current and countercurrent imbibition by the nuclear magnetic resonance (NMR) method. They found that the amount of co-current imbibition was greater than the countercurrent. Roshan et al. (2015) tested the characteristics of spontaneous imbibition and induced cracks at a confining pressure of 6.9 MPa. The results show that the confining pressure can reduce the generation of cracks. Deionized water still induces fractures and clay swells; there is no obvious change and slight contraction at 10% NaCl. Zolfaghari et al. (2016) investigated the effects of clay content and specific surface area on the spontaneous imbibition process. During the process of spontaneous imbibition, the conductivity of the solution increases. The increase in the conductivity is positively related to the clay content. Zhou et al. (2016a, b, c) studied the effects of capillary force and salinity on spontaneous imbibition. The results show that the capillary force is the control mechanism in sandstone and carbonate rock and that the osmotic diffusion effect in clay shale cannot be ignored. Meng et al. (2015b) compared the spontaneous imbibition of shale, sandstone, and volcanic rocks. The results show that micro-fractures are generated in shale, but there is no change in sandstone and volcanic rocks. Zhou et al. (2016b) studied the permeability of the matrix, natural fractures, and micro-fractures. The results show that the permeability of the matrix and natural fractures decreases during spontaneous imbibition. Minardi et al. (2018) quantified the impact of the swelling and shrinkage of gas shales during imbibition and desiccation processes. They found that swelling of the shale rock leads to more than 40% imbibed water volume.
In summary, the current experimental research is mainly focused on the influencing factors of spontaneous imbibition, including rock sample composition, liquid type, and anisotropy. The research mainly focuses on shale and sandstone, and there are few studies on igneous rocks. The influence of the confining pressure and the direction of imbibition on igneous rocks is not clear.
Therefore, in this study, imbibition experiments were conducted on core samples of igneous rock. The effects of KCl concentration, confining pressure, and imbibition direction on the spontaneous imbibition were systematically investigated. A new imbibition capacity index Ct is introduced to characterize the experimental data.
Materials and methods
To investigate the influence of rock imbibition on igneous rock during hydraulic fracturing, a series of rock imbibition experiments were conducted with downhole igneous core samples. The materials and experimental procedure are described in the following section.
Materials
A total of 12 rock samples used in the experiments were selected from the same layer of three different wells in an oilfield in China. The physical properties and mineralogical properties of the rock samples based on XRD analysis are shown in Tables 1 and 2. These igneous rock samples have similar characteristics of high clay content and ultra-low permeability. Clay stabilizers are commonly used in fracturing fluids to avoid clay swelling, and KCl solution is the commonly used clay stabilizer. Therefore, it was selected as the imbibing fluid in all the experiments.
Experimental design
To investigate the influence of the invasion of the fracturing fluid into the igneous matrix during hydraulic fracturing, a piece of spontaneous imbibition equipment was developed to investigate igneous rock imbibition behaviors:
Experimental equipment: Mettler high-precision balance (1/10,000); beaker; hook; fish wire; confining pressure pump that can provide 0–40 MPa confining pressure; core gripper; metering tube; sealing oil (Fig. 1).

Imbibition experiment equipment (a developed no-confining pressure imbibition equipment; b developed confining pressure imbibition equipment)
Experimental water: KCl brine with concentrations of 2%, 4%, 6%, 8%, and 10%.
Experimental core: 12 igneous rock samples mentioned in Sect. 2.1.
After this equipment had been assembled, comparative studies of igneous rock hardness and physical properties before and after imbibition were conducted.
-
1.
Imbibition experiments
A total of 12 rock samples with similar characteristics were selected for the imbibition experiment, and the experimental design is listed in Table 3. First, five different KCl concentration experiments with co-current imbibition under 0 MPa confining pressure were conducted to study the influence of KCl concentration on rock imbibition. Then, Nos. 6–8 were conducted to investigate the confining pressure on the imbibition. Finally, Experiments 9 and 10 were added to mimic the influence of the countercurrent flow effect on fracturing fluid invasion into the matrix.
-
2.
Damage experiments
A damage experiment was conducted to study the influence of imbibition on rock sample surface hardness, permeability, and porosity (Table 4).
Selecting adjacent cores, the hardness and area of the two cutting surfaces can be regarded as the same. Thus, the hardness of the rock sample before and after imbibition can be compared by conducting an imbibition experiment on one sample and no treatment on the other. Moreover, changes in the physical properties of the rock samples were studied by testing the porosity and permeability variation of experiments 3–5 before and after imbibition.
Experimental procedure
In the no-confining pressure experiment, rock imbibition was easily influenced by ambient conditions and setup accuracy. An accuracy of 0.0001 g was used to measure the mass change of the rock sample, and a temperature and humidity chamber was applied to reduce the influence of the indoor environment (Fig. 1a). In addition, a confining pressure imbibition equipment was developed to investigate rock imbibition under a certain confining pressure based on the volume method (Fig. 1b). The confining pressure of the rock sample is controlled by the confining pressure pump and gripper, and the imbibition volume can be determined by a metering tube (range 5 mL, accuracy 0.05 mL). The experimental procedure was as follows:
-
1.
The cores collected from the field were cut into standard pillar samples with a core length of ~ 5 cm and a core diameter of ~ 2.5 cm.
-
2.
After cleaning and drying, the hardness, permeability, and porosity of the samples were measured. Then, all samples were coated with impermeable epoxy, leaving only one end face open for 1-D imbibition.
-
3.
The wrapped samples were dried to a constant weight and suspended by fishing line. Cores of P3 were placed in the countercurrent direction (Fig. 2) in the beaker (Fig. 1a).
Fig. 2 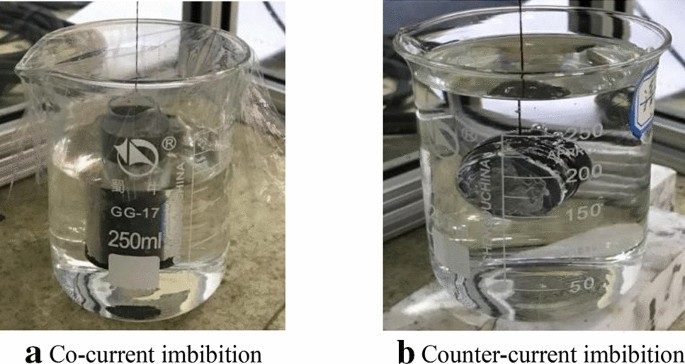
Different imbibition direction of rock samples. For co-current imbibition, epoxy was used to wrap the side of the sample so only the lower end face made contact with water, and the beaker was sealed to prevent evaporation. For countercurrent imbibition, epoxy was used to seal the side of the core and one end face, leaving only one end face in contact with experimental fluid
-
4.
The core of P1 was placed in a different KCl concentration solution in the co-current direction in the beaker.
-
5.
The core of P2 was placed in confining pressure imbibition equipment with different confining pressures.
-
6.
The variation in sample weight versus time was recorded as rock imbibition began.
-
7.
The physical and mechanical properties of the imbibition samples were tested.

Characterization method
Previous studies have shown that the characterization parameters of rock imbibition are related to various parameters including rock microstructure, fluid properties, mineralogy, sample shape, and imbibition area. The water imbibition (invasion) process can be regarded as the fracturing leak-off process in order to study the imbibition characteristics of igneous rock. Conveniently, the classic leak-off rate equation can be used to calculate the imbibition rate. Thus, a new imbibition capacity index Ct is introduced in this paper. This excludes the influence of these parameters mentioned above and only considers the contact area between the core sample and liquid. Therefore, for a standard core sample, the imbibition velocity can be expressed as
where n in Eq. (1) is the time index of fluid leak-off, with a value of 0.5 in the general leak-off formula (Guo and Liu 2014). Therefore, the imbibition volume can be calculated using Eq. (2):
Thus, the relationship between the imbibition volume and Ct can be expressed as
where u is the imbibition velocity (m/h), Vimb is the imbibition volume (m3), Ct is the imbibition capacity index, m/h0.5, and A is the core sample imbibition area (m2).
Results and discussion
Rock imbibition analysis
-
1.
KCl concentration
In this section, the classical leak-off equation (n = 0.5) is used to reveal the relationship between per unit imbibed areas and different KCl concentrations (Guo and Liu 2014). As Fig. 3 shows, the imbibition curves generally can be divided into three stages: an initial imbibition stage, a nonlinear transition stage, and a late imbibition stage (Yang et al. 2016). At first, the imbibed volume increases rapidly with time. Then, the rate of water intake decreases rapidly. In the last stage, the imbibed volume gain is notably small. In these experiments, the curve under 10% KCl has the characteristics of these three stages. Only Stage 1 was shown for the experimental results within a 6% KCl concentration.

Imbibed volume per unit imbibed area (Vimb/A) versus square time with different KCl concentrations
The imbibition volume has a good linear relation to the square root time, meaning that the co-current imbibition can be regarded as the process of common fluid leak-off. The imbibition volume of rock samples clearly increases with the increase in imbibition time, which may contribute to the strong capillary force in the low permeability matrix and absorption force of high-content clay that enhances the water imbibition rate. The curve displays similar behavior to the “A”-type imbibition curve in Yang et al.’s research results (2016) that is common in tight rocks with ultra-low permeability. Moreover, under similar conditions, increasing the KCl solution concentration will restrain the imbibition of igneous rock, and the growth rate decreases in the later imbibition period of high KCl concentration cases. When the KCl concentration increased from 2 to 10%, the imbibition volume decreased by 10.8 times, and the imbibition capacity index decreased by 5.5 times (Table 5). KCl brine prevents excessive water intake of igneous rocks. This is because in comparison with water, the KCl solution flow in the matrix has lower osmotic pressure and smaller capillary force, which does not easily cause the water locking effect. In addition, KCl solution can inhibit the swelling of clay minerals.
-
2.
Imbibition direction
As Fig. 4 illustrates, under the same conditions, the imbibition volume of the countercurrent imbibition is approximately 5.8 times lower than that of the co-current imbibition, and the imbibition time is also approximately half shorter. This is mainly due to the gas–fluid displacement in the countercurrent imbibition process. Unlike co-current imbibition, the direction of gas exhaust and liquid absorption are opposite for only one face of the rock sample in the countercurrent case. The curve shape shows a nonlinear relationship between the unit area imbibition volume and square root time. This is because when the core sample is in contact with another liquid with higher wettability, the inhaling of this second liquid will replace the original fluid in the rock sample, which can be seen as the bubble escaping from the end face of the sample shown in Fig. 5. Thus, the countercurrent imbibition process can be divided into three stages. In the early stage, a higher wettability fluid can easily invade the core sample with almost the same imbibition capacity index as that of the co-current case, and the original gas in the sample is extruded with the liquid invasion. At the transition stage, continuous imbibition increases the sample water saturation, which leads to a decrease in capillary force, and the imbibition rate gradually slows down. In the final stage, when the capillary force decreases to the critical point that the invading fluid cannot extrude the original gas, the imbibition of the rock sample stops. At 2% and 4% KCl concentrations, the countercurrent imbibition curve showed three stages. However, the co-current imbibition only shows the first stages, which also means that the imbibition ability under the co-current condition is higher than that under the countercurrent condition.

Imbibition curve with different imbibition directions and KCl concentrations

Gas–liquid displacement in countercurrent imbibition
Comparing the different KCl concentration cases, the inhibition effect of the KCl solution still works in the countercurrent imbibition process. Moreover, we conduct a series of linear fits to find an optimal n for countercurrent imbibition. The results show that n = 0.1–0.3 is more accurate (Table 6).
-
3.
Confining the pressure
This section mainly examines the influence of the confining pressure on the rock imbibition. As Fig. 6 depicts, all curves have a linear relation to the square root time, which agrees with the co-current imbibition curve feature, which indicates that increasing the confining pressure does not change the water absorption pattern. However, confining pressure impacts the imbibition volume; as confining pressure increases, the imbibition capacity of the core decreases. When the confining pressure is increased from 0 to 5 MPa, the unit area imbibition volume decreased 3.76 times. This was due to the squeezing effects of the confining pressure; increasing the confining pressure will squeeze the pore volume, which results in a decrease in the imbibition volume. However, it can also be found that the effect of the confining pressure on imbibition is limited. When the pressure increased from 5 to 10 MPa, the imbibition volume and capacity only decreased by 0.66 and 0.3 times, respectively. This is because a part of the pore volume can be maintained before the sample is destroyed, and the squeezed pore is much narrower with a higher capillary force.

Rock sample imbibition curves with different confining pressure (water, co-current imbibition)
Rock damage analysis
-
1.
Rock surface hardness
Hardness is defined as the property of a material that enables it to resist plastic deformation. Clay swelling reduces the rock strength. For igneous rock with high-content clay, imbibition has a great influence on the igneous rock surface hardness. As shown in Table 7, the rock surface hardness of sample #11 decreased by 44.4% after imbibition. The inhibition effect of KCl solution was also present; when the KCl concentration was increased to 4%, the rock strength increased by 5.5% compared with that of the 2% KCl case. As expected, the hardness decreases when the samples are soaked in solution. The more severe the clay swelling, the greater the decrease in surface hardness. The rock hardness of the samples was significantly affected by KCl solutions, which resulted in a significant loss of its initial value. The more the fracture softens, the worse the conductivity will be (Zhou et al. 2016a, b, c). It is recommended that a high KCl concentration is used to control this softening.
-
2.
Physical properties
The physical properties of igneous rock samples 3–5 before and after imbibition are shown in Table 8. Using No. 3 as an example, the porosity and permeability of the sample are decreased by 37.73% and 22.23%, respectively, after rock imbibition. This shows that rock imbibition significantly damages the physical properties of igneous rock, and swelling clay occupies the pore space due to imbibition. Increasing KCl concentration appears to reduce this damage; after imbibition, the porosity and permeability of Nos. 4 and 5 were reduced to 20.14% and 11.22%, and 15.30% and 8.89%, respectively. Although the reduced amplitude of physical properties in the high KCl concentration case is relatively small, for a tight igneous rock reservoir, the physical properties of the rock are significantly unfavorable for oil and gas migration.
Conclusions
In this study, the characteristics of igneous rock imbibition were studied and analyzed based on rock imbibition experiments. According to the developed imbibition capacity characterization method, the effects of KCl concentration, confining pressure, and imbibition direction on igneous rock imbibition were investigated. The key conclusions are as follows:
-
1.
KCl concentration has certain inhibitory effects on igneous rock imbibition, which reduces the absorption of clay minerals to the liquid.
-
2.
Different imbibition directions result in a distinct imbibition volume, and the imbibition capacity of co-current imbibition is higher than that of the countercurrent imbibition. The co-current imbibition process is similar to that of fluid leak-off, but this rule is not satisfied in countercurrent imbibition, the n of which is fitted as 0.1.0.3.
-
3.
Increasing the confining pressure squeezes the pore space of the rock sample and decreases the imbibition capacity of igneous rock, but the effect of space squeezing on imbibition is not obvious.
-
4.
Rock imbibition causes a decrease in the surface hardness and physical properties of igneous rock; increasing the KCl concentration in the fluid will effectively hinder clay swelling.
References
Al-Fatlawi O, Hossain M, Patel N, Kabir A (2019) Evaluation of the potentials for adapting the multistage hydraulic fracturing technology in tight carbonate reservoir. In: SPE middle east oil and gas show and conference. Society of Petroleum Engineers
Dehghanpour H, Zubair HA, Chhabra A, Ullah A (2012) Liquid intake of organic shales. Energy Fuels 26:5750–5758. https://doi.org/10.1021/ef3009794
Dehghanpour H, Lan Q, Saeed Y et al (2013) Spontaneous imbibition of brine and oil in gas shales: effect of water adsorption and resulting microfractures. Energy Fuels 27:3039–3049. https://doi.org/10.1021/ef4002814
Gao Q, Cheng Y, Yan C (2018) A 3D numerical model for investigation of hydraulic fracture configuration in multilayered tight sandstone gas reservoirs. J Pet Explor Prod Technol 8(4):1413–1424
Ghanbari E, Dehghanpour H (2015) Impact of rock fabric on water imbibition and salt diffusion in gas shales. Int J Coal Geol 138:55–67. https://doi.org/10.1016/j.coal.2014.11.003
Guo J, Liu Y (2014) Opening of natural fracture and its effect on leakoff behavior in fractured gas reservoirs. J Nat Gas Sci Eng 18:324–328. https://doi.org/10.1016/j.jngse.2014.03.013
Huang S, Yao Y, Ma R, Wang J (2019) Analytical model for pressure and rate analysis of multi-fractured horizontal wells in tight gas reservoirs. J Pet Explor Prod Technol 9(1):383–396
Makhanov KK (2013) An experimental study of spontaneous imbibition in horn river shales. University of Alberta, Edmonton
Meng M, Ge H, Ji W et al (2015a) Monitor the process of shale spontaneous imbibition in co-current and counter-current displacing gas by using low field nuclear magnetic resonance method. J Nat Gas Sci Eng 27 Part 1:336–345. https://doi.org/10.1016/j.jngse.2015.08.069
Meng M, Ge H, Ji W et al (2015b) Investigation on the variation of shale permeability with spontaneous imbibition time: sandstones and volcanic rocks as comparative study. J Nat Gas Sci Eng 27 Part 3:1546–1554. https://doi.org/10.1016/j.jngse.2015.10.019
Minardi A, Ferrari A, Ewy R, Laloui L (2018) The impact of the volumetric swelling behavior on the water uptake of gas shale. J Nat Gas Sci Eng 49:132–144. https://doi.org/10.1016/j.jngse.2017.11.001
Roshan H, Ehsani S, Marjo CE et al (2015) Mechanisms of water adsorption into partially saturated fractured shales: an experimental study. Fuel 159:628–637. https://doi.org/10.1016/j.fuel.2015.07.015
Sobhaniaragh B, Mansur WJ, Peters FC (2016) Three-dimensional investigation of multiple stage hydraulic fracturing in unconventional reservoirs. J Pet Sci Eng 146:1063–1078
Yang L, Ge H, Shi X et al (2016) The effect of microstructure and rock mineralogy on water imbibition characteristics in tight reservoirs. J Nat Gas Sci Eng 34:1461–1471. https://doi.org/10.1016/j.jngse.2016.01.002
Zhou T, Zhang S, Yang L et al (2016a) Experimental investigation on fracture surface strength softening induced by fracturing fluid imbibition and its impacts on flow conductivity in shale reservoirs. J Nat Gas Sci Eng 36:893–905. https://doi.org/10.1016/j.jngse.2016.10.036
Zhou Z, Abass H, Li X et al (2016b) Mechanisms of imbibition during hydraulic fracturing in shale formations. J Pet Sci Eng 141:125–132. https://doi.org/10.1016/j.petrol.2016.01.021
Zhou Z, Abass H, Li X, Teklu T (2016c) Experimental investigation of the effect of imbibition on shale permeability during hydraulic fracturing. J Nat Gas Sci Eng 29:413–430. https://doi.org/10.1016/j.jngse.2016.01.023
Zolfaghari A, Dehghanpour H, Noel M, Bearinger D (2016) Laboratory and field analysis of flowback water from gas shales. J Unconv Oil Gas Resour 14:113–127. https://doi.org/10.1016/j.juogr.2016.03.004
Zou C, Yang Z, He D et al (2018) Theory, technology and prospects of conventional and unconventional natural gas. Pet Explor Dev 45(4):604–618
Author information
Authors and Affiliations
Corresponding author
Ethics declarations
Conflict of interest
The authors declare that there is no conflict of interest.
Additional information
Publisher's Note
Springer Nature remains neutral with regard to jurisdictional claims in published maps and institutional affiliations.
Rights and permissions
Open Access This article is licensed under a Creative Commons Attribution 4.0 International License, which permits use, sharing, adaptation, distribution and reproduction in any medium or format, as long as you give appropriate credit to the original author(s) and the source, provide a link to the Creative Commons licence, and indicate if changes were made. The images or other third party material in this article are included in the article's Creative Commons licence, unless indicated otherwise in a credit line to the material. If material is not included in the article's Creative Commons licence and your intended use is not permitted by statutory regulation or exceeds the permitted use, you will need to obtain permission directly from the copyright holder. To view a copy of this licence, visit http://creativecommons.org/licenses/by/4.0/.
About this article

Cite this article
Zhou, C., Li, L., Zeng, R. et al. Spontaneous imbibition in igneous rocks: effect of KCl concentration, confining pressure, and imbibition direction. J Petrol Explor Prod Technol 10, 3227–3234 (2020). https://doi.org/10.1007/s13202-020-00997-z
Received:
Accepted:
Published:
Issue Date:
DOI: https://doi.org/10.1007/s13202-020-00997-z